the recession’s impact on the economy, employment and older workers
DESCRIPTION
The Recession’s Impact on the Economy, Employment and Older Workers. April 20, 2010 Employment Security Commission of North Carolina Lynn R. Holmes, Chairman. Employment and Workforce Related Services to North Carolina’s Citizens and Employers Labor Market Information - PowerPoint PPT PresentationTRANSCRIPT

The Recession’s Impact on the The Recession’s Impact on the Economy, Employment and Economy, Employment and
Older WorkersOlder Workers
April 20, 2010April 20, 2010
Employment Security Commission Employment Security Commission of North Carolinaof North Carolina
Lynn R. Holmes, ChairmanLynn R. Holmes, Chairman

2
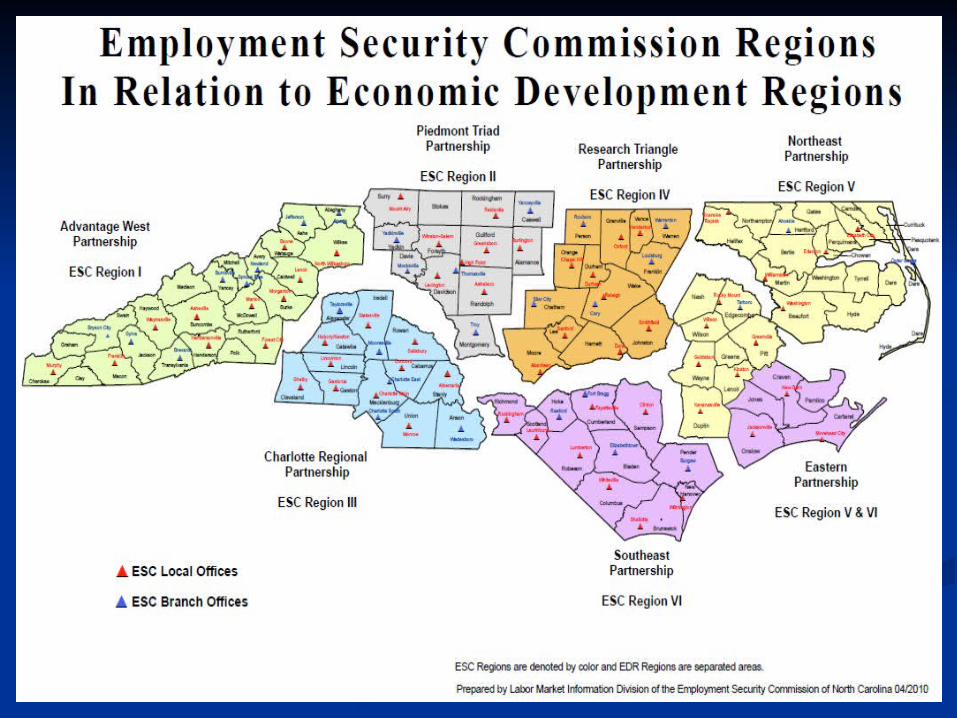
ESC ServicesESC Services Employment and Workforce Related
Services to North Carolina’s Citizens and Employers Labor Market Information Unemployment Insurance Employment Services
Job Referral and Placement Assistance Re-employment Services Career Counseling Resume Preparation Assistance Assessment and Testing Referral to Training Services Referral to Supportive Services Trade Adjustment Assistance (TAA and ATAA)

3
ESC ServicesESC Services Employers Dislocated Workers Veterans Agricultural Workers Older Workers Disabled Workers Youth Ex-Offenders
4

5
Impact of the Economic Impact of the Economic Conditions on Employment Conditions on Employment
Security CommissionSecurity Commission As the state experienced economic recession,
citizens turned to the Employment Security Commission for assistance. Increased numbers of customers to ESC Local
Offices Increased Claims for Unemployment Insurance
Benefits Regular Claims peaked at 158,659 in Jan 2009
Pressures on the Unemployment Insurance System Increased number of TAA Petitions
Between Dec 2007 and April 2010, 391 Petitions were certified which covered an estimated 32,044 workers

6
Employment Services Employment Services Registered ApplicantsRegistered Applicants
803,004843,477
995,235940,446
0
100,000
200,000
300,000
400,000
500,000
600,000
700,000
800,000
900,000
1,000,000
J uly 2006-J une 2007 J uly 2007-J une 2008 J uly 2008-J une 2009 J uly 2009-March 2010

7
North North CarolinaCarolinaCalendar Calendar Year 2009Year 2009
Totally Totally Separated and Separated and
Attached Attached Initial Initial
ClaimantsClaimants Total Initial Claimants = 670,885 Total Initial Claimants = 670,885
Age Group ClaimantsPercent of
Total
16-19 11,890 1.8%
20-24 70,460 10.5%
25-34 159,825 23.8%
35-44 167,394 25.0%
45-54 156,876 23.4%
55-64 87,189 13.0%
65 and Over 17,077 2.5%
8
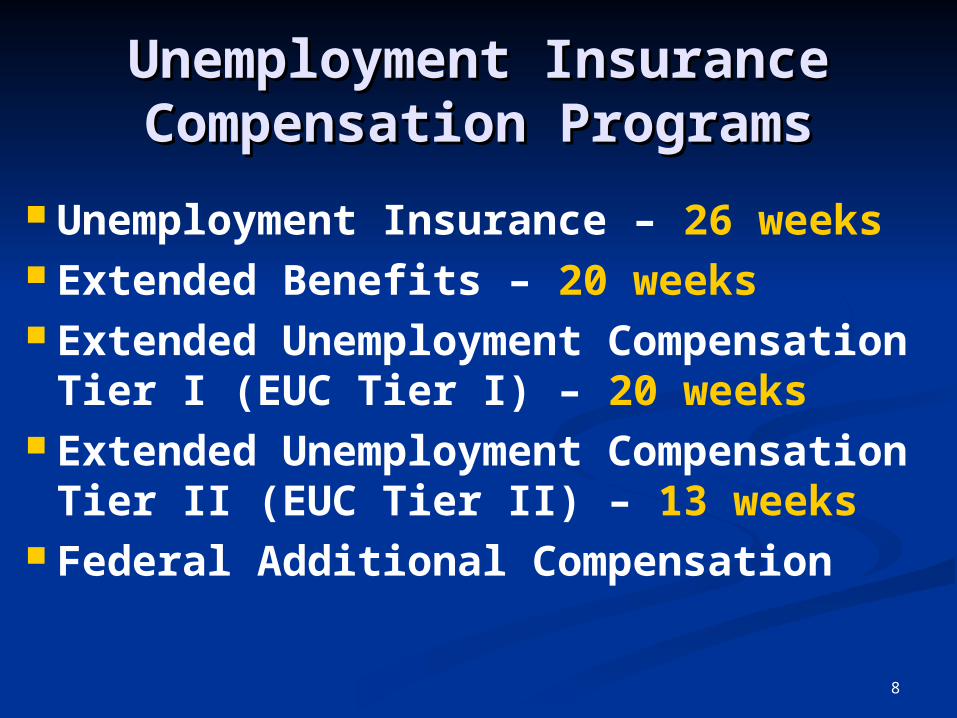
Unemployment Insurance Unemployment Insurance Compensation ProgramsCompensation Programs
Unemployment Insurance – 26 weeks Extended Benefits – 20 weeks Extended Unemployment
Compensation Tier I (EUC Tier I) – 20 weeks
Extended Unemployment Compensation Tier II (EUC Tier II) – 13 weeks
Federal Additional Compensation

9
Newest ExtensionNewest Extension Added 1 additional week to EUC Tier II Extended Unemployment
Compensation Tier III (EUC Tier III) – 13 weeks
Extended Unemployment Compensation Tier IV (EUC Tier IV) – 6 weeks
Individuals may be eligible for up to 99 weeks of UI benefits

10

11

12
13
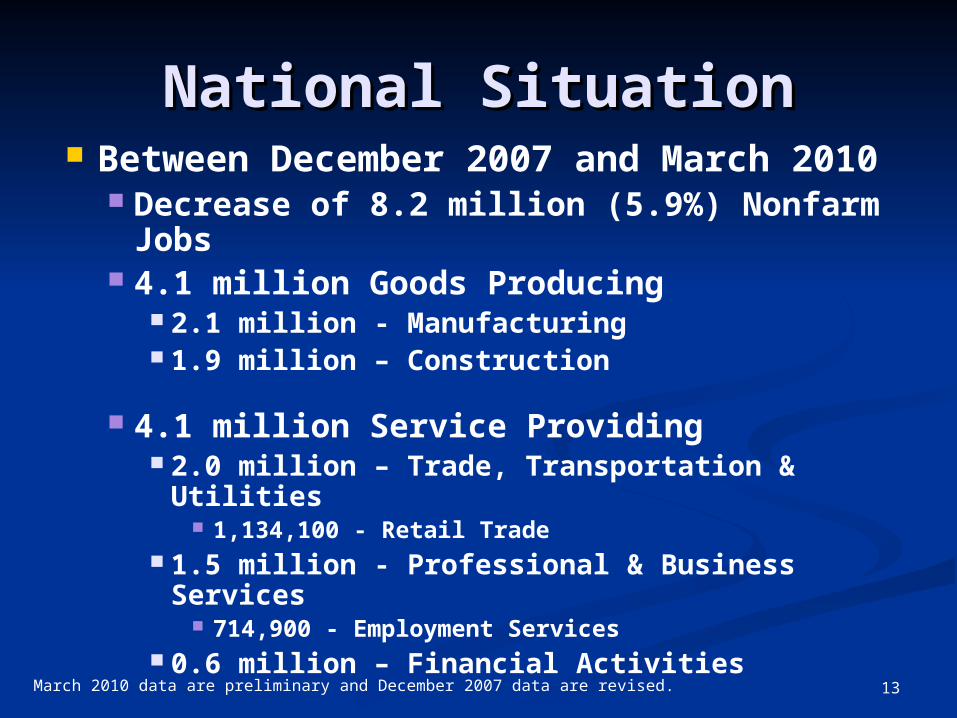
National SituationNational Situation Between December 2007 and March
2010 Decrease of 8.2 million (5.9%) Nonfarm
Jobs 4.1 million Goods Producing
2.1 million - Manufacturing 1.9 million – Construction
4.1 million Service Providing 2.0 million – Trade, Transportation & Utilities
1,134,100 - Retail Trade 1.5 million - Professional & Business Services
714,900 - Employment Services 0.6 million – Financial Activities
March 2010 data are preliminary and December 2007 data are revised.

14
U.S. Nonfarm Employment January 2007-March 2010
(Seasonally Adjusted, in thousands)
120,000
122,500
125,000
127,500
130,000
132,500
135,000
137,500
140,000
Jan-07
Feb-07
Mar-07
Apr-07
May
-07
Jun-07
Jul-07
Aug
-07
Sep-07
Oct-07
Nov
-07
Dec-07
Jan-08
Feb-08
Mar-08
Apr-08
May
-08
Jun-08
Jul-08
Aug
-08
Sep-08
Oct-08
Nov
-08
Dec-08
Jan-09
Feb-09
Mar-09
Apr-09
May
-09
Jun-09
Jul-09
Aug
-09
Sep-09
Oct-09
Nov
-09
Dec-09
Jan-10
Feb-10
Mar-10
National EmploymentNational Employment
National recession beganDecember 2007
137,951
129,750
March 2010 data are preliminary, all other data are revised.

15
National EmploymentNational Employment((Seasonally Adjusted, in thousands)Seasonally Adjusted, in thousands)
128,000
128,500
129,000
129,500
130,000
130,500
131,000
131,500
132,000
132,500
Mar-09 Apr-09 May-09 Jun-09 Jul-09 Aug-09 Sep-09 Oct-09 Nov-09 Dec-09 Jan-10 Feb-10 Mar-10
129,750
132,070
March 2010 data are preliminary, while all other data are revised.

16
US Labor ForceUS Labor Force
United States Labor ForceDecember 2007–March 2010
(Seasonally Adjusted)
December2007R
March2010P
NetChange
PercentChange
Labor Force 153,869,000 153,910,000 41,000 0.0%
Employed 146,173,000 138,905,000 -7,268,000 -5.0%
Unemployed 7,696,000 15,005,000 7,309,000 95.0%
Unemployment Rate 5.0 9.7 4.7 XXX
P: Preliminary; R: Revised

17
National SituationNational Situation
As of March 2010 7.3 million more individuals
unemployed in the United States than in December 2007
Lost 8.2 million jobs Need to add 136,669 net jobs a month for
the next 60 months to reach December 2007 employment levels

18
North Carolina SituationNorth Carolina Situation Between December 2007 and March
2010 Decrease of 277,700 (6.7%) Total Nonfarm
jobs 179,500 Goods Producing
101,500 - Manufacturing 77,300 - Construction
98,200 Service Providing 66,900 - Trade, Transportation & Utilities 42,900 - Professional & Business Services 13,500 - Financial Activities 8,500 – Leisure & Hospitality

19
Nonfarm Employment January 2007-March 2010
(Seasonally Adjusted, in thousands)
3,500
3,600
3,700
3,800
3,900
4,000
4,100
4,200
4,300
Jan-07
Feb
-07
Mar
-07
Apr
-07
May
-07
Jun-07
Jul-07
Aug
-07
Sep-07
Oct-07
Nov
-07
Dec-07
Jan-08
Feb
-08
Mar
-08
Apr
-08
May
-08
Jun-08
Jul-08
Aug
-08
Sep-08
Oct-08
Nov
-08
Dec-08
Jan-09
Feb
-09
Mar
-09
Apr
-09
May
-09
Jun-09
Jul-09
Aug
-09
Sep-09
Oct-09
Nov
-09
Dec-09
Jan-10
Feb
-10
Mar
-10
North Carolina Employment
National recession beganDecember 2007
3,891,800
4,169,500
March 2010 data are preliminary, other 2010 data are revised, while all other data are benchmarked.

20

21

22
North Carolina Industry EmploymentDecember 2007–March 2010
(Seasonally Adjusted, in thousands)
IndustryDecember
2007B
March 2010P
Net Change
Percent Change
Total Nonfarm 4,169.5 3,891.8 -277.7 -6.7%
Goods Producing 791.0 611.5 -179.5 -22.7%
Service Providing 3,378.5 3,280.3 -98.2 -2.9%
Mining & Logging 6.9 6.2 -0.7 -10.1%
Construction 251.7 174.4 -77.3 -30.7%
Manufacturing 532.4 430.9 -101.5 -19.1%
Durable Goods 286.4 220.4 -66.0 -23.0%
Nondurable Goods 246.0 210.5 -35.5 -14.4%
B: Benchmarked; P: Preliminary

23
IndustryDecember
2007B
March 2010P
Net Change
Percent Change
Trade, Transportation & Utilities 780.1 713.2 -66.9 -8.6%
Wholesale Trade 182.6 164.3 -18.3 -10.0%
Retail Trade 469.4 435.5 -33.9 -7.2%
Transportation, Warehousing & Utilities 128.1 113.4 -14.7 -11.5%
Information 72.2 69.1 -3.1 -4.3%
Financial Activities 212.2 198.7 -13.5 -6.4%
Finance & Insurance 157.8 148.1 -9.7 -6.1%
Real Estate & Rental Leasing 54.4 50.6 -3.8 -7.0%
Professional & Business Services 506.6 463.7 -42.9 -8.5%
Professional, Scientific & Technical 187.6 170.4 -17.2 -9.2%
Management of Companies 75.1 72.8 -2.3 -3.1%
Administrative & Waste Management 243.9 220.5 -23.4 -9.6%
Education & Health Services 532.8 548.1 15.3 2.9%
Educational Services 77.1 83.1 6.0 7.8%
Health Care & Social Services 455.7 465.0 9.3 2.0%
Leisure and Hospitality Services 405.1 396.6 -8.5 -2.1%
Arts, Entertainment & Recreation 58.6 55.2 -3.4 -5.8%
Accommodation & Food Services 346.5 341.4 -5.1 -1.5%
Other Services 175.5 162.2 -13.3 -7.6%
Government 694.0 728.7 34.7 5.0%
Federal 63.8 68.9 5.1 8.0%
State 196.9 201.8 4.9 2.5%
Local 433.3 458.0 24.7 5.7%
B: Benchmarked; P: Preliminary

24
North Carolina Labor North Carolina Labor ForceForce
North Carolina Labor ForceDecember 2007–March 2010
(Seasonally Adjusted)
December2007B
March2010P
NetChange
PercentChange
Labor Force 4,551,900 4,564,367 12,467 -0.3%
Employed 4,328,398 4,056,681 -271,717 -6.3%
Unemployed 223,502 507,686 284,184 127.2%
Unemployment Rate 4.9 11.1 6.2 XXX
B: Benchmarked; P: Preliminary

25
North Carolina SituationNorth Carolina Situation
As of March 2010 284,184 more individuals unemployed
in North Carolina than in December 2007
Lost 277,700 jobs Need to add 4,628 net jobs a month for
the next 60 months to reach December 2007 employment levels

26

27
United States/North Carolina United States/North Carolina Unemployment RatesUnemployment Rates
January 2009-March 2010January 2009-March 2010(Seasonally Adjusted)(Seasonally Adjusted)
10.3 10
.7
10.9
11.0
11.0
10.9
10.9
10.9
10.9
10.9
11.1
11.2
11.1
9.7
9.7
9.710
.0
10.0
10.1
9.8
9.7
9.4
9.5
9.4
8.9
8.6
4.0
5.0
6.0
7.0
8.0
9.0
10.0
11.0
12.0
Mar.2009
Apr.2009
May2009
Jun.2009
Jul.2009
Aug.2009
Sep.2009
Oct.2009
Nov.2009
Dec.2009
Jan.2010
Feb.2010
Mar.2010
NC and US March 2010 data are preliminary, other 2010 NC data and all other US data are revised, while 2009 NC data are benchmarked.
North Carolina United States

28
States With the Highest States With the Highest Unemployment Rates, March 2010Unemployment Rates, March 2010
(Seasonally Adjusted, in thousands)(Seasonally Adjusted, in thousands)
Labor Force Unemployed Unemployment Rate
Michigan 4,850.7 682.5 14.1
Nevada 1,375.0 183.9 13.4
California 18,245.8 2,307.5 12.6
Rhode Island 578.4 72.6 12.6
Florida 9,269.4 1,137.7 12.3
South Carolina 2,173.3 264.5 12.2
District of Columbia 337.2 39.0 11.6
Illinois 6,66.3 765.0 11.5
Mississippi 1,302.1 150.3 11.5
North Carolina 4564.4 507.7 11.1
Alabama 2,066.0 227.3 11.0
Ohio 5,947.6 655.4 11.0
Kentucky 2,082.4 223.7 10.7
United States 153,512.0 15,005.0 9.7
All Data are preliminary.

29

Demographics of Demographics of North Carolina’s North Carolina’s Older WorkersOlder Workers

31
North Carolina Population
(500,000)(400,000)(300,000)(200,000)(100,000) 0 100,000 200,000 300,000 400,000 500,000
0 - 45 - 9
10 - 1415 - 1920 - 2425 - 2930 - 3435 - 3940 - 4445 - 4950 - 5455 - 5960 - 6465 - 6970 - 7475 - 7980 - 84
85+
2009
Male Female
Baby Boomers
(500,000)(400,000)(300,000)(200,000)(100,000) 0 100,000 200,000 300,000 400,000 500,000
0 - 45 - 9
10 - 1415 - 1920 - 2425 - 2930 - 3435 - 3940 - 4445 - 4950 - 5455 - 5960 - 6465 - 6970 - 7475 - 7980 - 84
85+
2029
Male Female
Baby Boomers
Source: U.S.Census Bureau, Population Division, Interim State Population Projections, 2005

32
Characteristics of North Characteristics of North Carolina’s Older Labor ForceCarolina’s Older Labor Force
From 2000 to 2009, the Civilian Labor Force increased by 623,000 (15.7%) 257,000 (41%) occurred in the 55 to 64 age group 59,000 (9.4%) occurred in the Over 64 age group
The overall Labor Force Participation (LFP) Rate decreased 3.9 percentage points from 68.1% in 2000 to 64.2% in 2009 LFP for the 55 to 64 group increased 3.9
percentage points from 59.0% to 62.9% LFP for the 64 and Over group increased 1.5
percentage points from 13.9% to 15.4%
Source: Geographic Profiles, BLS 2009 data are preliminary

33
Characteristics of the Older Characteristics of the Older Labor ForceLabor ForceContinuedContinued
In 2009, there were 334,000 more workers unemployed than in 2000 40,000 more worker Age 55 and Over unemployed
than in 2000 The overall Unemployment Rate increased 6.8
percentage points from 3.6% in 2000 to 10.4% in 2009 Unemployment Rate for the 55 to 64 group
increased 4.0 percentage points from 1.6% to 5.6% Unemployment Rate for the 64 and Over group
increased 4.0 percentage points from 3.6% to 7.6%
Source: Geographic Profiles, BLS 2009 data are preliminary

34
Characteristics of the Older Characteristics of the Older Labor ForceLabor ForceContinuedContinued
In 2009, North Carolina had a 15.4 percent In 2009, North Carolina had a 15.4 percent civilian labor force participation rate for those civilian labor force participation rate for those older than 64older than 64 North Carolina has one of the lowest participation North Carolina has one of the lowest participation
rates, ranked 43rates, ranked 43rdrd out of 51 out of 51 Alaska had the highest at 69.3 percentAlaska had the highest at 69.3 percent West Virginia was the lowest at 12.4 percentWest Virginia was the lowest at 12.4 percent
The national average was 17.2 percentThe national average was 17.2 percent During the same period, the national During the same period, the national
unemployment rate for this group was 6.4 unemployment rate for this group was 6.4 percentpercent North Carolina’s average unemployment rate was 7.6 North Carolina’s average unemployment rate was 7.6
percent, the 12percent, the 12thth highest in the nation highest in the nation Florida had the highest at 11.0 percentFlorida had the highest at 11.0 percent South Dakota was estimated to have the lowest at 2.0 South Dakota was estimated to have the lowest at 2.0
percentpercent
Source: Geographic Profiles, BLS 2009 data are preliminary

35

36

37
Percent Civilian Non-institutional Percent Civilian Non-institutional Population Population
by Age Group by Age Group 2009 Annual Average 2009 Annual Average
0%
2%
4%
6%
8%
10%
12%
14%
16%
18%
20%
16 to 19 20 to 24 25 to 34 35 to 44 46 to 54 55 to 64 Over 64
North Carolina United States
Preliminary
38
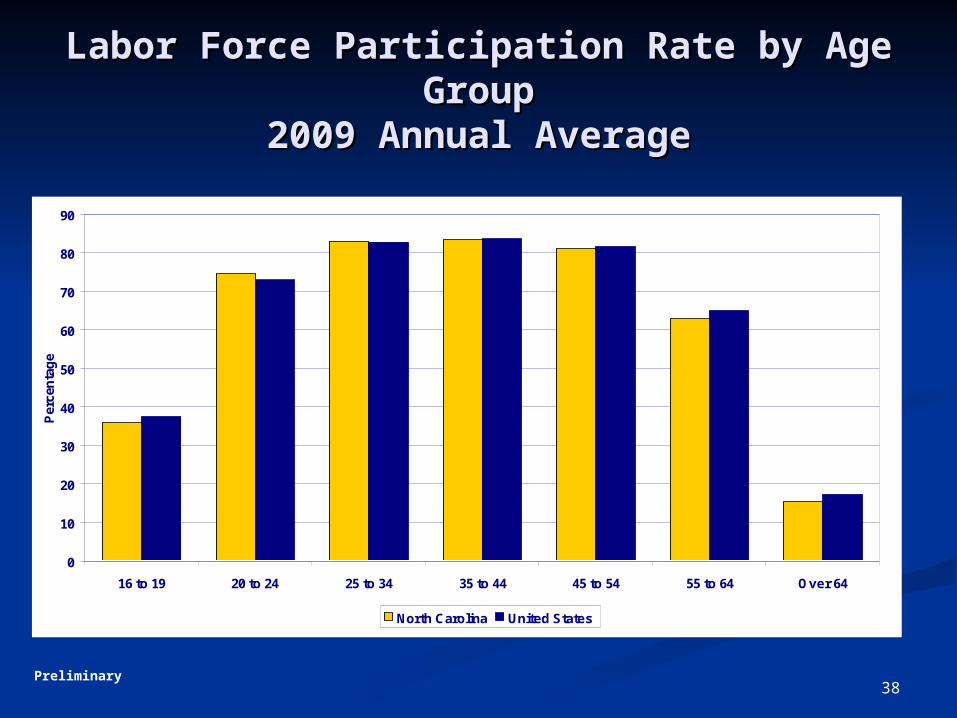
Labor Force Participation Rate by Age Labor Force Participation Rate by Age GroupGroup
2009 Annual Average2009 Annual Average
0
10
20
30
40
50
60
70
80
90
16 to 19 20 to 24 25 to 34 35 to 44 45 to 54 55 to 64 Over 64
Per
cen
tag
e
North Carolina United States
Preliminary

39
Unemployment Rate by Age Group Unemployment Rate by Age Group 2009 Annual Average2009 Annual Average
0
5
10
15
20
25
30
16 to 19 20 to 24 25 to 34 35 to 44 45 to 54 55 to 64 Over 64
Pe
rce
nta
ge
North Carolina United States
Preliminary

40
North Carolina Civilian Labor North Carolina Civilian Labor Force Force
2007-2009 Annual Averages2007-2009 Annual Averages(in thousands)(in thousands)
0
200
400
600
800
1,000
1,200
16 to 19 20 to 24 25 to 34 35 to 44 46 to 54 55 to 64 Over 64
2007 2008 2009
Source: Geographic Profiles, BLS

41
North Carolina Labor Force North Carolina Labor Force Participation Rate Participation Rate
2007-2009 Annual Averages 2007-2009 Annual Averages
0
10
20
30
40
50
60
70
80
90
16 to 19 20 to 24 25 to 34 35 to 44 45 to 54 55 to 64 Over 64
Pe
rce
nt
2007 2008 2009
Source: Geographic Profiles, BLS

42
North Carolina Unemployment Rate by North Carolina Unemployment Rate by Age Age
2007-2009 Annual Averages2007-2009 Annual Averages
0
5
10
15
20
25
30
16 to 19 20 to 24 25 to 34 35 to 44 45 to 54 55 to 64 Over 64
Per
cen
t
2007 2008 2009
Source: Geographic Profiles, BLS

43
December 2007
March 2010
Net Change
Percent Change
Both Sexes All Races
Age 16+ 4,493.8 4,596.4 102.6 2.3%
Age 16-19 193.8 188.1 -5.8 -3.0%
Age 20+ 4,299.9 4,408.3 108.4 2.5%Male, All Races
Age 16-19 105.5 108.8 3.3 3.1%
Age 20-24 224.2 237.9 13.7 6.1%
Age 25-34 516.8 512.5 -4.3 -0.8%
Age 35-44 577.1 554.4 -22.7 -3.9%
Age 45-54 515.8 541.5 25.6 5.0%
Age 55-64 327.2 366.3 39.1 11.9%Over 64 94.4 107.5 13.1 13.9%
Female, All Races
Age 16-19 88.3 79.3 -9.0 -10.2%
Age 20-24 201.0 198.3 -2.7 -1.3%
Age 25-34 477.3 475.5 -1.7 -0.4%
Age 35-44 502.0 513.3 11.4 2.3%
Age 45-54 469.4 502.9 33.5 7.1%
Age 55-64 323.4 322.7 -0.7 -0.2%Over 64 71.3 75.4 4.1 5.7%
North Carolina Civilian Labor Force12-MONTH MOVING AVERAGES (in thousands)

44
December 2007
March 2010
Net Change
Both Sexes All Races
Age 16+ 65.4 64.2 -1.3Age 16-19 40.2 35.3 -4.8Age 20+ 67.3 66.5 -0.9
Male, All Races Age 16-19 40.6 39.0 -1.7Age 20-24 80.8 78.9 -1.9Age 25-34 91.9 91.3 -0.6Age 35-44 92.3 90.2 -2.1Age 45-54 87.1 88.4 1.3Age 55-64 66.5 69.8 3.3Over 64 20.4 20.8 0.4
Female, All Races Age 16-19 39.6 31.3 -8.3Age 20-24 67.6 70.4 2.8Age 25-34 76.6 75.6 -1.0Age 35-44 77.7 76.8 -0.9Age 45-54 73.9 74.5 0.6Age 55-64 57.3 57.7 0.4Over 64 11.7 11.0 -0.7
North Carolina Labor Force Participation Rate12-MONTH MOVING AVERAGES (in thousands)

45
December 2007
March 2010Net
Change Percent Change
Both Sexes All Races
Age 16+ 4,290.3 4,116.2 -174.0 -4.1%
Age 16-19 165.3 136.2 -29.2 -17.6%Age 20+ 4,125.0 3,980.1 -144.9 -3.5%
Male, All Races Age 16-19 89.6 75.8 -13.8 -15.4%Age 20-24 205.9 186.2 -19.7 -9.6%Age 25-34 494.2 445.9 -48.3 -9.8%Age 35-44 559.2 496.5 -62.7 -11.2%Age 45-54 500.5 492.1 -8.4 -1.7%Age 55-64 318.6 337.0 18.4 5.8%Over 64 93.4 96.3 2.9 3.1%
Female, All Races Age 16-19 75.8 60.4 -15.4 -20.3%Age 20-24 184.2 167.4 -16.8 -9.1%Age 25-34 452.7 434.4 -18.3 -4.0%Age 35-44 483.2 474.4 -8.8 -1.8%Age 45-54 453.9 469.9 16.0 3.5%
Age 55-64 310.5 311.2 0.8 0.2%Over 64 68.6 68.8 0.1 0.2%
North Carolina Employed 12-MONTH MOVING AVERAGES (in thousands)

46
December 2007
March 2010
Net Change Percent Change
Both Sexes All Races
Age 16+ 203.5 480.1 276.7 136.0%Age 16-19 28.5 52.0 23.4 82.2%Age 20+ 175.0 428.2 253.2 144.7%
Male, All Races
Age 16-19 15.9 33.0 17.1 107.2%Age 20-24 18.3 51.8 33.4 182.5%Age 25-34 22.6 66.6 44.0 194.5%Age 35-44 18.0 58.0 40.0 222.9%Age 45-54 15.3 49.4 34.1 222.8%Age 55-64 9.4 29.3 19.9 211.5%Over 64 5.9 11.2 5.3 90.5%
Female, All Races
Age 16-19 12.6 20.6 8.1 64.3%Age 20-24 16.8 31.0 14.2 84.4%Age 25-34 24.5 41.1 16.6 67.5%Age 35-44 18.8 38.9 20.1 107.3%Age 45-54 15.5 33.0 17.5 113.1%Age 55-64 12.9 12.5 -0.4 -3.1%Over 64 4.1 8.8 4.8 118.1%
North Carolina Unemployed12-MONTH MOVING AVERAGES (in thousands)

47
December 2007
March 2010
Net Change
Both Sexes All Races
Age 16+ 4.5 10.4 5.9Age 16-19 14.7 27.6 12.9Age 20+ 4.1 9.7 5.6
Male, All Races Age 16-19 15.1 30.3 15.2Age 20-24 8.2 21.8 13.6Age 25-34 4.4 13.0 8.6Age 35-44 3.1 10.5 7.3Age 45-54 3.0 9.1 6.2Age 55-64 2.9 8.0 5.1Over 64 6.2 10.5 4.2
Female, All Races Age 16-19 14.2 26.0 11.8Age 20-24 8.4 15.6 7.3Age 25-34 5.1 8.6 3.5Age 35-44 3.7 7.6 3.8Age 45-54 3.3 6.6 3.3Age 55-64 4.0 3.9 -0.1Over 64 5.7 11.7 6.0
North Carolina Unemployment Rate12-MONTH MOVING AVERAGES (in thousands)

48
How ESC Assists Older How ESC Assists Older WorkersWorkers
Older Worker Specialists in many of the ESC’s 92 Local Offices
Highlights to Employers benefit of employing older workers Wealth of work experience Possess a broad range of job skills Loyal, dedicated, dependable, & committed to
quality are often traits of older workers Federal tax credits to employers that hire
older workers

49
Assessment of the State’s Assessment of the State’s Readiness for its Aging Readiness for its Aging
PopulationPopulation Cabinet agencies, including ESC, have been
tasked to assess their readiness to serve North Carolina’s aging population.
This will include a review of: Existing and proposed policies focused toward
older adults Documents and initiatives which examine effects
of the aging population on policy and programs Older adults participation in shaping of
programs and policies Private and local government participation in
shaping of programs and policies

50
Lynn R. HolmesLynn R. Holmes
919.733.7546919.733.7546
P.O. Box 25903P.O. Box 25903
Raleigh, NC 27611-5903Raleigh, NC 27611-5903