the reaction of active nitrogen with …digitool.library.mcgill.ca/thesisfile73680.pdfarrhenius plot...
TRANSCRIPT

THE REACTION OF ACTIVE NITROGEN WITH OXYGEN

t!HE REACTION OF ACTIVE NITROGEN WITH OXYGEN-1
by
Athanasios S. V1astaras
B.Sc. (Athens)
A Thesis submitted to the Faculty of Graduate Studies and Research of McGi11 University
in partial fu1fi1ment of the requirements for the degree of Doctor of Phi1osophy
From the Physica1 Chemistry Laboratory under the supervision of Professor C.A. Wink1er
Department of Chemistry, McGi11 University, Montreal, Canada.
@) Athanasios S. VIas taras
November, 1966.
1967

TD MY PARENTS

ACKNOWLEDGEMENTS
The author wishes to express his appreciation
to
the National Research Council of Canada for financia1
assistance in the form of a Studentship during
the academic year 1965-66;
to
the Department of Chemistry, McGil1 Uniyersity,
for Demonstratorships he1d during the
academic years 1963-64, 1964-65, 1965-66.

( \ TABLE OF CONTENTS
Acknow1edgements
List of Figures
List of Tables
Page
i
iv
v
INTRODUCTION 1
ACTIVE NITROGEN 1
THEORIES OF THE 'LEWIS-RAYLEIGH' AFTERGLOW 6
REACTIVE SPECIES IN ACTIVE NITROGEN 13
DETERMINATION OF NITROGEN ATOM CONCENTRATION 18
CHEMICAL REACTIONS OF ACTIVE NITROGEN 24
REACTIONS WITH ORGANIC COMPOUNDS 25
Other unsaturated hydrocarbons 27
Alkanes 27
Cyc10paraffins 27
Other organic compounds 27
REACTIONS WITH ELEMENTS AND INORGANIC COMPOUNDS 30
Meta1s 30
The Nitrogen fami1y 30
Hydrogen, Halogens and Hydrogen halides 32
Th e Oxygen fami 1y 33
ADDITIVES IN ACTIVE NITROGEN 36
THE PRESENT PROBLEM 38
- ii -

EXPERIMENTAL 40
MATERIALS 40
APPARATUS 41
THE MICROWAVE DISCHARGE 46
MEASUREMENT OF FLOW RATES 47
(a) Nitrogen 47
(b) Oxygen, Ethylene, Nitric oxide 47
(c) Nitrogen dioxide 48
EXPERIMENTAL PROCEDURE 48
MEASUREMENT OF N- AND O-ATOM CONCENTRATIONS 51
RESULTS 56
THE REACTION WITH OXYGEN 56
Comparison of N- and O-atom concentrations,
estimated by different methods 56
RATE CONSTANTS FOR THE N + O2 REACTION 58
THE EFFECT OF ADDITIVES ON THE NITRIC OXIDE VALUE 69
NO/HCN RATIO AT THE TOP AND BOTTOM OF THE REACTOR 73
EXPERIMENTS WITH THE SECOND REACTION VESSEL 86
RATE CONSTANTS FOR THE NO + NO Z REACTION 97
DISCUSSION 107
SUMMARY AND CONTRIBUTIONS TO KNOWLEDGE 121
BIBLIOGRAPHY 124
- iii -

1 1 , LIST OF FIGURES
Figure
1- Energy level diagram of the nitrogen molecule
2. Potential ënergy curves for sorne states of the nitrogen molecule
3. Diagram of the apparatus
4. Second reaction vessel
5. Hydrogen cyan ide production as a function of ethylene flow rate, at 1 mm Hg
6. Hydrogen cyanide production as a function of ethylene flow rate, at 2 mm Hg
7. Arrhenius plot of the reaction of active nitrogen with oxygen
8. The nitric oxide 'titration' value of active nitrogen ~ time, after long and continuous
R~~
4
10
42
44
62
63
68
periods of operation of the microwave discharge 75
9. The nitric oxide 'titration' value of active nitrogen ~ time, for the effect of water vapour introduced before the microwave discharge 77
10. The nitric oxide 'titration' value of active nitrogen vs time, for the effect of water vapour introducedafter the micro~vave discharge 79
Il. The nitric oxide 'titration' value of active nitrogen vs time, for the effect of water vapour premixed with nitric oxide 81
12. The nitric oxide 'titration' value of active nitrogen vs time, for the effect of hydrogen introducedbefore the microwave discharge 83
13. The nitric oxide 'titration' value of active nitrogen ~ time, for the effect of oxygen introduced before the microwave discharge 85
14. Plot of the No/HCN ratio vs pressure 90
15. Plot of the nitric oxide 'titration' value vs maximum hydrogen cyan ide production 91
16. Plot of ln (NO) 1 (NO) - (N 20 3 )t vs t o 0 106
- iv -

LIST OF TABLES
1. 'Blank' experiments for the trapping of nitric oxide, by using excess nitrogen dioxide 55
2. Maximum yields of oxygen atoms from the reactions of active nitrogen with nitric oxide and oxygen respectively, at different temperatures and at different levels in the reaction tube 59
3. Maximum hydrogen cyanide production from the reaction of active nitrogen with ethylene 60
4. Maximum yields of oxygen atoms from the reaction of active nitrogen with oxygen, estimated with excess nitrogen dioxide 61
5. Variation of kl
as a function of temperature 67
6. The nitric oxide 'titration' value of active nitrogen, after long and continuous periods of operation of the microwave discharge 74
7. The effect of water vapour introduced before the microwave discharge 76
8. The effect of water vapour introduced after the microwave dis charge 78
9. The effect of water vapour premixed with nitric oxide
10. The effect of hydrogen introduced before the microwave discharge
Il. The effect of oxygen introduced before the microwave discharge
12. The No/HCN ratio at the top and bottom of the reactor
13. Maximum yield of hydrogen cyanide and oxygen atoms from the reactions of active nitrogen with ethylene and oxygen respective1y, at various pressures
14.
15.
Experiments concerning the trapping efficiency of nitric oxide, by using excess nitrogen dioxide, in different systems
Data for the ca1cu1ation of the rate constants k' and k
- v -
80
82
81.~
87
98
100
105

- 1 -
INTRODUCTION
ACTIVE NITROGEN
When a stream of ordinary molecu1ar nitrogen, itself a
re1atively inert gas, is subjected to an electric discharge a
bright golden-yellow glow may be observed downstream from the
discharge. This glow, the so-called nitrogen afterglow, may
persist for a considerable time after the discharge is s.itched
off. It was first observed by Warburg (1) in 1884, and was
studied spectroscopically, in 1900, by Lewis (2). He was able
to identify the emission spectrum as that of nitrogen. Much
more extensive studies were made by Strutt (later,Lord Rayleigh)
during the period from 1911 until his death in 1947. Of
particular interest were his experiments that demonstrated the
great chemica1 reactivity of the g10wing gas, as a consequence
of which he referred to it as 'active nitrogen'. It is
interesting to note that he attributed many of its properties to
the presence of a~omic nitrogen (3). The yellow glow has sinee
been known as the 'Lewis-Rayleigh' afterglow.
Since the discovery of active nitrogen, numerous
experimental studies have been made, to explain the mechanism of
the afterglow and to elucidate the nature of the active species
in active nitrogen. These studies prior to 1945 are reviewed
briefly in a book by Mitra (4), entitled 'Active Nitrogen - A
New Theory'. Reviews of more recent studies have also been
made available by Jennings and Linnett (5), Edwards (6), and

(
- 2 -
Ma n n e lIa (7). The remarks that fo11ow will therefore not
attempt anything in the nature of a comprehensive review, but
will be 1imited, essentia11y, to the important points that are
necessary for discussing the work of the present investigation.
Active nitrogen is genera11y produced by the passage
of an e1ectrica1 discharge through nitrogen at low pressures.
The discharge may be condensed (intermittent) between
e1ectrodes, or of the e1ectrode1ess (microwave) type, first used
by Burke (8). An arc discharge may a1so be used,at pressures
as high as 20 cm Hg (9). Active nitrogen has a1so been
produced by an e1ectrica1 discharge through ammonia or nitric
oxide (10), and by bombardment of nitrogen with e1ectrons of
energy greater than 16.3 e.v. (11).
The purity of the nitrogen is important. Abso1ute1y
pure nitrogen fai1s to give the afterg1ow, as suggested by
Comte (12), and confirmed by Lewis (13), Rayleigh (14) and
recent1y by Anderson (15). The glow is enhanced when foreign
gases are added (3), in trace amounts insufficient for the
spectra of the gases to appear in that of the glow (16).
When active nitrogen is passed between e1ectrodes,
it shows re1ative1y high e1ectrica1 conductivity (3). This
conductivity was attributed, in the past, to the presence of
positive ions in the gas phase (17). Benson (18) has recent1y
found that the charged partic1es in active nitrogen were main1y
-6 e1ectrons, at a concentration 1ess than 10 that of the
chemica11y active species. He a1so pointed out that active

\ ,1
- 3 -
nitrogen did not show any response to magnetic fields, and
removal of ions from active nitrogen had no effect on the glow.
The introduction of foreign substances into a stream
of active nitrogen usually results in a flame at the point of
mixing. Certain characteristics of this flame, such as length
and colour, depend upon the nature and concentration of the
added substance. The spectra of these flames are due either to
the unchanged substances, excited by energy transfer from active
nitrogen, or to excited species formed in chemical reactions
with active nitrogen. Nitrides are formed in the reaction
between active nitrogen and me~allic vapours, while hydrogen
cyanide is the main product with hydrocarbons and their
derivatives (3,19).
The discharged nitrogen is. characterized by a pink
glow in the discharge region. The N2 first positive
(B 3rr g _ A3E:), N2 second positive (C3nu _ B3 TTg ),
first negative (B2 2:- _ x2l:+) bands, are emitted.
u g
Rayleigh' afterglow emits only the N2 first positive
The 'Lewis-
(B 3 TT _ A3l:+) bands (20,21,22,23,24). From the terminal A g u
state of t~e first positive emission, the nitrogen molecule falls
to the ground x1l:+ state with emission of the 'forbidden' g
Vegard-Kaplan bands. (See Fig. 1)
are
The strongest transitions of the first positive system
those from the 12, Il, 10, 7 and 6 th vibrational levels of
state to the 9, 8, 7, 4 and 3rd vibrational levels of
state (20,21,25). Kistiakowsky and Warneck (26)

- 4 -
Figure 1
ENERGY LEVEL DIA GRAM OF THE NITROGEN MOLECULE
The longer horizontal lines indicate the
electronic states, and the shorter
horizontal lines indicate the
vibrational levels
(Reproduced from r~ference 63)

_____ ~.. ____ • __________ ,;y" ........ "'I"'f't'\t\--.... ""'.~,...-.. -n~~ ... ~ .... -TY~~~~""'.<rI\'\"""~""""" ... ,."....,..ruo"" ....... "' .. ~ ..... __ .,""' .. .., ... ~~v,.,.,..,_~:~..,':'~~",~t·-~~';v·:f~(J!~ . -. . .. ~ _. . . _. .,
Cr
15
13
12
1 1
10
9 > a lU
>- 7 \:J a: w 6 z w 5
4
:5
2
0
N+ X2 r: +
2 <J
--=.DJ2.D -- - -l'
4 S +2p --1 - - '--3- --
~ D E+ 1
, r4f~+20 -- 2-Z -141 °0 ~ 21 = ~ Oz a::
-, '4 4 - ~.c( - w -EL ... 2 ~ J: P =.C/) S+S - - _ r.!+ = .JO.. 0 - -t - f =- 0 "-- =- a.. - 1111 16 = ci i -
1 -
'" 1 - = 2 t-
n~ - - ~ = - C\J .
0 a. =i ~ B3n 1 ..J
w =1 ~ - Cl _IST. POS. ~ "'-A3 [+ a.. ..J
0 w Lt -::I: lA.. 1
W a.. CJ 0
~ cr J: - 1 ~ al LU ~'V 1 z (!J .\t' < oc ~ , ~ cc <l'-Ç) >-
~~ .J ~«.;
)(1 [+ ~
ENERGY LEVEL DIAGRAM OF THE Nz
MOLECULE
....
',""

Ci
- 5 ..
proposed that the weaker transitions do not belong to the first
positive system.
The decay of the afterglow was found to be proportional
to the square of the ground-state nitrogen atom concentration,
under a variety of conditions. (27). By experiments that
involved dilution, compression and expansion of active nitrogen,
Rayleigh (28) showed that the process was termolecular, being
second order in the active species and first order in molecular
nitrogen, which acts as a third body in the process. He also
suggested that the reaction responsible for the afterglow might
have a negative temperature coefficient, since the intensity of
the glow decreased with an increase in temperature.
The energy content of active nitrogen has been
variously estimated from 2 to 12.9 e.v./mole of total nitrogen.
The value of 2 e.v. was suggested by Willey and Rideal (29),
based on calorimetrie data for the reactions of nitric oxide and
air with active nitrogen. On the other hand, experiments on
the excitation of mercury lines by active nitrogen yielded a
value of 9.5 e.v. (30,31). When metal foils were exposed to
active nitrogen, the energy liberated appeared to correspond to
values that ranged from 4.32 to 12.9 e.v./mole of total
nitrogen (32). However, Benson (18) obtained a value of only
0.027 e.v./mole of total nitrogen, from careful calorimetrie
experiments, and he has ascribed the discrepancy to the
bombardment of the foils by electrons from the dis charge.
The bond dissociation ene~gy of the ground-state

(l
- 6 -
nitrogen molecu1e, a1though a most important quantity, was not
known with certainty for many years. The suggested values were
genera11y in the neighbourhood of either 7.373 or 9.764 e.v.
The first value was proposed by Herzberg (33), based on the pre-
dissociation of nitrogen; he pointed out, however, that the
possibi1ity D(N2 ) = 9.756 e.v. was not conc1usively e1iminated.
Qaydon (34) conc1uded that the pre-dissociation in the B3 TT
g state was possib1y the resu1t of recombination of N(4 S ) atoms
through an intermediate 5r:+ state. This exp1anation gave the g
second value, 9.764 e.v., for the dissociation energy (34,35).
Experiments on detonation ve1ùcities in nitrogen (36), thermal
decomposition of nitrogen (37), and dissociation of nitrogen by
mono~nergetic e1ectrons (38), have astab1ished the correctness
of the higher value, and the value now accepted for D(N2 ) is
9.756 e.v. or 225 Kca1, i.e. 112.5 Kcal/mo1e for the heat of
formation for N(4 S ) atoms.
THEORIES OF THE LEWIS-RAYLEIGH AFTERGLOW
Attempts to explain the production and behaviour of
the 'Lewis-Rayleigh' afterglow have bean made from the ear1y
days of its discovery until today. The uncertainty about the
energy content of active nitrogen, and the dissociation energy
of the nitrogen mo1ecu1e, has 1ed to controversial postu1ates
about the species that might be present, hence about the
mechanism by which the afterglow might be deve1oped. When both
the energy content and dissociation energy were fina11y

- 7 -
( established, and improved techniques were available for
identifying the species present in active nitrogen, the
mechanism of the afterglow became more detailed, although not
completely resolved.
Rayleigh (Strutt) (3) suggested that the properties of
active nitrogen were due mainly to the presence of nitrogen
atoms, an assumption which was supported later by the experi-
mental production of atomic hydrogen (39,40). On this basis
Sponer (41) proposed, in the earliest theory of the afterglow,
that it resulted from a two-step mechanism,
N + N + M
* N2 - N2 + hv (afterglow).
The suggested third-order kinetics agreed with the experimental
behaviour and also explained the long life of the afterglow.
However, this theory fails to account for the selective
enhancement of certain transitions in the spectrum of the after-
glow, and for the electrical properties of active nitrogen.
Cario and Kaplan (42) proposed the presence of
metastable atoms and metastable molecules in active nitrogen.
They assumed production of vibrationally excited molecules in
the B state, by collisions of the second kind, which produced
the afterglow by the following mechanism:
- 8 -
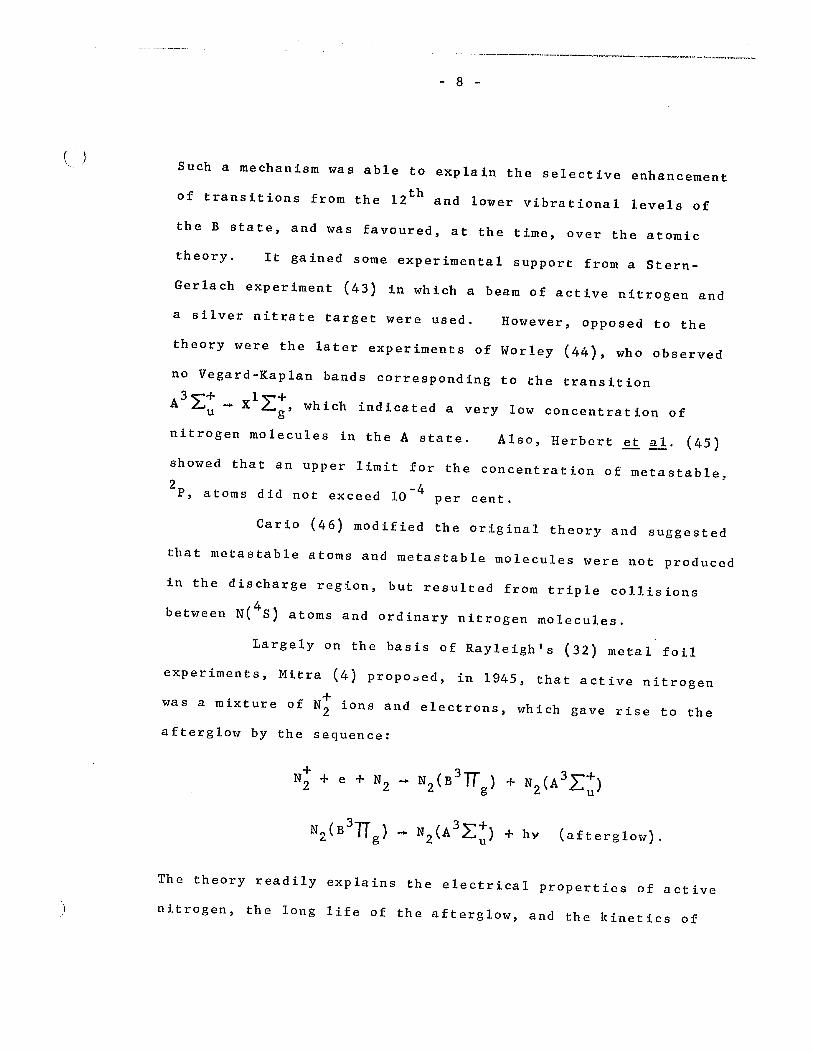
Such a mechanism was able to explain the selective enhancement
of transitions from the l2 th and lower vibrational levels of
the B state, and was favoured, at the time, over the atomic
theory. It gained sorne experimental support from a Stern-
Gerlach experiment (43) in which a beam of active nitrogen and
a silver nitrate target were used. However, opposed to the
theory were the later experiments of Worley (44), who observed
no Vegard-Kaplan bands corresponding to the transition
A3~+ _ xl2:+, which indicated a very low concentration of u g
nitrogen molecules in the Astate. Also, Herbert n~. (45)
showed that an upper limit for the concentration of metastable, 2 -4 P, atoms did not exceed 10 per cent.
Cario (46) modified the original theory and suggested
that metastable atoms and metastable molecules were not produced
in the discharge region, but resulted from triple collisions
between N(4 s ) atoms and ordinary nitrogen molecules.
Largely on the basis of Rayleigh's (32) metal- foil
experiments, Mitra (4) propooed, in 1945, that active nitrogen
was a mixture of N; ions and electrons, which gave rise to the
afterglow by the sequence:
The theory readily explains the electrical properties of active
nitrogen, the long life of the afterglow, and the kinetics of

~ , ___ J
- 9 -
i t s de cay. However, Gaydon (35) was opposed to Mitra's theory,
on the grounds that the heating effects observed by Rayleigh
were probably due to cathode rays from the discharge region, a
point which, as indicated previously, was subsequently proven
experimentally by Benson (18). He observed that, when the
electrons were removed from the gas stream, the heating effects
were much reduced. Experimental evidence against the theory
was also obtained by Worley (44), who failed to observe the
+ (0,0) bands of N2 in absorption with a path length of 13 m.
Mitra (47) finally conceded that the theory was untenable.
The suggestion that pre-association of nitrogen atoms
may occur through a quintet state provides a basis for explaining
most of the experimental observations on the behaviour of the
afterglow. The ground state nitrogen atom has the electronic
f · . 1 2 2 2 2 con ~gurat~on s s p x
2p 2p, with three unpaired p elec-y z
trous of parallel spin. When two atoms of the above
configuration come together, molecules are formed in different
states, depending upon the pairing of the six electrons. They
cau approach each other along four different potential energy ....
curves, labelled 1, 2, 3 and 4 in Fig. 2, corresponding to the
pairing of 6, 4, 2 and ° electrons, Depending upon the paths,
the molecular states formed are designated 12:+, 3~+, 5~+ and g u g
72::, and their formation probability is as the ratio of their
multiplicities, 1:3:5:7.
The molecules so formed must be stabilized by a
collision with a third body ta remave the excess energy. If

1
'-
- 10 -
Figure 2
POTENTIAL ENERGY CURVES FOR SOME STATES
OF THE NITROGEN MOLECULE
(Reproduced from reference 5)

-'-~'~"<;.'_'''' __ ' ___________ ' ____ ... ________ - ... -..---.. "" .. -_-T.-.. --... ---- '.-~--. -, ,-". 1.'"
Cl
14
\
12 , \
~ -------, \
V> 10 1-...J
0 > 8
z 0 0: 6 t-U
LU ...J 4 Lù
2
o~----~----~~--~----------~-----~ 0.5 1.0 1.5 2.0 2.5 3.0 o SEPARATION CA)
()
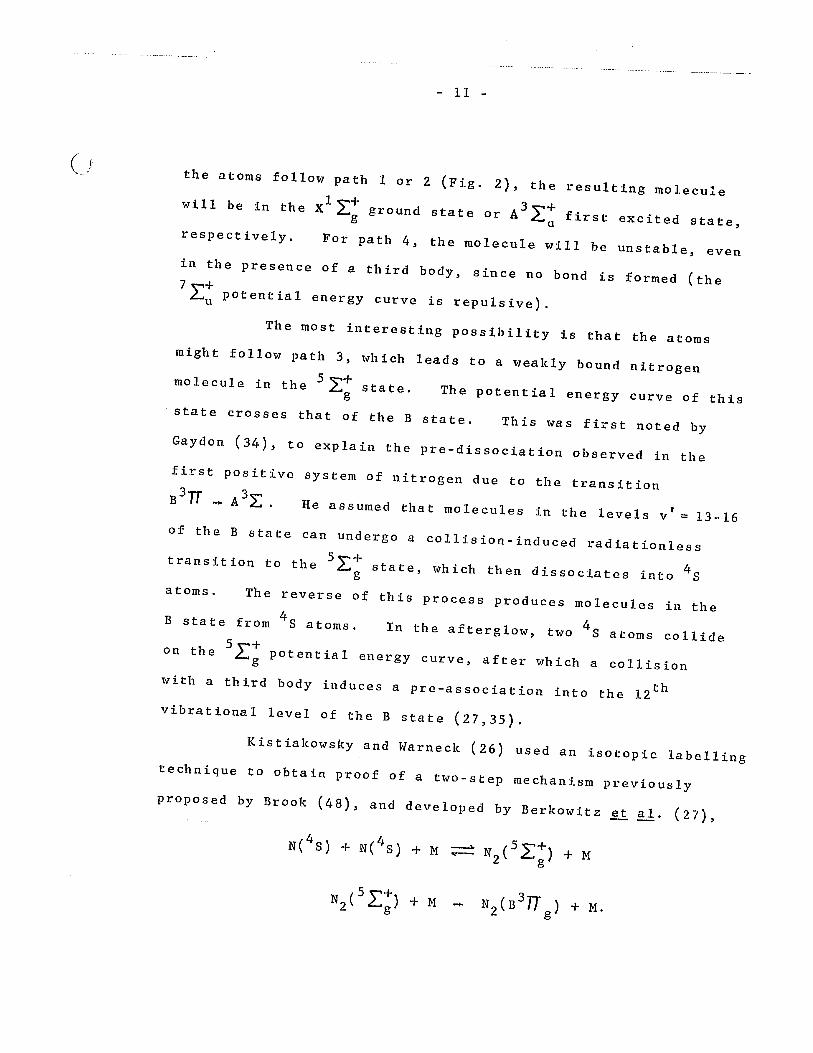
- Il -
the atoms follow path 1 or 2 (Fig. 2), the resulting molecule
will be in the Xl 2:+ ground state or A3 2:+ first excited state, g u
respectively. For path 4, the molecule will be unstable, even
in the presence of a third body, since no bond is formed (the 7 ~+ ~ potential energy curve is repulsive). u
The most interesting possibility is that the atoms
might follow path 3, which leads to a weakly bound nitrogen
mo le cule in the 5 2:+ sta te. g The potential energy curve of this
state crosses that of the B state. This was fi~st noted by
Gaydon (34), to explain the pre-dissociation observed in the
first positive system of nitrogen due to the transition
He assumed that molecules in the levels v' = 13-16
of the B state can undergo a collision-induced radiationless
transition to the 52:+ state, which then dissociates into 48 . g a toms. The reverse of this process produces molecules in the
B state from 48 atoms. 4 In the afterglow, two 8 atoms collide
on the 5 E+ potential energy curve, after which a collision g
with a third body induces a pre-association into the l2 th
vibrational level of the B state (27,35).
Kistiakowsky and Warneck (26) used an isotopie labelling
technique to obtain proof of a two-step mechanism previously
proposed by Brook (48), and developed by Berkowitz tl al. (27),

Cl
- 12 -
The distribution curve for light emission from various
vibrational levels of the B3 TT state 'S"howed that the above g
mechanism was valid only for higher vibrational levels,
v' = 8-12, while the transitions from lower vibrational levels
were due to sorne other mechanism. They identified three bands
which did not fit into the first positive system. A new state,
'Y', was proposed, as the initial state for the new bands,
which was itself populated from the 52:+ state, through a g collision-induced transition, in competition with the transition
to the B3 rr state. g
Peyron and Broida (49), working at very low
temperatures, were able to identify the 5 ,,+ ~ state, which gave g
support to the pre-association theory. They calculated
D N (5 .r,+) ::: O. 13 o 2 g e.v., based on Do N2 = 9.76 e.v.
Le Blanc ~ al. (50) found a new band system, by
passing a discharge through mixtures that contained 5-10%
nitrogen with 95-90% argon, with the subsequent afterglow tube
cooled with liquid nitrogen. 3 They proposed the ~ state as u the upper state, while the lower state of the system was thought
to be the B state. The 3~ state can be produced by a u
collision-induced radiationless transition from the 52:+ state. g Gaydon (35) has observed, in the Lyman-Birge-Hopfield
bands of the afterglow, a forbidden pre-dissociation in the
v' == 6 level of the clIT state. g He suggested that this is ITT 5 ,,+ 4 due to the process N2 (a g} - N2 ( ~g) - N( S) The
reverse of this pro cess can give rise to the Lyman-Birge-Hopfield
bands in emission.

- 13 -
,,--
\ 1 The pre-association theory has been expanded by Bayes
and Kistiakowsky (51), in an effort to exp1ain their own
experimental results, as weIl as the previously known properties
of the afterglow. The proposed mechanism can be summarized as
follows:
- N (B 3rr ) _ N (A3~+) + hy 2 g 2 ~u
(first positive system)
- 3 ,,- ( 3 1T ( 3 ,,+ N2(Y ~u) - N2 B g) - N2 A ~u) + hy
(proposed new bands)
- 3 3Tf 3 ~+ N2( ~u) - N2(B g) - N2(A ~u) + hv
(proposed new bands)
- 111 1 ,,+ N2(a g) - N2 (X ~g) + hV
(Lyman-Birge-Hopfield bands).
The Bayes-Kistiakowsky mechanism cannot explain sorne
parts of the afterglow spectrum, both at high and very low
pressures. However, it has proved to be a useful basis for
suggesting both theoretical and experimenta1 investigations.
REACTIVE SPECIES IN ACTIVE NITROGEN
Various species have been proposed to explain the
chemical reactivity of active nitrogen. There is no doubt
that, of the various species present, nitrogen atoms in the 4 S

- 14 -
ground state are of major importance. On the other hand,
there is experimental evidence that part of the reactivity may
be attributed to excited nitrogen molecules.
The presence of atoms in active nitrogen, suggested
initially by Strutt (3), was demonstrated experimentally by
Wrede (53). He was able to detect a pressure difference
ascribable to differential diffusion of atoms, relative to
molecules, through a pin-hole (the so-called Wrede gauge). As
outlined previously, a Stern-Gerlach experiment suggested that
2 the atoms were excited to the Pl/2 state. However, failure
to detect absorption in the vacuum ultraviolet, where both 2p
2 and D atoms would absorb, indicated that the concentration of
excited atoms was only 1/6000 the total atom concentration in
active nitrogen. Other experiments by Tanaka ~~. (54) gave
the total concentration of 2p and 2D atoms as 1/500 the COn
centration of N(4S ) atoms. Emission corresponding to the
transition 2D _ 4 S has been observed by Broida and co-workers
(55,56) from solid products condensed at 4.20
K from the nitrogen
2 * afterglow, but they did not estimate the D atom concentration.
Direct experimental evidence for ground state atoms
in active nitrogen has been obtained from the para-magnetic
resonance spectrum of active nitrogen (57), and from mass
spectrometrie studies on active nitrogen (58). An appearance
potential of 14.7 + 0.2 e.v. agreed weIl with the ionization
~~ Edwards (6) has given a detailed review of the studies on
active nitrogen at very low temperatures.

- 15 -
potentia1, 14.545 e.v., ca1cu1ated for the 4 S nitrogen atom (59).
A second appearance potentia1 was observed at 16.1 e.v., but
not conc1usive1y assigned. Another mass spectrometrie study
confirmed the appearance potentia1 at 14.7 e.v., but did not
detect the One at 16.1 e.v. (27).
The presence of N3
in active nitrogen has been
inferred from spectroscopie observations on both the gas phase
(60) and on products condensed from active nitrogen at 4.20
K
(61). However, infra-red absorption by Mi11igan ~~. (61)
in the solid phase was not confirmed (62), and the presence of
N3
remains controversia1. It seems 1ike1y that N3
shou1d be
rapid1y destroyed by reaction with nitrogen atoms (63).
The majority of active nitrogen reactions can be
exp1ained On the assumption that nitrogen atoms, in the 48
ground state, are responsib1e for its chemica1 reactivity.
However, there are some reactions that suggest the possible
presence of excited mo1ecu1es as a second reactive species.
Both vibrationa11y and e1ectronica11y excited mo1ecu1es have
been suggested as this second species.
Vibrationa11y excited ground state molecu1es were
first proposed by Evans and Wink1er (63), as the second
reactive species, and experimenta1 evidence for their presence
has been obtained by severa1 workers. For examp1e, Kaufman
and Ke1so (64) found that additioB of either nitrous oxide, or
carbon dioxide, downstream from the discharge removed
vibrationa11y excited nitrogen mo1ecu1es. They a1so observed

- 16 -
that when nitric oxide was added to the point of extinction
of the afterglow, followed by addition of nitrous oxide down-
stream, the effect was greater. The rate of decay of the
excited molecules was of approximately the same order of
magnitude as that of the decay of vibrationally excited oxygen
molecules (65).
The presence of vibrationally excited ground state
molecules in active nitrogen has been demonstrated directly
from their vacuum ultraviolet absorption spectrum (66), and
indirectly by studies of the thermal effects of active nitrogen
when it is examined with an isothermal probe (67).
More recently, Starr (68) and Starr and Shaw (69)
have demonstrated the transfer of vibrational energy from
nitrogen molecules to electronic energy of sodium and potassium.
It seems reasonable, from the numerous studies on
vibrationally excited molecules in active nitrogen, that the
energetics of this species is sufficient for a limited extent
of reactivity, e.g. decomposition of oZOne (70). However, it
seems unlikely that their presence can sccount for reactions
that require more than about 25 Kcal for their initiation (70).
Of the possible excited molecular species in active
nitrogen, that might be effective in chemical reactions, the
N (A 3 2:+) species seems to be the only one with a life-time 2 u
sufficient to permit its presence in appreciable concentrations,
under the usual experimental conditions, for studying chemical
reactions.

- 17 -
A 10wer limit of 10- 2 sec. for the radiative 3 ",+ life-time of the N2 (A ~u) state was obtained by the mo1ecular
beam experiment of Lichten (78). Other values hav~ been
obtained by various methods, e.g. 0.026 sec., byabsorption
spectroscopy (79); about 1 sec., from the emission of the
Vegard-Kap1an bands in the Lewis-Rayleigh afterg10w, at
pressures 20-760 mm Hg (80); 2.0 ~ 0.9 sec., by combination of
absorption and emission spectroscopy (81); 0.9 sec., by
measuring the intensity of the (0,6) Vegard-Kaplan band (82);
0.08 ~ 0.04 and 0.084 sec., from studies on the decomposition
of ammonia by active nitrogen (52,72); and 1.1 sec., from
studies of the reactions of iodine (83). A recent attempt by
3 ~+ Young (84), to measure the actua1 1ife-time of N2 (A ~u)' gave -4 only a very small upper limit ~ 5 x 10 sec.
Studies on the decomposition of ammonia, water and
sulfur dioxide have been particularly suggestive of a second
reactive species (71,72,138,141). The maximum extent to which
ammonia may be decomposed was found to be about one-sixth the
activity of the active nitrogen determined from its ability to
form hydrogen cyanide from ethylene. Somewhat similar
conclusions have been reached for the reactions with water and
sulfur dioxide. It would appear, therefore, that these
inorganic molecules react with a different species in the
active nitrogen than does ethylene. Furthermore, mass spec-
trometric studies have shown that the decomposition of ammonia
is not accompanied by decrease in the nitrogen atom

- 18 -
concentration (73). It has been proposed, therefore, that the
decomposition of ammonia is due to energy transfer from excited
nitrogen molecules (72,73).
The reactions of active nitrogen with ethane, propane
and neopentane, investigated by Winkler and co-workers (75,76),
also suggested a second reactive species; it might weIl be
N2(A3~:) in relatively low vibrational levels.
Freeman and Phillips (77) made a photometrie study of
the flame produced when iodine vapour was mixed with active
nitrogen. Nitrogen atoms were consumed in the first region of
the flame and nitrogen molecules in an excited, probably the
3 ,,+ A ~ , state were produced. u
They suggested this reaction as a
means of producing A3~+ molecules, for studying their behaviour u
in the absence of nitrogen atoms.
DETERMINATION OF NITROGEN ATOM CONCENTRATION
In the reaction of active nitrogen with ethylene, the
maximum hydrogen cyanide production ('plateau' value), in a
cylindrical reaction vessel, has been found to be independent of
ethylene flow rate and temperature, in the region 400
to 4000
C
(72,85). Closely similar plateau values were obtained from a
variety of satu~ated and unsaturated hydrocarbons and their
derivatives. Accordingly, it seemed reasonable to suggest that
the nitrogen atom concentration in active nitrogen might be
estimated from this maximum production of hydrogen cyan ide from,
say, ethylene. As a difficult alternative, it is necessary to
explain an essentially equal loss of nitrogen atoms during the

- 19 -
reactions of such dissimilar molecules as C2H4 , C3H6' C3H8'
C4HlO ' cyclo - CSH lO ' and CH 3Cl.
On the other hand, when nitric oxide is added to a
stream of active nitrogen a very fast reaction occurs (74,86,
87,88), usually assumed to be:
N + NO - N2 + 0 (1)
This reaction has been used for the 'gas phase
titration' of nitrogen atoms. With a flow rate of nitric
oxide less than that of nitrogen atoms, consumption of nitric
oxide, by reaction (1), leads to the formation of oxygen atoms,
which can then react with the residual nitrogen atoms to form
excited nitric oxide Molecules. These emit a blue glow (~ and
y bands of nitric oXide), according to the reaction,
N + 0 + M - NO* + M - NO + hY ( 2)
The occurrence of reaction (2) was demonstrated by Kaufman and
Kelso (88), who added NlSO to a stream of active nitrogen from
N 14 and found only N140* to be formed. 2 '
When sufficient nitric oxide is added to remove aIl
the nitrogen atoms, the cessation of light emission corresponds
to the equivalence or end-point of the 'titration'. With a
slight excess of nitric oxide, hence consumption of aIl the
nitrogen atoms, reaction of the excess nitric oxide with oxygen
atoms produces excited NO; , which emits a yellow-green
continuum. In practice, the colour change, from blue to

- 20 -
yellow-green emission,provides a relatively easy
identification of the end-point for the 'titration'. This
method for estimating the nitrogen atom concentration la fast
and ha3 been used extensively in recent years.
A lively controversy, of which only the main elements
will be discussed here, has existed for some time on the
relative merits of the hydrogen cyan ide and nitric oxide
methods for determining nitrogen atom concentrations. This
resulted from an observation by Verbeke and Winkler (74) that
the ratio 'maximum NO decomposed': 'maximum HCN formed from
C2
H4 ' (the NO/HCN ratio) appeared to vary from about 1.4 to
2.4, in the pressure range 1 to 16 mm Hg, a discrepancy which
they suggested might be due to reaction of nitric oxide with
both nitrogen atoms and a second species, presumably excited
nitrogen Molecules. This interpretation was criticized by
Zinman (90), who claimed that the resu1ts could be explained in
terms of nitrogen atoms only. However, his treatment, in turn,
was criticized by Wright ~ al. (72), who found, contrary to
the prediction of Zin~an's equation, that the NO/HCN ratio did
not depend on the number of carbon atoms in the hydrocarbon
Molecule. They also observed that it was independent of the
mode of excitation of molecular nitrogen and of the nitrogen
atom concentration. On the other hand, it changed with time
of decay of the active nitrogen. A consideration of the
~~ NO/HCN, NH
3 /HCN and NH
3/NO ratios, after different times of
* Where NH3
here represents the maximum amount of ammonia
decomposed under comparable conditions.

()
- 21 -
decay, led them to suggest that both the ammonia and nitric
oxide reactions might involve electronically excited nitrogen
molecules.
Back and Mui (89) found an almost stoichiometric
relation between nitric oxide consumption and the formation of
N14N15, when N15
0 reacted with nitrogen atoms produced in a 14 stream of N
2 . This suggests that the consumption of NO is
a valid measure of the nitrogen atom concentration.
In contradiction to the conclusions of Back and Mui,
Fersht and Back (91) subsequently obtained data that seemed to
support the validity of the hydrogen cyanide yield from
ethylene, as a measure of the nitrogen atom concentration.
They reacted active nitrogen with various mixtures of ethylene
and nitric oxide, at 1 mm pressure. The sum of hydrogen
cyanide produced and nitric oxide consumed remained almost
constant, and equal to the hydrogen cyanide yield from pure
ethylene, until the mixture was about 50% in nitric oxide. It
was concluded that nitric oxide can also react with excited
molecules, probably in the A3 2:+ state. u
A mass spectrometrie study has been made of the
reaction of active nitrogen with ethylene, when 2% of hydrogen
was added to the nitrogen stream through a microwave discharge
( 93) . The yield of hydrogen cyanide was then brought iuto
closer correspondence with the estima tes of nitrogen atom
concentration based on the nitric oxide titration. Accordingly,
a mechanism was proposed which sought to explain an inefficiency

()
- 22 -
for production of hydrogen cyanide in the ethylene reaction,
due to loss of nitrogen atoms in hydrogen abstraction reactions
from free radicals, to yield NH radicals, followed by their
reaction with nitrogen atoms, or by their disproportionation.
However, it should be noted, perhaps, that the concentration of
hydrogen atoms produced in the discharge was undoubtedly far
greater than that normally present in active nitrogen reactions
with hydrocarbons.
The chemical estimation of nitrogen atom concentrations
has been recently compared with their physical estimation in an
electron spin resonance spectrometer (E.S.R), calibrated against
molecular oxygen (94). The results agreed weIl, in the
pressure range 0.4 to 3 mm Hg, with those obtained with the
nitric oxide titration. However, the comparison is apparently
subject to possible complications, as shown by Weyssenhoff and
Patapoff (95). They, too, used an E.S.R spectrometer, but
made only relative measurements of the nitrogen atom con
centration for different operating conditions, to avoid
uncertainties due to calibration of the E.S.R unit. Although
the nittric o~ide titration and E.S.R values agreed in the range
of 1.6 to 5.1 mm Hg, when the f10w velocities were relatively
slow, the nitric oxide values became much larger than those
given by E.S.R (by as much as 1.37 to 1.66) for higher flow
velocities at pressures above 3 mm Hg.
Vacuum-ultraviolet absorption measurements of the
resonance lines of nitrogen atoms, by the line absorption

- 23 -
method, also corroborate the validity of the gas phase nitric
oxide titration technique (96).
A seemingly incontrovertible physical method for
measuring the nitrogen atom concnetration was attempted
unsuccessfully by Back and Winkler (155), and finally brought
into successful operation by Elias (97). It involves measure-
ment of the pressure decrease due to atom recombination, when
a portion of the dissociated stream of active nitrogen is
rapidly isolated in a section of the flow line. The results
obtained were in excellent agreement with the values obtained by
the nitric oxide titration.
It is interesting, perhaps, that Dubrim ~ al. (92)
have produced l3 N atoms by nuclear techniques, and reacted them
with various mixtures of ethylene and nitric oxide at 1 atm.
o (4 and 25 C. They suggested that ground state, N S), atoms
cannot react efficiently with ethylene to form hydrogen cyanide
or any other product, but may react readily with nitric oxide.
On the other hand, a second reactive species, probably an
excited nitrogen atom, might be formed by their method, and be
capable of reaction with ethylene as weIl as with nitric oxide.
Although the maximum hydrogen cyanide yield from
ethylene cannot be dismi"ssed summarily as a valid measure of
nitrogen atom concentration Ce.g. closely similar yields from a
variety of hydrocarbons and their derivatives, the experiments
of Fersht and Back (91)), nevertheless, the evidence in favour
~f the nitric oxide titration would seem to be overwhelming.

Ci
- 24 -
This is particularly true, perhaps, for the nitrogen atom
recombination method discussed above, since it is difficult
to conceive of any uncertainty in the interpretation of the
measured pressure decrease.
CHEMICAL REACTIONS OF ACTIVE NITROGEN
A number of earlier studies, particularly those of
Strutt, indicated that active nitrogen was very reactive
ch em i ca Il y . Vapours of mercury, zinc, cadmium and arsenic were
converted to nitrides; carbon disulphide, sulphur chloride and
hydrogen sulphide yielded a polymeric nitrogen sulphide;
hydrocarbons produced hydrogen cyanide accompanied by the
emission of CN bands, from a lilac-colour reaction flame; nitric
oxide reacted with active nitrogen very rapidly, and the only
product was N02
(3). An early study of this reaction (98) laid
the basis for the 'gas phase titration' of nitrogen atoms,
mentioned previously, the suggested mechanism being:
N + NO N2 + 0
o + NO --- N0 2
Reaction of active nitr05en with atomic hydrogen was
found to yield trace quantities of ammonia, whereas molecular
hydrogen was not affected (99). Hydrogen bromide, hydrogen
iodide and ammonia were found to be decomposed by active
nitrogen, but no reaction was observed with oxygen or carbon
monoxide (19).

---------- --_.
- 25 -
A systematic study of the chemical reactions of
active nitrogen was begun in 1949 at McGill University by
Winkler and his associates. A number of kinetic investigations
of the reactions of organic and inorganic compounds have now
been made in this, and other laboratories. In practically aIl
cases, the reactant was introduced as agas into a stream of
active nitrogen, produced by either condensed or microwave
discharge, in a fast gas flow system. After reaction, the
products were collected in downstream traps, cooled at very low
temperatures, and analysed by appropriate methods.
Comments on these studies will be limited mainly to
those reactions that have direct relevance to the present
investigation, since reasonably comprehensive reviews are
available for the interested reader (4,5,6,7).
REACTIONS WITH ORGANIC COMPOUNDS
The reaction of active nitrogen with ethylene, by
Greenblatt and Winkler (101), was the first to be investigated
kinetically in any detail. The main product was hydrogen
cyan ide, with small amounts of ethane, and a hydrogen cyanide
polymer. They proposed the following mechanism:
Activated C2H4 + N - Complex - HCN + CH;
N + CH3 HCN + 2H
The formation of ethane could be explained by hydrogenation of

- 26 -
C2
H4
or by recombination of CH; radicals.
Reinvestigation of the reaction (102) showed that
cyanogen, acetylene and methane,were also formed in small
amounts. Alternative to the simple mechanism proposed in the
first study, it was suggested that other possible reactions
were:
C H + N _ Activated _ 2 4 Complex
CH 2 + N - HCN + H .
The formation of cyanogen was explained as:
Dehydrogenation of ethylene, by hydrogen atoms, might produce
the small amounts of acetylene
while methane might be formed by
CH 3 + H + M - CH4 + M .
Traces of ammonia have been detected in the products

- 27 -
of the ethy1ene reaction (72,103). The ammonia formation can
be exp1ained by the combinat ion of nitrogen and hydrogen
atoms (104).
Other unsaturated hydrocarbons
A number of other unsaturated hydrocarbons have a1so
been investigated. These are propy1ene (85,105,106), the
butenes (107), acety1ene and methy1ated acety1enes (108,109).
In aIl cases, hydrogen cyanide was the main produc~ iso1ated.
~lkan~
Th~ reactions of active nitrogen with a1kanes, such
as methane (75,110,111,112), ethane (75,76,110,111), propane
(75,76,113), the butanes (114), and neopentane (75,76,115),
have been studied. The main feature of these reactions is that
the a1kanes react 1ess rapid1y than the corresponding a1kenes,
aga in, to produce hydrogen cyanide as the preponderant nitrogen
containing product.
illl.2.E.§.raffins
The reactivities of cyc10paraffins with active
nitrogen were found to increase in the order cyc1opropane,
cyc1obutane, cyc10pentane (116), and hydrogen cyanide was the
principal product from aIl three reactants. The reaction of
cyc1opropane has been found to be strong1y inhibited in the
presenc~ of ammonia (85).
Qther~~anic compounds
These include azomethane (117), a1ky1 ch10rides (118),

- 28 -
chloromethanes (161), methylamine (119), methyl cyanide (120),
mercury diethyl (121), methanol (122), ethanol (123), and
cyanogen (124). In aIl of these reactions too, with the
exception of CC14
, (which gave CNCl), and (CN)2' which suffered
decomposition, the main nitvogen containing product was
hydrogen cyanide.
In 1956, Evans ~ al. (100) presented a review of the
reactions of active nitrogen with various organic compounds,
and proposed a 'unified' mechanism based on nitrogen atoms in 4 the S ground state as reactive species. They suggested that
the initial reaction with ethylene was:
This reaction involves a change of spin from three unpaired
electrons in the nitrogen atom to one in the methyl radical,
and the transfer of a hydrogen atom from one carbon atom to
another. A relatively long-lived complex might be formed by
the nitrogen atom and the ethylene molecule to allow both the
change of spin and the movement of the hydrogen atom to occur.
The methyl radicals then react with nitrogen atoms very rapidly,
N + CH; - HCN + 2H + la Kcal.
This reaction is spin-allowed for three out of eight collisions
and might be expected to have a small activation energy. The
two hydrogen atoms can recombine to a hydrogen molecule, or
react with the parent hydrocarbon, or other radicals, to yield

- 29 -
stable products.
The assumption of a relatively long-lived reactant-
nitrogen atom complex was the basis for the formulation of a
'unified' mechanism for reactions of active nitrogen with
organic molecules. The main features can be illustrated by
comparison of the proposed mechanisms for the propylene, propyl
chlorides, and propane reactions:
with the formation of a chemically identical complex.
Differences in the reactions were ascribed to the stability of
the complex. Formation of unsaturated hydrocarbons, as
secondary products, was explained mainly by nitrogen atom
recombination involving the complex,
By appropriate adaptation, the 'unified' mechanism may be
applied to a variety of reactions of active nitrogen with
organic compounds and their derivatives, and has provided a
useful basis for discussing such reactions.

- 30 -
REACTIONS WITH ELEMENTS AND INORGANIC COMPOUNDS
Strutt (3) made a pre1iminary investigation of the
reactions of active nitrogen with vapours of mercury, zinc,
cadmium, sodium and arsenic. The products were exc1usive1y
nitrides.
A study of the reaction of active nitrogen with
germane gave, as products, hydrogen and germanous nitride,
whereas the corresponding reaction with boron trich10ride
yie1ded ch10rine and tetrach10rdiborine (156).
Brennen and Kistiakowsky (139) found that meta1
carbony1s react very rapid1y with active nitrogen, to form
meta1 atoms by a stepwise degradation.
ThLBi t r.Q.gen fami 1y
Perhaps the first reaction in this category that
might be mentioned is the recombination of nitrogen atoms,
either in the gas phase or on the wa11s of the reaction vesse1,
N + N + M
N + W 1/2 N2
+ W .
These reactions have been studied kinetica11y severa1 times.
The recombination reaction is predominant1y homogeneous, and
third order, at pressures above 2.5 mm Hg (127,129). Some of
the rate constants for the homogeneous recombination, k1
, are:
1.0 x 10 16 cc 2 mo1e- 2 sec- 1 (125), 6.19 x 10 15 (126),

- 31 -
5.7 x 10¹⁵ (127), 1.2 x 10 16 (128), and 1.04 x 10 16 (129).
Be10w 2.5 mm Hg a pseudo-first order wall recombination becomes
important, with a recombination coefficient r = k 2 D/ë (where
D = reactor diameter, and C = root mean square atomic ve1ocity).
Values of r reported, for pyrex glass, are:
(127), 3 x 10⁻⁵ (128), and 7.5 x 10- 5 (129).
-5 r = 1.6 x 10
The reactions of active nitrogen with nitrie oxide
and ammonia have a1ready been presented in preceding sections,
and need not be further discussed.
The reaction with nitrogen dioxide has been studied
by many investigators (73,74,86,130,131). The mechanism of
the reaction appears to be:
N + N0 2 - 2 NO
N + NO - N2 + 0
Rate constants of about 0.8 x 10- 11 cm 3 mo1ecu1e- 1 sec- 1 at
o -11 0 ( 500 K (74), and of 1.85 x 10 at 300 K 131), have been
reported.
Nitrous oxide has been found to deactivate

- 32 -
vibrationally excited nitrogen molecules (64), and to undergo a
veri small decomposition, o
less than 5% at 300 C, with active
nitrogen (74).
Khanna and Winkler (136) found that active nitrogen
from a condensed discharge reacts very rapidly with white
phosphorus vapours, to yield a mixture of nitrides. The extent
of the reaction agre~d with that given by the nitric oxide
titration, in a system 'poisoned' with water vapour. However,
in the 'unpoisoned' system the data did not agree with the
value of the nitrogen atom concentration inferred from either
the nitric oxide or the ethylene reaction.
Hydrogen and a reddish-brown polymer, (PN)n' were the
products of the active nitrogen-phosphine reaction (137). This
reaction appeared to involve hydrogen abstraction by the
nitrogen atoms.
The reaction of active nitrogen with hydrogen atoms
appeared to produce only small amounts of ammonia, and to result
only in recombination of nitrogen atoms. No reaction was
observed with molecular hydrogen, even at 3500
C ( 104) .
The reaction of iodine with active nitrogen has been
discussed in a previous section, 'Reactive species in active
nitrogen' . In the reaction with bromine, the spectrum of NBr
was excited by the active nitrogen (133).
Wiles and Winkler (134) found hydrogen chloride to be
decomposed by active nitrogen from a condensed discharge, with

- 33 -
the production of chlorine. The extent of the reaction was
limited, owing presumably to back reactions. On the other
hand, the reaction of hydrogen bromide with production of
bromine, and ammonia, occurred extensively (135).
!he~~en family
Bett and Winkler (143) studied the reaction of active
nitrogen with sulfur. The infrared spectra of the products
showed that N4
S4
and at leasttwo other sulfur nitrides were
present. They postulated two mechanisms, one based on the
nitric oxide value, the other on the hydrogen cyan ide value,
for the nitrogen at0m concentration.
Jacob ~ !!.!. (141) investigated the reaction of
active nitrogen with sulfur dioxide. The amount of S02
decomposed, by active nitrogen from a condensed discharge, in a
system 'poisoned ' with water vapour, increased with S02 flow
rate to a limiting value that was about one-sixth the NO
'titration' value for the active nitrogen concentration. It
appeared that S02 was decomposed by energy transfer from
excited N2
Molecules. In agreement with Smith and Jolly (142),
they observed no S02 decomposition by active nitrogen from a
microwave discharge.
With hydrogen sulphide and carbon disulphide, a great
deal of polymer was formed. Small amounts of ammonia were
also formed in the hydrogen sulphide reaction (140).
Vadlamudy and Winkler (138) have recently studied the
reaction of water vapour with active nitrogen from a condensed

- 34 -
discharge. The maximum water decomposition represented about
one-fifth of the nitrogen atom concentration, estimated from
the nitric oxide 'titration'. The products were main1y
hydrogen and oxygen, with traces of ammonia, nitrite and nitrate
in solution in excess water present. A rate constant of 9 -1-1 0.9 x 10 cc mole sec was estimated. They suggest that
excited nitrogen mo1ecules are the species responsible for the
decomposition of water. Similar experiments with a microwave
discharge gave no evidence of decomposition.
For the reaction of active nitrogen with oxygen atoms,
in the absence of oxygen mo1ecules, a rate constant of 1.83 x 15 2 -2 -1 10 cc mole sec has been obtained (129).
With mo1ecu1ar oxygen, Varney (144) observed smal1
yie1ds of N20, NO and N0
2 , Kistiakowsky and Volpi (86)
investigated the reaction of active nitrogen with oxygen by
using the princip1e of a 'stirred reactor' and a mass
spectrometer. Oxygen was found to react at e1evated
temperatures, but no reaction was observed at room temperature.
Absence of any oxides of nitrogen among the reaction products,
and the appearance of the ~-bands of NO, suggested the
fo11owing mechanism:
kl
- NO + ° N + NO
They reported a rate constant for the first reaction,
kl
= 2 x 10 12 exp(-6,200/RT) -1 -1 cc mole sec .

- 35 -
From studies on the effece or oxygen on the
decomposition of NO in flames, 0 + NO :;::::02
+ .N and
N + NO~N2 + 0, Kaufman and Decker (145) found, indirectly,
kl = 1.7 x 10
13 exp(-7,500/RT) cc mole- l
sec- l.
Mavroyannis and Winkler (146) have studied the
maximum extent: the products, and kinetic characteristics of
the oxygen reaction. The maximum production of oxygen atoms
was found to correspond to the maximum amount of hydrogen
cyanide produced under the sarue conditions. They detected
small amounts of nitrous oxide, nitric oxide, and nitrogen
dioxide in the condensable products. A rate constant
kl
= 2.3 x 10¹² exp(-5,900/RT) cc mole- l
sec- l was calculated.
Clyne and Thrush (87) have also investigated the
kinetics of the active nitrogen-oxygen reaction. They
compared the yields of oxygen atoms produced when nitric oxide
and oxygen reacted completely with active nitrogen. The mean
value of (O)NO/(O)O ' as determined by the nitrogen dioxide 2
titration, was 1.02 ~ 0.03, i.e. active nitrogen reacted to the
same extent with oxygen and nitric oxide. The rate constant
for the oxygen reaction was found to be:
12 ( -1 kl
= 8.3 x 10 exp -7,100/RT) cc mole -1 sec
The conclusions of Mavroyannis and Winkler, relative
to the extent of the oxygen reaction, are compatible with those
of Clyne and Thrush on1y if the ratio NO/HCN were ~qual to unit y
in the two studies. However, without recording a numerical
value for it, Mavroyannis and Winkler do state that the No/HCN

(
- 36 -
ratio was greater than unit y in their study, and it must be
conc1uded that a major discrepancy appears to exist between the
two investigations.
ADDITIVES IN ACTIVE NITROGEN
In the course of the present investigation, sorne
studies were made on the effect of certain additives to the
nitrogen that was passed through the discharge tube. A few
comments about sorne of the ear1ier ana1ogous studies might
therefore be appropriate.
Many years age Rayleigh (3) obse~~ed that the
'Lewis-Rayleigh' afterg10w was considerab1y brightened when
certain gases were added to the discharged nitrogen. In sorne
cases, this brightening occurred if the gas were added either
before or after the discharge. Rather qualitative experiments
were made with various compounds, which were then 1isted in
decreasing order of effectiveness: H2 S, H20, CO 2 ' CO, C2H2 ,
C2H6
, CH4
, 02' Hg, C1 2 , H2' Ar, He, N2 . Experiments by
Wi11ey (147) estab1ished the efficiencies of CO 2 ' N20, N2 and
CO in the order mentioned.
Wi11ey (148) studied the rate of decay of the
afterg10w in the presence of different gases. He found that,
as the concentration of the impurity increased, the wall
reaction diminished and the homogeneous decay increased, up to
a 1imit of 0.1% of impurity present. Higher concentrations
reacted chemica11y with the active nitrogen, and interfered

(
- 37 -
with the normal decay.
L~wis (13) made experiments to ascertain whether the
introduction of water vapour could restore the afterglow in
pure nitrogen. He observed that the existence of the afterglow
depended upon the presence of water vapour. Kaplan (149) was
able to obtain the afterglow only by removing the slightest
trace of hydrogen.
Rayleigh (150) made a careful experiment to study how
the intensity of the afterglow varied when oxygen, in measured
amounts, was mixed with nitrogen before the discharge. He
concluded that the presence of oxygen gave rise to a layer on
the glass that had a favourable effect on the afterglow.
Young ~ al. (151) have given SOme results on the
effect of adding 02' NO or SF 6 , either before or after the
discharge. Nitric oxide and oxygen were capable of increasing
the number of atoms from the discharge to the same extent as
SF6
, but much larger amounts had to be added.
The interaction of NO, 02' NH 3 , NF 3 and SF 6 with
purified active nitrogen has been studied with a mass
spectrometer (152). Addition before the discharge resulted in
a threefold increase in the partial pressure of nitrogen atoms,
whereas, with the exception of SF 6 , addition after the discharge
caused a twofold increase.
Anderson and co-workers (15,153,154) have studied the
effect of 02 and H2' in different proportions, on the intensity
of the nitrogen afterglow. They observed that, with pure

- 38 -
nitrogen, the walls of the reaction vessel had a great affinity
for hydrogen but practically none for oxygen.
THE PRESENT PROBLEM
As indicated previously, earlier studies by
Mavroyannis and Winkler, and by Clyne and Thrush appear to be at
variance in respect of the reactivity of active nitrogen towards
molecular oxygen. The former found the maximum production of
oxygen atoms to correspond to the maximum production of hydrogen
cyanide from the ethylene reaction. On the other hand, the
latter observed the maximum extent of the oxygen reaction to
correspond to the maximum destruction of nitric oxide. Since
Mavroyannis and Winkler found a No/HCN ratio greater than unit y
(although the actual value was not reported), it must be
concluded that there is a real discrepancy between the
conclusions reached in the two studies.
The experimental conditions for the two studies were
by no means identical. In particular, the analytical methods
used to follow the course of the reaction were not the same.
Apart from the different methods for estimating the nitrogen
atom concentrations, the production of oxygen atoms was also
determined in different ways. Mavroyannis and Winkler added
excess nitrogen dioxide to the gas stream, with subsequent
trapping and determination of the amounts of N20 3 , while Clyne
and Thrush 'titrated' the oxygen atoms with nitrogen dioxide in
the gas phase.

( )
- 39 -
The objective of the present work was to
re-investigate the maximum extent of the reaction of active
nitrogen with molecular oxygen, using both experimental
techniques in a single system, with a view to obtaining, if
possible, an explanation for the apparent discrepancy. In
addition to the maximum extent of the reaction, values of its
rate constant were obtained, as another criterion for
comparison.
During the course of the investigation, SOrne attention
was given also to possible factors that might influence the
No/HCN ratio, on the assumption that there might be sorne
conditions under which this ratio would become unity. If these
conditions did exist, and might be ascribed to the system used
by Clyne and Thrush, their yields of oxygen atoms might have
corresponded to maximum yields of hydrogen cyanide from
ethylene, had they made such experiments, and no real dis-
crepancy with the other study existed. As part of this phase
of the study, the effects, on the nitric oxide values, of certain
additives, such as water, hydrogen and oxygen were examined.
As an incidental to the main study, a rough estimate
of the rate constant for the reaction of nitric oxide with
nitrogen dioxide was also obtained. No such value has been
reported previously in the literature.

i 1
- 40 -
Bone dry, 99.7% pure, and dry, 99.995% pure, nitrogen
were obtained from Linde Air Products Ltd. Any oxygen and
water present were removed by passing the gas over copper
o 0 turnings at 400 to 425 C, and through a liquid air trap.
Oxygen, of 99.5% purity (Liquid Carbonic Canadian
Corp. Ltd.) was passed through a liquid air trap to eliminate
traces of water.
Pre-purified hydrogen, 99.9% pure, was obtained from
Matheson Co. lnc.
Nitric oxide, 99% pure, was obtained from Matheson
Co .. lnc., and further purified by trap-to-trap distillation
through a column of 'caroxite', which is capable of absorbing
nitrogen dioxide. The whole procedure was repeated many times,
until aIl the nitrogen dioxide was removed, as indicated by the
absence of blue N20 3 when the gas was passed into a trap cooled
in liquid air.
Nitrogen dioxide was prepared by oxidation of pure
nitric oxide with an excess of pure oxygen. When the reaction
was complete, and the blue N20 3 was no longer visible in the
condensed material, the excess oxygen was pumped off. The
nitrogen dioxide was kept frozen, when not in use, to prevent
its photochemical decomposition, and KEL-F stopcock grease was
used in aIl parts of the apparatus in contact with the nitrogen

___ ••• ____ • __________ .. _-___ .... ~ 'W
- 41 -
d ioxide. During the experiments, nitrogen dioxide was never
allowed to come into contact with mercury, since it reacts
instantaneously. Frequent checks were made for the presence
of N2
03
and, whenever necessary, the oxidation was repeated.
Ethylene, 99.75% pure, was obtained from Matheson Co.
Inc. It was frozen in a liquid air trap and any traces of air
and non-condensable gases were pumped off. Further purification
was made by two trap-to-trap distillations, in which only the
middle fraction was retained.
APPARATUS
The apparatus employed was a fast flow vacuum system
constructed entirely from Pyrex glass, except for the microwave
discharge tube which was of quartz. The assembly is shown
diagramatically in Fig. 3.
Nitrogen from a cylinder was passed through a manostat,
B, containing di-but yI phthalate. The nitrogen then passed
through a needle valve, NVl' into a furnace, F, containil1g copper
turnings at 4000
- 4250
C, to remove traces of oxygene A liquid
air trap, Tl' removed possible traces of water, after which the
purified nitrogen was passed through a capillary flowmeter, Cl'
into the discharge tube.
The dis charge tube, made of quartz tubing 18 cm long
and 12 mm I.D., was connected to the pyrex system by graded
seals. The discharge was produced by a microwave unit, through
the rectangular wave-guide, D.

- -- ----------------------_._------_.-------
- 42 -
DIAGRAM OF THE APPARATUS

FLOW
FLOW SYSTEM
NO.3
M4 NV3
FLOW SYSTEM lV4 NO.4
Ms NV4 Ms
"
FLOW SYSTEM NO. 1
MCLEOD GAUGE
V.C.
p (r:,===~,.,
T~
F
~
N2
INLET
B

- 43 -
The discharged nitrogen was passed through a 300 C.c.
bulb, VS' prior to its admission to the reaction vessel. This
allowed the 'pink' (Broida) glow to dissipate, and only the
yellow Lewis-Rayleigh glow to be present in the reaction vessel
proper.
The reaction vessel was a straight Pyrex tube, 80 cm
long and 28 mm l.D. A fixed jet, JI' was placed in the centre
of the gas stream, about 8 cm below the inlet from the discharge.
The jet was a bulb with five fine holes spaced at equal
intervals around its circùmference. At the bottom end of the
reaction vessel were two vacuum couplings, V.C., (Veeco quick-
vacuum couplings, type C). These were cemented, with epo~y
resin, to tubes attached to the B40 ground joint. The two
jets, J2
, J3
, with their lower ends connected by tygon tubing
to the flow systems, could be moved through the couplings to
any desired positions in the reaction vessel. These jets were
also bulbs with four fine holes located symmetrically around
their periphery.
To obtain different reaction temperatures, the
reaction vessel was heated with a suitable furnace that covered
the entire length of the reactor. A narrow slit along the
front of the furnace gave visibility for gas phase 'titrations'
with either nitric oxide or nitrogen dioxide. The temperature
inside the reaction vessel was measured with a copper-constantan
thermocouple, placed in a weIl about 1 cm below the jet, J3
.
A second reaction vessel, Fig. 4, identical with the

- 41~ -
(
SECOND REACTION VESSEL
(A ft e r Ma v r 0 yan n i san cl Win k 1 e r, Re f. 146)

n K
:'\ lL_ ---1 A
3.7 cm. -'/1 \l __ J_'_ --B -t
3.6cm. TH :) - , ------ _1
C i 6 .7cm.
-'/1 :'\ ~ lL. ------ l
D
1 9.5cm.
l - , -------1 Il ' J
E
L

) /'
.... _._-._--------------_._--_ .... -- ._ ........ _----_ .... _----
- 45 -
one constructed by Mavroyannis and Winkler (146), was used for
some experiments. It consisted of a Pyrex tube 26 cm long arid
22 mm I.D., with five small inlets at different points, as shown
in Fig. 4.
Condensable gases that issued from the reaction tube
were trapped in, T2
, at liquid air temperature. This trap
could be easily isolated from the system, to permit distillation
of the reaction products into a small detachable trap, L. A
second liquid air trap, T3 , protected the pump from harmful
ga se s . Another pumping route, P, permitted the trap, T2 , to 1
be by-passed through a three-way stopcock.
Three flow systems, which may be designated as No. 2,
No. 3 and No. 4, were connected to the reaction system. Flow
system No. 2 could be connected to either jet, JI' or jet, J 3 .
Flow system No. 3 wasconnected to the same jets, but used
almost exclusively for jet, J3
. Flow system No. 4 was connected
to jet, J 2 , as weIl as to jets, JI and J 3 . It was used
primarily for jet, J 2 , and occasionally for jet, JI'
The flow systems, No., 2 and No. 4, each consisted of
a large known volume, (V2
, V4
), a smaller ballast volume, (BV2
,
BV4
), a capillary flowmeter, (C 2 , C4
), a needle valve, (NV 2 ,
NV4
), and two manometers (M2M3 and M5,M6)' Flow system No. 3
was essentially the same, but without a ballast volume and
second manometer.
Controlled, small amounts of water vapour, hydrogen or
oxygen were added to the nitrogen, for some experiments. The

- 46 -
water vapour system consisted of a reservoir, W, and a capillary
flowmeter, CS' Since the vapour pressure of the water remained
essentially constant, at room temperature, a constant amount of
-6 water, approximately 0.1 x 10 moles/sec, passed through the
capillary into the nitrogen stream. About the same amount of
hydrogen or oxygen could be admitted to the system by another
line.
The main pump was a Hypervac 23, which gave an
-3 ultimate vacuum of at least 5 x 10 mm Hg. A Duo-Seal vacuum
pump was used for purification of reactants, evacuation of
absorbers, etc. Pressures were measured with a McLeod gauge.
THE MICROWAVE DISCHARGE
Active nitrogen was produced in a high freqqency
microwave discharge, generated with a microwave diathermy unit
manufactured by Raytheon Manufacturing Co. ('Microtherm',
No. KV-I04F, Model CMD-13). The maximum rated output was 125
watts, at a frequency of 2450 Mc/sec. The input voltage was
supplied from a Sola constant voltage transformer. After a
warm-up period of three minutes, the discharge was initiated
with a Tesla cOil, and the power subsequently held constant at
90% of the maximum value.
The microwave discharge has the advantage, over a
condensed discharge between electrodes, of producing a more
constant active nitrogen concentration for longer periods of
time.

- 47 -
MEASUREMENT OF FLOW RATES
(a) Nitrogen
Nitrogen was allowed to flow through the apparatus.
The needle valve, NV I , was adjusted until the desired pressure
in the reaction vessel was indicated by the McLeod gauge. At
the same time a constant pressure head was obtained on
manometer, Ml' The nitrogen flow rate was determined from the
rate of evacuation of a known volume, VI' for different
pressure differentials across the flowmeter, Cl' measured on
manometer, Ml'
The known volume of the flow system, and the ballast
volume, contained one of these reactant gases at the beginning
of each experiment. The pressure of the gas in the known
volume was kept much higher than the pressure in the ballast
volume. After the reaction was begun, the pressure (flow
head) in the ballast volume was kept constant by manipulating
the needle valve. The average flow rate of the gas during the
experiment eould be accurately determined by measuring the
pressure difference in the known volume before and after the
experiment, assuming applicability of the ideal gas law, i.e.
dP dt
dn ~! dt V
or
where :~ is the molar flow rate, ~f
dn = È.R V dt dt RT
.6.P -- V = calibrated volume, dt'
R = gas constant and T = ambient temperature.

- 48 -
(c) Nitrogen dioxide
Flow rates of nitrogen dioxide were controlled by a
stainless-steel needle valve, and measured by a capillary
flowmeter. The flow rate was determined as described above
for the other reactant gases. However, N2
04
was present
'initially in the known volume in equilibrium with N02
, and, in
the experiments, it dissociated completely when it entered the
* reaction vessel at the lower pressure of a few mm Hg. Hence,
dP a correction factor had to be applied to dt in calculating the
flow rate of N02
into the reaction vessel. In comput ing the
correction factor, both the fraction of N204
present in the gas,
in the known volume, and the change of the dissociation
constant with pressure, were considered. The values for the
dissociation constant of the
equilibrium were taken from Verhoek and Daniels (157). The
pressure of the nitrogen .dioxide was measured by manometers
containing di-but yI phthalate (density at 2So
C, 1.045 gr/cm 3 ).
EXPERIMENTAL PROCEDURE
*
The system was kept under vacuum except when it was
The complete dissociation of N204
is not valid at higher
pressures in the reaction vessel. In that case the degree
of dissociation of N~04 should be taken into account, in
calculating the flow rate of N02
.

-----_._--- .. _--_. __ ._ .......... _.... _._------_._----_.-
)
- 49 -
necessary to re-grease the stopcocks. AlI stopcocks and ground
joints, except those in contact with nitrogen dioxide, were
greased with Dow-Corning high-vac~um silicone grease.
For high temperature experiments, the furnace of the
reaction vessel was turned on, and the experiment started when
the desired temperature was achieved, as measured by the
thermocouple. Before each experiment the traps, Tl' T2 and
T3
, were immersed in liquid airs and the system was checked for
leaks with the McLeod gauge. The nitrogen flow was then
started, the microwave discharge put into operation, and allowed
to operate for about one hour to obtain a constant concentration
of active nitrogen. The pressure in the reaction vessel was
measured before starting the reaction, whereas the temperature
was recorded during the experiment. Reaction was initiated by
turning on the flow of oxygen, which was maintained at the
desired value by manipulating the needle valve, NV 2 , to keep
the flow head of the manometer, M3' constant (Fig. 3).
The production of oxygen atoms was followed by either
the nitrogen dioxide gas-phase 'titration', or by condensation
of N2
03
in the presence of excess nitrogen dioxide. In the
former method, nitrogen dioxide was admitted to the reaction
vessel, at a point 5 cm below the oxygen inlet, and its flow
rate increased until a yellow-green glow gave way to a dark
end-point. In the latter method, considerable excess of
nitrogen dioxide was added, also 5 cm below the oxygen inlet,
and the resultant N2
03
subsequently condensed into trap, T2
.

( \..
- 50 -
The reaction was stopped, by using the by-pass, P,
after a desired time interval, measured accurately with a stop-
watch. At the same time, the flows of nitrogen dioxide and
oxygen were shut off, while that of active nitrogen was
maintained through trap, T3 , for subsequent experiments. The
trap, T2 , containing N20 3 and non-condensables, was thus
isolated from the system and evacuated, to 5 microns, with the
auxiliary pump. The liquid air surrounding this trap was then
removed, and the N20 3 allowed to distil into the trap, L, of
the analytical system.
For measurements of rate constants, oxygen (flow
system No. 2) was introduced into the reaction vessel through
the top fixed jet, JI' Nitric oxide (flow system No, 4) was
admitted to the reaction vessel through the movable jet, J2
,
located 50 cm below the top fixed jet, JI' Introduction of
nitric oxide not only stopped the reaction, by removing aIl the
nitrogen atoms, but also provided a measure of the nitrogen
atom concentration at that point. An excess of nitrogen
dioxide (flow system No. 3) was then admitted to the reactor
through the second movable jet, J 3 , located 5 cm below the
first movable jet, J 2 , and the resultant N20 3 condensed as
described above.
During the present investigation a coil of silver
wire was placed prior to the trap, T2 , to facilitate oxygen
atom recombination, and thus prevent ozone formation in the
trap (146).

c)
- 51 -
~UREMENT OF N- AND O-ATOM CONCENTRATIONS
The present investigation required measurements of
nitrogen and oxygen atom concentrations. As indicated
previous1y, nitrogen atom concentrations were measured by using
either the nitric oxide gas-phase 'titration', or the maximum
hydrogen cyanide production from èhhy1ene. On the other hand,
oxygen atom concentrations were determined by either the
nitrogen dioxide gas-phase 'titration' or the method based on
addition of excess nitrogen dioxide.
The nitric oxide gas 'titration', for nitrogen atoms,
has a1ready been discussed ('Determination of nitrogen atom
concentration', P. 18), and need not be e1aborated further.
When the hydrogen cyanide method was used for
determlning nitrogen atom concentrations, hydrogen cyan ide was
initia11y co11ected in trap, T2 , which, in turn, was evacuated
to 5 microns to remove non-condensables. The 1iquid air
surrounding the trap, T 2 ,was then removed, and a thick layer
of carbon tetrach10ride was frozen on the trap by immersing it,
severa1 times, in carbon tetrach10ride. As the carbon tetra-
ch10ride 1ater me1ted, the hydrogen cyanide disti11ed slow1y,
with a1most no po1ymerization, into the detachab1e trap, L,
which contained about 15 cc of disti11ed water, previously
evacuated and frozen in 1iquid air. After the distillation
was complete, the trap was removed and warmed to room
temperature. The solution was then made alka1ine with 5 ml
ammonium hydroxide solution (5 N) and titrated with si1ver

- 52 -
nitrate, using 2 ml potassium iodide 10% as indicator (158).
To determine the oxygen atom concentration by a
gas-phase -'titration', nitrogen dioxide was added to the
reaction mixture, to promote the simple and very fast
reaction (98,159),
With a flow rate of nitrogën dioxide less than that of oxygen
atoms, ail the nitrogen dioxide was consumed to form an
equivalent amount of nitric oxide. The resultant nitric oxide
could then react with the residual oxygen atoms to produce
excited nitrogen dioxide, which emitted a yellow-green
continuum. However, when an amount of nitrogen dioxide
equivalent to the O-atom flow rate was added, the glow was
completely and sharply extinguished, and this flow rate of N02
was taken to correspond to the O-atom concentration.
The other method, used by Mavroyannis and Winkler
(146) to measure oxygen atom concentrations, involved addition
of excess nitrogen dioxide, such that the oxygen atoms reacted
rapidly to form a corresponding amount of nitric oxide. The
resultant nitric oxide, in the presence of excess nitrogen
dioxide, yielded N203
, which was finally condensed, as described
earlier, into the evacuated trap, L, immersed in liquid air to
a fixed mark.
A known pressure of oxygen, measured by the manometer,
M7 (with concentrated sulfuric acid, density 1.84 gr/cm3 , as

C)
- 53 -
manometric f1uid), was admitted from a storagebu1b, after
which the stopcock of the trap, L, was shut off and the 1iquid
air removed to permit oxidation of the N2
0 3 ,
After severa1 minutes, when the oxidation was complete, the
trap was again immersed in liquid air, and the pressure
measured. The difference between the two readings gave the
pressure of oxygen consumed at 1iquid air temperature.
The amount of oxygen consumed was ca1cu1ated from
the relation:
where .0.P = Pl - P 2
R = Gas constant
V' = Volume of V6
plus tubing
T' = Ambient temperature
VL
Volume of trap, L
TL = Liquid air temperature.
Since a temperature gradient existed between V' and
VL ' this relation was not comp1ete1y accurate (160). To
reduce the error, the temperature, TL' was replaced by an
'effective temperature' obtained by measuring the pressure
exerted by a known amount of nitrogen under the same conditions.
The 'effective temperature' was found to be about BloK.

- 54 -
The amount of nitric oxide, hence the oxygenatom
concentration, was found by multiplying by two the amount of
oxygen consumed, since from the oxidation reaction one mole of
oxygen is equivalent to two moles of N20 3 (or NO). Although
this method was time consuming, it was preferred, since it
eliminated the difficulty of accurately determining flow rates
of nitrogen dioxide.
'Blank' experiments, with known amounts of nitric
oxide, were made to establish the validity of this method.
The conditions were the same as thosè that prevailed later in
the reaction of active nitrogen with oxygen, except that
nitrogen flowed through the apparatus without the microwave
discharge. Nitric oxide, at a known flow rate, was introduced
into the reaction tube through the jet, J 2 , located 60 cm below
the top fixed jet, JI' An excess of nitrogen dioxide was
admitted to the system through the jet, J3
, 5 cm below the
point at which nitric oxide was introduced, i.e., 5 cm below
The resultant N2
03
was subsequently trapped and
determined as described previously.
AlI experiments were made at either room temperature,
o or at about 400 C, at a pressure of 2 mm Hg. This method was
about 97% efficient for estimating nitric oxide concentrations,
as shown in Table 1. A correction factor of 1.03 was therefore
used when the method was applied in the subsequent experiments
with oxygen.

c:)
- 55 -
Table 1
'BLANK' EXPERIMENTS FOR THE TRAPPING OF NITRIC
* OXIDE. BY USING EXCESS NITROGEN DIOXIDE
Known Trapped NO NO Efficiency
moles/sec x 10 6 moles/sec x 10
6 %
*
-------1. 57 1. 53 97.5
1. 75 1. 72 98.3
1. 79 1. 70 95.0
2.09 2.03 97.1
3.10 3.00 96.8
Average efficiency: 97%
It should be emphasized, for reasons that will
appear later, that this check of the
ana1ytica1 method, was made with the 10ng
tube reactor, and not with the Mavroyannis
Wink1er type of reactor.

- 56 -
RESULTS
THE REACTION WITH OXYGEN
Comparison of N- and O-atom concentrations, estimated by different me~hods
No quenching of the familiar yellow afterglow was
observed when oxygen was introduced into the stream of active
nitrogen, at room temperature. At higher temperatures, above
o about 100 C, and with increasing oxygen flow rates, the yellow
glow gave way to a blue glow. The blue glow was observed at
lower oxygen flow rates, as the temperature was increased,
while, at a given temperature, increase of oxygen flow rate
caused a graduaI colour change from yellow (afterglow) to blue,
to darkness, to pale yellow-green. The blue glow was due to
the ~ and r bands of nitric oxide, whereas the yellow-green
glow represented the air-glow continuum, emitted by excited
nitrogen dioxide. The yellow-green glow has been reported in
only one earlier study (87), whereas the other observations
have been made on at least three previous occasions (86,87,146).
In the present investigation, the extent of the
active nitrogen-oxygen reaction was first examined by using the
nitric oxide and nitrogen dioxide 'titration' techniques, for
measuring nitrogen and oxygen atom concentrations respectively.
The active nitrogen concentration, at a certain
definite level in the reactor, was determined by 'titration'
with nitric oxide to the end point. After the end point was

C)
Il
- 57 -
established, the corresponding nitric oxide flow rate was
maintained steady, while nitrogen dioxide was admitted 5 cm
below the nitric oxide jet, to 'titrate' the oxygen atoms that
resulted from the N + NO reaction.
Similar experiments were made, in turn, with
molecular oxygene Oxygen was introduced into the stream of
active nitrogen, at the same point that nitric oxide had been
admitted previously. The production of oxygen atoms in the
N + 02 reaction was then estim~ted by the nitrogen dioxide
'titration', by adding nitrogen dioxide 5 cm below the inlet
point of oxygene Increasing flow rates of oxygen were used,
until the maximum oxygen atom production was attained .
. In Table 2 are recorded the yields of oxygen atoms
produced when nitric oxide and oxygen, respectively, reacted
completely with active nitrogen, at 2 mm Hg pressure, at
different temperatures and at different levels in the reaction
tube.
In a second series of experiments, nitrogen atom
concentrations were estimated by the maximum hydrogen cyan ide
production from ethylene, and oxygen atom concentrations, from
the active nitrogen-oxygen reaction, by the method based on
addition of excess nitrogen dioxide, to form N2
03
.
Hydrogen cyanide production was determined 60 cm
below the fixed jet, aIl experiments being made at 400 o C, and
at pressures of 1 and 2 mm Hg. The results are shown in
Table 3, and Figs. 5 and 6. Maximum oxygen atom concentrations

)
- 58 -
were then determined, for the same conditions as those that
prevailed during the corresponding reaction with ethylene.
Oxygen was also admitted to the stream of active nitrogen, at a
point 60 cm below the fixed jet, and excess nitrogen dioxide
added 5 cm below this point, to form N203
, which was trapped
and estimated as outlined previously. The maximum oxygen atom
o concentrations thus determined, at 400 + 2 C, and at pressures
of 1 and 2 mm Hg, are shown in Table 4.
RATE CONSTANTS FOR THE N + 02 REACTION
To determine the rate constant for the N + 02
reaction, the concentrations of unreacted nitrogen and oxygen
atoms were determined after a known reaction time. AlI
experiments were made at the pressure of 3 mm Hg, and continued
for 100 seconds.
Molecular oxygen, at a known flow rate, was admitted
to the reaction tube through the top fixed jet, JI' Nitric
oxide was introduced into the gas mixture through the jet, J2
,
located 50 cm below the inlet of oxygen, i.e. 50 cm below the
fixed jet, JI' For any given flow rate of nitric oxide, the
end point of the nitric oxide 'titration' was obtained and
maintained. This measur2d flow rate of nitric oxide gave an
estimation of the nitrogen atom flow rate at the end point, and
simultaneously produced an equivalent amount of oxygen atoms.
At the same time, it stopped the reaction of active nitrogen
with oxygen, by removing aIl the nitrogen atoms from the gas
stream.
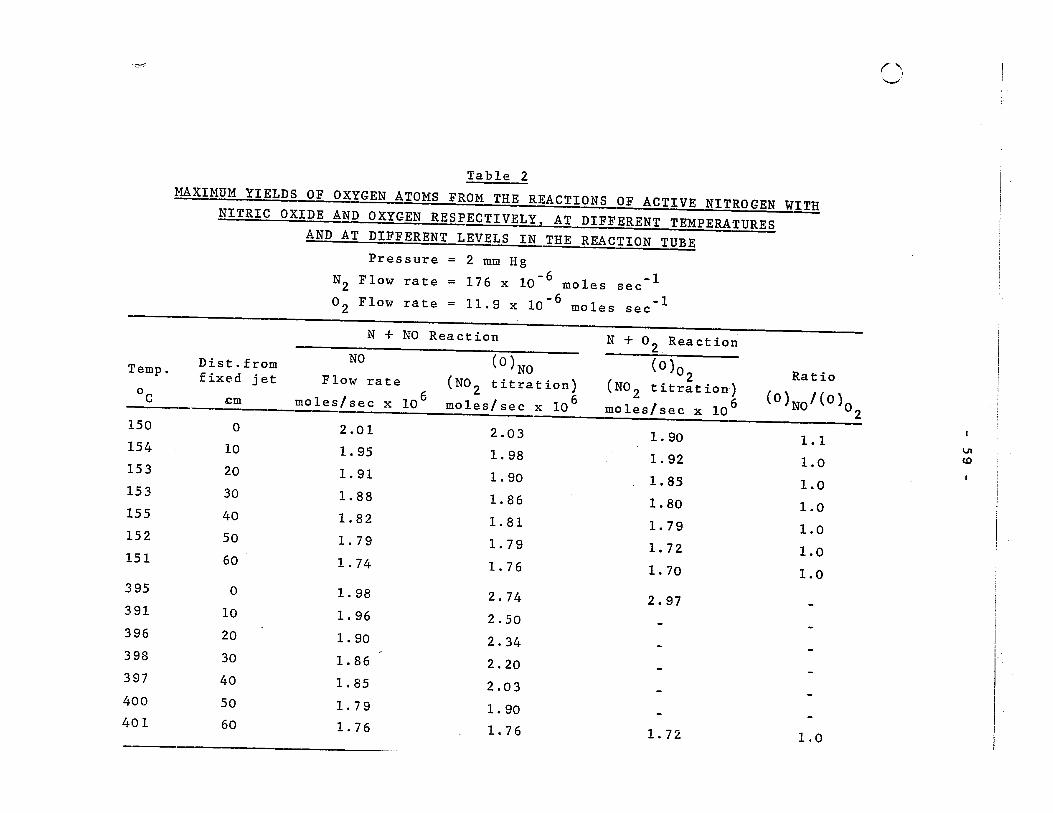
"-..-(.
Temp.
Oc
150
154
153
153
155
152
151
395
391
396
398
397
400
401
Table 2 MAXIMUM YIELDS OF OXYGEN ATOMS FROM THE REACTIONS OF ACTIVE NITROGEN WITH
NITRIC OXIDE AND OXYGEN RESPECTIVELY, AT DIFFERENT TEMPERATURES
Dist.from fixed jet
.cm
o 10
20
30
40
50
60
o 10
20
30
40
50
60
AND AT DIFFERENT LEVELS IN THE REACTION TUBE Pressure
N2
Flow rate
O2
Flow rate
2 mm Hg -6 -1 = 176 x 10 moles sec
-6 -1 = Il.9 x 10 moles sec
N + NO Reaction N + O2 . Reaction
(0)0 NO
Flow rate 6 moles/sec x 10
2.01
1. 95
1. 91
1. 88
1. 82
1. 79
1. 74
1. 98
1. 96
1. 90
1. 86
1. 85
1. 79
1. 76
(0 )NO (N0 2 titration)
6 moles/sec x 10
2.03
1. 98
1. 90
1. 86
1. 81
1. 79
1. 76
2.74
2.50
2.34
2.20
2.03
1. 90
1. 76
2 (N0
2 titration) 6 moles/sec x 10
1. 90
1. 92
1. 85
1. 80
1. 79
1. 72
1. 70
2.97
1. 72
Ratio
(0)NO/(0)02
1.1
1.0
1.0
1.0
1.0
1.0
1.0
1.0
('1 ',-,
VI co

... :::-,,;-
Table 3
MAXIMUM HYDROGEN CYANIDE PRODUCTION FROM THE REACTION OF
ACTIVE NITROGEN WITH ETHYLENE
o Temperature 400 C
Pressure z 1 mm Hg Pressure - 2 mm Hg
C2H4 HCN C2H4 HCN
Flow rate Produced Flow rate Produced
molës/sec x 10 6 moles/sec x 10 6 moles/sec x 10 6 moles/sec x 10
2.52 0.21 3.50 0.86
3.50 0.21 4.50 0.77
5.06 0.24 7.40 0.92
7.60 0.24 10.00 1.00
9.67 0.24 Il.30 0.95
13.90 0.99
14.50 1.00
Maximum HCN production at 1 mm Hg = 0.24 x 10- 6 moles
Maximum HCN production at 2 mm Hg 0.98 x 10- 6 moles
-1 sec
-1 sec
6
1 1 '-'"
0'\ o

Table 4
MAXIMUM YIELDS OF OXYGEN ATOMS FROM THE REACTION OF ACTIVE NITROGEN WITH OXYGEN. ESTIMATED WITH EXCESS NITROGEN DIOXIDE
Pressure
N2 Flow rate
O2
Flow rate
Max. HCN production
NO rtitration r value
Distance from fixed jet = 60 cm o
Temperature 400 + 2 C
1 mm Hg Pressure = 2 mm Hg -6 -1 = 63 x 10 moles sec
-6 -1 = 11.9 x 10 moles sec -6 -1 = 0.24 x 10 moles sec
-6 -1 N2 Flow rate = 176 x 10 moles sec -6 -1
O2 Flow rate = 11.9 x 10 moles sec -6 -1 Max. HeN production = 0.98 x 10 moles sec
-6 -1 0.42 x 10 moles sec 'titration r value -6 -1
NO 1.76 x 10 moles sec
Ratio Ratio Maximum [0] Ratio Ratio Maximum [0] production
6 moles/sec x 10
N(HCN)!(O)O 2
N(NO)!(O)O 2
product ion N(HCN)!(O)O N(NO)!(O)o 6 moles/sec x 10 2 2
0.49
0.36
0.40
0.40
0.34
0.49 0.85 1. 55
0.66 1. 16 1. 55
0.60 1.05 1. 60
0.60 1.05 1. 63
0.70 1. 23 1. 67
1. 60
Average N(HCN)!(O)o at 1 mm Hg = 0.61 + 0.05 2
Average N(NO)/(O)O at 1 mm Hg = 1.06 + 0.10 2
Average N(HCN)!(O)O at 2 mm Hg = 0.61 + 0.02 2
Average N(NO)!(O)o 2
at 2 mm Hg = 1.09 + 0.02 -
0.63 1.13
0.63 1.13
0.61 1.10
0.60 1.07
0.58 1.05
0.61 1.10
;
0\ ....

)
- 62 -
HYDROGEN CYANIDE PRODUCTION AS A FUNCTION
OF ETHYLENE FLOW RATE, AT 1 mm Hg

-12 x 0 IJJ Cf)
" Cf) IJJ ...J 0 ~ -0 w ü :::> 0 0·2 0 0:: 0..
Z 0 ::c
2 4 6 8 10 12
C2 H4 FLOW RATE (MOLES/SEC XI06)

,)
- 63 -
Figure 6
HYDROGEN CYANIDE PRODUCTION AS A FUNCTION
OF ETHYLENE FLOW RATE, AT 2 mm Hg

-~ )(
0 LLI (J)
......... (J) LLI ...J 0 ~ '-0 -0 0-8 LLI 0 :::l 0-6 0 0 a:: Q.
0-4
z 0·2 0 :J:
2 4 6 8 la 12 14 16
C2 H4 FLOW RATE (MOLES/SEC X 106)

'\ )
- 64 -
While the nitric oxide 'titration' was maintained, a
considerable excess of nitrogen dioxide was introduced through
the jet, J3
, located 5 cm below the point at which nitric oxide
This was admitted to the system, i.e. 5 cm below the jet, J 2 .
allowed an estimation of the total oxygen atom concentration
that resulted from the active nitrogen-oxygen reaction, at the
top fixed jet, JI' and from the nitric oxide 'titration' 50 cm
below this jet. The oxygen atom concentration at time t (50 cm
below the top fixed jet, ~l) was therefore equal to:
[Olt = [O]Total - [O]N+NO = [O]Total - [NO]t
The first step of the reaction of active nitrogen
with oxygen can be represented by
k l - NO + 0 , ( l)
while the much moré rapid reaction
N + NO - N2 + 0 (2)
removes the nitric oxide formed in reaction (1).
Other competitive reactions that may be involved in
the reaction mixture of active nitrogen with oxygen are:
N + N + M - N2 + M (3)
N + Wall - ~N2 + Wall (4)
o + 0 + M - O2 + M (5)

- 65 -
o + Wall - %0 2 + Wall (6)
o + O~ + M - 0 + M 2 3 (7)
N + 0 + M - NO + M (8)
NO + 0 + M - N0 2 + M ( 9)
These reactions are known to cause the disappearance of
nitrogen and oxygen atoms to a limited extent (87,146).
Reaction (4) may be neglected for the pressure of 3 mm used in
the present experiments, since it has been found to be
relatively unimportant at pressures higher than about 2.5 mm
Hg (127,129). The termolecular reactions (7), (8) and (9) are
probably of little significance, compared with the bimolecular
processes, (1) and (2); it might be noted, also, that neither
nitric oxide, nor nitrogen dioxide, has been found in the
reaction products from experiments of short duration (146).
Rate constants were calculated from the data obtained,
neglecting reactions (3) to (9), on the assumption that the rate
controlling step is reaction (1). The integrated rate
cquation used for the calculations may be written,
2.303 log
t[(N) - 2(02
) ] o 0
This was adapted to a fast flow system, with complete mixing,
to give the expression

~)
where:
- 66 -
2.303
[ (N) -o
k l second arder rate constant
(N)o = initial nitrogen atom flow rate
(0 2 )0 = initial oxygen flow rate
(N)t nitrogen atom flow rate at time t
(O)t = oxygen atom flow rate at time t
b total flow rate
R gas constant
T = absolute temperature
v = volume of the reaction tube
P total pressure.
The results for individual experiments, at different
temperatures, are given in Table 5. These data gave a
satisfactory Arrhenius plot, shown in Fig. 7, from which an
activation energy of 7 Kcal/mole was estimated for reaction (1).
12 Extrapolation of the plot to lIT = 0 gave a value of 3.76 x 10
-1 -1 cc mole sec for the pre-exponential factor over the
temperature range 4530
to 6030
K. Accordingly, the rate
constant may be written:
k l = 3.76 x 10¹² exp(-7,000/RT) cc mole- l -1
sec

..,,~c;",./
Table 5
VARIATION OF k l AS A FUNCTION OF TEMPERATURE
Pressure 3 mm Hg N
2 Flow rate -6 -1 352 x 10 moles sec
(N) -6 -1 Flow rate = 3.67 x 10 moles sec 0
Temp. (0 2 ) 0 (O)t (N)t Oc moles/sec x 10 6 moles/sec x 10 6
moles/sec x 10 6
180 4.01 0.55 2.68 180 4.62 0.76 2.65 180 4.80 0.78 2.57
265 4.20 1. 72 1. 74 265 4.23 1.55 1. 79
335 2.92 1. 58 1. 87 330 3.35 1. 53 1. 47 330 3.59 1. 56 1. 61
k l -1 -1 cc mole sec
2.09 x 10 9
1.65 x 10 9
1.69 x 10 9
Av. 1.81 x 10 9
5.77 x 10 9
5.71 x 10 9
-Av. 5.74 x 10 9
1.25 x 10¹⁰
1.43 x 10¹⁰
1.12 x 10¹⁰
Av. 1. 26 x 1010
r "' , )
'-,
C'\ -..J
1
'1.
1 1 1 1 .
=)
- 68 -
Figure 7
ARRHENIUS PLOT OF THE REACTION OF ACTIVE
NITROGEN WITH OXYGEN

o
-~
C> o ...J
Il
10
9
1·6 1·7 1·8 I·g 2·0 2·1 2·2 2·3
103; T (OK- I )
)
- 69 -
THE EFFECT OF ADDITIVES ON THE NITRIC OXIDE VALUE
Just as the experiments to determine the rate
constants for the active nitrogen-oxygen reaction were almost
completed, it was observed in the laboratory that, for active
nitrogen produced in a condensed electrode discharge,
consecutive nitric oxide 'titrations' at intervals over a long
period of time, gave decreasing values of the nitrogen atom
concentration. For example, a decrease of the 'titration'
value from 8 micromoles/sec to 2 micromoles/sec was possible
during a five-hour period. After sufficiently long time
(4 to 5 hours), the nitrogen atom concentration, as measured by
this 'titration', generally attained a steady value. After
this value was established, measurement of the nitrogen atom
concentration by the maximum hydrogen cyanide production from
ethylene showed that the NO/HCN ratio was equal to unity.
These results prompted a study to determine whether
the active nitrogen produced by a microwave dis charge might
behave in a simi1ar manner. If it did, and these were the
conditions of the ear1ier investigations, the NO/HCN ratio
might have been unit y, and no rea1 discrepancy have existed
between the two investigations of the active nitrogen-oxygen
reaction by Mavroyannis and Wink1er (146), and C1yne and
Thrush (87).
With active nitrogen flowing through the reaction
vesse1,from the microwave discharge, nitric oxide 'titrations'

(~)
- 70 -
were made at about hourly intervals, at the top fixed jet, JI'
The results, for pressures of 2, 3 and 4 mm Hg, are shown in
Table 6, and Fig. 8. Unlike the behaviour with the condensed
electrode discharge (136), the results showed no appreciable
change, with time, of the nitric oxide 'titration' value.
Since there was no effect of operating time on the
nitric oxide 'titration' value, with active nitrogen from a
microwave dis charge, it seemed desirable to study the
possibility that this value might change with the introduction
of foreign gases to the system. This effect was also observed
by contemporary colleagues in the laboratory, aga in, with
active nitrogen produced in a condensed electrode dis charge.
The effect of water vapour was first studied, by
* pre-mixing it with nitrogen and passing the mixture into the
dis charge tube. The 'pink' (Broida) glow was not present in
the bulb, V5 , under these conditions. The active nitrogen was
then 'titrated', every hour, with nitric oxide at the top fixed
jet.
When the active nitrogen concentration was constant,
the water supply was stopped to observe how the system behaved.
It required only seconds for the system to return to its previous
condition. This was easily recognized from the colour
intensity of the nitrogen afterglow, and from the return of the
~'(
A new grade of nitrogen, 99.995% pure, was used for aIl the experiments that followed.

c}
- 71 -
'pink' (Broida) glow in the bulb, VS' The results, thus
obtained, at the three pressures are shown in Table 7, and
Fig. 9.
The effect of water vapour introduced after the
microwave discharge, but before the bulb, VS' was then studied.
The 'pink' (Broida) glow was again quenched in the bulb, VS'
As before, nitric oxide 'titrations' were made, every hour, at
the top fixed jet. After two hours of operation of the
microwave dis charge, the flow of water vapour was stopped,
whereupon the 'pink' (Broida) glow returned, almost immediately,
to the bulb, VS' and the yellow afterglow to its original
intensity (visual observation). The nitric oxide 'titration'
values, at different times, again over the pressure range 2 to
4 mm Hg, are recorded in Table 8, and shown in Fig. 10.
Finally, pure active nitrogen, in the absence of
added water vapour, was 'titrated', every hour, with pure
nitric oXide, at the top fixed jet. When the nitric oxide
'titration' had achieved a constant value, a mixture of water
vapour and nitric oxide was used to 'titrate' the pure active
nitrogen, every hour, for the next two hours. Then, pure
nitric oxide, without water vapour, was used once again to
determine the active nitrogen concentration. The results are
shown in Table 9, and Fig. Il.
The observation that the system returned to normal
conditions very quickly, after the flow of water vapour, through
the dis charge, was stopped, suggested that the water was

- 72 -
C) dissociated in the discharge and probably had little influence
as a 'poison' against wall recombination. H4n there been a
real 'poisoning' effect, it might have been e~pected that, with
cessation of the flow of water vapour, the nitrogen atom
concentration should have decreased over a considerable period
of time, as adsorbed water was removed from the wall of the
reaction vessel. On the other hand, if dissociation of the
water vapour was extensive, it seemed likely that hydrogen,
introduced before the microwave dis charge, and possibly oxygen
also, should behave in a manner analogous to water vapour added
before the discharge. Accordingly, a study was made of the
effect, on the nitric oxide 'titration' value, of adding
hydrogen and oxygen before the microwave dis charge.
Hydrogen, to about the same molar concentration as
water, -6 i.e. approximately 0.1 x 10 moles/sec, was pre-mixed
with nitrogen, prior to their admission to the discharge tube.
As with water vapour, the 'pink' (Broida) glow was extinguished
in the bulb, VS. Nitric oxide 'titrations' were made, every
hour, at the top fixed jet, until the nitrogen atom con-
centration remained constant. The hydrogen flow was then
stopped. Almost immediately the familiar fpink' glow became
visible again in the bulb, VS. Water vapour was then
introduced, instead of hydrogen, and a nitric oxide 'titration'
made. The water vapour was then allowed to pass for one hour,
at the end of which time the flow of water was stopped, and a
nitric oxide 'titration' again made. The results obtained, at

C)
- 73 -
2, 3 and 4 mm Hg, are shown in Table 10, and Fig. 12.
Similar experiments were made with oxygen, with the
results shown in Table Il, and Fig. 13.
No/HCN RATIO AT THE TOP AND BOTTOM
OF TH lL!~~ C TQ.!
As indicated previously, no change of the nitric
oxide 'titration' value was observed for prolonged periods of
continuous operation of the microwave discharge, contrary to
the corresponding observations with the condensed electrode
dis ch a r g e (136). On the other hand, Wright ~ al. (72) found
the No/HCN ratio, with the electrode discharge, to decrease, at
constant pressure, with time of decay of the active nitrogen in
a 'poisoned' system, while in an 'unpoisoned' system the same
ratio increased markedly. In view of these observations, it
seemed worth while to determine the No/HCN ratio for a variety
of conditions, as above, in the eventuality that sorne conditions
might be found under which this ratio might approach unity.
As before, the thought was that, should such conditions be
found, they might help to explain the discrepancy between the
observations! of Mavroyannis and Winkler and of Clyne and Thrush
in the oxygen reaction.
Experiments were made, both at the top of the reactor
(fixed jet, JI)' and 60 cm below the fixed jet, for different
pressures, ranging from 0.75 to 5 mm Hg, at room temperature.
The first No/HCN ratio determination was made after about two
hours of continuous operation of the microwave discharge, when

Time
----------'----_._--------'---
- 74 -
Table 6
THE NITRIC OXIDE 'TITRATION' VALUE OF ACTIVE NITROGEN~ AFTER LONG AND CONTINUOUS PERIODS OF OPERATION
OF THE MICROWAVE DISCHARGE
Room temperature
Unpoisoned system
NO Flow rate (moles/sec x 10 6 )
hou r s Pre s sur e = 2 mm Hg Pre s sur e = 3 mm Hg Pre s sur e = 4 mm Hg
0 1.18 3.48 4.82
1 1. 18 3.36 4.24
2 1. 25 3.26 4.21
3 1.18 3.16 3.46
4 3.20 3.72
5 3.24 3.97
6 3.87
6.5 3.29
7.5 3.26
8.5 3.26

- 75 -
Figure 8
THE NITRIC OXIDE ,'TITRATION 1 VALUE OF ACTIVE
NITROGEN ~ TIME, AFTER LONG AND CONTINUOUS
PERIODS OF OPERATION OF THE MICROWAVE DISCHARGE
• - 2 mm Hg
o - 3 mm Hg
• - 4 mm Hg

C)
-~ x 6 (,) w CI)
~5 w -' 0 4 • :i! - • w 3 1-. « a: 2 ~ 0 ....J LL
0 Z
2 3 4 5 6 7 8 9
TIME- HOURS

.... - .. _._-_._._-~---_._-------_._~--_._---~- - .- -- ._--------- _. __ ._--_ ..... __ ._-- -----
Time
hours
0
1
2
- 76 -
Table 7
THE EFFECT OF WATER VAPOUR INTRODUCED BEFORE
THE MICROWAVE DISCHARGE
Room temperature
NO Flow rate (moles/sec x 10 6 )
Pressure= 2 mm Hg Pressure = 3 mm Hg Pressure = 4
2.90 4.42 5.26
2.81 4.26 4.84
2.89 4.34 4.80
Flow_.2 f W~!~-.Y!!.E~sto~
2.25 1.00 2.15 2.99
3 1.04
3.25 2.30 3.00
mm Hg

C)
- 77 -
Figure 9
THE NITRIC OXIDE fTITRATION' VALUE OF ACTIVE
NITROGEN ~~ TIME, FOR THE EFFECT OF WATER
VAPOUR INTRODUCED BEFORE THE MICROWAVE DISCHARGE
• - 2 mm Hg
o - 3 mm Hg
• - 4 mm Hg

()
-'b 6 -x ~
0 LU
5 (/) i~_ •
" ..
(/) n .... , LU
4 ..J - l ~
0 ~ - 3 LU
~ ~ 2
l:- l -• 1}. 0 f- -
~ 0 ..J LL
~ IL --
0 Z 1 1 1 1 1 1 1
1 2 3 4 5 6
TI ME - HOURS

Time
- 78 -
Table 8
THE EFFECT OF WATER VAPOUR INTRODUCED AFTER
THE MICROWAVE DISCHARGE
Room temperature
NO Flow rate (moles/sec x 10 6 )
hours Pressure = 2 mm Hg Pressure = 3 mm Hg Pressure = 4 mm Hg
0 1.46 2.32 3.66
1 1. 29 2.02 2.92
2 1. 31 2.00 2.95
Flow of water vapour stopped
2.25 1. 78 2.67
2.5 0.94
3.25 1. 73 2.52
3.5 0.96

- 79 -
=)
Figure 10
THE NITRIC OXIDE 'TITRATION' VALUE OF ACTIVE
NITROGEN ~ TIME, FOR THE EFFECT OF WATER
VAPOUR INTRODUCED AFTER THE MICROWAVE DISCHARGE
• - 2 mm Hg
o - 3 mm Hg
• - 4 mm Hg

C)
-«Do X frl5 en Ù>' ~4 o ::E -3 w ~ et: 2
~ ..JI li..
o Z
2 3 4 5 6 TIME- HOURS

()
'y
Time
- 80 -
TH'!"']E.!.!Q!_OF-.!iATER-YAPQ.!!!LR,!!.EMI~ WITH
.NITgIC_QXI~.§
Room temperature
NO Flow rate (moles/sec x 106 )
hours Pressure= 2 mm Hg Pressure = 3 mm Hg Pressure = 4 mm Hg
Unpoisoned system
0 1. 22
1 1. 20
2
3
Nitric oxide premixed
2 1. 35
3 1. 36
3.25
4
4.25
Flow of water vapour
3.25 1. 22
4.25 1. 20
5
5.25
2.98
2.68
2.46
2.65
with water va.E..2.!!!:
2.62
stoE~.9..
2.64
3.47
3.12
2.98
2.96
3.08
3.09
3.15

()
- 81 -
Figure 11
THE NITRIC OXIDE 'TITRATION' VALUE OF ACTIVE
NITROGEN ~ TIME, FOR THE EFFECT OF WATER
VAPOUR PREMIXED WITH NITRIC OXIDE
• - 2 mm Hg
o - 3 mm Hg
• - 4 mm Hg

--------------------~----~-------------------------------
-"b x u UJ 5 CI)
......... Cf)
UJ 4 ..J o ~ 3 UJ
~ 2 ~ 9 lL.
o Z
2 3 4 5 6
TIME- HOURS
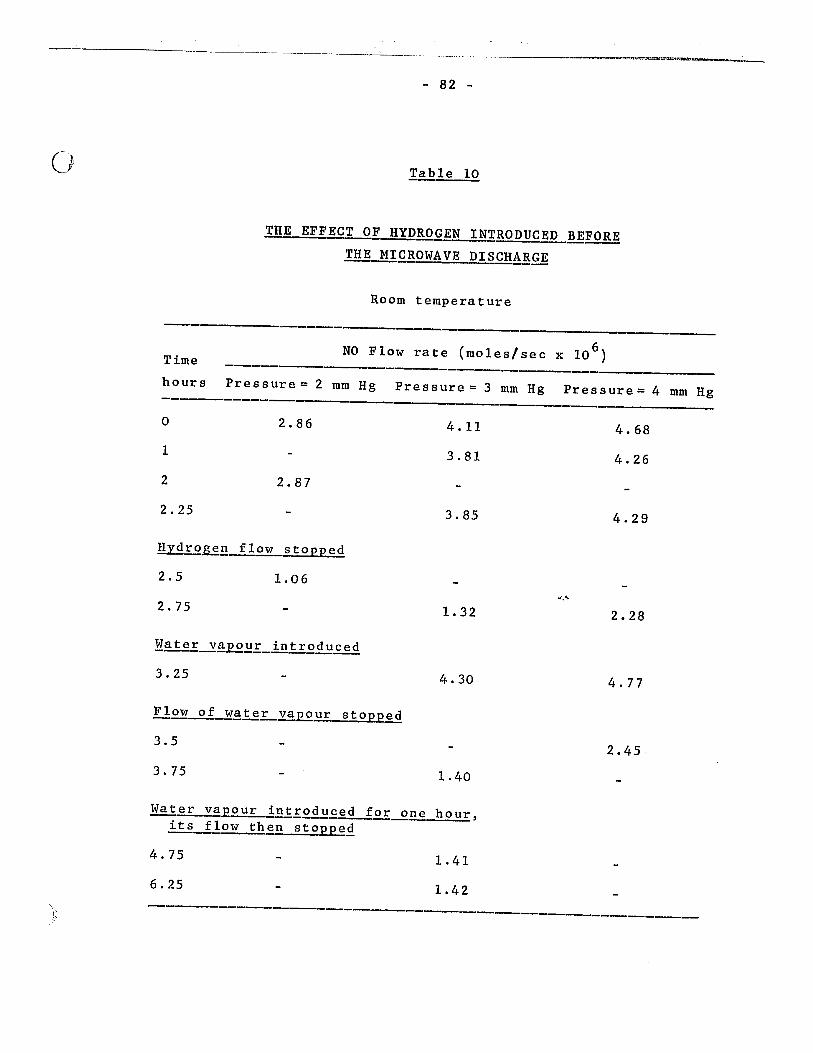
()
- 82 -
Table 10
THE EFFECT OF HYDROGEN INTRODUCED BEFORE THE MICROWAVE DISCHARGE
Room temperature
NO Flow rate (moles/sec x 106
) Time
hours Pressure = 2 mm Hg Pressure = 3 mm Hg Pressure = 4 mm Hg
o 2.86 4.11 4.68
1 3.81
2 2.87
2.25 3.85
Hyd~~n f10w stopped
2.5 1.06
2.75 1. 32
3.25 4.30
3.5
3.75 1.40
Wa ter va .E.22:!.E-i.!!!!: 0 dUE e d f ~--E~.J!~ , its f10w then sto~~
4.75 1.41
6.25 1.42
4.26
4.29
.... ~
2.28
4.77
2.45,
--------------------------------------------------------------
._----_ ... __ .. __ .......... -_ ..... _-_ .. _------'-------------
- 83 -
()
Figure 12
THE NITRIC OXIDE 'TITRATION ' VALUE OF ACTIVE
NITROGEN ~ TIME, FOR THE EFFECT OF HY'DROGEN
INTRODUCED BEFORE THE MICROWAVE DISCHARGE
• - 2 mm Hg
o - 3 mm Hg
• - 4 mm Hg
."'"!:,
1.)
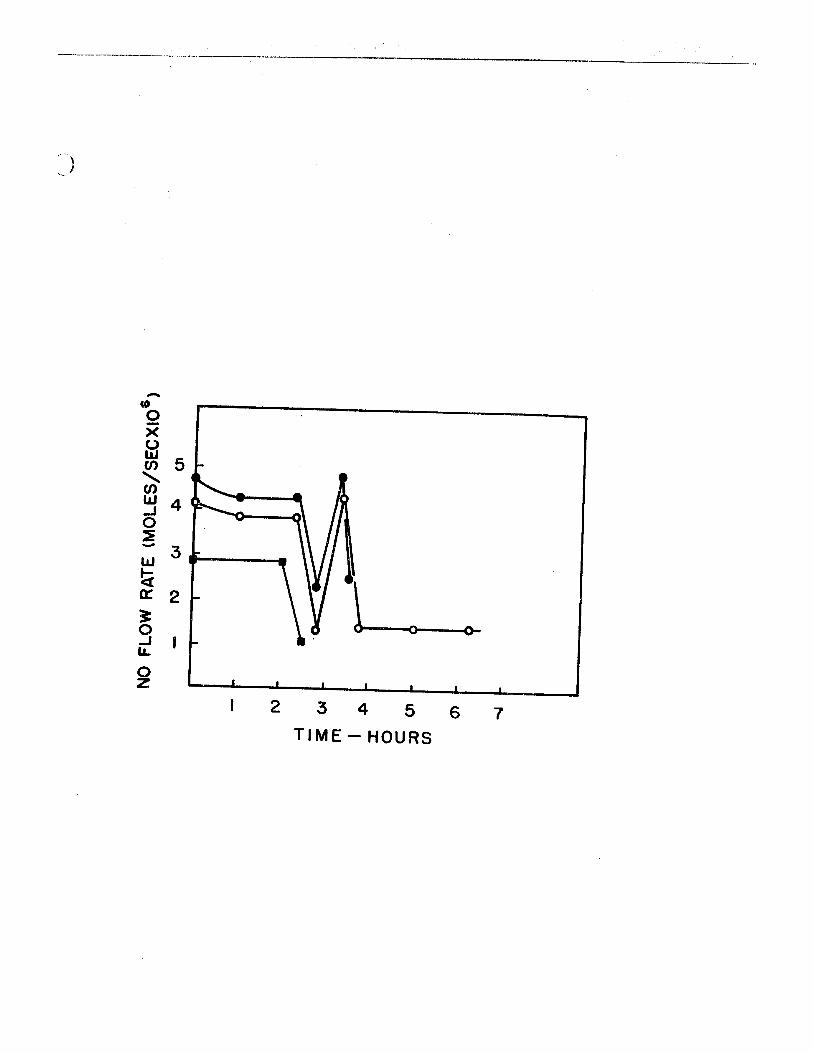
-«t Q x fd
5 Cf)
"-Cf) lIJ 4 ..J 0 ~ - 3 UJ
~ ex: 2 ~ 0 o 0-..J IJ..
0 z 2 3 4 5 6 7
TIME - HOURS

Time
- 84 -
Table Il
THE EFFECT OF OXYGEN INTRODUCED BEFORE
THE MICROWAVE DISCHARGE
Room temperature
NO Flow rate (moles/sec x 10 6 )
----hours Pressure = 2 mm Hg Pressure = 3 mm Hg Pressure = 4
0 2.30 3.75 4.37
1 2.22 3.48 4.24
2 2.26 3.44 4.15
Flow~!_oxY~~_~~E~~
2.5 1.11 1. 58 2.20
Water va~our introduced
2.75 4.29 4.75
3 2.92
Flow of water vaEou.E~.Q..E.E.ed
3.25 1. 76 2.45
3.5 1.03
mm Hg

C)
______________ ==-=~I~~ __ C~_. ______ _
- 85 -
Figure 13
THE NITRIC OXIDE 'TITRATION' VALUE OF ACTIVE
NITROGEN ~ TIME, FOR THE EFFECT OF OXYGEN
INTRODUCED BEFORE THE MICROWAVE DISCHARGE
• - 2 mm Hg
o - 3 mm Hg
• - 4 mm Hg

-t> x o m 5 , Cf) w 4 L~---L.-...-4 -1 o :E - 3 w ~ 0::: 2
~ -1 u.. o z
2 3 4 5 6
TIME- HOURS

-----------------~~~~-
- 86 -
the nitric oxide 'titration' value was constant. There
followed, thereafter, any desired number of consecutive
experiments.
Nitric oxide 'titrations' were made first, and these
were followed by estimations of the maximum hydrogen cyanide
production from ethylene for comparable conditions. The
hydrogen cyanide produced was trapped in T2
(Fig. 3), and
subsequently titrated as described earlier. The majority of
the experiments were mide in the 'unpoisoned' system, although
a number were made also in a 'poisoned' system (water vapour,
-6 approximately 0.1 x 10 moles/sec).
in Table 12, and Figs. 14 and 15.
The results are shown
EXPERIMENTS WITH THE SECOND REACTION VESSEL
In the re-investigation of the active nitrogen-oxygen
reaction, outlined in the foregoing discussion, a long tube
reactor was used, somewhat analogous to that used by Clyne and
Thrush (87), with both their experimental techniques, and those
of Mavroyannis and Winkler (146). The values for the maximum
oxygen atom production, by both methods, were in good agreement
with the nitric oxide 'titration' value of the active nitrogen,
i.e. in agreement with the results of Clyne and Thrush. Also,
no experimental conditions could be found such that the extent of
reaction, whether measured by the NO or c2a4
reactions, would be
the same (H~~::::!- 1). Rather clearly, therefore, the discrepancy
between the earlierstudies by Clyne and Thrush, on one hand, and
of Mavroyannis and Winkler on the other had to be sought in some
other factor that depended upon the different types of reactor

Table 12
THE NO/HCN RATIO AT THE TOP AND BOTTOM OF THE REACTOR
Top of the reactor (Fixed jet, JI)
NO Flow rate 6
moles/sec x 10
Maximum HCN Production 6
moles/sec x 10
A. UNPOISONED SYSTEM
Room temperature
Ratio NO/HCN
Bottom of the reactor (60 cm below fixed jet)
NO Flow rate 6
moles/sec x 10
Maximum HCN Production 6
moles/sec x 10
Pressure = 0.75 mm Hg 0.11
0.10
0.24
0.25
0.27
0.065
0.065
0.14
0.14
0.15
1. 69
1. 54
Av. 1. 61
Pressure = 1 mm Hg 1. 71 0.34 1. 78 0.79 1. 80 0.28
Av. 1. 76 0.29
0.18
0.16
0.16
0.16
Ratio NO/HCN
1. 82
1. 81
1. 75
1. 81
Av. 1. 79
1.07
1.03
1.10
0.58
0.56
0.58
1
Pressure = 2 mm Hg
1. 84 1.03
1. 83 0.95
1. 89 0.95 Av. 1. 85
0.54
0.52
0.52
1. 90
1. 83
1. 83
Av. 1. 85
/Contd.
( ) "",~
00 "'-J

( l "'-'
Room temperature
Top of the reactor Bottom of the reactor (Fixed jet, JI) ( 60 cm below fixed jet) NO Maximum HCN Ratio NO Maximum HCN Ratio Flow rate 6 Production 6 NO/HCN Flow rate 6 Prod uct ion 6 NO/HCN moles/sec x 10 moles/sec x 10 moles/sec x 10 moles/sec x 10
Pressure 2.5 mm Hg 1.42 0.64 2.21 1.18 0.54 2.18 1.40 0.64 2.19 1. 23 0.56 .2.19
Av. 2.20 Av. 2.18
Pressure = 3 mm Hg 2.18 1.00 2.18 1.58 0.68 2.32
00 2.11 0.96 2.19 1. 60 0.72 2.22 00
2.04 0.96 2.12 1. 53 0.68 2.25 Av. 2.16 Av. 2.26
Pressure = 4 mm Hg 2.96 1. 34 2.20 2.15 0.96 2.23 3.00 1. 36 2.20 2.10 0.96 2.18 2.88 1. 32 2.18 2.00 0.96 2.08
Av. 2.16 2.88 1. 32 2.18 2.94 1. 32 2.22 2.94 1. 32 2.22
Av. 2.20
IContd.

'<.-::;:
Room temperature
Top of the reactor (Fixed jet, J~)
l.
Bottom of the reactor (60 cm below fixed jet)
NO Flow rate 6
moles/sec x 10
3.10
3.02
Maximum HCN Production 6
moles/sec x 10
Ratio No/HCN
Pressure
1. 34
1. 34
2.31
2.25
Av. 2.28
NO Flow rate 6
moles/sec x 10
= 5 mm Hg
B. POISONED SYSTEM
0.58
0.60
2.84
2.81
4.25
4.22
0.35
0.37
1.48
1.48
1. 96
1. 94
Pressure = 0.75 mm Hg 1..65
1-. 62
Av. 1. 63
Pressure = 2 mm Hg
1. 91
1. 89
Av. 1. 90
Pressure = 3 mm Hg
2.16
2.17
Av. 2.16
Maximum HCN Prod uct ion 6
moles/sec x 10
Ratio No/HCN
10
---'
~
te
1
1
\
1 i-

- 90 -
()
Figure 14
PLOT OF THE No/HCN RATIO y~ PRESSURE
'Unpoisoned' system
• - Fixed jet
 - 60 cm below fixed jet
'Poisoned' system
• - Fixed jet

2-4
0 ~ • f- 2-2 • c:( 0:
Z 2·0 0 :I:
"-0 ',8 z
I-S
2 3 4 5
PRESSURE - M.M.

(~)
- 91 -
Figure 15
PLOT OF THE NITRIC OXIDE 'TITRATION' VALUE
y~ MAXIMUM HYDROGEN CYANIDE PRODUCTION
'Unpoisoned' system
• - Fixed jet
 - 60 cm below fixed jet

C)
,... ·0 -X 0 LaJ
4 (/)
......... (/) LaJ ..J 0 3 ~ -L&J
~ 2 Cl::
~ 0 ..J LL
0 Z
0·2 0·4 0·6 0·8 1·0 1·2 1·4
HCN FLOW RATE (MOLES / SEC X 106)
)

- 92 -
used. According1y, the rather obvious next step in the
investigation was to construct a reaction vesse1, as identica1
as possible with that used by Mavroyannis and Wink1er (see
Fig. 4), to determine whether their observations cou1d be
substantiated.
A reactor of M-W type* was constructed, as i11ustrated
in Fig. 4, and connected, through K, to the discharge tube, and
through L, to that part of the system that 1ed to the traps T2 When the system was put into operation, with nitric
oxide introduced through jet A, a difficu1ty was encountered in
obtaining the dark point of the N + NO reaction. Owing to a
high 1inear ve10city, the dark point was observed in the
neighbourhood of the traps, instead of inside the reaction tube.
The same behaviour was observed for the active nitrogen-oxygen
reaction. This meant that active nitroëen was present around
the jet, E, through which it was intended to add nitrogen
dioxide for the estimation of the oxygen atom concentration
from the reaction. Since active nitrogen reacts with nitrogen
dioxide (73,74,86,130,131), to produce sorne nitric oxide, the
-----------------------------* To avoid any confusion, since a rather large number of
different reactors were used, the fo110wing notation was adopted: The long reaction tube with the movab1e jets will be designated as 'reactor l'; the reactor used by Mavroyannis and Wink1er (146) will be refërred to as 'M-W reactor', and its modifications as 'M-W reactor', fo1lowed by an identifying comment on the type of modification.

- 93 -
results would have been unreliable. It was found that
throttling the pump, to decrease the linear velocity, made it
possible to circumvent this uncertainty, by causing the dark
point to retreat to a point close to the jet, A.
Experiments were first made with this system (M-W
reactor), by admitting oxygen into the active nitrogen stream
through the jet, A. The maximum oxygen atom production was
then determined by introducing an excess of nitrogen dioxide
through the jet, E, located 23.5 cm below the jet, A, and
analysing the trapped N20
3 as described earlier. At the same
time, a nitric oxide 'titration' was made, to determine the
nitrogen atom concentration at the jet, A. Analogous
experiments were made with ethylene. Ethylene was admitted to
the reaction tube through jet, A, and the maximum hydrogen
cyanide production, for high reactant flow rates, was determined
in the usual way. The results at the pressures of 3, 4 and 5 o mm Hg, and about 400 C, are shown in Table 13.
The maximum oxygen atom production was now in
agreement with the maximum yield of hydrogen cyanide, i.e. in
agreement with the results of Mavroyannis and Winkler (146),
rather than with the nitric oxide 'titration' value of active
nitrogen. It was apparent that some factor was present with
this system, such that the results were shifted towards the
hydrogen cyanide value. Further investigation was therefore
directed towards the identification of that factor, achievement
of which would resolve the problem under investigation.
1 1

o
)
- 94 -
It seemed worth while to determine, first, whether
an impurity (e.g. hydrogen), introduced before the microwave
dis charge, might reveal any suggestive behaviour of the active
nitrogen-oxygen reaction in this system. However, no effect
on the results was observed in any of the experiments,that
were made, as indicated in Table 13.
The possible efiect of inserting a 300 cc bulb
between the dis charge tube and the H-W reactor was next
investigated, since such a volume was present in experiments
that had been made with reactor 1.
observed.
Again, no such effect was
A modification of the M-W reactor was constructed, in
which only two fixed jets, corresponding to A and E, were
present. These were 23.5 cm apart, and pointed upstream, to
introduce reactant countercurrent to the active nitrogen stream.
Experiments were then made as with the M-W reactor. In two of
these, the length of the reactor was changed. This was done,
first, by sealing a pyrex tube, 45 cm long and 26 mm I.D., to
the inlet end of the reaction tube, so that its entire length
was somewhat analogous to that of reactor l, while for another
series of experiments, it was further lengthened with a tube,
20 cm long and 26 mm I.D., sealed to the exit end. The results of studies made with these modified reactors are shown in
Table 13.
It was noted that when the volume of the reactor
below the inlet for nitrogen dioxide was increased, the results

o
)
- 95 -
obtained by analysis with excess nitrogen dioxide were shifted
towards the values obtained by the nitric oxide 'titration'.
It was suspected, therefore, that the analytical method used
by Mavroyannis and Winkler, in which N2
03
is trapped, might
have been deficient under some conditions.
Further check on the validity of the method was
therefore made, by passing molecular nitrogen through the
system, with no ûischarge, and introducing a .~nown amount of
nitric oxide into the reactor through the jet, A. Excess
nitrogen dioxide was then admitted, as before, through the jet,
E, and the N2
03
produced was trapped and estimated in the usual
way. Surprisingly enough, the analytical method was found to
be only 82.4% efficient.
In view of these last results, a M-W reactor (Fig. 4)
was again incorporated into the system, and the analytical
procedure based on excess nitrogen dioxide was again checked by
the same experimental procedure. The results now indicated
that the efficiency of the method was drastically reduced, to
64%.
It seemed possible that this grossly reduced
efficiency of the analytical method might have resulted from
the throttling that was used, as indicated earlier, to contain
the dark end-point of the nitric oxide 'titration' within the
reactor, when the shorter reactors replaced the reactor l used
in the initial experiments. It May be recalled that tests of
the analytical method gave satisfactory result~ for the

(>
~)
- 96 -
un-throttled flow through the reactor l (Table 1, p. 55).
Accordingly, the reactor l, used initially, was again put into
place, and nitric oxide, at a known flow rate, was introduced
into the reaction vessel at three different levels, through the~'
movable jet. Experiments were made with throttled flow, at a
constant pressure. Analyses were made with an excess of
nitrogen dioxide admitted to the reactor through the jet, J3
,
located 65 cm below the top fixed jet (Fig. 3). The results
showed that the analytical method was satisfactory, regardless
of the extent of throttling, and of the level at which nitric
oxide was admitted to the reactor.
Yet anobher reactor was then put into place. This
consisted of a M-W reactor, except that a tube, 30 cm long and
28 mm I.D., was sealed to the exit end. This additional tube
was of such dimensions that the volume below the inlet of
nitrogen dioxide was approximately the same as that for the
reactor 1. The results, with additions of nitric oxide as
above, now showed that the analytical method was entirely
satisfactory.
In calculating the volume to be added below the
nitrogen dioxide inlet, for the previous experiment, the volume
contained in the B 40 ground joint at the bottom of reactor l
(Fig. 3) was included. As a variant of the last experiment,
described above, the reactor l was again placed in the system
and the volume in the ground joint filled with di-but yI
phthalate. Experiments showed that this volume was not

o
)
- 97 -
essential to satisfactory application of the analytical
method.
Further to the above extensive comparisons between
the two kinds of reactors, there remained a relatively minor
difference to be examined, namely the type of jets. A
reaction vessel was therefore constructed, as a modification
of the M-W reactor, with two bulb jets, A and E, instead of
tapered inlet jets. Four fine holes were located symmetrically
around the peripheries of the bulbs. The volume below the
inlet for nitrogen dioxide was the same as in reactor l when
the volume of the B 40 ground joint was excluded. The results
showed that the analytical method was efficient, and required
sorne 100-120 cc less volume below the inlet for nitrogen
dioxide, than with the tapered inlet jets.
The results for ail the experiments designed to test
the efficiency of the analytical method under the variety of
conditions are contai~ed in Table 14. They left little doubt
that oxygen atom production in the active nitrogen-oxygen
reaction could be analysed reliably by the method based on
addipg an excess of nitrogen dioxide only if sufficient volume
is available, after the nitrogen dioxide is added, to permit
the NO + N02 reaction to go to complet ion.
RATE CONSTANTS FOR THE NO + NO i REACTION
In view of the conclusion enunciated above, it seemed
worth while to obtain sorne idea of the rate constant for the
NO + N02 reaction, since there seemed to be an opportunity to

~""'.~.
Table 13
MAXIMUM YIELD OF HYDROGEN CYANIDE AND OXYGEN ATOMS FROM THE REACTIONS OF ACTIVE NITROGEN WITH ETHYLENE AND OXYGEN RESPECTIVELY, AT VARIOUS PRESSURES
NO Flow rate 6
moles/sec x 10
o Temperature 400 t 2 C
-6 02 Flow rate = Il.9 x 10 moles
Maximum [0] Production 6
moles/sec x 10
Maximum HCN Production 6
moles/sec x 10
M-W reactor (Permanent throttling with capillary)
Pressure = 3 mm Hg
0.46 0.26 0.235
Pressure = 4 mm Hg
0.80 0.44 0.45
Pressure = 5 mm Hg
1. 23 0.67 0.68
-1 sec
Ratio NO/HCN
1. 95
1. 80
1. 80
Ratio NolO
1. 76
1.82
1.83
Ratio HCN/o
0.9
1.0
1.0
/Contd.
( ') -..",..r"
(0 00

,-.... ,~",:'
\....-}
0 Temperature = 400 + 2 C -1 O2 Flow rate = - -6 Il.9 x 10 moles sec
NO Maximum [0 ] Maximum HCN Ratio Ratio Ratio Flow rate 6 Production 6 Production 6 NO/HCN NO/O HCN/O moles/sec x 10 moles/sec x 10 moles/sec x 10 Introduction or hydrogen -6 (0.1 x 10 moles -1 sec )
berore the microwave dischar~
Pressure = 3 mm Hg 1.0 0.67 0.62 1. 60 1.50 0.92
Pressure = 4 mm Hg 1. 58 0.89 0.93 1. 70 1. 77 1.05
Pressure = 5 mm Hg 2.02 1.16 1.18 1. 70 1. 74 1.0 co
co M-W reactor z two jets countercurrent Permanent throttling without capillary)
Pressure = 5 mm Hg 1. 65 0.80 0.85 1. 94 2.06 1.06
Pressure = 2 mm Hg 1. 23 0.67 0.67 1. 83 1. 83 1.0 1. 26 0.67 0.68 1. 85 1. 88 1.0
Elongation at the in1et end 1. 28 0.67 0.69 1.85 1. 90 1.0
Elongation at the exit end 1.2 0.91 0.68 1. 76 1. 31 0.74

c)
- 100 -
Table 14
EXPERIMENTS CONCERNING THE TRAPPING EFFICIENCY OF NITRIC OXIDE. BY USING EXCESS NITROGEN
DIOXIDE. IN DIFFERENT SYSTEMS
Known NO
moles/sec x 10 6
Trapped NO
moles/sec x 106
M-W ~~~ two jets countercurrent
0.89 0.71 1. 16 0.94 1.45 1. 25
Correction factor = 1. 21
M-W reactor
0.80 0.49 1.19 0.80
Correction factor = 1. 56
Reactor l
NO introduced 60 cm be10w fixed jet 0.82 0.80 1.18 1.16
NO introduced 40 cm below fixed jet 1.19 1.16
NO introduced through the fixed jet 1. 79 1. 78
M-W reactor e!ongated at the exit end, tapered jet f!.
1. 24 1. 21
1. 26 1. 25
M-W reactor e1o~ated at the exit end, bulb jets
1.17 1.12
Efficiency
%
79.8
81.0
86.2
Av. 82.4
61
il Av. 64
97.6
98.3
97.5
99.4
97.6
99.2
96

()
- 101 -
do this with re1ative1y simple a1terations to the equipment
and procedures that were being used.
A1though it appears that the existence of dinitrogen
trioxide (N2
03
) in the 1iquid phase has been accepted, its
stabi1ity as agas was, for some time, controversia1 [cf. review
by Beattie (162)1. However, its existence as a stable compound
in the gas phase has been demonstrated by measurements of the
equi1ibrium constant for the reaction (157,163,164),
k ( 10)
Its Raman (165) and ultraviolet (166) spectra have also been
recorded.
The kinetics of the exchange of nitrogen between
nitric oxide and nitrogen dioxide in the reaction
was examined by Leifer (167) in the gas phase, at a total
o pressure of 2.5 cm Hg and temperature -35 C.
for the rate constant was 10 6 cc mole- l -1 sec
A lower limit
The observed
equilibrium constant at 250
C was 0.96 + 0.02, compared with a
value of 0.967 calculated from spectroscopie data.
To determine the rate constant for reaction (10),
nitrogen dioxide was added to a stream of nitric oxide and
mo1ecular nitrogen, and the N20 3 trapped, and estimated, after
a known reaction time.

- 102 -
Ct l The reaction vessel used in this series of
experiments was the M-W reactor with two bulb jets. Nitric
oxide, at a known flow rate, was introduced through the jet, A,
into a stream of molecular nitrogen. Nitrogen dioxide, at the
-5 rate of 10 moles/sec, was admitted to the reaction tube
through the jet, E, located 23.5 cm below the inlet of nitric
oxide. Different reaction times were attained, by changing
the volume from the inlet for nitrogen dioxide to the level of
the liquid air surrounding the trap. The reaction was stopped
at the level of liquid air, at which point the N203
was trapped,
and subsequently estimated. Experiments were made at a
pressure of 3.3 mm Hg, with gas flows that continued for 120
seconds. The results obtained, for different reaction times,
are shown in Table 15.
'Blank' experiments showed that, when nitric oxide
was passed through the trap, immersed in liquid air, for 120
seconds, under the same conditions as those used for the rate
constant determination, no trace of nitric oxide was trapped.
Hence, for conditions of incomplete consumption of nitric oxide
the results would not be rendered inaccurate by contamination
of the N2
0 3 with condensed nitric oxide.
It was also observed that, if nitrogen dioxide, of an
amount equal to that used in the rate constant determinations,
was condensed into the trap, and a known amount of nitric oxide
also passed through the trap, no nitric oxide was retained.
The reaction leading to the formation of N2
03
may be

- 103 -
assumed to be of second order. Hence, by using a considerable
excess of nitrogen dioxide, compared with the flow rate of
nitric oxide, the reaction may be reduced to a pseudo-first
order reaction (168). The rate expression is given by
In the present experiments, (N0 2 )0 ~ 10(NO)0' where (NO)o and
(N0 2 ) represent initial flow rates. o
Hence,
and k =
where k' = pseudo-first order rate constant
and k = second order rate constant.
By integration of the pseudo-first order equation,
k' = 1 ln t
(NO) o
When ln (NO) I(NO) - (N203
) was plotted against t, o 0 t
a straight line was obtained (Fig. 16), the slope of which was
the pseudo-first order rate constant k'.
was:
12.8 -1 sec
The value so obtained

- 104 -
Accordingly, a value for the second order rate constant kwas
estimated, based on the known value of k'. Its value was:
t -1-1 k = 1.3 x 10 cc mole sec
)
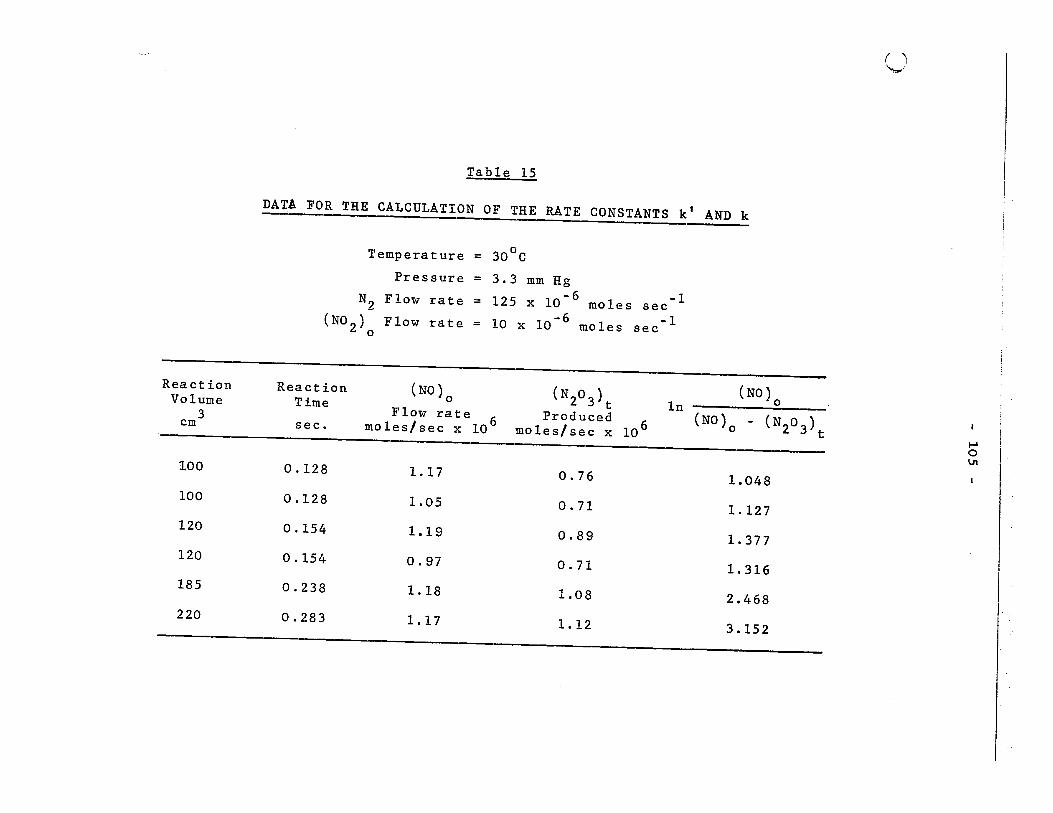
Reaction Volume
3 cm
100
100
120
120
185
220
Table 15
DATA FOR THE CALCULATION OF THE RATE CONSTANTS kt AND k
Temperature
Pressure
NZ Flow rate
(N0 2 )o Flow rate
(NO) o
= 300
C
= 3.3 mm Hg -6 -1 = 125 x 10 moles sec
-6 -1 10 x 10 moles sec
ln Reaction
Time
sec. Flow rate 6
moles/sec x 10
(N20 3 )t Produced 6
moles/sec x 10
0.128 1.17 0.76
0.128 1.05 0.71
0.154 1.19 0.89
0.154 0.97 0.71
0.238 1.18 1.08
0.283 1.17 1.12
(NO)O
(NO) 0 - (N 20 3) t
1.048
1.127
1. 377
1. 316
2.468
3.152
( î ""-i
1-' o \.n

- 106 -
C)
Figure 16
PLOT OF ln (NO) !(NO) - (N20 3 ) .Y~ t o 0 t

"1'\'""-.;7~~-:'"7"7.:::~',;.". j1' ':"T/7':-"~7~S' --'"". :--~7;.-~ ..
" ~
',,, ~:~ 0,
,
4
... - 3 If)
0
'" z -'0 -0 2 z -........
_0 0 Z -·z -l
0·1 0-3 0-5
t SEC

- 107 -
DISCUSSION
Discussion of the resu1ts of the present study may be
focussed, a1most entire1y, on one important question: Has a
reasonab1e exp1anation been found for the discrepancy, out1ined
ear1ier, between the resu1ts obtained by C1yne and Thrush, and
those of Mavroyannis and Wink1er, for the active nitrogen-oxygen
reaction? To answer this question, it wou1d seem usefu1, even
necessary, to recapitu1ate brief1y the nature of the discrepancy,
and the steps taken to reso1ve it. Only in this way does it
seem possible to present the basis for the conclusion fina11y
reached, in such a way that its correctness may be readi1y
assessed. This will invo1ve, inevitably, some repetition.
However, it will be possible, at the same time, to comment on a
number of interesting observations that have been made during
the course of the study.
It will be reca11ed that the discrepancy resided in a
marked disagreement on the maximum extent to which the reaction
may occur, relative to the maximum extent to which active
nitrogen may destroy nitric oxide, or may react with ethy1ene
to form hydrogen cyanide. Mavroyannis and Winkler had ana1ysed
for the production of oxygen atoms in the active nitrogen-oxygen
reaction by adding an excess of nitrogen dioxide, which
permitted an equivalent amount of nitric oxide to be trapped as
N2
03 , according to the sequence,

- 108 -
N + O2 - NO + ° N + NO -N2 + °
° + N0 2 - NO + O2
NO + N02 -N
203
They found that the N + 02 reaction appeared to take place to
an extent which corresponded remarkably weIl, over a range of
pressures, with the maximum production of hydrogen cyanide from
ethylene, when it reacted with active nitrogen formed under
comparable conditions. They were aware, from the data of
Verbeke and Winkler, that this maximum hydrogen cyan ide yield
was generally less than the corresponding extent to which nitric
oxide might be decomposed (the NO/HCN ratio being of the order
1.4 to 2.4), and concluded that the good agreement between the
maximum extents of the oxygen and ethylene reactions supported
the maximum hydrogen cyanide yield from the ethylene reaction,
rather than the extent of nitric oxide destruction, as a measure
of the active nitrogen concentration.
Subsequently, however, Clyne and Thrush compared the
extent to which nitric oxide was decomposed by active nitrogen,
inferred from the nitric oxide gas-phase 'titration', with the
extent of oxygen atom production in the oxygen reaction,
determined also by a gas-phase 'titration', but with nitrogen
dioxide. They found excellent agreement between these two
quantities, which gave strong support to the nitric oxide
'titration' as a method for estimating the nitrogen atom

- 109 -
concentration in active nitrogen.
Clearly, further study of the oxygen reaction was
necessary to establish, if possible, the reason for the quite •
different results obtained in the two studies, and, as indicated
earlier, the present study was undertaken with this end in view.
A logical first step in attempting to trace the
source of the discrepancy was, of course, to re-investigate the
oxygen reaction, with particular attention to the difference in
ana11~ical methods previously used for estimating the oxygen
atom production in the reaction. To this end, a long-tube
reactor was first constructed (reactor l of the preceding
presentation of data), somewhat analogous to that used by Clyne
and Thrush. The maximum yields of oxygen atoms from the
reactions of active nitrogen with nitric oxide and with oxygen
were compared, at different levels in the reactor, using the
nitrogen dioxide Ititration' procedure. The data obtained at
l500
C showed excellent correspondence between these values
(Table 2). At 4000
C, this correspondence was no longer
obtained, but it was possible to demonstrate that, at the
higher temperature, thermal decomposition of nitrogen dioxide
(169,170) rendered the nitrogen dioxide 'titration' unreliable
for estimating the oxygen atom concentrations. It was
concluded, therefore, that the data from these experiments were
in good agreement with those of Clyne and Thrush (87), who
reported that oxygen and nitric oxide reacted with active
nitrogen to the same extents. In other words, the data could

- 110 -
be interpreted as corroborating the nitric oxide Ititration '
method as a measure of the nitrogen atom concentration.
There then followed a comparison, at 400 0 C in the
same reactor, of the maximum oxygen atom production from the
active nitrogen-oxygen reaction, as measured by the excess
nitrogen dioxide method, with the maximum yieid of hydrogen
cyanide from the active nitrogen-ethylene reaction. Although
the experimental techniques were similar to those of Mavroyannis
and Winkler (146), the maximum yields of oxygen atoms from the
oxygen reaction (Tables 3 and 4 and Figs. 5 and 6) did not
agree with the maximum yields of hydrogen cyanide, as these
authors had found previously. Instead, they were again in
good agreement with the nitric oxide Ititration l value for
active nitrogen, i.e. in agreement with the previous obser-
vations, and with the results of Clyne and Thrush (87). Again,
the nitric oxide Ititration ' method for determining nitrogen
atom concentrations appeared to be confirmed in its validity.
Other experiments in the same reactor made it
possible to obtain rate constants for the reaction of active
nitrogen with molecular oxygen, and thereby permitted a
comparison with the earlier studies on the basis of rates,
rather than yields.
reaction was
It was assumed that the mechanism of the
* = -32.8 kcal/mole
* 0 ~ calculated from data given in Ref. 33, Table 39 .
..... ___ . __ . ______ . ___________ .1

JI
- 111 -
follow~d by the fast reaction
N + NO - N2 + 0 ~Ho = -75.1 kc&l/mole.
The data (Table 5 and Fig. 7) yielded a rate constant given by
kl
= 3.76 x 10 12 exp(-7,000/RT) cc mole- l sec- l
o 0 over the temperature range 453 to 603 K. This may be compared
with the other values reported in the literature, as follows:
k l = 2 x 10¹²
exp(-6,200/RT) -1 -1 cc mole sec
(Kistiakowsky and Volpi - Ref. 86)
1.7 x 10¹³
exp(-7,500/RT) -1 -1
cc mole sec
(Kaufman and Decker - Ref. 145)
12 -1 -1 k l = 2.3 x 10 exp(-5,900/RT) cc mole sec
(Mavroyannis and Winkler - Ref. 146)
kl
= 8.3 x 10"12 exp(-7,100/RT) cc mole- l sec- l
(Clyne and Thrush - Ref. 87)
The value for the rate constant obtained in the present
investigation may be considered to be in quite good agreement
with most of the previous results, in view of the different
experimental techniques used. However, it may be considered
significant that it is in particularly good agreement with the
value reported by Clyne and Thrush, and less satisfactorily
with the value found by Mavroyannis and Winkler, even though
the present value was determined by using their analytical
method to measure oxygen atom concentrations (i.e. addition of

- 112 -
excess nitrogen dioxide).
AlI of the experiments made in the long tube reactor,
as above, yielded data in support of the study made previously
by'Clyne and Thrush without, however, giving any indication of
the reason for the discrepancy between their work and that of
Mavroyannis and Winkler. It became apparent that this was
likely to he found only by adopting some other approach to the
problem.
Simultaneously with the present study, it was
observed in this laboratory that, when active nitrogen was
produced by a condensed discharge between electrodes, the
nitric oxide 'titration l value dropped as the discharge was
operated continuously over long periods. After 4 to 5 hours,
,it might reach a steady value, such that the No/HCN ratio
approached unity.
This behaviour suggested that consideration should be
given to the possibility that a similar behaviour might be
observed with active nitrogen produced by a microwave discharge.
If this were true, the experiments of Clyne and Thrush might
have been made for conditions such that the No/HCN ratio, had
it been determined, might have been unity. No real discrepancy
would then have eXisted, fortheir experiments, in the
comparative maximum extents of the oxygen, nitric oxide and
ethylene reactions. Some experiments were therefore made to
determine the effect of running time on the nitric oxide
Ititration' values for active nitrogen from a microwave
...... - ... _ ........... _------------
- 113 -
discharge. It was found (Table 6, Fig. 8) to remain almost
unchanged, after prolonged and continuous periods of operation
of such a discharge, hence to behave in a manner contrary to
that observed for active nitrogen produced in a condensed
electrode discharge. The thought then intruded that the slow
change in active nitrogen concentration observed with the
electrode discharge was probably due to removal of a wall
'poison' during prolonged passage of the active nitrogen
through the system (by desorption or reaction, or both), and
that a similar change in the nitric oxide 'titration' might be
observed with the microwave system if certain wall 'poisons'
were present, e.g. water vapour, hydrogen, oxygen. If th is
were observed, it seemed possible that the presence (or absence,
perhaps) of pome such wall 'poison' might have been conducive
to a No/HCN ratio of approximately unit y during the experiments
of Clyne and Thrush.
When water vapour was introduced before the microwave
discharge, the active nitrogen was increased (Table 7, Fig. 9)
and the afterglow brightened, (visual observation), corres-
ponding to a greater nitrogen atom concentration. Moreover,
the 'pink' (Broida) glow was no longer in evidence anywhere in
the system. However, the almost immediate return of the system
to its normal conditions, when the flow of water vapour was
stopped, suggested that the water vapour was dissociated in the
discharge region, and probably had little effect as a 'poison'
against wall recombination of nitrogen atoms. If water vapour
- 114 -
behaved as a wall 'poison', the active nitrogen concentration
would probably have changed slowly as adsorbed water was removed
from the walls, in the manner observed when a condensed
electrode discharge is used. Alternatively, it might ev en be
argued that reversion to the normal 'unpoisoned' behaviour
might not have been expected at aIl, since experiments in the
laboratory have shown that active nitrogen from a condensed
discharge, but not that from a microwave discharge, will cause
decomposition of water. It would appear, then, that the
effect of water vapour in altering the active nitrogen concen
tration in the microwave type of system ls due to a change in
the extent of dissociation of the nitrogen in the presence of
water molecules, or more probably, their dissociation products.
When the water vapour was introduced after the
microwave discharge, so that it could act, presumably, only as
a wall poison, only a small increase of nitrogen atom concen-
tration occurred. However, the afterglow again brightened,
the 'pink' (Broida) glow disappeared, and the system returned
immediately to normal conditions when the water vapour supply
was stopped. The water molecule apparently reduces the
positive ion concentration (a principal component of the 'pink'
glow) in the discharged nitrogen.
When nitric oxide was pre-mixed with water vapour,
and this mixture was used to titrate active nitrogen, no effect
was observed on the nitric oxide 'titration' value (Table 9 and
Fig. Il). This suggested that there was no reaction between

o·
- 115 -
water vapour and active nit~ogen produced in a microwave
dis charge, an observation which was subsequently confirmed in
the laboratory, as indicated above.
The introduction of a trace of hydrogen before the
microwave discharge also increased the nitric oxide 'titration'
value (Table 10 and Fig. 12), although to an extent somewhat
less than that produced by water vapour. Again, the increase
might be attributed to a beneficial effect of hydrogen on
nitrogen atom production in the discharge. On the other hand,
when the flow of hydrogen was stopped, the concentration of
active nitrogen dropped to a value that was considerably lower
th an that attained before the addition of hydrogen. This is
rather difficult to explain, but perhaps hydrogen (atomic or
molecular) is considerably adsorbed on, or reacts with SOrne
component on the walls of the reactor (lS3), to produce a wall
condition that promotes, rather than hinders, loss of nitrogen
a toms. When water vapour was passed through the system, for
consecutive hourly intervals, the effect induced by the passage
of hydrogen was not removed.
The behaviour when traces of oxygen were introduced
before the microwave discharge was similar, in many respects,
to that observed with hydrogen. This implies, perhaps, that
an adsorbed layer was responsible, in both cases, for promoting
the 10ss of nitrogen atoms after the f10w of the foreign gas
was stopped.
Since there was no effect of operating time, or of

Ji
- 116 -
traces of additives on the nitric oxide 'titration l value, for
active nitrogen produced by a microwave discharge, sorne study
was made of the No/HCN ratio, at the top artd bottom of reactor 1.
This was done in the knowledge that, with active nitrogen from
a condensed discharge, this ratio tends towards unit y with
decay of the active nitrogen under certain conditions. It was
found, however, that the No/HCN ratio remained almost constant
with decay of the active nitrogen in the present system (Table
12, Figs. 14,15), and the addition of traces of water vapour
before the microwave dis charge had no apparent effect on the
ratio. Again, these observations are contrary to the results
obtained previously for active nitrogen formed in an electrode
discharge (72). For such a system, the No/HCN ratio decreased,
at constant pressure, with time of decay of the active nitrogen
in a Ipoisoned l system, while in an lunpoisoned ' system the
same ratio increased markedly.
It is interesting however, that, in the present
experiments, the No/HCN ratio was found to increase with
pressure, to a steady value at a pressure of about 2.5 mm Hg.
A similar increase with pressure was reported by Verbeke and
Winkler (74). The explanation is probably rather complicated.
Increase of pressure may affect sever~l factors that might be
involved in the system. For example, an increase in nitrogen
atom production in the discharge would be offset by increased
rate of gas phase recombination (with N2 as third body), whereas
the rate of diffusion of nitrogen atoms to the wall would be

- 117 -
decreased, and wall recombination would be correspondingly less.
However, it is ~lso possible that reaction of nitrogen atoms is
not limited to the gas phase. In particular, it might be that
some hydrogen cyanide is formed at the wall. (It would seem
to be less probable that nitric oxide suffers appreciable
heterogeneous reaction with nitrogen atoms, since its gas phase
reaction is so very fast.) It is also possible that the
ethylene reaction involves the intervention of hydrogen atoms
(93), as a further complication. With so many factors, and
perhaps others, also, that might reasonably be concerned in
determining the NO/HCN ratio, it would seem purely conjectural
to attempt an explanation for the observed ihcrease in it with
increase of pressure.
Since no explanation for the discrepancy between the
results of Clyne and Thrush, and those of Mavroyannis and
Winkler, was forthcoming from any of the experiments conducted
in the reactor l, it was decided that still another approach
must be made, and that the oxygen reaction should be re
investigated in a reactor of the type used by Mavroyannis and
Winkler.
When this was done, it was found that the maximum
oxygen atom production from the active nitrogen-oxygen reaction
was in agreement with the maximum hydrogen cyanide production
from the active nitrogen-ethylene reaction, i.e. in agreement
with the results of Mavroyannis and Winkler (146). This
clearly identified the type of reactor as a major determinant

- 118 -
of the discrepancy under study, but there remained the
necessity for a systematic study of the influence of various
features of the reactor to identify the particular factor
responsible for the discrepancy.
The introduction of a 300 cc bulb between the
discharge tube and the M-W type reactor, such as that used with
reactor l, had no effect on the results.
Simi1ar1y, elongation of the M-W reactor at the inlet
end left una1tered the agreement between the oxygen atom
production and the maximum hydrogen cyan ide yield from ethy1ene.
However, when the reactor was lengthened at the exit end, the
resu1ts tended to approach the nitric oxide 'titration' value
for the active nitrogen concentration (Table 13). Th is,
coup1ed with the background information from the previous
experiments, provided, at 1east, a fruitful line of attack in
seeking an exp1anation for the discrepancy between the M-W and
C-T experiments. In particular, it compelled re-consideration
of the M-W ana1ytical method, when this was used with the M-W,
rather than the long-tube type of reactor.
There fol10wed a series of experiments which
demonstrated that the satisfactory application of this method
for estimating oxygen atom concentrations was, indeed, subject
to certain conditions. In particular, the volume available in
which reaction might occur, after addition of the excess nitrogen
dioxide, was of paramount importance. This might be equally
weIl interpreted, of course, as a requirement for sufficient

____ .,"""~lWloff .. ______ '__. ______ . _________ ._
- 119 -
time in which to a110w the reaction to go to comp1etion.
Significant1y, this reaction volume (or reaction time),
fo110wing addition of nitrogen dioxide in excess, cou1d be
somewhat reduced, apparent1y, if the mixing efficiency were
improved by the use of bulb, instead of tapered, jets.
The conclusion may then be drawn, from the body of
data obtained in the present study, that the discrepancy
between the resu1ts of Mavroyannis and Wink1er, and those
subsequent1y obtained by C1yne and Thrush, resides in an
unsuspected appreciab1e time-dependence of the gas-phase
formation of N2
03
in the ana1ytica1 method used by Mavroyannis
and Wink1er. It is true that, according to Mavroyannis (171),
the ana1ytica1 method was checked and found to be satisfactory
(within t 3%), before it was app1ied to the study of the oxygen
reaction. It is not recorded, nor does either of the authors
* reca11 , which jet of the M-W reactor was used to introduce
nitrogen dioxide when the ana1ytica1 method was checked. It
is certain, on1y, that a jet close to the exit of the reactor
was used for ana1ytica1 purposes during the experiments with
oxygene The present investigation 1eaves no doubt that the
location of this jet was such that the reaction time pr~or to
.trapping the N20 3 was insufficient for the NO + N02
reaction to
achieve complet ion. The consequence of this wou1d be to make
the extent of oxygen atom production from the oxygen reaction
* Private communications.

- 120 -
Q-,"'" J',' appear to be less than the true value, and bring it into
correspondence with the hydrogen cyanide production from
ethylene, rather than the nitric oxide 'titration' value.
As a corollary to the above, it must be concluded,
finally, that the reaction of atomic nitrogen with molecular
oxygen occurs to an extent equal to the nitric oxide 'titration'
value for the nitrogen atom concentration in the system, as
contended by Clyne and Thrush. This conclusion, in turn,
supports this 'titration' value, rather than the maximum
hydrogen cyanide yield from ethylene, as a measure of the
nitrogen atom concentration in active nitrogen .
.. , Î;;
-~'!!~----- ----------------------------------
(J-'" Ji; , -,
- 121 -
SUMMARY AND CONTRIBUTIONS TO KNOWLEDGE
1. The maximum yie1ds of oxygen atoms, from the
reactions of active nitrogen with nitric oXide, and with
molecular oxygen, respectively, were determined by the nitrogen
dioxide 'titration' at various 1evels in a long-tube reactor,
o at about 150 C and 2 mm Hg. It was found that the maximum
oxygen atom production was essentia1ly the same in both cases.
2. The maximum oxygen atom production from the reaction
of active nitrogen with molecular oxygen, in the long-tube
reactor, was measured by the excess nitrogen dioxide method, at
400 + 20
C and 1 and 2 mm Hg. The results again indicated that
the maximum oxygen atom concentration was in accordance with
the nitric oxide 'titration' value of active nitrogen, and not
with the maximum production of hydrogen cyanide from the active
nitrogen-ethylene reaction under the same experimental
conditions.
3. For the active nitrogen-oxygen reaction,
6Ho = -32.8 kcal/mole,
fol1owed by
N + NO - -75.1 kca1/mo1e,
the rate constant k 1 was found to be
k l = 3.76 x 10¹²
exp(-7,000/RT) cc mole- l -1 sec

-----~._----------- -
122 -
over the temperature range 453 o
to 603 K, and pressure 3 mm Hg.
4. The active nitrogen concentration inferred from the
nitric oxide 'titration' remained almost constant, after
prolonged and continuous periods of operation of the microwave
discharge, at the pressures of 2, 3 and 4 mm Hg.
5. The effects of certain additives, such as water
vapour, hydrogen and oxygen, on the nitric oxide 'titration'
value of active nitrogen were studiec1. AlI of them showed,
more or less, a COmmon behaviour when introduced before the
microwave discharge. This, combined with other observations,
suggested that these substances, or their dissociation products
in the discharge, promoted the dissociation of nitrogen.
6. It was found that the NO/HeN ratio remained almost
unchanged near the inlet, and near the exit of the reactor,
whether in an 'unpoisoned' or a 'poisoned' system, Le. it
remained constant with decay"of active nitrogen, at constant
pressure and room temperature. However, the same ratio
increased with pressure, over the range of pressures from 0.75
to 2.5 mm Hg, and finally reached a plateau value at 2.5 mm Hg,
and remained constant with further increase of pressure to 3,
4 and 5 mm Hg.
7 • The maximum oxygen atom production from the reaction
of active nitrogen with molecular oxygen, in a short reactor
with multiple jets (such" as that used by Mavroyannis and
t' Winkler), was in agreement with the maximum yield of hydrogen -

- 123 -
--1: cyanide from the active nitrogen-ethy1ene reaction. Th is
deviation from the previous resu1ts was fina11y traced to a
deficiency in the ana1ytica1 method based on the trapping
N2
03
in the presence of excess nitrogen dioxide.
8. This ana1ytica1 method was re1iab1e on1y if
sufficient volume was avai1ab1e (i.e. sufficient reaction time
was permitted), after the in1et point for nitrogen dioxide, to
permit the NO + N02
reaction to go to comp1etion. The
deficiency of the ana1ytica1 method provided an answer to the
discrepancy between the ear1ier studies by C1yne and Thrush, on
one hand, and those of Mavroyannis and Wink1er on the other.
9. For the reaction of nitric oxide with nitrogen
dioxide,
the rate constant kwas estimated to be
9 -1-1 k = 1.3 x 10 cc mole sec
o at 30 C, and pressure 3.3 mm Hg.

- 124 -
BIBLIOGRAPHY
1. Warburg, E., Arch. de Gen., (3) 11,504 (1884).
2. Lewis, P.E., Astrophys. J., 11, 8 (1900).
3. Strutt, R. J . , Proc. Roy. Soc. (London), A85, 219 (1911).
Ibid. A86, 56 (1912).
Ibid. ill, 539 (1913).
Ibid. A9I, 303 (1915).
4. Mitra, S.K., 'Active Nitrogen - A New Theory', Association for the Cu1tivation of Science, Calcutta, India (1945).
5. Jennings, K.R. and Linnett,J.W., Quart. Rev., 11, 116 (1958).
6. Edwards, J.W., 'Formation and Trapping of Free Radica1s', edited by Bass, A.M. and Broida, H.P., Academic Press, New York (1960).
7. Mane11a, G.G., Chem. Rev., &1, 1 (1963).
8. B ur k e, J. B . B., Ph il. Ma g ., .1 , 34 2 (1 90 1) .
9 . S tan 1 e y , C. R., Pro c. Ph ys. Soc., A 6 7, 8 2 1 (1 954 ) .
10. Armstrong, D.A. and Wink1er, C.A., J. Phys. Chem., 60, 1100 ( 1956) .
Il. Kent y, C. and Turner, L.A., Phys. Rev., 11, 799 (1928).
12. Comte, F.A., z. Physik, 14, 74 (1913).
13. Lewis, B., J. Am. Chem. Soc., 11, 654 (1929).
14. Rayleigh, Lord, Proc. Roy. Soc. (London), !151, 567 (1935).
15. And ers 0 n, J. M., Pro c. Ph ys. Soc., A 7 Q., 887 (1957).
16. Bonhoeffer, K.F. and Kaminsky, G., Z. Phys. Chem., 127, 385 (1927).
17. Rayleigh, Lord, Proc. Roy. Soc. (London), !180, 140 (1942).
18. Benson, J.M., J. App1. Phys., ~1, 757 (1952).
19. Wi11ey, E.J.B. and Ridea1, E.K., J. Chem. Soc., 669 (1927).
- 125 -
20 .. Rayleigh, Lord, Proc. Roy. Soc. (London), ~102, 453 (1922).
21. Kaplan, J., Nature, 122, 771 (1928).
22. McLennan, J. C. , Ruedy, R. , and Anderson, J . W., Trans. Soc. Can. , 22, 303· (1928).
23. Kaplan, J. , Phys. Rev. , 33, 189 (1929).
24. Reinecke, L. H. , Z. Phys ik, 135, 361 ( 1953) .
25. Herzberg, G. H. , Z. Phys ik, 46, 878 (1928).
26. Kistiakowsky, G.B. and Warneck, P., J. Chem. Phys., ]:.l, 1417 (1957).
27. Berkowitz, J., Chupka, W.A., and Kistiakowsky, G.B., J. Chem. Phys., 12,,457 (1956).
Roy.
28. Rayleigh, Lord, Proc. Roy. Soc. (London), A176, 1 (1940).
29. Wil1ey, E.J.B. and Rideal, E.K., J. Chem. Soc., 1804 (1926).
30. Okubo, J. and Hamada, H., Phil. Mag., 1, 372 (1928).
31. Foote, P.D., Ruark, A.E., and Chenau1t, R.I .. , Phys. Rev., 25, 241 (1925).
32. Rayleigh, Lord, Proc. Roy. Soc. (Londo,n), ~176, 16 (1940).
33. Herzberg, G., 'Mo1ecu1ar Spectra and Molecu1ar Structure. r. Diatomic Molecules', Van Nostrand, New York (1950). p. 450.
34. Gaydon, A.G., Nature, 153, 407 (.1944).
35. Gaydon, A.G., 'Dissociation Energies and Spectra of Diatomic Molecules', Chapman and Hall, London (1953). pp. 152-162.
36. Kistiakowsky, G.B., Knight, H.T., and Malin, M.E., J. Am. Chem. Soc., 1.1, 2972 (1951).
37. Hendrie, J.M., J. Chem. Phys., 22, 1503 (1954).
38. Frost, D.C. and McDowel1, C.A., Proc. Roy. Soc. (Lûüdon») A236, 278 ('1956).
3 9 . W 0 0 d, R . W " Ph il. Ma g., ~~ , 5 38 (1 92 2 ) .
40. Bonhoeffer, K.F., Z. Physik. Chem., 113, 199 (1924).

- 126 -
41. Sponer, H., Z. Physik, 34, 622 (1925).
42. Cario, G. and Kaplan, J., Z. Physik, 58, 769 (1929). Nature, 121, 906 (1928).
43. Jackson, L.C. and Broadway, L.F., Proc. Roy. Soc. (London), ~ 12 7, 678 (1930).
44. Wor1ey, R.E., Phys. Rev., 11, 531 (1948).
45. Herbert, W.S., Herzberg, G., and Mi11s, G.A., Cano J. Res., A1~, 35 (1937).
46. Cario, G. , Z. Physik, 89, 523 (1934).
47. Mitra, S.K. , Phys. Rev. , 90, 516 ( 1953) .
48. Brook, M. , Phys. Rev. , 92, 1079 ( 1953) .
49. Peyron, M. and Broida, H. P. , J. Physique, ll, 593 ( 1957) . 50. Le Blanc, F., Tanaka, Y., and Jursa, A., J. Chem. Phys.,
28, 979 (1958). 51. Bayes, K.D. and Kistiakowsky, G.B., J. Chem. Phys.,
l~, 992 (1960).
52. Dunford, H.B., J. Phys. Chem., il, 258 (1963).
53. Wrede, E.P., Z. Physik, 54, 53 (1929).
54. Tanaka, N., Jursa, A., and Le Blanc, F., 'The Thresho1d of Space', edited by Ze1ikoff, M., Pergamon Press, New York (1960). p. 89.
55. Bass, A.M. and Broida, H.P., Phys. Rev., 101, 1740 (1956). 56. Peyron, M. and Broida, H.P., J. Chem. Phys., lQ, 139 (1959). 57. Hea1d, M.A. and Beringer, R., Phys. Rev., 96, 645 (1954).
58. Jackson, D.S. and Schiff, H.I., J. Chem. Phys., ~, 2333 (1955). 59. Herzberg, G., 'Atomic Spectra and Atomic Structure',
Dover Publications (1944). p. 200.
60. Thrush, B.A., Proc. Roy. Soc. (London), A2~, 143 (1956). 61. Mi11igan, D.E., Brown, H.W., and Pimente1, G.J.,
J. Chem. Phys., ~, 1080 (1956).
62. Harvey, K.B. and Brmm, H.W., J. Chim. Phys., i§., 745 (1959).

---_._------~--_.--~_ .. _-----_._.-_ .. _._-_ .. _------------
~~.: ,~'/ ..... -
- 127 -
63~ Evans, H.G.V. and Wink1er, C.A., Cano J. Chem., 34, 1217 (19 64. Kaufman, F. and Ke1so, J.R., J. Chem. Phys., 1~, 510 (1958).
65. Lipscomb, F.J., Norrish, R.G.W., and Thrush, B.A., Proc. Roy. Soc. (London), !231, 455 (1956).
66. Dress1er, K., J. Chem. Phys., 1Q, 1621 (1959).
67. Morgan, J.E. and Schiff, H.I., Cano J. Chem., ~!, 903 (1963)
68. Starr, W.L., J. Chem. Phys., ~1, 73 (1965).
69. Starr, W.L. and Shaw, T.M., J. Chem. Phys., !t!t, 4181 (1966).
70. Morgan, J.E., Phi11ips, L.F., and Schiff, H.I., Dise. Faraday Soc., 11, 118 (1962).
71. Freeman, G.R. and Wink1er, C.A., J. Phys. Chem., 1~, 371 (1959).
72. Wright, A.N., Nelson, R.L., and Winkler, C.A., Cano J. Chem., !tQ, 1082 (1962).
73. Kistiakowsky, G.B. and Vo1pi, G.G., J. Chem. Phys., 28, 665 (1958).
74. Verbeke, G.J. and Wink1er, C.A., J. Phys. Chem., &~, 319 (196( 75. Khawaja, N.A., Ph.D. Thesis, McGi11 University (1962).
76. Jones, W.E. and Wink1er, C.A., Cano J. Chem., ~1,. 1948 (1964). 77. Freeman, C.G. and Phi11ips, L.F., J. Phys. Chem.,
&~, 362 (1964).
78. Lichten, W., J. Chem. Phys.,~, 306 (1957).
79. Wilkinson, P.G. and Mulliken, R.S., J. Chem. Phys., l!, 674 (1959).
80. Noxon, J.F., J. Chem. Phys., 1&, 926 (1962).
81. Carleton, N.P. and 01denberg, O., J. Chem. Phys., 1&, 3460 (1962).
82. Zipf, E.C., J. Chem. Phys., 1.§., 2034 (1963).
83. Phi11ips, L.F., Cano J. Chem., 43, 369 (1965).
84. Young, R.A., Cano J. Chem., 44, 1171 (1966).

- .,-~
./
- 128 -
85. Paraskevopou1os, G., Ph.D. Thesis, McGi11 University (1965).
86. Kistiakowsky, G.B. and Vo1pi, G.G., J. Chem. Phys., li, 1141 (1957).
87. C1yne, M.A.A. and Thrush, B.A., Proc. Roy. Soc. (London), ~261, 259 (1961).
88. Kaufman, F. and Ke1so, J.R., a.. Chem. Phys., ~2, 1209 (1957).
89. Back, R.A. and Mui, J.U.P., J. Phys. Chem., &&, 1362 (1962).
90. Zinman, N.G., J. Phys. Chem., 64,1343 (1960).
91. Fersht, E. and Back, R.A., Cano J. Chem., 43, 1899 (1965).
92. Dubrin, J., MacKay, C., and Wolfgang, R., J. Chem. Phys., ii, 2208 (1966).
93. Herron, J.T., J. Phys. Chem., ~~, 2736 (1965).
94. Westenberg, A.A. and De Haas, N., J. Chem. Phys., iQ., 3087 (1964).
95. Von Weyssenhoff, H. and Patapoff, M., J. Phys. Chem., &~, 1756 (1965).
96. Morse, F.A. and Kaufman, F., J. Chem. Phys., 42, 1785 (1965).
97. Elias, L., J. Chem. Phys., 44, 3810 (1966).
Ibid. 42,4311 (1965).
98. Spea1man, M.L. and Rodebush, W.H., J. Am. Chem. Soc., 12, 1474 (1935).
99. Lewis, B., J. Am. Chem. Soc., 1Q., 27 (1928).
100. Evans, H.G.V., Freeman, G.R., and Wink1er, C.A., Cano J. Chem., 34, 1271 (1956).
101. Greenb1att, J.H. and Wink1er, C.A., Cano J. Res., B 2 7, 7 21 (1949).
102. Versteeg, J. and Wink1er, C.A., Cano J. Chem., 11, 1 (1953).
103. Herron, J.T., Franklin, J.L., and Bradt, P., Cano J. Chem., 12, 579 (1959).
104. Mavroyannis, C. and Wink1er, C.A., Cano J. Chem., 40, 240 (1962).
105. Trick, G.S. and Wink1er, C.A., Cano J. Chem., lQ, 915 (1952).

- 129 -
106. Shinozaki, Y., Shaw, R., and Lichtin, N.L., J. Am. Chem. Soc., ll, 3l.1 (1964).
107. Gesser, H., Luner, C., and Wink1er, C.A., Cano J. Chem., 11, 346 (1953).
108. Versteeg, J. and Wink1er, C.A., Cano J. Chem., 11, 129 (1953) 109. Shavo, A. and Wink1er, C.A., Cano J. Chem., 11, 655 (1959). 110. Wright, A.N. and Wink1er, C.A., Cano J. Chem.,
40, 1291 (1963).
111. Gartaganis, P.A. and Wink1er, C.A., Cano J. Chem., 34, 1457 (1956).
112. B1ades, H. and Wink1er, C.A., Cano J. Chem., 29, 1022 (1951). 113. Onyszchuk, M., Breitman, L., and Wink1er, C.A.,
Cano J. Chem., 32,351 (1954).
114. Back, R.A. and Wink1er, C.A., Cano J. Chem., 11, 718 (1954). 115. Onyszchuk, M. and Wink1er, C.A., J. Phys. Chem.,
1'§!, 368 (1955).
116. K1assen, N.V., Onyszchuk, M., McCabe, J.C., and Wink1er, C.A., Cano J. Chem., 1&, 1217 (1958).
117. Armstrong, D.A. and Wink1er, C.A., Cano J. Chem., 11, 1649 (1955).
118. Dunford, B., Evans, H.G.V., and Wink1er, C.A., Cano J. Chem., 34, 1074 (1956).
119. Freernan, G.R. and Wink1er, C.A., J. Phys. Chem., 1'§!, 780 (1955).
120. Forst, W. and Wink1er, C.A., J. Phys. Chem., &Q, 1424 (1956). 121. Armstrong, D.A. and Wink1er, C.A., Cano J. Chem.,
1~, 885 (1956).
122. Sole, M.J. and Gartaganis, P.A., Cano J. Chem., 41, 1097 (1963).
123. Gartaganis, P.A., Cano J. Chem., 43, 935 (1965).
124. Haggart, C. and Wink1er, C.A., Cano J. Chem., 1~, 329 (1960). 125. Rabinowitch, E., Trans. Faraday Soc., 11, 283 (1937).

r "·"",i. 1.... ,.).:
- 130 -
126. Harteck, P., Reeves, R.R., and Manne11a, G., J. Chem. Phys., ll, 608 (1958).
127. Herron, J.T., Franklin, J.L., Bradt, P., and Dibe1er, V.H., J. Chem. Phys., 1Q., 879 (1959).
128. Wentink, T., Sullivan, J.D., and Wray, K.L., J. Chem. Phys., ~.§!, 231 (1958).
129. Mavroyannis, C. and Wink1er, C.A., Cano J. Chem., 39, 1601 (1961).
130. C1yne, M.A.A. and Thrush, B.A., Trans. Faraday Soc., 11, 69 (1961).
131; Phi11ips, L.F. and Schiff, H.I., J. Chem. Phys., 42, 3171 (1965).
132. Zabo1otny, E.R. and Gesser, H., J. Chem. Phys., 1~, 565 (1962). 133. Milton, E.R.V., Dunford, H.B., and Douglas, A.E.,
J. Chem. Phys., 11, 1202 (1961).
134. Wi1es, D.M. and Wink1er, C.A., Cano J. Chem., 22., 1298 (1957). 135. Milton, E.R.V. and Dunford, H.B., J. Chem. Phys.,
34, 51 (1961).
136. Khanna, S.N. and Wink1er, C.A. To be ptib1ished.
137. Wi1es, D.M. and Wink1er, C.A., J. Phys. Chem., g, 902 (1957). 138. Vadlamudy, S.V. and Wink1er, C.A. To be pub1ished.
139. Brennen, W.R. and Kistiakowsky, G.B., J. Chem. Phys., 44, 2695 (1966).
140. Westbury, R.A. and Wink1er, C.A., Cano J. Chem., 1J! , 334 (1960).
141. Jacob, A., Westbury, R.A. (Mrs.), and Wink1er, C.A. To be pub1ished in J. Phys. Chem.
142. Smith, J.J. and Jo11y, W.L., Inorg. Chem., !, 1006 (1965). 143. Bett, J.A.S. and Winkler, C.A., J. Phys. Chem., &~,2501 (1964). 144. Varney, R.N., J,' Chem. Phys., 11,866 (1955).
145. Kaufman, F. and Decker, L.J., Seventh Symp. 'Combustion Institute' p. 57 (Sept. 1958).

"'''1 J.'.' --"
\:' ,
- 131 -
146. Mavroyannis, C. and Wink1er, C.A., International Symposium on the Chemistry of the Lower and Upper Atmosphere, San Francisco, Ca1if., p. 177 (April 1961).
147. Wi11ey, E.J.B., J. Chem. So c, , 1146 ( 1930) .
i48. Wi11ey, E.J.B., J. Chem. Soc. , 336 (1930).
149. Kaplan, J. , Nature, .!1.2, 549 (1935).
150. Rayleigh, Lord, Proc. Roy. Soc. (London), !180, 123 (1942) .
151. Young, R.A., Sharp1ess, R.L., and Stringham, R., J. Chem. Phys., 40, 117 (1964).
152. Herron, J.T., J. Res. Nat!. Bur. Std., !69, 287 (1965).
153. Anderson, J.M., Proc. Phys. Soc., ~l, 299 (1966).
154. McCormick, K.S. and Anderson, J.M., Proc. Phys. Soc., ~, 311 (1966).
155. Back, R.A. and Wink1er, C.A. Unpub1ished Resu1ts.
156. Storr, R., Wright, A.N., and Wink1er, C.A., Cano J. Chem., ~Q, 1296 (1962).
157. Verhoek, F.H. and Danie1s, F., J. Am. Chem. Soc., 11., 1250 (1931).
158. Ko1thoff, I.M. and Sande11, E.B., 'Textbook of Quantitative Ana1ysis', McMi11an Co., New York (1952).
159. Kaufman, F., Proc. Roy. Soc. (London), !247, 123 (1958). J. Chem. Phys., ~~, 352 (1958).
160. Morgan, J.E., Ph.D. Thesis, McGill University (1962).
161. Sobering, S.E. and Wink1er, C.A., Cano J. Chem., 1&, 1223 (1958).
162. Beattie, I.R., Progr. Inorg. Chem. (F.A. Cotton, editor. Interscience), 1, 1 (1963).
1 163. Abel, E. and Prois1, J., Z. E1ektrochem., 11, 712 (1929).
164. Beattie, I.R. and Bell, S.W., J. Chem. Soc., 1681 (1957).
165. Hisatsune, I.e. and Dev1in, J.P., Spectrochim. Acta, .!.2, 401 (1960).

----~-------------- --- - -------------------------------- ----------------------------------- 132 -
166. Ashmore, P.G. and Tyler, B.J., J. Chem. Soc., 1017 (1961).
167. Leifer, E., J. Chem. Phys., ~, 301 (1940).
168. Benson, S.W., 'The Foundations of Chemica1 Kinetics', McGraw-Hi11 Co., New York (1960). p. 81.
169. Ashmore, P.G. and Levitt, B.P., Research, ~, S25 (1956).
170. Ashmore, P.G. and Burnett, M.G., Trans. Faraday Soc., 58, 253 (1962).
171. Mavroyannis, C., Ph.D. Thesis, McGi11 University (1961). p. 77