the rate of iron sulfide formation in the solar...
TRANSCRIPT
ICARUS 122, 288–315 (1996)ARTICLE NO. 0126
The Rate of Iron Sulfide Formation in the Solar Nebula
DANTE S. LAURETTA, DANIEL T. KREMSER, AND BRUCE FEGLEY, JR.
Department of Earth and Planetary Sciences, Campus Box 1169,Washington University, One Brookings Drive, St. Louis, Missouri 63130-4899E-mail: [email protected]
Received May 25, 1995; revised October 6, 1995
chemical reactions is preserved, with varying degrees ofalteration by subsequent processes such as thermal meta-The kinetics and mechanism of the reaction H2S(g) 1 Fe(s) 5
FeS(s) 1 H2(g) was studied at temperatures and compositions morphism and aqueous alteration, in chondritic meteorites.relevant to the solar nebula. Fe foils were heated at 558–1173 Despite the many advances made using meteorite studiesK in H2S/H2 gas mixtures (p25 to p10,000 parts per million and theoretical models to shape our understanding of theby volume (ppmv) H2S) at atmospheric pressure. Optical mi- solar nebula and to constrain conditions (e.g., temperature,croscopy and X-ray diffraction show that the microstructures pressure, and composition) in it, virtually nothing is knownand preferred growth orientations of the Fe sulfide scales vary about the rates at which chemical reactions between gaseswith temperature and H2S/H2 ratio. Initially, compact, uni-
and grains took place in the solar nebula. Such kinetic dataformly oriented scales grow on the Fe metal. As sulfidationare fundamental for addressing first order questions suchproceeds, the scales crack and finer grained, randomly orientedas how volatiles were retained by the terrestrial planets.crystals grow between the metal and the initial sulfide scale.
Simple collision theory (SCT) models of gas–grain kinet-The composition of the scales varies from Fe0.90S to FeS withics in the solar nebula were first presented by Fegley (1988).temperature and H2S/H2 ratio, in agreement with thermody-
namic calculations. The weight gain and thickness change of the This SCT modeling considered the rates of gas–grain reac-samples give nearly identical measures of the reaction progress. tions that were previously predicted by thermodynamicSulfide layers formed in 25–100 ppmv H2S grow linearly with calculations to form three important volatile-bearingtime. Iron sulfides formed in p1000 ppmv H2S originally grow phases in chondrites: hydrated silicates, magnetite, andlinearly with time. Upon reaching a critical thickness growth troilite. The SCT models assumed that metal and silicatefollows parabolic kinetics. Iron sulfide formation in 10,000 grains were monodispersed spheres comparable in size toppmv H2S also follows parabolic kinetics. The linear rate
interstellar dust and fine-grained meteorite matrix (p0.1equation for sulfidation of Fe grains (#20 mm diameter) inem radius). The kinetic theory of gases and kinetic datathe solar nebula is d(FeS)/dt 5 kfPH2S 2 krPH2
(cm hour21).from the materials science literature were used to estimateThe forward and reverse rate constants are (cm hour21
the reactive fraction of collisions and to calculate the chem-atm21) kf 5 5.6(61.3)exp(227950(67280)/RT) and kr 5ical lifetime (tchem) of the different reactions. Unless the10.3(61.0)exp(292610(6350)/RT), respectively. The activa-
tion energies for the forward and reverse reactions are p28 kJ tchem value for a reaction is less than or equal to the nebularmole21 and p93 kJ mole21, respectively. FeS formation in the lifetime, the reaction is too slow to take place in the solarsolar nebula is rapid (e.g., p200 years at 700 K and 1023 bars nebula. Current estimates of the solar nebula lifetime aretotal pressure for 20 mm diameter Fe grains) as predicted by 0.1–10 million years (Podosek and Cassen 1994). The SCTsimple collision theory models of FeS formation. 1996 Aca- models predicted that the tchem value for hydrated silicatedemic Press, Inc.
formation is about 4.5 billion years, that the tchem for mag-netite formation is about 320,000 years, and that the tchem
for troilite formation is only 320 years (Fegley 1988). Be-INTRODUCTIONcause gas–grain reaction rates decrease with increasinggrain size for SCT models, larger tchem values result if largerChemical reactions between gases and grains in the solargrain sizes are assumed. The SCT models of gas—grainnebula played a major role in establishing the chemistrychemistry were also applied to clathrate hydrate formationand mineralogy of the material which later formed theand reactions in the Jovian and Saturnian circumplanetaryplanets, their satellites, and the other bodies in the solarnebulae (e.g., Fegley 1988; Fegley and Prinn 1989; Prinnsystem. Over 30 years of meteorite studies (reviewed inand Fegley 1989; Fegley 1993).Kerridge and Matthews 1988) and chemical equilibrium
Although the SCT models provide new insights intomodeling of nebular chemistry (e.g., Lord 1965; Larimer1967; Lewis 1972) demonstrate that evidence of nebular the kinetics of gas–grain reactions in the solar nebula,
2880019-1035/96 $18.00Copyright 1996 by Academic Press, Inc.All rights of reproduction in any form reserved.

IRON SULFIDE FORMATION EXPERIMENTS 289
experimental studies of key reactions such as hydratedsilicate formation, magnetite formation, and troilite forma-tion are fundamental for understanding the kinetics andmechanisms of gas–grain reactions in the solar nebula andin other protoplanetary nebulae. Because no prior workhas been done, we began a study of gas–grain kineticsunder temperature, composition (and eventually pressure)conditions relevant to the solar nebula. Preliminary resultswere reported earlier (e.g., Lauretta and Fegley 1994a,1994b, 1994c; Lauretta et al. 1995a, 1995b).
Here we describe a detailed experimental study of thekinetics and mechanism of troilite (FeS) formation via thereaction H2S(g) 1 Fe(s) 5 FeS(s) 1 H2(g) at temperaturesand compositions relevant to the solar nebula. This studywas undertaken for a number of reasons. Sulfur is the tenthmost abundant element in solar material and is the secondmost abundant volatile element in chondritic rock. Chemi-cal equilibrium calculations predict that in the solar nebula,sulfur first condenses as troilite (e.g., Larimer 1967), themost common sulfide found in meteorites.
We first present revised troilite condensation calcula-tions. Then we describe our experimental study and pres-ent the results. The data are then used to model Fe sulfideformation kinetics in the solar nebula and to briefly discuss FIG. 1. Calculated condensation temperatures for troilite (FeS) as
a function of the H2S/H2 ratio. The horizontal dashed line shows thethe origin of troilite and pyrrhotite (Fe-deficient FeS) inH2S/H2 ratio of p33 3 1026 in solar gas (Anders and Grevesse 1989;meteorites and interplanetary dust particles.Dreibus et al. 1995). The two lines intersect at p713 K where FeS formsfrom pure Fe metal in a solar gas. FeS forms from solar FeNi alloy at
CONDENSATION CALCULATIONS p710 K. The solid and hollow symbols indicate where our experimentsand prior work were done.
We reexamined Fe sulfide condensation for two reasons.The first is the recent claim that monoclinic pyrrhotite(Fe0.875S)and iron metal coexist in a solar gas (Wood and metric data for the enthalpy of formation of troilite andHashimoto 1993). This result is contradicted by the phase for the heat capacities of four pyrrhotites (Fe0.98S, Fe0.90S,diagram for the Fe–S system because the sulfide in equilib- Fe0.89S, and Fe0.875S) and troilite (Cemic and Kleppa 1988;rium with Fe metal is troilite (Hansen and Anderko 1958). Grønvold et al. 1991; Grønvold and Stolen 1992). TheseThe second reason is the recent publication of new calori- data and the sulfur activity measurements by Rau (1976)
and by Toulmin and Barton (1964) were used by Grønvoldand Stølen (1992) to produce an internally consistent set
TABLE I of thermodynamic properties for troilite and for Fe0.98S toIron Sulfide Condensation Temperatures Fe0.875S. We used their thermodynamic data for Fe sulfides,in the Solar Nebulaa
JANAF data for H2S and other sulfur gases (Chase et al.1985), and the solar S/H2 ratio of 3.31 3 1025 (Anders andGrevesse 1989; Dreibus et al. 1995) to calculate Fe sulfidecondensation temperatures via the reaction
H2S(g) 1 (1 2 d)Fe(s) 5 Fe12d S(s) 1 H2(g). (1)
The activity of Fe12d S was calculated from the equation
aFe12d S 5 K1(PH2S/PH2)a12d
Fe , (2)a Solar H2S/H2 5 3.31 3 1025 (Anders and Grevesse 1989; Dreibus
et al. 1995).where 1 2 d is the Fe/S atomic ratio in the Fe sulfide (d pb Fe0.98S condenses less than 1 K below FeS.0 in troilite and 0 , d # 0.125 in pyrrhotites), ai is thec The estimated uncertainty is 610–208.
d Monoclinic Fe7S8 . activity of species i, K1 is the equilibrium constant for

290 LAURETTA, KREMSER, AND FEGLEY
at 10211 bars and p16% at 10212 bars at p720 K for pressuresof 10211 bars and below.
Table I lists the condensation temperatures for five Fesulfides (Fe0.875S to stoichiometric FeS) and the Fe/FeSboundary is plotted in Fig. 1. FeS condenses at 713 K, 57K higher than Fe0.875S and before any other sulfide exceptFe0.98S, which condenses less than 1 K below FeS. Our FeScondensation temperature is slightly higher than calculatedpreviously because of improvements in the elemental abun-dances and thermodynamic data (see Table II). The com-bined uncertainties in the FeS condensation temperaturedue to uncertainties in the solar S/H2 ratio, in the thermody-namic data for FeS and H2S, in the aFe value (pure Fe vs solarFe–Ni alloy), and from the linear fit of log10aFe vs 1/T are610–20 K. Although some of the prior results overlap ourFeS condensation temperature within 610–208, we recom-mend use of our value because it is based on updated ele-mental abundance data (Anders and Grevesse 1989; Drei-bus et al 1995) and improved thermodynamic data for FeSand pyrrhotites (Gronvold and Stolen 1992).
We also calculated the distribution of sulfur betweengas and FeS as a function of temperature (Fig. 2). The50% condensation temperature for sulfur is 674 K, and100% of the sulfur is in FeS by 400 K. As discussed later,
FIG. 2. A plot of the calculated distribution of sulfur between gaseous troilite formation in the solar nebula is rapid. Therefore,and solid phases from 400 to 2000 K at 1023 bars total pressure. Troilite the variation in the sulfur content of chondritic materialfirst condenses at the pressure independent temperature of p713 K in a
is probably due to separation of grains from the gas (e.g.,solar gas. The 50% condensation temperature for sulfur is 674 K, andby accretion into larger bodies) at temperatures above100% of the sulfur is incorporated into FeS by 400 K.400 K and not due to slow equilibration of grains with gas(cf. Larimer 1967; Larimer and Anders 1967).
reaction (1), and Pi is the partial pressure of gas i. Thecalculations were done both for pure Fe metal and for FE SULFIDE FORMATION EXPERIMENTSa solar composition Fe–Ni alloy assuming an ideal solidsolution. The resulting condensation temperatures are Fe sulfide formation was studied by isothermally heating
high purity Fe foils of known weight and surface area inpressure independent down to p10211 bars, where signifi-cant amounts of S2 begin to be produced by H2S thermal constantly flowing H2S–H2 gas mixtures at ambient atmo-
spheric pressure. About 120 experiments were done todissociation. For example, the S2/H2S molar ratios are p2%
TABLE IIComparison of FeS Condensation Temperatures (K) in a Solar Gas
a Larimer (1967) calculated the Gibbs free energy of formation of FeS from the elements using data from Richardsonand Jeffes (1952) and Rosenqvist (1954).
b Urey (1952) calculated the equilibrium constant for the reaction H2S 1 Fe 5 FeS 1 H2 using data from Rossini et al.(1952) and Kelley (1949).
c H abundance from Anders and Grevesse (1989).

IRON SULFIDE FORMATION EXPERIMENTS 291
TABLE IIIIron Sulfidation Experiments

292 LAURETTA, KREMSER, AND FEGLEY
TABLE III—Continued
a–n The H2S contents (in ppmv) of the different gas cylinders used are as follows: (a) 27/28.4, (b) 29.6/29.8, (c) 53, (d)51.7, (e) 52.3, (f) 51.4, (g) 100.1, (h) 96.4, (i) 885, (j) 884, (k) 868, (l) 10800, (m) 10900, (n) 9800. n.a. 5 not analyzed.

IRON SULFIDE FORMATION EXPERIMENTS 293
TABLE IVPrevious Kinetic Studies of FeS Formation
* Experiments done at 40.8 atm total pressure.
determine the effects of temperature and H2S/H2 ratios standards (accurate to 62% of the analyzed value) withnominal H2S concentrations of 25, 50, 100, 1,000, andon the composition and microstructure of the Fe sulfide
formed and on the rate of reaction. The temperatures and 10,000 ppmv. The actual H2S concentrations are listed inTable III. The gas flow rates were controlled using highH2S/H2 ratios of the experimental runs are shown as black
dots in Fig. 1 and are listed in Table III. As summarized accuracy rotameters. The linear flow velocities of p95cm/min are rapid enough to avoid gas unmixing by thermalin Table IV, much of the prior work on FeS formation has
been done in sulfur vapor or gas mixtures irrelevant to the diffusion (Darken and Gurry 1945). Good agreement be-tween predicted and observed Fe/S ratios in the Fe sulfidesolar nebula. Furthermore, the prior studies using H2S/H2
mixtures had H2S/H2 ratios higher than the solar S/H ratio layers shows that thermal diffusion was not a problem.At the end of the reaction, the furnace was flooded with(e.g., see the hollow symbols in Fig. 1). Iron foils (Johnson–
Matthey Puratronic grade 99.998% pure on a metals basis) N2 gas, and the sample was moved to the cool end of themuffle tube. The sample temperature dropped to 508Cwere carefully weighed (to 61 eg) and measured (to
60.00025 cm) and then reacted in vertical (runs 1–34, 37, within 5 min. We did not quench the samples more rapidlybecause the fragile FeS layers might have been damaged39, 41) and horizontal tube furnaces (runs 35, 36, 38, 40,
42–122). In both types of furnaces the samples were sus- and/or lost. Other workers studying oxide layer formationon Fe metal quenched their samples in the same mannerpended next to Pt/Pt90Rh10 thermocouples. Over 30 days
the temperatures fluctuated by #18C. The total uncertainty (Turkdogan et al. 1965).in the run temperatures is 6 3–58 C.
At the start of the experiment the sample was placed CHARACTERIZATION OF REACTED SAMPLESinto the end of the muffle tube while the tube was flushedwith prepurified N2 (.99.998%). After 10 min of flushing (a) X-ray diffraction. XRD patterns were obtained us-
ing a Rigaku vertical powder diffractometer with CuKawith N2 , the sample was moved into the hot zone and thefurnace was then flooded with prepurified H2 (.99.99%). (l 5 1.540598 A) radiation and Materials Data Incorpo-
rated (MDI) software. In many cases XRD patterns ofThe sample was annealed in H2 for 24 hr at 750 K. Afterannealing, the sample was cooled to the run temperature the layers were taken to identify the sulfide formed (e.g.,
troilite vs pyrrhotite) and the crystal growth planes. If aunder H2 gas and the furnace was flooded with the H2S–H2
mixture, starting the sulfidation experiment. thick enough sulfide layer had formed, it was powderedunder acetone in an agate mortar and used for preciseThe H2S–H2 gas mixtures used were Matheson certified

294 LAURETTA, KREMSER, AND FEGLEY
measurements of the Fe/S atomic ratio by determining the shows a sample formed in p100 ppmv H2S at 673 K. Theunbroken sulfide layer is in continuous contact with theposition of the d(102) peak of the NiAs-type cell (the (114)
reflection in the troilite cell or the (866) line in the 5C metal and has no visible void space. However, the metalsurface is very rough and jagged. Figure 4b shows a blis-pyrrhotite superstructure cell). During these measure-
ments silicon powder (NIST 640b) was used as an internal tered sulfide layer. A second sulfide layer formed underthe blister and merged with the original layer. The innerstandard. Each sample was measured twice and all data
for samples along an isotherm were averaged together. layer is half as thick as the outer layer. Figure 4c showstwo thick, well developed sulfide layers. The outer sulfideThe 1s uncertainties on the Fe/S ratios were calculated
using small number statistics (Wilson 1952). layer detached from the metal surface after a relativelylow extent of reaction.(b) Electron microprobe analyses. Electron micro-
Some conditions lead to formation of sulfide layers thatprobe analyses were done with the Washington Universityslide off from the metal surface as thin, cohesive sheetsJEOL-733 electron microprobe equipped with Advancedthat remain intact as long as they are not handled roughly.Microbeam automation. An accelerating voltage of 15 kVOptical microscopy and XRD patterns of the inner andwas used with 30 nA beam current and a beam diameterouter surfaces of some of these layers show large, uniformlyof 1 em. X-ray matrix corrections were based on a modifiedoriented crystals on the outer sides and smaller, randomlyArmstrong (1988) CITZAF routine.oriented crystals on the inner sides. Figure 4d shows threePyrite (FeS2) was used as a primary standard because it isthin, compact sulfide layers with very little cracking. Thishomogenous and stoichiometric, whereas troilite displayssuggests that the growth and rapid removal of thin layersdeviations from the ideal stoichiometry (Condit et al. 1974;from the metal surface leads to these multilayer structuresHorwood et al. 1976; Rau 1976). Numerous analyses of theand that the layers do not deform towards the retreatingFeS2 standard as an unknown yielded Fe/S 5 0.500 6metal interface. This growth behavior allows almost contin-0.003 (1s) while analyses of the FeS standard (Stauntonuous contact between the gas and metal. As a result, linearoctahedrite troilite) gave Fe/S 5 0.982 6 0.007. Further-growth kinetics are observed even after long reactionmore, the detected X-ray maxima (spectrometer peak posi-times.tion) for Fe and S on the standards and experimental
Figure 4e shows a sulfur rich pyrrhotite (pFe0.90S) withcharges were repeatedly compared and found to be iden-a large amount of vertical cracking characteristic of thistical.phase (e.g., Fig. 4 of Fegley et al. 1995). This sample formedat a relatively high sulfur fugacity, and its compositionMICROSTRUCTURE AND MORPHOLOGYagrees with thermodynamic predictions. Figure 4f illus-OF SULFIDE LAYERStrates a good example of the distinct two layer structurewith noticeably different crystal sizes and orientations.(a) Features observed in cross sections. The microstruc-
tures, morphologies, and preferred growth orientations of However, the inner layer is much thicker than that shownin Fig. 3d. Apparently, transverse cracks formed in thisthe Fe sulfide scales vary with temperature and H2S/H2
ratio. Figure 3 shows typical microstructures and morphol- sample at a much earlier stage of the reaction and led tothe formation of a large inner layer at the expense of theogies for sulfide layers formed at 778 K in p1000 ppmv
H2S. After 5 hr the sulfide totally covers the metal surface outer one. In fact, a large range of both inner and outerlayer thickness were observed in our experimental samples.(Fig. 3a). As the reaction proceeds, the metal retreats
from the sulfide layer creating void space (Fig. 3b, 3c). The The formation of the inner layer is dependent on the timingof the fracture of the outer sulfide layer.sulfide layer plastically deforms into the newly created void
space to maintain contact with the metal. When the iron Figures 4g and 4h show two samples with large, butdrastically different sulfide layers. The sample in Fig. 4gsulfide reaches its deformation limit, it cracks and gas pene-
trates to the metal–sulfide interface. Finer grained, ran- was heated for 90 min at 1173 K in an p10,000 ppmv H2Sgas mixture. About 55% of the iron metal reacted to formdomly oriented crystals then grow between the metal and
original sulfide scale leading to two distinct sulfide layers large, uniformly oriented sulfide crystals. The absence ofa well developed inner layer suggests that transverse crack-(Fig. 3d). The outer layer contains larger, compact, uni-
formly oriented crystals separated by transverse cracks and ing did not occur until the later stages of reaction. Incontrast, the sample in Fig. 4h was heated in p10,000 ppmvthe inner layer contains smaller, randomly oriented crystals
with a large amount of void space. The two layers are H2S at 923 K for 18.5 hours. About 80% of the iron metalreacted during heating. The outer sulfide layer is noticeablyseparated by long longitudinal cracks. The brittle outer
layer easily breaks away from the sample during handling. different than that shown in Fig. 4g. The sulfide crystalsare not as blocky and straight edged and an inner sulfideIn contrast, the inner layer adheres strongly to the metal.
Sulfidation of iron metal frequently, but not exclusively, layer has formed.Observations of two distinct crystal layers, of transverseleads to the formation of two sulfide layers. Figure 4a

IRON SULFIDE FORMATION EXPERIMENTS 295
FIG. 3. Reflected light photomicrographs illustrating variations of sulfide layer morphology with increasing reaction time. All samples wereformed in p1,000 ppm H2S at 778 K. Reaction times are 5, 24, 48, and 450 hr for a, b, c, and d respectively. Each scale bar corresponds to 32 em.
and longitudinal cracks, and of subsequent crystal growth phases (Mv,FeS/Mv,Fe 5 18.20 cm3/7.09 cm3 5 2.57). A largervalue is due to porosity within the sulfide layer. The slopeat the metal surface were also reported by metallurgists
who studied FeS formation in S vapor and H2S–H2 mix- of the line in Fig. 5 gives the average molar volume ratioof all the sulfide layers used in the regression. A least-tures (see Table IV and Young 1980). Thin paper-like
sulfide layers that easily detached from the metal were also squares analysis yieldsobserved by Orchard and Young (1989) during reactionsof H2S–H2 mixtures with Fe-Ni alloys. However, to our thsulfide 5 2.78(60.08)thFe 2 0.000(60.001), (3)knowledge, the formation of multiple smooth layers hasnot been reported previously. corresponding to a mean porosity of p8 6 3%. The void
space between the inner and outer sulfide layers probably(b) Porosity measurements. We measured the porosityaccounts for most of this porosity.of the sulfide layers by plotting their thickness versus half
of the thickness change of the iron metal (Fig. 5). This (c) Surface features. Figure 6 illustrates the range ofsurface features observed on the Fe sulfide layers. Abun-could be done for 60 of the 95 total samples. Assuming
that the area of the sample remained constant throughout dant small crystals growing in the striations of the ironmetal are commonly observed on samples reacted for shortthe reaction, the change in thickness is due to the increase
in volume from the conversion of Fe to FeS plus void times (Fig. 6a). The patchy sulfide growth is due to Fesulfide nucleation at high energy regions where imperfec-space. Ideally, the ratio of the two thicknesses should be
equal to the ratio of the molar volumes (Mv) of the two tions are present on the Fe metal surface. As the reaction

FIG. 4. Reflected light photomicrographs illustrating other observed variations in sulfide layer morphology. (a) Sample 31, formed in p100ppm H2S at 673 K and reacted for 102 hr. (b) Sample 91, formed in p10,000 ppm H2S at 558 K after 18.5 hr. (c) Sample 43, formed in p50 ppmH2S at 616 K after 74.5 hr. (d) Sample 46, formed in p50 ppm H2S at 614 K after 222 hr. (e) Sample 108, formed in p10,000 ppm H2S at 673 Kafter 118 hr. (f) Sample 15, formed in p1,000 ppm H2S at 851 K after 35 hr. The scale bar in (a)–(f) corresponds to 20 em. (g) Sample 86, formedin p10,000 ppm at 1173 K after 1.5 hr. Scale bar 5 80 em. (h) Sample 93, formed in p10,000 ppm H2S at 923 K after 18.5 hr. Scale bar 5 160em. See Text for discussion of features.
296

IRON SULFIDE FORMATION EXPERIMENTS 297
sulfur fugacity decreased. We observed hexagonal growthsteps only in sulfides formed in p1,000 ppmv H2S mixtures.
X-RAY DIFFRACTION RESULTS
(a) Growth orientations. XRD patterns of samplesformed under various experimental conditions are shownin Fig. 7. In the majority of cases, the pattern is dominatedby a single peak because the sulfide crystals at the outersurface of the sulfide layer are uniformly oriented along acrystallographic plane. However, the crystal orientation isnot the same for all the sulfide layers but varies with reac-tion conditions. The variation in preferred growth orienta-tion apparently affects the rate of FeS formation. A de-crease in the reaction rate between 613 K and 643 K in 50ppmv H2S correlates with a change in crystal orientation(Fig. 7). The change in growth orientation of sulfide layerswas reported by other groups (Narita and Nishida 1973a;Fryt et al. 1979b) but the underlying reasons are not wellunderstood (Young 1980).
(b) Fe/S ratios. The Fe/S atomic ratios of the sulfidesFIG. 5. Determination of sulfide layer porosity by comparison of the
were calculated from the mean d(102) spacings using themeasured sulfide layer thickness to the amount of Fe reacted. The slopeequation given by Yund and Hall (1969):is the ratio of molar volumes of FeS and Fe. The least-squares fit to the
data gives a calculated slope of 2.78 6 0.08 indicating a porosity of 8 6
3% for the FeS layers. Atom-% Fe 5 45.212 1 72.86(d102 2 2.0400) (4)
1 311.5(d102 2 2.0400)2
We also checked Eq. (4) by fitting our own parabolicprogresses the patchy regions grow together and small equation to the hexagonal pyrrhotite and troilite d(102)crystals cover the entire surface of the metal. The crystals spacings given by Arnold (1962), Toulmin and Bartongrow with time and distinct features are visible on larger (1964), and Fleet (1968). The calculated atomic percent-crystals. The majority of the crystals appear rounded, while ages for Fe agreed with those calculated from equationothers are acicular, or rectangular and blocky with sharp (4) within the 2s uncertainty of 60.13% (Yund andangles and smooth faces, and some have rough, striated Hall, 1969).
Table III lists all Fe/S ratios determined by XRD. Thesurfaces (Fig. 6b). Close examination of very large crystalsmean 1s uncertainties on the Fe/S ratios range from 60.9%reveals a thin skin ,1 em thick on the crystals (Fig. 6c).for XRD powder patterns measured with silicon powderEnergy dispersive spectrum (EDS) analyses show a largeas an internal standard to 62.0% for XRD patterns mea-amount of sulfur in this skin relative to the FeS crystals.sured by placing the entire sample into the diffractometer.Young (1980) reported the formation of thin layers ofWe compare these observed Fe/S ratios with those ob-pyrite at the outer edge of FeS layers formed under similartained from other methods and with predictions fromconditions, consistent with our EDS data.chemical equilibrium calculations.The sulfide grains are well developed and frequently
show 1208 triple junctions (Fig. 6b). Very little porosity is (c) Cell parameters. In samples that produced enoughevident and pores are mainly found inside grains and not material to obtain an XRD powder pattern, cell parametersat grain boundaries. Hexagonal plate-like steps are also were determined using the program MICRO-CELLREFcommonly observed on the grain surfaces (Fig. 6d). Similar from MDI. Various pyrrhotite unit cells were refined bysteps were also observed by Jamin-Changeart and Talbot- least squares techniques employing the Apple-NBS codeBesnard (1965) and by Narita and Nishida (1973a). The (Evans et al. 1973). The troilite unit cell(31/2A 2C) gavelatter authors noted that the steps imply screw dislocations the best fit in all cases except for sample 107, where theinside the sulfide grains. These steps are also observed in 5C pyrrhotite superstructure provided the best fit. Thelunar troilites that have apparently grown by vapor-solid latter result is consistent with the Fe/S ratio of 0.92 forreactions (e.g., Frondel 1975, Fig. 2.2). Narita and Nishida sample 107. In Fig. 8 we plot the length of the C axis of
the NiAs unit cell versus the atomic percentage of sulfur.(1973a) reported that the growth steps disappeared as the

298 LAURETTA, KREMSER, AND FEGLEY
FIG. 6. Reflected light photomicrographs of several surface microstructure features. (a) Sample 91, formed in p10,000 ppm H2S at 558 K.Patches of sulfide crystals are visible. The metal surface is not entirely covered and bare iron is still visible in the upper right corner of the photograph.Scale bar 5 80 em. (b) Sample 59, formed in p1,000 ppm H2S at 673 K. Several 1208 triple junctions are visible. In (b)–(d) scale bar 5 32 em.(c) Sample 98, formed in p10,000 ppm H2S at 923 K. A thin (p1 em) skin covers a large sulfide crystal. Steps on the surface of the crystal areapparent. (d) Sample 15, formed in p1,000 ppm H2S at 851 K. Hexagonal steps are visible in upper left corner of photo.
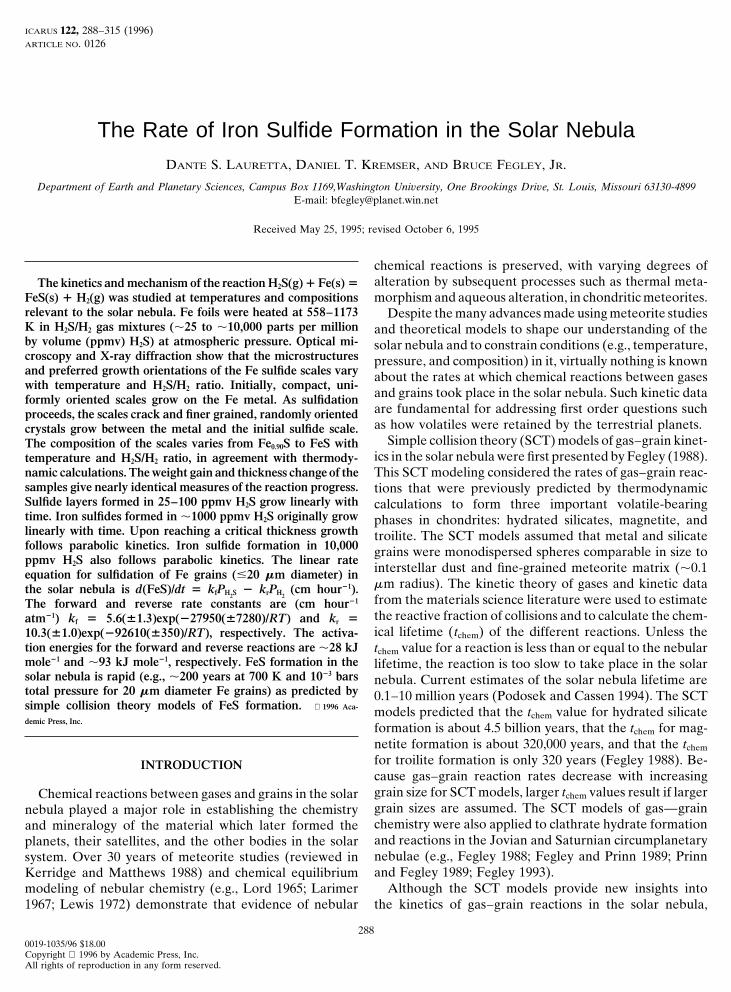
Data from Turkdogan (1968) and Haraldsen (1941) are along an isotherm are listed in Table V. The mean 1suncertainty on the Fe/S ratios is 61.5%.also shown. Turkdogan (1968) reported that the troilite
unit cell accommodates sulfide compositions ranging from We checked the electron microprobe analyses of oursamples by analyzing natural troilites from the StauntonFe/S p 0.98 to Fe/S p 1. This is consistent with our resultsoctahedrite, two LL3 chondrites (Y-790519 and ALH-764),that samples ranging in composition from Fe/S 5 0.984 to
1.007 have the troilite unit cell. and a lunar sample (67513, 7012). The natural troilites haveFe/S ratios ranging from p0.98 to p1.01 with typical 1suncertainties of 61–2%. The analyses with Fe/S .1.00ELECTRON MICROPROBE RESULTSpossibly include contributions from buried or neighboring
(a) Fe/S ratios. The bulk compositions of the sulfide Fe grains in the meteorite sections. The electron micro-layers were determined by averaging multiple electron mi- probe analyses of natural troilites and synthetic sulfidescroprobe analyses of each layer. The Fe/S ratios for individ- give the same range of Fe/S ratios (excluding the experi-ual samples are listed in Table III. The mean Fe/S ratios mental samples predicted to be hexagonal pyrrhotite in-
stead of troilite).for all sulfide layers produced in the same gas mixture

IRON SULFIDE FORMATION EXPERIMENTS 299
FIG. 7. Representative XRD patterns of Fe sulfides for various experimental conditions. Miller indices of each peak position in the troilitepattern are labeled at the top of the two columns. A single high intensity peak indicates preferential growth along a specific crystallographic axis.Crystal orientation varies with both gas composition and temperature of reaction. The reason for the variations are not well understood (e.g.,Young 1980).
(b) Traverses across layers. Electron microprobe tra- edge of the sulfide layer is in equilibrium with the externalH2S–H2 atmosphere, which generally has a higher sulfurverses were made across sulfide layers to determine
whether or not any compositional variations were present. fugacity ( fS2) than that fixed by the metal-sulfide bound-
ary. Thus, the outer edge of the sulfide should be moreStep sizes of 5–10 em were used. The analytical resultsare shown in Fig. 9 (p1000 ppmv H2S) and in Fig. 10 sulfur rich and have a lower Fe/S ratio. We return to
this point later when discussing the kinetics of sulfide(p10,000 ppmv H2S). The Fe/S atomic ratios are plottedversus x/xt , where xt is the total thickness from the layer formation.metal-sulfide interface. No traverses could be made forsulfide layers formed in the 25, 50, and p100 ppmv H2Smixtures because the layers were #5–10 em thick. GRAVIMETRIC ANALYSES BY COMBUSTION
The high Fe/S ratios measured close to the Fe–FeSboundary are probably due to boundary fluorescence of For samples where enough sulfide was produced, the
sulfides were analyzed gravimetrically by heating thethe nearby unreacted metal. Most layers show a decreas-ing Fe/S ratio and hence an increasing sulfur content powder in air at temperatures up to 11008C for several
days to form hematite (verified by XRD). The Fe/S ratiotoward the outer edge of the sulfide layer. This occurscontinuously (samples 62, 67, 70, 96, 97) or suddenly at in the starting material was calculated from the observed
weight loss. Depending on the amount of material avail-the end of the layer (samples 61, 63, 65, 68, 80, 81, 93).Narita and Nishida (1973b) reported similar variations able for combustion and the accuracy of weighing, this
method gives very accurate and precise determinationsin sulfur content in FeS formed on pure Fe at 973 Kunder various sulfur pressures. of the Fe/S ratio in an Fe sulfide. By using this method,
Condit et al. (1974) determined Fe/S ratios in pyrrhotiteThe observed decrease of the Fe/S ratio across thesulfide layers is explained by considering equilibrium at to 60.2% and Fegley et al. (1995) found that Fe/S ratios
in pyrite could be determined to 60.02%. The resultseach interface (Wagner 1951). The composition of thesulfide at the metal–sulfide interface is fixed at Fe/S 5 of the gravimetric analyses are listed in Table V and
plotted in Fig. 11.1 by the presence of the Fe metal. However, the outer
300 LAURETTA, KREMSER, AND FEGLEY
The dependence of the Fe/S ratio of Fe12d S upon the tem-perature and sulfur fugacity is well known (Barker andParks 1986; Burgmann et al. 1968; Nagamori and Kumeda1968; Niwa and Wada 1961; Rau 1976; Rosenquist 1954;Toulmin and Barton 1964; Turkdogan 1968). Hagg andSucksdorff (1933) showed that the Fe deficiency is due toFe vacancies in the lattice. Libowitz (1972) interpreted theexperimental studies of Fe12d S stoichiometry in terms ofFe vacancy formation.
Sulfur exchange between Fe12d S and a gas phase (e.g.,either sulfur vapor or an H2S–H2 mixture) occurs viathe reaction
AsS2 (g) 5 Ss 1 V0Fe 1 2h? (5)
which preserves mass, charge, and site balance. Equation(5) is written in Kroger–Vink notation in which the generalconvention SC
p is used to represent a species S with chargeC at crystallographic position P (e.g., see Schmalzried 1974;Kingery et al. 1976). Equation (5) shows that incorporationof a sulfur atom on a sulfur site (SS) in Fe12d S also leadsto the formation of an Fe vacancy with a 22 charge
FIG. 8. A plot of the variation in the C-axis of the NiAs unit cell (V0Fe) and of two electron holes which each have a 11as a function of atomic % sulfur. The Fe/S ratio is also plotted along the
charge (h?).top axis. Data from Turkdogan (1968) and Haraldsen (1941) are shownLibowitz (1972) derived equations which quantitativelyfor comparison. The solid line (from Turkdogan 1968) is the variation
in the NiAs unit cell with sulfur content. Our data (solid circles) cluster relate the Fe vacancy concentration (d) to the sulfur fugac-near the predicted value for the troilite unit cell. The point near 52 atomic ity ( fS2
). Rau (1976) subsequently made more precise mea-% sulfur is hexagonal pyrrhotite (see text for further discussion). surements of iron sulfide stoichiometry as a function of T
and fS2and revised Libowitz’s numerical constants. Rau’s
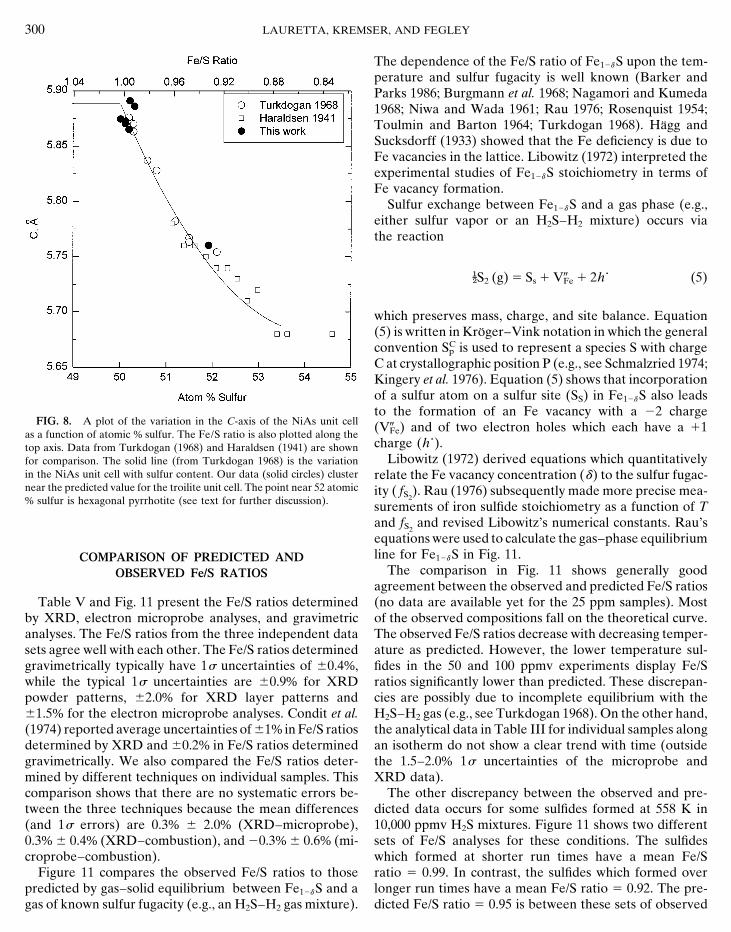
equations were used to calculate the gas–phase equilibriumline for Fe12d S in Fig. 11.COMPARISON OF PREDICTED AND
The comparison in Fig. 11 shows generally goodOBSERVED Fe/S RATIOSagreement between the observed and predicted Fe/S ratios(no data are available yet for the 25 ppm samples). MostTable V and Fig. 11 present the Fe/S ratios determined
by XRD, electron microprobe analyses, and gravimetric of the observed compositions fall on the theoretical curve.The observed Fe/S ratios decrease with decreasing temper-analyses. The Fe/S ratios from the three independent data
sets agree well with each other. The Fe/S ratios determined ature as predicted. However, the lower temperature sul-fides in the 50 and 100 ppmv experiments display Fe/Sgravimetrically typically have 1s uncertainties of 60.4%,
while the typical 1s uncertainties are 60.9% for XRD ratios significantly lower than predicted. These discrepan-cies are possibly due to incomplete equilibrium with thepowder patterns, 62.0% for XRD layer patterns and
61.5% for the electron microprobe analyses. Condit et al. H2S–H2 gas (e.g., see Turkdogan 1968). On the other hand,the analytical data in Table III for individual samples along(1974) reported average uncertainties of 61% in Fe/S ratios
determined by XRD and 60.2% in Fe/S ratios determined an isotherm do not show a clear trend with time (outsidethe 1.5–2.0% 1s uncertainties of the microprobe andgravimetrically. We also compared the Fe/S ratios deter-
mined by different techniques on individual samples. This XRD data).The other discrepancy between the observed and pre-comparison shows that there are no systematic errors be-
tween the three techniques because the mean differences dicted data occurs for some sulfides formed at 558 K in10,000 ppmv H2S mixtures. Figure 11 shows two different(and 1s errors) are 0.3% 6 2.0% (XRD–microprobe),
0.3% 6 0.4% (XRD–combustion), and 20.3% 6 0.6% (mi- sets of Fe/S analyses for these conditions. The sulfideswhich formed at shorter run times have a mean Fe/Scroprobe–combustion).
Figure 11 compares the observed Fe/S ratios to those ratio 5 0.99. In contrast, the sulfides which formed overlonger run times have a mean Fe/S ratio 5 0.92. The pre-predicted by gas–solid equilibrium between Fe12d S and a
gas of known sulfur fugacity (e.g., an H2S–H2 gas mixture). dicted Fe/S ratio 5 0.95 is between these sets of observed

IRON SULFIDE FORMATION EXPERIMENTS 301
values. XRD shows that the more Fe-rich sulfides are hex- (60.9–2.0%) of our XRD data, these samples have Fe/S 5 1.000. The XRD data of other investigators alsoagonal pyrrhotite.
Finally, we discuss the Fe/S ratio of troilite. Because have an uncertainty of 61% (e.g., Condit et al. 1974), sothe reported deviations from unity may not be significant.there is a finite concentration of lattice defects in any crystal
which is not at absolute zero, the Fe/S ratio of troilite is Nevertheless, careful gravimetric analyses may be ablenot equal to unity. Furthermore, because the concentration to resolve this question.of various types of defects is a function of the temperature
KINETICS AND MECHANISM OF IRONand the sulfur fugacity (e.g., Libowitz 1972; Rau 1976) theSULFIDE FORMATIONFe/S ratio of troilite should also vary with these parameters.
In fact, Libowitz (1972) calculated defect concentrations(a) Kinetic data. Two independent methods were usedvarying from 0.15% (Fe/S 5 0.9985) at 973 K to 1.04% at
to measure the extent of reaction as a function of time. In1373 K. Similar variations are predicted from Rau’s (1976)the gravimetric method, the fraction of Fe reacted (a) inequations mentioned earlier. In this regard we note thatthe samples was calculated from the observed weight gain.the predicted variation in the Fe/S ratio of troilite couldIron sulfide formation occurs via the reactionbe used as a mineralogical thermometer to measure
sulfide equilibration temperatures in meteorites. H2S(g) 1 (1 2 d)Fe(s) R Fe12d S(s) 1 H2(g), (1)Experimental determination of the Fe/S ratio in troilite
have been done by several groups. Rosenquist (1954) and the composition of each sulfide sample was determinedreported Fe/S 51.002, Turkdogan (1968) gave Fe/S 5 by one or more analytical methods (XRD, electron micro-0.992, Condit et al. (1974) report Fe/S 5 0.997, and probe, combustion). The fraction of Fe reacted (a) was
then calculated asHorwood et al. (1976) give Fe/S 5 0.996. Our own XRDresults give Fe/S 5 1.007–1.012 for the most Fe-richtroilites produced in our experiments (samples 27, 29, a 5 (1 2 d) fst
Dwwi
, (6)35, and 39 in Table III). However, within the uncertainty
TABLE VEffects of Temperature and Gas Composition on
Fe/S Ratio of Iron Sulfide Layers
a Uncertainties on XRD, microprobe, and combustion are 60.9–2.0%, 1.5%, and 0.4%, respec-tively.
b Combustion data are for samples 53, 54, 60, 86, 98, 109, and 110.

302 LAURETTA, KREMSER, AND FEGLEY
FIG. 9. Representative electron microprobe traverses across sulfide layers formed in p1,000 ppm H2S. The corresponding sample number islocated in the upper right corner of each plot. Normalized distance (distance from metal/total layer thickness) is plotted on the x-axis. The sulfidecomposition (Fe/S ratio) is plotted on the y-axis and ranges from 0.85 to 1.05. The dashed horizontal line represents the average of all points inthe traverse. Error bars represent 1s uncertainties.
where Dw is the weight gain, wi is the initial weight of thea 5 S1 2
Ct
C0D, (7)Fe, and fst 5 1.742 is a stoichiometric factor from the mass
balance of Eq. (1). The term (1 2 d) in Eq. (6) is calculatedfrom the analytical data. The a values calculated fromEq. (6) have typical uncertainties (1s) of 62% due to where C0 is the initial thickness of the Fe foil and Ct is the
thickness of the remaining Fe metal after reaction for someuncertainties in the stoichiometry and weight of thesamples. time t. The initial thickness of the Fe foils was measured
with a micrometer. The thickness of the remaining Fe metalIn the geometric method, a was calculated from thefractional thickness change of the Fe metal in the samples. (Ct) in the cross-sections of the samples was measured with
an optical microscope. The a values calculated from Eq.The equation used is

IRON SULFIDE FORMATION EXPERIMENTS 303
FIG. 10. Representative electron microprobe traverses across sulfide layers formed in p10,000 ppm H2S. A drastic change in composition occursbetween 48 and 72 hr in samples that form along the 558 K isotherm. The axes are the same as described in the caption for Fig. 9.
(7) have typical uncertainties (1s) of 63% due to the tion and tarnishing of metal, follow a variety of differentrate laws depending upon the type of metal, the time periodmeasurement uncertainties.
Figure 12 illustrates the excellent agreement between of reaction, the reactive gas partial pressure, and the ratecontrolling mechanism (e.g., see Schmalzried 1974). Ourthe two methods. An unweighted linear least-squares fit
to the 60 data points in Fig. 12 gives data show that Fe sulfide formation follows both linearand parabolic kinetics under the conditions studied.
Linear and parabolic rate laws were distinguished byageometric 5 0.01(60.04) 1 0.99(60.02)agravimetric (8)plotting the reaction progress (weight gain per cm2 samplearea) versus time. Straight lines indicate linear kinetics andwhich within uncertainty is the same as an 1 : 1 diagonal.
Table III lists the gravimetric and geometric a values for the slope gives the linear rate constant kl ,the experimental samples. Geometric data were obtained
(Dw/A) 5 klt (9)for 60 of the 95 samples. Measurements were not obtainedfor the other 35 samples because the layers were either In Eq. (9), Dw is the weight gain, A is the sample area intoo thin or were lost during sample polishing and mounting. cm2, t is time in hours, and kl has units of g cm22 hr21.Therefore, we used the gravimetric data to determine Linear kinetics are displayed during the early stages ofthe rate laws and their dependence on temperature and tarnishing reactions when the supply of gas molecules,H2S/H2 ratio. adsorption or chemical reactions at the solid–gas interface
control the overall rate of reaction.(b) Rate Laws. Gas–solid reactions, such as the oxida-

304 LAURETTA, KREMSER, AND FEGLEY
FIG. 12. A plot comparing the fraction of Fe reacted, calculated bytwo independent methods (gravimetric and geometric). The solid line isFIG. 11. A plot of the Fe/S ratios for sulfides formed under foura least-squares linear regression for 60 data points. Error bars are 1sdifferent H2S gas concentrations (nominally 50, 100, 1,000, and 10,000uncertainties. The error bars for the gravimetric data are smaller thanppm) as a function of temperature. The solid curve is the predictedthe plotted data points.variation in the Fe/S ratio derived from equations in Rau (1976). The
dashed vertical line represents the condensation temperature of FeS. Thesolid circles represent our XRD data, the solid triangles our electronmicroprobe data, and the open squares our combustion data. The 1suncertainties for each technique are also shown.
When the scale layer reaches a critical thickness, therate of diffusion of Fe21 through the product layer becomesslower than the rate of the chemical reaction at the sul-fide–gas interface (Wagner 1951; Schmalzried 1974). Thechemical potential gradient across the sulfide layer is thedriving force for the Fe21 ionic diffusion and this gradientis inversely proportional to the product layer thickness.Thus, in this case the rate law is expressed as
(Dw/A)2 5 kpt, (10)
where kp is the parabolic rate constant with units of g2
cm24 hr21. As Eq. (10) shows, plots of reaction progressversus time give parabolic curves. Equivalently, plotting(Dw/A)2 vs time or (Dw/A) vs time1/2 yields straight lineswith slope kp . The relationship of the linear and parabolicrate laws to the mechanisms for iron sulfide formation arediscussed later.
FIG. 13. Plots of reaction progress versus time along four isothermsFigures 13–14 show that all the experiments in the p50(558, 613, 643, and 673 K) for samples formed in p50 ppm H2S. Theand p100 ppmv H2S gas mixtures followed linear kinetics.dashed lines are linear least squares fits to the data. Linear kinetics are
This is also true for the samples that formed in the 25 observed at all temperatures. A large increase in reaction rate occursppmv H2S gas mixtures. The samples heated for shorter between 643 and 613 K and is potentially due to vacancy ordering in the
sulfide at lower temperatures.times have incompletely formed sulfide scales. However,

IRON SULFIDE FORMATION EXPERIMENTS 305
FIG. 15. Plots of reaction progress versus time along four isotherms(673, 778, 848, and 923 K) for samples formed in p1,000 ppm H2S. Thedashed lines are linear least-squares fits to data points for experiments#10 hr. The solid curves are parabolic fits to longer reaction time experi-ments. Experiments at all temperatures show a transition from linear toparabolic kinetic behavior.
scales must be thinner than the critical thickness wherediffusion becomes rate limiting.
Figure 15 shows the kinetic behavior for the p1,000ppmv H2S experiments where a transition from linear toparabolic kinetics is obvious. Optical microscopy (Fig. 3)reveals compact sulfide layers which do not have a largenumber of transverse cracks that extend down to the metal.These observations suggest that the gas did not have aneasy pathway to the metal surface. The inner sulfide layers,which formed by gas penetration to the metal surface, arethinner and less developed than in samples where morecracks are observed in the initial sulfide layer.
The kinetic behavior of the samples formed in gas mix-tures containing p10,000 ppmv H2S (Fig. 16) varies withtemperature. All sulfides formed at 923 K grew followingparabolic kinetics. Iron sulfide formation is extremely rapidunder these conditions and is complete within 24 hr. Thescales are thick and compact with little or no developmentFIG. 14. Plots of reaction progress versus time along three isotherms
(558, 658, and 723 K) for samples formed in p100 ppm H2S. The dashed of an inner layer. At 558 K a transition from linear tolines are linear least-squares fit to data. All samples display linear kinetics. parabolic kinetics occurs after 24 hr.
Linear kinetics that are somewhat erratic even for verylong reaction times (146 hr) are observed for samples re-acted at 673 K. This is due to the morphology of the layersthe samples heated for longer times are completely covered
by compact and relatively non-porous sulfide layers. Be- on these samples. As discussed earlier, the sulfide layerslift off the metal surface during the course of the reaction.cause sulfide growth follows linear kinetics, the sulfide

306 LAURETTA, KREMSER, AND FEGLEY
FIG. 17. A plot of the critical FeS layer thickness where the transitionfrom linear to parabolic kinetics occurs as a function of temperature.The transition data points were determined graphically from data withinFig. 15 and 16 and then correlated with sulfide layer thickness measure-ments. The uncertainties are calculated from the range of sulfide thicknessobserved in samples near the transition regions. The solid line is anexponential function fit to the data.
This allows continuous contact between the gas and themetal and results in linear kinetic behavior. The stage atwhich the sulfide pulls away from the metal is somewhatarbitrary and therefore erratic kinetic behavior is observedunder these conditions. Orchard and Young (1989) re-ported similar behavior for sulfide layers formed on iron-nickel alloys.
We used the data in Fig. 15–16 to estimate the criticalscale thickness for the transition from linear to para-bolic kinetics. All four of the isotherms studied in thep1,000 ppmv H2S gas mixtures and one in 10,000 ppmvH2S show a transition from linear to parabolic kineticbehavior. We graphically determined the transitionpoints and plot the corresponding layer thickness in Fig.17. We fit the critical thickness (ttr) data in Fig. 17 to theequation
FIG. 16. Plots of reaction progress versus time along three isotherms(558, 673, and 923 K) for samples formed in p10,000 ppm H2S. The
ttr 5 1033(6360) exp[22580(6295)/T] em (11)dashed lines are linear least-squares fits to data that display linear kinetics,while the solid curves are parabolic fits to data that display parabolickinetic behavior. Samples formed at 923 K display only parabolic kinetics, because of an exponential dependence of reaction rateswhile samples formed at 673 K display erratic linear kinetics. A transition
and diffusion coefficients on temperature.from linear to parabolic kinetics were observed along the 558 K isothermat approximately 25 hr. (c) Rate constants. After establishing the rate laws, we
calculated the appropriate linear or parabolic rate constantfor each sample. These calculations used the a values deter-

IRON SULFIDE FORMATION EXPERIMENTS 307
TABLE VImined from the gravimetric data. The geometry of theLinear Rate Constants and Iron Grain Lifetimessamples (thin rectangular or square foils with known thick-
ness) was explicitly taken into account (e.g., see Fegley etal. 1995).
In the case of linear kinetics, all sides of the foils areconstantly diminished by 22k9l t as the reaction proceedswith time (t) and the remaining volume (Vt) becomessmaller. The linear rate constant k9l (cm hr21) is related tokl by
kl 5 (rFeMS/MFe)k9l 5 4.51 k9l , (12)
where rFe is the density of Fe metal, and MS and MFe arethe atomic weights of S and Fe, respectively. The fractionof Fe left (1 2 a) is related to the remaining volume ofFe by (Brown et al. 1980)
(1 2 a) 5Vt
V05
(a0 2 2k9l t)a0
(b0 2 2k9l t)b0
(c0 2 2k9l t)c0
,
(13)
where V0 is the initial volume and a0 , b0 , and c0 are theinitial dimensions of the Fe foil. If a0 5 b0 5 c0 then Eq.(13) becomes the well known contracting volume equation(Brown et al. 1980)
(1 2 a)1/3 5 1 2 2k9l t/a0 5 1 2 k0l t (14)
However, our samples are not cubes, but are thin rectangu-a Errors are 61s.lar or square foils with a0 p b0 @ c0 (see Table III). Anb Growth along a-axis.approximate solution to Eq. (13) for k9l is possible because, c Growth along c-axis.
especially during the initial stages of reaction, a0 p b0 @k9l t. Thus, (a0 2 2k9l t)/a0 p (b0 2 2k9l t)/b0 p 1 and Eq. (13)can be simplified to rate constants (k9l ) for each gas mixture and temperature
are given in Table VI.In the case of parabolic kinetics, the thickness of each(1 2 a) p (c0 2 2k9l t)/c0 5 1 2 2(k9l /c0)t (15)
side of the foil is decreased by 2Ï2k9pt, where k9p (cm2
hr21) is related to kp (g2 cm24 hr21) byEquation (15) implies zero-order kinetics (i.e., linear ad-vance of the reaction interface with time) and, as demon-
kp 5 (rFe MS/MFe)2 k9p 5 20.3 k9p (17)strated by Fig. 12, is a fairly good approximation.However, especially during the later stages of reaction,
The fraction of Fe left (1 2 a) is related to the remainingthe approximations made in deriving Eq. (15) become lessvolume by the equationaccurate. We explicitly considered the three dimensional
geometry of the thin foils and solved Eq. (13) for k9l usingthe cubic equation (Fegley et al. 1995)
(1 2 a) 5Vt
V05
a0 2 Ï2k9pta0
b0 2 Ï2k9ptb0
c0 2 Ï2k9ptc0
(18)
(k9l )3 2L0
2t(k9l )2 1
A0
8t2 k9l 2aV0
8t3 5 0, (16) which can be simplified to
where L0 5 a0 1 b0 1 c0 , A0 5 2(a0b0 1 a0c0 1 b0c0), and (1 2 a) 5 1 2Ï2k9pt
c0(19)
V0 5 a0b0c0 . The unweighted means of the apparent linear

308 LAURETTA, KREMSER, AND FEGLEY
TABLE VII that H2S is involved in the rate law. Our measurementsParabolic Rate Constants give the net FeS formation rate,
d(FeS)/dt 5 d(Dw/A)/dt 5 kl 5 Rf 2 Rr (21)
(cm hr21 or gs cm22 hr21 depending on whether k9l or kl isused), where Rf is the forward rate of reaction (FeS forma-tion), and Rr is the reverse rate of reaction (FeS reductionby H2 in the gas) (e.g., see Haugen and Sterten 1971). Priorwork (Worrell 1971; Worrell and Turkdogan 1968) on FeSformation and reduction in H2S/H2 gas mixtures (1–70%H2S at 670 to 9008C) shows that FeS formation via Eq. 1is an opposing first order reaction (Benson 1960). Ironsulfide formation in COS/CO2/CO gas mixtures is also anopposing first order reaction (Haugen and Sterten 1971;Sterten and Haugen 1973). We rewrite Eq. (21) as
d(FeS)/dt 5 Rf 2 Rr 5 kfPH2S 2 krPH2, (22)
where kf is the forward rate constant for FeS formation,a Errors are 61s. kr is the reverse rate constant for FeS reduction and Pi isb Only one data point. the partial pressure of gas i. The rate constants have units
of cm hr21 atm21 or g cm22 hr21 atm21.When rate measurements are made far from equilibrium
by assuming that (a0 2 Ï2k9pt)/a0 p (b0 2 Ï2k9pt)/b0 p 1. (i.e., H2S/H2 ratios greater than the equilibrium ratio atAlthough this approximation is valid during the initial the Fe–FeS boundary), Eq. (22) reduces tostages of reaction, it breaks down at large a values whenmost of the Fe has reacted. We therefore calculated all d(FeS)/dt p kfPH2S 5 kl (23)the parabolic rate constants using an exact solution to Eq.(18). This cubic equation is
(k0p)3 2 (k0p)2St2/3L0
Ï2D1 (k0p)St1/3A0
4 D2 Sat2/3V0
2Ï2D5 0,
(20)
where k0p 5 (k9p)1/2. The unweighted means of the parabolicrate constants (k9p) for each gas mixture and temperatureare listed in Table VII. Figures 13–16 were used to deter-mine which samples display linear or parabolic kinetics.
Some of our experimental conditions are comparable tothose of previous studies. Figure 18 compares our linearrate constants (923 K) with data at 943 K from Worrelland Turkdogan (1968). Our experiments were done atmuch lower sulfur fugacities than those used by Worrelland Turkdogan but extrapolation of their data to our con-ditions yields good agreement. We also compared our para-bolic rate constant for samples formed at 1173 K in 10,000ppmv H2S with data from Fryt et al. (1979a) and Worrelland Turkdogan (1968). Our rate constant is consistent withextrapolations of their data obtained in more concentratedH2S/H2 mixtures.
(d) Linear kinetics. The apparent linear rate constants FIG. 18. A plot of our linear rate constants (kl) compared to datafrom Worrell and Torkdogan (1968). The dashed curve is a fit to their data.in Table VI vary with the H2S content of the gas showing

IRON SULFIDE FORMATION EXPERIMENTS 309
qualitatively similar to a Langmuir adsorption isotherm(Benson 1960)
uH2S 5 KPH2S/(1 1 KPH2S), (26)
where uH2S is the fractional coverage of the Fe (or FeS)surface by adsorbed H2S and K is the equilibrium constantfor adsorption. At low H2S partial pressures, KPH2S ! 1and the adsorption isotherm reduces to uH2S p KPH2S . Athigh H2S partial pressures, KPH2S @ 1 and the adsorptionisotherm becomes uH2S p 1. There is also a similarity toH2S adsorption isotherms on Cu and Ag metal surfaces(Worrell 1971). We suggest that H2S adsorption on theFe (or FeS) surface is the rate limiting step in the lowconcentration (p25 to p1000 ppmv) H2S gas mixtures,but that another process is rate limiting at higher H2Sconcentrations (e.g., Worell and Turkdogan 1968).
(e) Parabolic kinetics. Metallurgical studies of FeS for-mation in sulfur vapor and H2S/H2 gas mixtures (Table IV)and measurements of the Fe and S diffusion coefficients iniron sulfide (Condit et al. 1974) show that Fe21 diffusionin the sulfide layer is the rate limiting step for paraboliciron sulfide formation. The Fe21 diffusion coefficient (D)FIG. 19. Arrhenius plots for the calculation of the activation energyis a function of the temperature and sulfide stoichiometry(Ea) for linear (kf and kr) and parabolic (kp) kinetics. The Ea values for(Condit et al. 1974)parabolic kinetics are functions of the sulfur fugacity.
D 5 D0d exph2[81(64) 1 84(620)d]/RTj (27)and kf can be calculated. We used the linear rate constantsfor the p1000 ppmv H2S experiments to determine kf and where D0 is 1.7(60.1) 3 1022 and 3.0(60.2) 3 1022 cm2
sec21 for diffusion along the a and c crystallographic axes,checked the results using plots of kl versus PH2S (e.g., seeHaugen and Sterten 1971). The linear rate constants in the respectively. This relationship arises because the Fe va-
cancy concentration (d) is a function of temperature andp10,000 ppmv H2S mixtures do not fall on the same lineof kl versus PH2S as the p25 to p1000 ppmv mixtures and sulfur fugacity (e.g., Libowitz 1972). Thus the activation
energy for parabolic FeS formation also varies with tem-apparently refer to a different reaction mechanism.The temperature dependence of kf was calculated from perature and sulfur fugacity.
The two Ea values from Arrhenius plots (Fig. 19) of thethe Arrhenius equation and isparabolic rate constants are 38613 kJ mole21 and 6361kJ mole21 in the nominal 1,000 and 10,000 ppmv H2S gaskf 5 5.6(61.3)exp(227950(67280)/RT) (24)mixtures respectively. The small uncertainty on the Ea
value for the 10,000 ppmv mixtures is due to having onlywhere the activation energy (Ea) is p28 kJ mole21. Wecalculated kr , the reverse rate constant from Kl 5 kf/kr a single rate determination at 1173 K. Fryt et al. (1979a)
summarize Ea values for parabolic Fe sulfurization kinetics(Benson 1960) where Kl is the equilibrium constant forreaction (1). The temperature dependence of kr is and tabulate values of p(8–12) kJ mole21 for sulfides close
to FeS and values p(70–80) kJ mole21 for pyrrhotitesaround Fe0.90S. Our calculated activation energies displaykr 5 10.3(61.0)exp(292610(6350)/RT) (25)a qualitatively similar trend. The samples formed in p1,000ppmv H2S mixtures have Ea p 38 kJ mole21 and sulfideand the activation energy is p93 kJ mole21. The plots for
kf and kr are shown in Fig. 19. compositions of Fe0.99S. The samples formed in p10,000ppmv H2S mixtures have Ea p 63 kJ mole21 and sulfideAs noted above, plots of the apparent linear rate con-
stants (Table VI) versus PH2S yield straight lines for low compositions of Fe0.94S to Fe0.99S.Because Fe21 diffusion is rate limiting for the parabolicconcentration (#1000 ppmv) H2S gas mixtures, but the
apparent linear rate constants for the p10,000 ppmv H2S growth of FeS layers, we used our parabolic rate constantsto calculate the Fe21 diffusion coefficient. The parabolicmixtures do not fall on the same lines. This behavior is

310 LAURETTA, KREMSER, AND FEGLEY
TABLE VIIIIron Diffusion Coefficients (cm2 sec21) in Fe12d S
a Calculated from Eq. (27). The uncertainties are p 650% of the DFe value tabulated.b The mean Fe/S ratios from Table 3.c 1 2 d is 0.990 for p1000 ppm H2S and 0.988 for p10,000 ppm H2S.
rate constant k9p is related to the iron (DFe) and sulfur (DS) (27). There is fair agreement with the literature diffusioncoefficient (Condit et al. 1974).diffusion coefficients by (Schmalzried 1974)
IRON SULFIDE FORMATION KINETICS IN THEk9p 5
1RT
Ee0Fe
eFe(gas)
(DFe 1 DS) deFe (28)SOLAR NEBULA
We used our experimentally determined rate constantsThe integration in Eq. (28) extends from the metal–sulfideto calculate the rate of iron sulfide formation in the solarinterface where the chemical potential of Fe metal is e0
Fenebula. We assumed that the iron sulfide formation rateto the sulfide–gas interface where the chemical potentialfrom solar composition Fe95Ni5 alloy is not significantlyof the metal is eFe(gas). The experimental data of Conditdifferent than from pure Fe metal. Our preliminary studyet al. (1974) show that sulfur diffusion in iron sulfide isof sulfidation kinetics for meteoritic Fe94Ni6 metalmuch slower than Fe diffusion. Thus, the DS term in Eq.(Lauretta et al. 1995a) shows that the sulfidation rate for(28) is neglected in the rest of this treatment. Followingthe alloy is about 90% of that for pure Fe metal under theSchmalzried (1974) the average Fe21 diffusion coefficientsame conditions (p923 K and p10,000 ppmv H2S) andis defined asindicates that this assumption is valid.
We first calculated the thickness of sulfide rims that canDFe 5
1e0
Fe 2 eFe(gas)Ee0
Fe
eFe(gas)
DFe deFe , (29) form around metal grains to determine the grain sizes forwhich diffusion eventually becomes rate limiting. If weassume that all grains are spherical the volume of sulfide
where the average is taken with respect to chemical poten-is directly related to the extent of reaction by:
tial across the layer. Combining Eqs. (28–29), and rewritingin terms of the Gibbs free energy of formation of FeS
Vsulfide 5 Mv,FeS 3 P 3 Fdfr3/Mv,Fe , (31)(DGFeS) yields
where Mv,FeS is the molar volume of iron sulfide (18.20cm3), P is the percent of the grain reacted, r is the initialk9p 5 DFe
uDGFeSuRT
(30)radius of the metal grain, and Mv,Fe is the molar volumeof iron metal (7.09 cm3). The volume and thickness of the
for the average Fe21 diffusion coefficient across the sul- sulfide are given byfide layer.
We evaluated Eq. (30) for sulfide layers formed in the Vsulfide 5 Fdf(r 3grain 2 r 3
metal) (32)parabolic regime in the p1,000 ppmv and p10,000 ppmv
tlayer 5 rgrain 2 rmetal . (33)H2S mixtures. The mean Fe/S ratios of the sulfide layerswere taken from Table V and the thermodynamic data ofGrønvold and Stølen (1992) were used to calculate the Figure 20 shows the results of the calculations and the
range of experimentally determined critical thickness val-Gibbs free energy of formation of Fe12d S (DGFeS) as afunction of the Fe/S ratio. Table VIII lists our results and ues from Fig. 17. Iron grains smaller than 10 em in radius
will never develop sulfide layers thicker than the criticalalso shows the Fe diffusion coefficients calculated from Eq.

IRON SULFIDE FORMATION EXPERIMENTS 311
thickness at which diffusion becomes rate limiting. Thus, the forward and reverse rate constants (Eq. 24 and 25) wecalculate that 10 em radius grains are completely con-iron sulfide formation on these small grains will always
follow linear kinetics. Initially, iron sulfide formation on verted to iron sulfide in p200 years at 700 K and 1023 atm.This temperature is p108 below the (pressure independent)10 em radius iron grains follows linear kinetics but later
makes a transition to parabolic kinetics after p90% of troilite condensation point. The pressure of 1023 atm iscommonly used in nebular condensation calculations bythe grain has reacted. Likewise, the sulfidation of 100 em
radius iron grains switches to parabolic kinetics after p10% many authors. Equation (22) shows that the sulfidationrate is linearly dependent on the total pressure (for a solarof the grain has reacted, and 1000 em radius grains follow
parabolic kinetics after only p3% reaction. Iron sulfide composition gas). Thus lower assumed total pressures willlead to correspondingly decreased sulfidation rates andformation on larger iron grains essentially follows para-
bolic kinetics at all times. increased times required for complete sulfidation. Cur-rently estimated nebular lifetimes are 0.1–10 million yearsAdopting the commonly held assumption that chondritic
meteorites contain at least some pristine nebular material, (Podosek and Cassen 1994). Thus, unless total pressuresin the inner solar nebula were always below 1026 atm inKerridge (1993) used petrographic information on the sizes
of different components in chondrites to qualitatively esti- the 400–720 K region, sulfidation of 10 em radius (andsmaller) iron grains would have gone to completion withinmate grain sizes in the solar nebula. The matrix of type 3
chondrites has grain sizes of 0.05–10 em, while metal in the lifetime of the solar nebula.The parabolic rate equation for sulfidation of Fe grainstype 3 and 4 chondrites has grain sizes of ,40 em to
.400 em (Kerridge 1993). We therefore considered the (.10 em radius) in the solar nebula is given bysulfidation of 10 em and 1000 em radius iron grains asendmember cases to illustrate a range of timescales. [(dx)2/dt] 5 k9p p DFe (34)
The linear rate equation for sulfidation of Fe grains (,10cm2 hr21. Our previous discussion showed that parabolicem radius) issulfidation rates vary with both the temperature and sulfide
d(FeS)/dt 5 kfPH2S 2 krPH2(22) composition, but they do not vary with the total pressure.
Assuming a nearly stoichiometric sulfide with Fe/S 5 0.999,taking T 5 700 K, and DFe from Eq. (27), we calculate thatcm hr21. Using our experimentally determined values for1000 em radius iron grains will be completely converted toiron sulfide in p500 years. Because of the strong depen-dence of the iron diffusion coefficient on the sulfide compo-sition, Fe deficient pyrrhotites, if stable, would formmore rapidly.
The calculations above use the laboratory rate constantsto model iron sulfide formation kinetics in the solar nebula.However, the rate limiting step for linear kinetics maychange in going from p1 atmosphere pressure to pressuresof 1023 to 1026 atmospheres in the inner solar nebula (e.g.,see Fegley and Prinn 1989). In this case H2S adsorptionon Fe metal may no longer be rate limiting and instead thesupply of gas molecules to the metal may be rate limiting. Ifthis is the case then a model of the gas–grain collisionfrequency is needed to determine the lifetime.
As described earlier, Fegley (1988) developed a simplecollision theory (SCT) model for the kinetics of chemicalreactions between gases and grains in the solar nebula.We apply this model using our experimentally determinedvalue of p28 kJ mole21 for the activation energy of ironsulfide formation. The collision rate of the reactant gaswith the grain surfaces is given by
FIG. 20. A plot showing the calculated thickness of FeS layers formed si 5 2.635x1025 F Pi
(MiT)1/2G (35)on spherical Fe grains. Comparison with the experimentally determinedcritical layer thickness indicates that diffusion controlled kinetics is unim-portant for grains less than 10 em in radius. (molecules cm22 s21) where Pi is the partial pressure of

312 LAURETTA, KREMSER, AND FEGLEY
reactant gas i and Mi is the molecular weight of gas i. Thetotal number of collisions with all grains in each cm3 isgiven by
vi 5 siA (36)
(molecules cm23 s21) where A is the total surface area ofall reactant grains per each cm3 of the nebula. Sphericalgrains with radii of either 0.1 em or 1000 em are assumedto be uniformly distributed at solar abundance within thegas. Only a fraction of the gas particles that collide withthe grains have the necessary activation energy to reactwith the metal. This is given by
fi 5 expS2Ea
RT D. (37)
As the reaction progresses the gas is depleted in the re-actant species and the collisions become less frequent. Totake this into account we performed successive iterationsusing the above formulas at each stage. For each time stepthe amount of H2S left in the gas is calculated as
FIG. 21. A graph showing H2S lifetimes in the solar nebula at variousNH2S,t 5 NH2S,t21 2 c expS2Ea
RT D PH2S,t21
T1/2 Dt, (38)temperatures. Lifetimes are based on gas molecule collision frequencywith monodispersed Fe grains having radii of 0.1 em (solid lines) and1000 em (dashed lines). In both cases all the H2S will react to form FeSwhere N represents the total number of molecules of H2Swithin the estimated lifetime of the solar nebula (dotted lines).left in the gas, c is a constant from Eq. (35), and Dt is the
time step between each iteration. The total number ofmolecules per unit volume at any time is equal to the
in the solar nebula will also have compositions in equilib-amount present minus the number that react to form sul-rium with the gas. We calculated the range of sulfide com-fide. The results of these calculations are shown in Fig.positions in equilibrium with solar composition gas (H2S/21. This figure shows that all (0.1 em grains) or a largeH2 p33 ppmv) as a function of temperature from p713 K,percentage (1000 em grains) of the H2S in solar composi-the troilite formation temperature, to 400 K, the magnetitetion gas can be quantitatively condensed into iron sulfideformation temperature to be Fe0.97S to FeS.within the estimated nebular lifetime of 0.1–10 million
Qualitatively, these calculations support the suggestionyears.that the reaction
METEORITIC PYRRHOTITE9FeS 1 H2S 5 Fe9S10 1 H2 (39)
Although troilite is the most common sulfide in meteor-ites, pyrrhotite p(Fe, Ni)0.9S with Fe/Ni p 50 is a common, could lead to pyrrhotite formation in the solar nebula (Ker-
ridge 1976; Zolensky and Thomas 1995). However, subse-if not the most common, sulfide in CI carbonaceous chon-drites (e.g., Kerridge 1970, 1976; Kerridge et al. 1979). Iron quently Kerridge et al. (1979) showed that the sulfides in
the Orgueil CI chondrite are probably secondary alterationsulfides with compositions ranging from pFe1.1S to pFe0.8Sare also observed in chondritic anhydrous and hydrated products. Also, the Fe/S ratios of pyrrhotites in IDP’s are
lower than those predicted by our calculations.interplanetary dust particles (e.g., Zolensky and Thomas1995). Here we briefly discuss the origin of pyrrhotite in Fegley and Palme (1985) discussed the chemistry of sul-
fur-rich regions of the solar nebula, and their results illus-chondrites and interplanetary dust particles (IDPs).Our experiments produced iron sulfides with composi- trate that reheating of dust-rich regions in the solar nebula
will lead to sulfur fugacities above those fixed by the solartions varying from Fe0.90S to FeS with temperature andH2S/H2 ratio in agreement with thermodynamic calcula- H2S/H2 ratio. For example, increasing the dust/gas ratio to
100 times the solar value leads to production of pyrrhotitestions (see Table V). This implies that iron sulfides formed

IRON SULFIDE FORMATION EXPERIMENTS 313
ranging from Fe0.98S (at 700 K) to Fe0.94S (at 400 K). Lower state reaction kinetics. In Comprehensive Chemical Kinetics (C. H.Bamford and C. F. H. Tipper, Eds.), Vol. 22, pp. 41–113. Elsevier, Am-Fe/S ratios maybe due to higher dust/gas ratios or simplysterdam.to failure of gas and grains to completely equilibrate. For
BURGMANN, W., JR., G. URBAIN, AND M. G. FROHBERG 1968. Contribu-example, our experiments at 558 K in p50 ppmv H2Stion a l’etude du systeme fer–soufre limite du domaine du mono-sulfureled to Fe/S p0.96 versus the predicted equilibrium valuede fer (pyrrhotine). Mem. Sci. Rev. Metall. 65, 567–578.
of p0.99.CAMERON, A. G. W. 1968. A new table of abundances of the elements
of the solar system. In Origin and Distribution of the Elements (L. H.METEORITIC TROILITE Ahrens, Ed.), pp. 125–143, Pergamon, Oxford.
CEMIC, L., AND O. J. KLEPPA 1988. High temperature calorimetry ofFinally, we apply our results to the identification of pris- sulfide systems. III. Standard enthalpies of formation of phases in the
systems Fe–Cu–S and Co–S. Phys. Chem. Miner. 16, 172–179.tine nebular sulfide condensates in chondrites. This workCHASE, M. W., JR., C. A. DAVIES, J. R. DOWNEY, JR., D. J. FRURIP,and our study of the sulfidation of meteoritic FeNi metal
R. A. MCDONALD, AND A. N. SYVERUD 1985. JANAF Thermochemical(Lauretta et al. 1995b), provide necessary criteria for classi-Tables, 3rd ed. J. Phys. Chem. Ref. Data 14, suppl. no. 1.fying meteoritic metal–sulfide assemblages in chondrites
CONDIT, R. H., R. R. HOBBINS, AND C. E. BIRCHENALL 1974. Self-diffusionas pristine nebular condensates. The large variation in theof iron and sulfur in ferrous sulfide. Oxid. Met. 8, 409–455.
growth structure of the sulfide layers indicates that theDARKEN, L. S., AND R. W. GURRY 1945. The system iron–oxygen. I. Thesulfide morphology alone cannot be used to identify a
wustite field and related equilibria. J. Am. Chem. Soc. 67, 1398–1412.natural sample as a pristine nebular condensate. Instead of
DREIBUS, G., H. PALME, B. SPETTEL, J. ZIPFEL, AND H. WANKE 1995.basing contentions for such condensates solely on textural Sulfur and selenium in chondritic meteorites. Meteoritics 30, 439–445.arguments, it is also necessary to take chemical considera- EVANS, H. T., JR., D. E. APPLEMAN, AND D. S. HANDWERKER 1973.tions into account. The sulfidation of iron and iron–nickel Report PB216188, NTIS.alloys creates several distinctive chemical fractionation FEGLEY, B., JR. 1988. Cosmochemical trends of volatile elements in thepatterns that can assist in the identification of nebular solar system. In Workshop on the Origins of Solar Systems (J. A. Nuth
and P. Sylvester, Ed.), LPI Technical Report No. 88-04, pp. 51–60.sulfide material. First, the stoichiometry of the sulfide layerFEGLEY, B., JR. 1993. Chemistry of the solar nebula. In The Chemistryis not constant. Instead, we find that the total metal to
of Life’s Origins (M. Greenberg, C. X. Mendoza-Gomez, and V. Pirro-sulfur ratio decreases with distance from the metal. Innello, Eds.), pp. 75–147. Dordrecht.addition, the fractionation of nickel is very distinctive. Typ-
FEGLEY, B., JR., K. LODDERS, A. H. TREIMAN, AND G. KLINGELHOFERically, a thin band of metal near the sulfide is enriched in1995. The rate of pyrite decomposition on the surface of Venus. Icarusnickel. Also, significant amounts of nickel are present in 115, 159–180.
the sulfide layer and the nickel content of the sulfide in-FEGLEY, B., JR., AND R. G. PRINN 1989. Solar nebula chemistry: Implica-
creases away from the metal. Any identification of pristine tions for volatiles in the Solar System. In The Formation and Evolutionnebular sulfide material should consider these distinguish- of Planetary Systems (H. Weaver and L. Danly, Eds.), pp. 171–211.
Cambridge Univ. Press, Cambridge, UK.ing fractionation patterns.FEGLEY, B., JR., AND H. PALME 1985. Evidence for oxidizing conditions
in the solar nebula from Mo and W depletions in refractory inclusionsACKNOWLEDGMENTSin carbonaceous chondrites. Earth Planet. Sci. Lett. 72, 311–326.
FEGLEY, B., JR., D. S. LAURETTA, AND D. T. KREMSER 1995. The originThis work was supported by NASA Grant NAGW-3070. We thank K.Lodders and R. Poli for advice and technical assistance. of troilite and pyrrhotite in chondrites. I. Iron sulfide formation kinetics
in H2S-H2 gas mixtures [abstract] In abstract volume, 20th Symposiumon Antarctic Meteorites, Tokyo, Japan, pp. 59–62.REFERENCES
FLEET, M. E. 1968. On the lattice parameters and superstructures ofpyrrhotites. Am. Mineral. 53, 1846–1855.ANDERS, E., AND N. GREVESSE 1989. Abundances of the elements: Mete-
oritic and solar. Geochim. Cosmochim. Acta 53, 197–214. FRONDEL, J. W. 1975. Lunar Mineralogy. Wiley–Interscience, New York.
ARMSTRONG, J. T. 1988. Quantitative analysis of silicate and oxide miner- FRYT, E. M., V. S. BHIDE, W. W. SMELTZER, AND J. S. KIRKALDY 1979a.als: Comparison of Monte-Carlo, ZAF and Phi-Rho-Z procedures. Growth of the iron sulfide (Fe12d S) scale on iron at temperaturesMicrobeam Anal. 23, 239–246. 6008–10008C. J. Electrochem. Soc. 126, 683–688.
ARNOLD, R. G. 1962. Equilibrium relations between pyrrhotite and pyrite FRYT, E. M., W. W. SMELTZER, AND J. S. KIRKALDY 1979b. Chemicalfrom 325 to 7438C. Econ. Geol. 57, 72–90. diffusion and point defect properties of iron sulfide (Fe12d S) at tempera-
tures 6008–10008C. J. Electrochem. Soc. 126, 673–683.BARKER, W. W., AND T. C. PARKS 1986. The thermodynamic propertiesof pyrrhotite and pyrite: A re-evaluation. Geochim. Cosmochim. Acta GRØNVOLD, F., S. STØLEN, A. K. LABBAN, AND E. F. WESTRUM, JR. 1991.50, 2185–2194. Thermodynamics of iron sulfides. I. Heat capacity and thermodynamic
BENSON, S. W. 1960. The Foundations of Chemical Kinetics. McGraw– properties of Fe9S10 at temperatures from 5 K to 740 K. J. Chem.Hill, New York. Thermodyn 23, 261–272.
BROWN, H. S. 1949. A table of relative abundances of nuclear species. GRØNVOLD, F., AND S. STØLEN 1992. Thermodynamics of iron sulfides.Rev. Mod. Phys. 21, 625–634. II. Heat capacity and thermodynamic properties of FeS and of Fe0.875S
at temperatures from 298.15 K to 1000 K, of Fe0.98S from 298.15 K toBROWN, M. E., D. DOLLIMORE, AND A. K. GALWEY 1980. Theory of solid

314 LAURETTA, KREMSER, AND FEGLEY
800 K, and of Fe0.89S from 298.15 K to about 650 K. Thermodynamics LEWIS, J. S. 1972. Metal–silicate fractionation in the solar system. EarthPlanet. Sci. Lett. 15, 286–290.of formation. J. Chem. Thermodyn. 24, 913–936.
GROSSMAN, L. 1972. Condensation in the primitive solar nebula. Geochim. LIBOWITZ, G. G. 1972. Energetics of defect formation and interaction innon-stoichiometric pyrrhotite. In Reactions of Solids (J. S. Anderson,Cosmochim. Acta 36, 597–619.M. W. Roberts, and F. S. Stone, Eds.), pp.107–115. Chapman &HAGG, G., AND I. SUCKSDORFF 1933. Die Kristallstruktur von Troilit undHall, London.Magnetkies. Z. Phys. Chem. Teil. B 22, 444–452.
LORD, H. C. 1965. Molecular equilibria and condensation in a solar nebulaHANSEN, M., AND K. ANDERKO 1958. Constitution of Binary Alloys, 2ndand cool stellar atmospheres. Icarus 4, 279–288.ed. McGraw–Hill, New York.
MEUSSNER, R. A., AND C. E. BIRCHENALL 1957. The growth of ferrousHARALDSEN, H. 1941. Uber die Hochtemperaturumwandlungen dersulfide on iron. Corrosion 13, 677t–689t.Eisen(II)–Sulfidmischkristalle. Z. Anorg. Allg. Chem. 246, 195–226.
NAGAMORI, M., AND M. KAMEDA 1968. Thermodynamics of pyrrhotiteHAUFFE, K., AND A. RAHMEL 1952. Uber den Mechanismus der Schwefe-(Fe12d S) at the temperature range of 8008 p 11008C. Trans. Jpn. Inst.lung von Eisen, Nickel und Nickellegierungen bei hoheren Tempera-Met. 9, 187–194.turen. Z. Phys. Chem. 199, 152–169.
NARITA, T., AND K. NISHIDA 1973a. The effect of sulfur pressure on theHAUGEN, S., AND A. STERTEN 1971. High-temperature linear kinetics ofiron sulfide scale growth at elevated temperature. Trans. Jpn. Inst. Met.FeS formation and reduction in COS–CO–CO2 gas mixtures. Oxid.14, 439–446.Met. 3, 545–555.
NARITA, T., AND K. NISHIDA 1973b. On the sulfur distribution in FeSHAYCOCK, E. W. 1959. High-temperature sulfiding of iron alloys in hydro-scale formed on pure iron at 7008C. Trans. Jpn. Inst. Met. 14, 447–456.gen sulfide–hydrogen mixtures. J. Electrochem. Soc. 106, 764–771.
NIWA, K., AND T. WADA 1961. Thermodynamic studies of pyrrhotite.HORWOOD, J. L., M. G. TOWNSEND, AND A. H. WEBSTER 1976. MagneticMetall. Soc. Conf. 8, 945–961.susceptibility of single crystal Fe12xS. J. Solid State Chem. 17, 35–42.
ORCHARD, J. P., AND D. J. YOUNG 1989. Sulfidation behavior of anJAMIN-CHANGEART, F., AND S. TALBOT-BESNARD 1965. Role de la pureteiron–nickel alloy. J. Electrochem. Soc. 136, 545–550.dans la sulfuration du fer par des melanges hydrogene sulfure-argon
et quelques precisions sur le mecanisme de formation d’une couche PODOSEK, F. A., AND P. CASSEN 1994. Theoretical, observational, andisotopic estimates of the lifetime of the solar nebula. Meteoritics 29,interne de sulfure. Mem. Sci. Rev. Metall. 62, 305–312.6–25.KELLEY, K. K. 1949. Contributions to the Data on Theoretical Metallurgy.
U.S. Bur. Mines Bull. 476, US Govt. Printing Office, Washington. D.C. PRINN, R. G., AND B. FEGLEY, JR. 1989. Solar nebula chemistry: Originof planetary, satellite and cometary volatiles. In Origin and EvolutionKERRIDGE, J. F. 1970. Meteoritic pyrrhotite. Meteoritics 5, 149–152.of Planetary and Satellite Atmospheres (S. K. Atreya, J. B. Pollack,KERRIDGE, J. F. 1976. Formation of iron sulphide in solar nebula. Natureand M. S. Matthews, Eds.), pp. 78–136. Univ. of Arizona Press, Tucson.259, 189–190.
RAU, H. 1976. Energetics of defect formation and interaction in pyrrhotiteKERRIDGE, J. F. 1993. What can meteorites tell us about nebular condi-Fe12xS and its homogeneity range. J. Phys. Chem. Solids 37, 425–429.tions and processes during planetesimal accretion? Icarus 106, 135–150.
RICHARDSON, F. D., AND J. H. E. JEFFES 1952. The thermodynamics ofKERRIDGE, J. F., AND M. S. MATTHEWS 1988. Meteorites and the Earlysubstances of interest in iron and steel making. III. Sulphides. J. IronSolar System. Univ. of Arizona Press, Tucson.Steel Inst. 171, 165–175.
KERRIDGE, J. F., J. D. MACDOUGALL, AND K. MARTI 1979. Clues to theROBIE, R. A., AND D. R. WALDBAUM 1968. Thermodynamic Propertiesorigin of sulfide minerals in CI chondrites. Earth Planet. Sci. Lett.
of Minerals and Related Substances at 298.158K (25.08C) and One Atmo-43, 359–367.sphere (1.013 Bars) Pressure and at Higher Temperatures. U.S. Geol.
KINGERY, W. D., H. K. BOWEN, AND D. R. UHLMANN 1976. IntroductionSurv. Bull. No. 1259, U.S. Govt. Printing Office, Washington, D.C.
to Ceramics, 2nd ed. Wiley–Interscience, New York.ROSENQVIST, T. 1954. A thermodynamic study of the iron, cobalt and
LARIMER, J. W. 1967. Chemical fractionations in meteorites. I. Condensa-nickel sulfides. J. Iron Steel Inst. 174, 37–57.tion of the elements. Geochim. Cosmochim. Acta 31, 1215–1238.
ROSSINI, R. A., D. D. WAGMAN, W. H. EVANS, S. LEVINE, AND I. JAFFELARIMER, J. W., AND E. ANDERS 1967. Chemical fractionations in meteor-1952. Selected Values of Chemical Thermodynamic Properties. NBS
ites. II. Abundance patterns and their interpretation. Geochim. Cos-Circular 500, U.S. Govt. Printing Office, Washington, D.C.mochim. Acta 31, 1239–1270.
SCHMALZRIED, H. 1974. Solid State Reactions (A. D. Pelton, Transl.).LAURETTA, D. S., AND B. FEGLEY, JR. 1994a. An experimental study ofAcademic Press, New York.iron sulfide formation kinetics in H2–H2S gas mixtures and applications
SEARS, D. W. 1978. Condensation and the composition of iron meteorites.to iron sulfide condensation in the solar nebula. Lunar Planet. Sci.Earth Planet. Sci. Lett. 41, 128–138.25, 773–774.
STERTEN, A., AND S. HAUGEN 1973. The parabolic rate constant for Fe12xSLAURETTA, D. S., AND B. FEGLEY, JR. 1994b. Troilite formation kineticsformation as a function of sulfur activity. Oxid. Met. 7, 45–54.and growth mechanism in the solar nebula. Meteoritics 29, 490.
TOULMIN, P., III, AND BARTON, P. B. 1964. A thermodynamic study ofLAURETTA, D. S., AND B. FEGLEY, JR. 1994c. Kinetics and grain growthpyrite and pyrrhotite. Geochim. Cosmochim. Acta 28, 641–671.mechanism for troilite formation on iron metal in H2–H2S gas mixtures
TURKDOGAN, E. T. 1968. Iron–sulfur system. I. Growth rate of ferrous[abstract]. Abstract volume of the 19th Symposium on Antarctic Mete-sulfide on iron and diffusivities of iron in ferrous sulfide. Trans. AIMEorites, Tokyo, Japan, pp. 62–65.242, 1665–1672.LAURETTA, D. S., D. T. KREMSER, AND B. FEGLEY, JR. 1995a. Nickel
TURKDOGAN, E. T., W. M. MCKEWAN, AND L. ZWELL 1965. Rate offractionation during troilite formation in the solar nebula. Lunar Planet.oxidation of iron to wustite in water–hydrogen gas mixtures. J. Phys.Sci. 26, 831–832.Chem. 69, 327–334.LAURETTA, D. S., D. T. KREMSER, AND B. FEGLEY, JR. 1995b. The origin
UREY, H. C. 1952. The Planets. Yale Univ. Press, New Haven, CT.of troilite and pyrrhotite in chondrites. II. Comparative studies ofmetal–sulfide assemblages [abstract]. Abstract volume of the 20th Sym- WAGNER, C. 1951. Diffusion and high temperature oxidation of metals.
In Atom Movements, pp. 153–173. Am. Soc. Met., Cleveland.posium on Antarctic Meteorites, Tokyo, Japan, pp. 134–137.

IRON SULFIDE FORMATION EXPERIMENTS 315
WAI, C. M., AND J. T. WASSON 1977. Nebular condensation of moderately WORRELL, W. L., AND E. T. TURKDOGAN 1968. Iron sulfur system. II.Rate of reaction of hydrogen sulfide with ferrous sulfide. Trans. AIMEvolatile elements and their abundances in ordinary chondrites. Earth
Planet. Sci. Lett. 36, 1–13. 242, 1673–1678.
YOUNG, D. J. 1980. The sulfidation of iron and its alloys. Rev. High Temp.WILSON, E. B., JR. 1952. An Introduction to Scientific Research. McGraw–Hill, New York. Mater. 4, 299–346.
YUND, R. A., AND H. T. HALL 1969. Hexagonal and monoclinic pyrrho-WOOD, J. A., AND A. HASHIMOTO 1993. Mineral equilibrium in fraction-ated nebular systems. Geochim. Cosmochim. Acta 57, 2377–2388. tites. Econ. Geol. 64, 420–423.
ZOLENSKY, M. E., AND K. L. THOMAS 1995. Iron- and iron–nickel sulfidesWORRELL, W. L. 1971. Dissociation of gaseous molecules on solids athigh temperature. In Advances in High Temperature Chemistry (L. in chondritic interplanetary dust particles. Lunar Planet. Sci. 26, 1567–
1568.Eyring, Ed.), Vol. 4, pp. 71–105. Academic Press, New York.