the rapid changes of the landscape structure of the
TRANSCRIPT

8 Vol. 2 No. 1, 8-18 http://dx.doi.org/10.22135/sje.2017.2.1.8-18
The Rapid Changes of the Landscape Structure of the Meranti-Dangku Tropical Lowland Forest in the South Sumatra Province, Indonesia
Zulfikhar1,2*, Hilda Zulkifli3, Sabaruddin Kadir4, and Iskhaq Iskandar5
1Graduate School of Environmental Science, University of Sriwijaya, Jl. Padang Selasa, Bukit Besar, Palembang, Sumatra Selatan, 30139, Indonesia. 2Technical Staff in South Sumatra Provincial Government, Indonesia. 3Department of Biology, Faculty of Mathematics and Natural Sciences, University of Sriwijaya, Kampus Inderalaya, Ogan Ilir, Sumatra Selatan, 30662, Indonesia. 4Department of Soil Science, Faculty of Agriculture, University of Sriwijaya, Kampus Inderalaya, Ogan Ilir, Sumatra Selatan, 30662, Indonesia. 5Department of Physics, Faculty of Mathematics and Natural Sciences, University of Sriwijaya, Kampus Inderalaya, Ogan Ilir, Sumatra Selatan, 30662, Indonesia. *Corresponding Author: [email protected] Article history
Received Received in revised form Accepted Available online 12 December 2016 15 February 2017 25 February 2017 15 March 2017
Abstract: The fragmentation of forest vegetation cover can be measured quantitatively, using tools that can characterize the geometry and spatial properties of the patch or patches of mosaic, which depicts the forest loss and the changes in the temporal pattern. The aims of this paper are to observe the process of the forest fragmentation, to find out the changes of spatial patterns of habitat continuum by applying the spatial dynamics change analysis of the forest fragmentation phases, and to provide the comprehensive approach in determining the rapid change of the forest landscape structure in the spatial transformation process, based on the decision tree models. We find three phases of the forest fragmentation were identified, namely dissection, dissipation, and attrition. This study shows that the production forest area and a wildlife conservation area that contiguous or borders, has the same phases in the process of fragmentation of the forest, but both have a difference of the magnitude of forest loss. We find there are at least five effects of forest fragmentation to the landscape structure, those are increasing in a number of habitat patches, decreasing in a size of habitat patches, reduction in a habitat amount, increasing in a dispersion and interspersion of patch types, and reduction in a size of spatial connectedness between patches. Keyword: fragmentation, landscape metrics, spatial transformation. Abstrak (Indonesian): Fragmentasi penutupan vegetasi hutan dapat diukur secara kuantitatif, menggunakan alat-alat yang dapat mengkarakterisasi geometri dan properti spasial patch atau mosaik patch-patch, yang menggambarkan kehilangan hutan dan perubahan-perubahan dalam pola temporal. Studi ini bertujuan untuk (1) mengamati proses fragmentasi hutan, (2) mengetahui perubahan pola spasial habitat kontinum dengan menerapkan analisa perubahan dinamika spasial pada fase-fase fragmentasi hutan, dan (3) memberikan pendekatan yang komprehensif dalam menentukan perubahan yang cepat dari struktur lanskap hutan dalam proses transformasi spasial, berdasarkan model pohon keputusan. Hasil studi ini menunjukkan bahwa ada tiga fase fragmentasi hutan yang teridentifikasi, yaitu pembedahan (dissection), pemecahan (dissipation) dan penghilangan (attrition). Studi ini juga menunjukkan bahwa kawasan hutan produksi dan kawasan konservasi satwa liar yang berdekatan atau berbatasan, memiliki fase-fase yang sama pada proses fragmentasi hutan, namun keduanya memiliki perbedaan pada besaran hilangnya hutan. Setidaknya ada lima dampak fragmentasi hutan pada struktur lanskap; meningkatnya jumlah patch habitat, penurunan ukuran patch habitat, penurunan jumlah habitat, meningkatnya dispersi dan interspersi jenis patch, dan pengurangan dalam ukuran konektivitas spasial antar patch. Kata kunci: fragmentasi, metrik lanskap, transformasi spasial

9 Vol. 2 No. 1, 8-18 http://dx.doi.org/10.22135/sje.2017.2.1.8-18
1. Introduction Meranti-Dangku landscape is the tropical natural
lowland forest and essential ecosystems remaining in South Sumatra which has undergone changes of forest vegetation cover very quickly (Figure 1.). The rate of deforestation in Meranti-Dangku landscape from 1989 to 2013 is in the range of 4.32 to 12.75 % per year, much larger than the average loss of the old-growth forests cover in Sumatra from 2000 to 2012, which is the average area of 1.75 % per year (100.416 ha per year) [1].
The forest fragmentation of the landscape of Meranti-Dangku can be measured quantitatively, using tools that can characterize the geometry and spatial properties of the patch or patches of mosaic, which depicts the spatial landscape structure on a particular point in time [2]; [3], and can describe the quantitative dimensions of sustainability [4], in the region of the landscape [5] .
The land use change and forest fragmentation caused by human activity, such as the logging and utilization of natural forest, agricultural development, livestock, mining, settlement, and development of the infrastructure, where all of activities are relevant to environmental issues and ecological phenomena [6]–[9]. Many cases that arise because of human activity, has conflicts with wildlife, suspected as the cause of the main occurrence of loss of habitat and endangered species[10].
Abdullah has found that there are three main components of the forest fragmentation, namely Attrition, or the loss of original habitat patches; Shrinkage, or the reduction of the size of habitat patches; and the Isolation, or increasing the distance between patches of habitat [11].
The aims of this paper are to observe the process of the forest fragmentation, to find out the changes of spatial patterns of habitat continuum by applying the spatial dynamics change analysis of the forest fragmentation phases, to provide the comprehensive approach in determining the rapid change of the forest landscape structure in the spatial transformation process, based on the decision tree models. This is a new approach in determining the dominant phase of the forest fragmentation, from the perspective of the biodiversity conservation and forest restoration, in the production forest and wildlife conservation areas.
2. Experimental Sections Description of Research Site This research area is in the tropical lowland forest ecosystem, namely Meranti-Dangku landscape (Figure 1). Geographically, it is located at UTM Zone 48S; 26900-37000 Easting and Northing 9765000-9710000, with an area of 209.619 ha. The Meranti-Dangku lanscape is located in the Production Forest Management Unit covering an area of 157.228 ha and in the Dangku
Conservation Forest Management Unit covering an area of 52.392 ha.
Figure 1. The location of the research area, the tropical
lowland forest ecosystem of Meranti-Dangku landscape, District of Musi Banyuasun, South Sumatra
Province, Indonesia Image Analysis The Satellite imagery data that used in this research is the Landsat 5 Thematic Mapper (TM), sourced from the National Institute of Aeronautics and Space (LAPAN), presented as Table 1. We conducted an analysis based on the changes of the closure of the vegetation and land use from a series of satellite imagery map on a medium resolution. The change detection method of the land cover type "again-being" is done in post classification (post-classification comparison = PCC), namely the analysis of the comparison of the results of the land cover classification for the time t1 and t2 [12]. Table 1. Types of satellite imagery and date of acquisition used in this study.
The method used in the satellite image analysis is the Object Base Image Analysis (OBIA), and the processing of the image analysis using the eCognition Developers 64 software (Trimble). The pre-requisites for classification is the segmentation of the image, which is a subdivision of the image into a separate area [13] [14]. In the settings of the scale parameters, colors and shapes, and the data processing are using the multi-resolution segmentation algorithm, with the scale parameter = 10, the color and shape factor = 0.1, and the compactness and smoothness = 0.5 [15], [16]. In ground thruthing for the checking of the land use type classification are using the Global Positioning System (GPS), Garmin Oregon 550 series, the work map, and the draft of the land use type classification map from
10 Vol. 2 No. 1, 8-18 http://dx.doi.org/10.22135/sje.2017.2.1.8-18
a satellite imagery. Observations of the field towards planned of 620 random point, 510 points which were taken as examples and training area, and 444 points used to test the accuracy of the mapping of the land cover type. In selection of the location of training area, with attention to the representativeness of the type of the land use classification, and the road accessibility. The classification of an objects is done by using the method of the nearest neighbor classifiers, based on the user-selected samples, which is the training area obtained from field survey (ground truth), and the land use type classification for the interpretation of image analysis is using the Standar Nasional Indonesia (SNI) [17]. The calculation of the accuracy of an image analysis is using the matric error, against the map of object-based classification results, which are include overall accuracy (accuracy overall), the accuracy of the producer (producer accuracy) and the accuracy of the user (user ' accuracy) for the each class of the closure, and the accuracy of the Kappa [12], [18]. Forest Cover Change The forest cover change rate per year on each sub-landscapes for the period between the 2004 year’s acquisition of Landsat data is calculated following the formula [19] :
𝑃 = 100𝑡2
− 𝑡1 𝑙𝑛 (𝐴2𝐴1
) (1)
where P indicates percent of forest loss per year, A1 and A2 are the forest cover area in t1 and t2, and t1 dan t2 indicate year-i data acquisition of Landsat imagery. Indicators of Forest Landscape Structure In this research, the dynamics change of landscape metrics of forest is investigated using 14 indicators, i.e. 7 indicators of landscape metrics that are used in determining the composition of the landscape and the level of fragmentation of forest landscape (Table 2), and 7 indicators of landscape metrics that are used in determining the level of the configuration of the changing of landscape connectivity and the occurrence of forest habitat isolation (Table 3). These definitions are following the definitions of Forman [20]. The generation of the indicators were conducted by using software FRAGSTATS 4.ver 2. [21]. We analyzed the behavior of each measure of forest fragmentation in three regions of sub-landscape against the series of years of data acquisition of satellite imagery. We examined the relationship between the percentage of forest loss in the series of years of data acquisition with all landscape metrics indicators. This calculation was based on a regression techniques, in order to know the variable predictors of the forest
landscape metrics indicators [7], and to know the significant differences in the values of the size of the fragmentation occuring in the three areas of sub-landscape [23]. Table 2. Landscape metrics indicators of the composition and level of forest landscape fragmentation, based on McGarigal [22].
We analyzed the behavior of each measure of forest fragmentation in three regions of sub-landscape against the series of years of data acquisition of satellite imagery. We examined the relationship between the percentage of forest loss in the series of years of data acquisition with all landscape metrics indicators. This calculation was based on a regression techniques, in order to know the variable predictors of the forest landscape metrics indicators [7], and to know the significant differences in the values of the size of the fragmentation occuring in the three areas of sub-landscape [23]. Identifying of the spatial transformation process of landscape pattern The identification of the phases of forest fragmentation on each area of sub-landscape are based on the decision-tree model [24]. All decisions are based on the area (a), the perimeter (p), or the number of patches (n), before (a0, p0, n0) and after (a1, p1, n1) transformations of the landscape, as well as comparation of the area before and after transformation, tobs = a1/a0. Furthermore, the flow charts of the decision tree model was translated into matrix as show in Table 4. The decision tree model can be used to determine the ten spatial transformation processes. However, in this study the fragmentation of forest is mainly related to the degradation of forest cover, in such that this study research will only use five spatial transformation

11 Vol. 2 No. 1, 8-18 http://dx.doi.org/10.22135/sje.2017.2.1.8-18
process, namely: reduction of the number of patches (attrition), reduction of patch size (shrinkage), subdivision of patches using equal-width lines (dissection), breaking up of patches into smaller parcels (fragmentation), and gap formation (perforation) [24]. Table 3. Landscape metrics indicators of the configuration of the landscape, changes, and occurrence of connection isolation landscape habitat, based on McGarigal [22].
The multiple regression analysis was done to determine the predictor variables and the coefficient of regression, as well as the weighted of each variable roles against the process of the forest fragmentation, which is expressed in various indices. Table 4. The spatial transformation process of the forest fragmentation phases extracted from the flow chart of the decision tree model [24].
Fragmentation Index Calculation process of fragmentation index is performed with the multiple regression analysis to determine the variable predictors, in which the
percentage of the forest cover loss as the dependent variable, while the entire indicators of landscape metrics as an independent variables. The variables do not have a significant correlation with other variables are not used in the regression techniques. The multiple regression analysis produces predictor variables and coefficient of regression, which is a value of each indicator of landscape metrics as a variable fragmentation. The value of the total score of fragmentation, based on the value of each variable multiplied by the value of the coefficient of regression, was calculated with the following formula: 𝑊𝑓𝑔 = 𝑊𝑓𝑔𝑖. 𝑓𝑔𝑖
𝑛
𝑖=0 (2)
where Wfg indicates the value of total score of fragmentation, wfgi indicates the weighted of each variables, and fgi indicates score variable fragmentation of the ith. Re-scaling the Value of Fragmentation Variables To provide an explanation of how the values of indicators of landscape metrics and the value of total score of fragmentation can be created in the graph, we conducted re-scaling against all off scoring, which results in a value interval. So it can be shown in simple form, as the graphic of the dynamics of forest fragmentation phase. In order to determine the standard of the fragmentation level, then the total score of fragmentation is transformed (re-scaling) into value of the forest fragmentation index, with a value interval from 1 to 5, using the equation as follow (modified from Sharifi, [25]:
𝐼𝑛𝑑𝐹𝑟𝑎𝑔 = 1 +(𝑆𝑐𝑜𝑟𝑒 𝑡𝑜𝑡𝑎𝑙 𝑖𝑛𝑝𝑢𝑡 − 𝑆𝑐𝑜𝑟𝑒 𝑡𝑜𝑡𝑎𝑙 𝑚𝑖𝑛)(𝑆𝑐𝑜𝑟𝑒 𝑡𝑜𝑡𝑎𝑙 𝑚𝑎𝑥 − 𝑆𝑐𝑜𝑟𝑒 𝑡𝑜𝑡𝑎𝑙 𝑚𝑖𝑛)
× 𝐼𝑛𝑑𝐹𝑟𝑎𝑔𝑚𝑎𝑥 – 𝐼𝑛𝑑𝐹𝑟𝑎𝑔𝑚𝑖𝑛 (3)
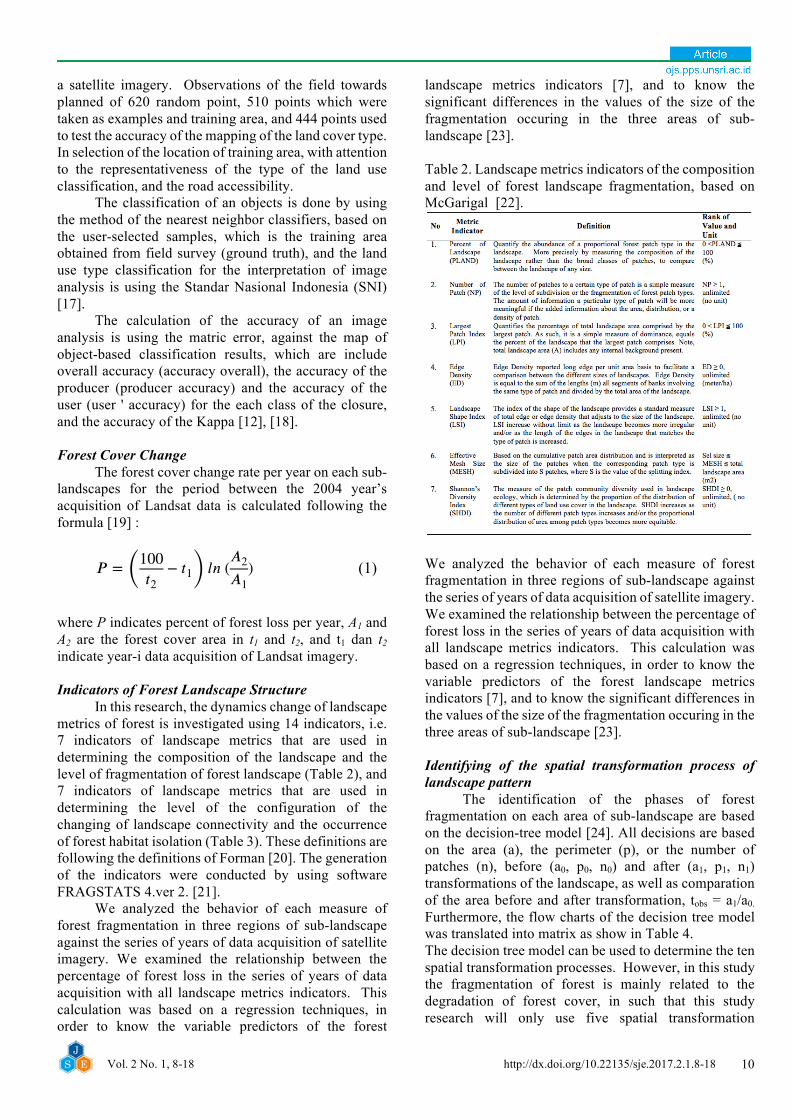
where Ind_Frag indicates the fragmentation index: (1 – 5), Score total input indicates the value of total score entered, Score total max indicates the value of largest total score, Score total min indicates the value of smallest total score, Ind_Frag max indicates the largest fragmentation index (5), and Ind_Frag min indicates the smallest fragmentation index (1). 3. Results Deforestation and forest fragmentation A series of forest cover maps representing a profile of change throughout our study period, based on the TM Landsat Imagery for acquisition of period: 1989, 1995, 2000, 2006, 2009 and 2013 are presented at Figure 2. The land cover types based on the interpretation of Landsat imagery year 2013 are defined as the secondary natural forest (173.722 ha), forest plantation (14.114 ha),
12 Vol. 2 No. 1, 8-18 http://dx.doi.org/10.22135/sje.2017.2.1.8-18
shrub (68.052 ha), mixed dryland agriculture (76.332 ha), open land (11.030 ha) and palm plantations (3.226 ha).
Figure 2. A series of the forest cover maps representing
a profile of change through our study period, base on the TM Landsat Imagery.
Figure 3. A total areal of land cover classification,
based on the TM Landsat Imagery
The land cover types from the moderate resolution of the Landsat TM data in 1989, 1995, 2000, 2006, 2009 and 2013 with six land cover types are shown in Figure 3, which shows a tendency of the decreasing in the area of the secondary natural forest, and has turned, which is dominated by the mixed dry land agriculture and shrub. Table 5. Total areas of secondary natural forest in each sub-landscape by the years of the acquisition of Landsat imagery
Table 5 indicates the occurrence of the total area of change and percentage of natural secondary forest closure as the process of the deforestation and degradation of natural forests from 1989 to 2013 on the respective of sub-landscape. In the rest of our analysis,
we used this database for the calculation of the spatial analysis of the forest fragmentation phases.
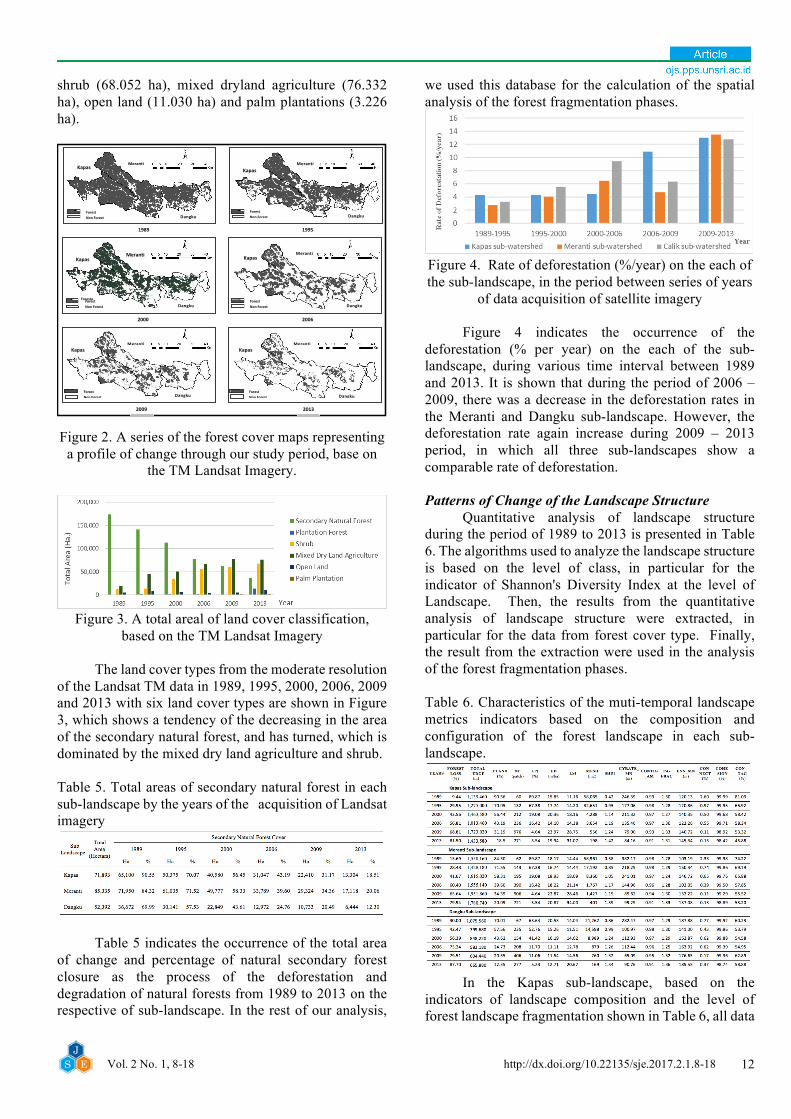
Figure 4. Rate of deforestation (%/year) on the each of the sub-landscape, in the period between series of years
of data acquisition of satellite imagery
Figure 4 indicates the occurrence of the deforestation (% per year) on the each of the sub-landscape, during various time interval between 1989 and 2013. It is shown that during the period of 2006 – 2009, there was a decrease in the deforestation rates in the Meranti and Dangku sub-landscape. However, the deforestation rate again increase during 2009 – 2013 period, in which all three sub-landscapes show a comparable rate of deforestation. Patterns of Change of the Landscape Structure Quantitative analysis of landscape structure during the period of 1989 to 2013 is presented in Table 6. The algorithms used to analyze the landscape structure is based on the level of class, in particular for the indicator of Shannon's Diversity Index at the level of Landscape. Then, the results from the quantitative analysis of landscape structure were extracted, in particular for the data from forest cover type. Finally, the result from the extraction were used in the analysis of the forest fragmentation phases. Table 6. Characteristics of the muti-temporal landscape metrics indicators based on the composition and configuration of the forest landscape in each sub-landscape.
In the Kapas sub-landscape, based on the indicators of landscape composition and the level of forest landscape fragmentation shown in Table 6, all data
Forestan Forest
NonForest
Kapas
MerantiKapas
Kapas
Kapas
Kapas
KapasMerantia
Merantia
Merantia
Merantia
Merantia
ForestNonForest
ForestNonForest
ForestNonForest
ForestNonForest
ForestNonForest
1989 1995
2000
2009
2006
2013
Dangku
Dangku
DangkuDangku
Dangku
Dangku

13 Vol. 2 No. 1, 8-18 http://dx.doi.org/10.22135/sje.2017.2.1.8-18
from 1989 to 2013 show a decrease in the percentage of extensive forest patch against the vast landscape (PLAND) from 90.56% to just 18.5%, and the largest patch index (LPI) plummeted from 89.87% to 3.54% due to the increasing number of patches, and the effective mesh size of patch (MESH) also decreased from 58, 064.78 m2 to being only covering 198.20 m2. Meanwhile, the number of patches (NP) rose significantly from 60 units to become 771 units, In the Meranti sub-landscape, the landscape structure showed a decrease in the percentage of extensive forest patch against the vast landscape (PLAND) from 84.30% to just 20%. The largest patch index (LPI) plummeted from 89.87% to 3.54% due to the increasing number of patches, and the effective mesh size of the patch (MESH) also decreased from 58, 961.19 m2 to 400.88 m2. On the other hand, the number of patches (NP) rose significantly from 62 units to 721 units. In the Dangku sub-landscape, the landscape structure showed a decrease in the percentage of extensive forest patch against the vast landscape (PLAND) from 70.01% to a 12%, the largest patch index (LPI) decreased from 63.64% to 5.23% due to the increasing number of patches, and the effective mesh size of patch (MESH) also decreased from 21,261.76 m2 to 168.51 m2. Meanwhile, the number of patches (NP) rose significantly from 67 units being 277 units. Forest Fragmentation Index Note that the fragmentation is a spatial transformation process having several phases or levels. Therefore, in order to get a single fragmentation index based on a combination of several landscape metrics a different natural landscapes, and using multi-temporal data, several regression models have been developed. In this study, the percentage loss of forest cover from 1989 to 2013 was used as the dependent variable, while indicators of landscape metrics are designed as the independent variables. Table 7. Analysis of Variant (ANOVA) of the Multiple Regression Models of Forest Fragmentation Index.
The results of multiple regression analysis of forest fragmentation index of each location, showed that the independent variables are statistically significant in predicting a dependent variable (p ≤ 0.05), with high deterministic’s (R2) (Table 7). Note that all locations have the same independent variables, namely NP and
LPI. In addition, the Kapas and Meranti sub-landscape have similar independent variables, namely CONTAG. Figure 5 provides an explanation of how the values of indicators of landscape metrics can be created in the graph in the same scale. Then, we do re-scaling from 1 to 5 against the values of landscape metrics. The result shows the dynamics of forest fragmentation phase in the Kapas sub-landscape. It could be different from the forest fragmentation process in the Meranti and Dangku sub-landscapes.
Figure 5. Forest fragmentation index of the predictor
variables of the landscape metric indicators in the Kapas sub-landscape.
Using a similar procedure, we could obtain the fragmentation index of the predictor variables of the landscape metric indicators in other sub-landscapes, namely the Meranti and Dangku sub-landscape as shown in Figure 6 and Figure 7, respectively. Note that the dynamics of forest fragmentation phase in each sub-landscape has different characteristics in which each sub-landscape has its own typical characteristic.
Figure 6. Same as in Figure 5 except for the Meranti
sub-landscape
Figure 7. Same as in Figure 5 except for the Dangku
sub-landscape.
-
1.00
2.00
3.00
4.00
5.00
6.00
1989 1995 2000 2006 2009 2013
Inde
x
YearNP_idx LPI_idx CONTIG_idx CONTAG_idx FragmentationIndex
-
1.00
2.00
3.00
4.00
5.00
6.00
1989 1995 2000 2006 2009 2013
Inde
x
YearsNP_idx LPI_idx SHDI_idx COHESION_idx FragmentationIndex
-
1.00
2.00
3.00
4.00
5.00
6.00
1989 1995 2000 2006 2009 2013
Inde
x
YearNP_idx LPI_idx CONTAG_idx FragmentationIndex

14 Vol. 2 No. 1, 8-18 http://dx.doi.org/10.22135/sje.2017.2.1.8-18
Forest Fragmentation Phases The identification of forest fragmentation in the Kapas sub-landscape was conducted for a period of 1989 to 2013. There were three criteria used in the identification process, the total of habitat patches, number of patches and total edge (Table 4). The results are presented in Figure 8. It is shown that the forest fragmentation phases based on the landscape-pattern changes during the period of observation are Dissection – Dissection – Dissipation – Dissection and Attrition, respectively.
Figure 8. Identification of the magnitude of forest
fragmentation phases in Kapas sub-landscape.
The identification of forest fragmentation in Meranti sub-landscape made between observation data in a period of 1989 to 2013, with reference to the criterion in Table 4, namely a total of habitat patches, a number of patches and total edge, presented in Figure 9. The pattern changes of the each forest fragmentation phase in year of periods of observation are Dissipation – Attrition – Dissipation – Dissection and Attrition.
Figure 9. Same as in Figure 8 exept for the Meranti
sub-landscape. The identification of forest fragmentation in Dangku sub-landscape made between observation data in a period of 1989 to 2013, with reference to the criterion in Table 4, namely a total of habitat patches, a number of patches and total edge, presented in Figure 10. The pattern changes of the each forest fragmentation
phase in year of periods of observation are Dissipation – Attrition – Dissipation – Dissection and Attrition.
Figure 10. Same as in Figure 8 except for the Dangku
sub-landscape.
Spatial transformation process and forest fragmentation phases The calculation of the multiple regression models of forest fragmentation index (Table 7) and the spatial transformation process based on the decision tree model (see Figure 8, 9 and 10), on each phase of the fragmentation of forests, were implemented at the each research location, e.g. the Kapas, Meranti and Dangku sub-landscape, and it was formulated in Table 8. Table 8. The spatial transformation process on the phases of forest fragmentation
Table 7 shows the form of the multiple regression model of forest fragmentation on the respective research location. Figure 5, 6, and 7 shows the magnitude of the role of each variable and the level of forest fragmentation in the index, in the lapse of the time period, while Figure 8, 9, and 10 indicate the magnitude of the forest fragmentation phase in the interval of time period. 4. Discussion Monitoring of forest fragmentation During 1989 to 2000, the production forest in the Kapas and Meranti sub-landscape was managed by the

15 Vol. 2 No. 1, 8-18 http://dx.doi.org/10.22135/sje.2017.2.1.8-18
concessionaire with the Selective Cutting System. These two areas show a deforestation average of about 4.32 - 4.08 % per year (Figures 3 and 4.). During 2000 to 2006, the production forest area was managed by state-owned enterprises, and failed in implementing the industrial forest plantation silviculture with the Slash Line Planting System. As a result, the rate of deforestation rose to 4.48 - 6.46 % per year (Figure 4). The concessionaire permit was revoked in 2005, and then the deforestation in 2006 to 2009, especially in Kapas sub-landscape, rose dramatically up to 10.87% per year. This rapid increase mainly due to the change of the status of the forest area into an open access area. In 2007 the Central Government issued a new forest concession license of Acacia industrial plantation for pulp and paper industries. In 2009 the illegal logging could be suppressed by district forestry service, which caused a drop in the rate of deforestation to 4.72%. However, from 2009 to 2013 the deforestation rate increase to more than 13.00% per year. This increase is partly due to the conversion of the secondary natural forest into an Acacia forest plantation. In addition, the increase of deforestation rate may be caused by the illegal logging and encroachment was out of control. The Dangku sub-landscape is a wildlife conservation area. During 1989 to 2009, the deforestation rate in Dangku sub-landscape was about 3.27 - 6.31 % per year. However, during 2009 to 2013, the deforestation rate increased drastically by about 12.75% per year. [1] concluded that the loss of the old-growth forests cover in the Sumatra from 2000 to 2012 is covering an area of about 1,205,000 ha (21.3%) or average area of 100,416 ha/year (1.75%). This proves that the rate of loss of the remaining lowland natural forest of the South Sumatra is far above the average rate of loss of the natural forests of Sumatra. Spatial transformation process of landscape structure The discussion on the rapid changes of the landscape structure of the Meranti-Dangku tropical lowland forest implied the sensitivity to the spatial arrangement that should have been attributed to the shape and size of patches. The ecologists are interested in the spatial distribution of the patches, because many ecological processes, including the animal behavior, seed dispersal, and climatic factors are potentially influenced by this component of landscapes (Hargis, 1998). In the absence of such parameters, then, the ecologists improve their understanding of the ecological processes by applying the several metrics indicators to any given investigation [26]. The spatial transformation process, such as dissection, dissipation and attrition have affected on the patch type dispersion and patch type interspersion of pairwise adjacencies, in such that they become high, while the patch cohesion index of similar type was declined. Here, the largest patch index decreases and
improves the diversity index of the path type. As the result of the conversion process, part of the largest patch type has changed into other patch types. The dissection occurs when the largest patch is broken up into a smaller size, while the dissipation phase occurs when the largest patch is breaking up into smaller parcels. In this case, the contagion is affected by both the dispersion and interspersion of pairwise adjacencies of patch types. The contagion index has strong correlation with the patch cohesion index, where it indicators measure the physical size of the connectedness of the same type patch. Likewise, contagion index has strong correlation with the patch contiguity index, where it assesses the size of spatial connectedness or transmission the patches of the fragmented forest. The multiple regression shows that the fragmentation of the forests affected by the increase in the number of patch, as well as the decrease in the largest patch index and the contagion index [7]. This in a sustainable way will affect the shape of the landscape and increase the complexity of the structure of the landscape. The change of patch type after the process of dissection, dissipation and attrition, will increase the patch type diversity, whereas the patch type change will effect the growing of dispersion and interpersion. We found that all of fragmentation phases, namely dissection, dissipation and attrition indicated by decreasing of the largest patch index, will cause a change in the dispersion and interspersion of pairwise adjacencies of patch type. We found specific characteristics of the Dangku sub-landscape, where the forest fragmentation phases is a function of increasing number of patches and the diversity of the patches type, as well as decreasing in the largest patch and the inter-patch cohesion. There are strong correlation between reducing of largest patch index and increasing of patch type diversity, where the patch type diversity increase because of some number of patch converted into another patch type. In addition, a very strong correlation between the number of patches and the patch connectivity, suggests that a reduction in the number of patches are highly sensitive to the change of the physical size of the connectedness of the same patch type. In the whole area of research, the number of patches continue to change, so that we do not find the process of perforation (gap formation) and shrinkage (reduction of patch size). The perforation and shrinkage process can only be observed if there are no additional or reduction of the number of patches. Forest Fragmentation Phases The pattern change occurring in each forest fragmentation phase suggests the association of each phase with the tendency of a part of patches of particular sizes to be converted into another patch type. The different magnitude of forest loss in each phase of

16 Vol. 2 No. 1, 8-18 http://dx.doi.org/10.22135/sje.2017.2.1.8-18
fragmentation affects the uncertainty level associated with the research of natural forest. The quantification of fragmentation index in this research differs from a single fragmentation index, in particular the selection of the level of fragmentation at a specific time (i.e. a specific year) [11]. We did an inter-correlation analysis, among the indicators of landscape metrics. Then, we selected the variables having significant inter-correlation. In order to find key indicators of landscape metric affecting forest loss or forest fragmentation, a multiple regression analysis was applied to the percentage of forest loss as a dependent variable. A primary impact of the habitat fragmentation is an increase in the patch edge of the habitat. Meanwhile, the fragmentation of dissection and dissipation caused a decrease in the index of patch contiguity and patch cohesion. Both indexes, patch contiguity and cohesion, have a high positive correlation with the mean nearest neighbor distance (MNND). Note that, the MNND provides an information on the spacing between patches in a cluster, regardless of the patch type. This suggests that habitat fragmentation poses a multiplier effect and influences the balance of forest ecosystems. The research on the forest fragmentation in the Kapas, Meranti and Dangku sub-landscapes indicated that the number of a patch and area of habitat patch is the main criteria for determining the phases of forest fragmentation. This result is in agreement with previous study by Boygaert (2004). In the Kapas and Meranti sub-landscapes, there are at least five effects of the forest fragmentation process, namely (a) an increase in the number of habitat patches, (b) a decrease in the sizes of habitat patches, (c) a reduction in the habitat amount, (d) a reduction in contagion values of habitat patches, and (e) reduction in contiguity values of habitat patches. Meanwhile, previous study proposed an additional effect, which was an increase in the isolation of patches [27]. As the big patches of the landscape were broken, where the phases of fragmentation are dissection, dissipation, or attrition, then a small patches will fill the remaining space, and this will result in slightly higher of edge density and slightly lower of contagion values, and this is in accordance with Hargis [7]. The Kapas sub-landscape have the fragmentation phases of Dissection – Dissection – Dissipation – Dissection – Attrition. From 1989 to 2000 there was a process of subdivision of the forest patches, which devided the area using an equal-width lines (dissection), indicated by a forest logging for road construction. From 2000 to 2006, the fragmentation continous with the process of breaking up of the forest patches into the smaller parcels (dissipation). Then, from 2006 to 2009 there was the process of subdivision of the forest patches using an equal-width line (dissection), while from 2009 to 2013 has been going on the reduction of the number
of patches (attrition), indicated as converted to other land use type. The magnitude of forests loss in the period 1989 to 2013 shows a continued declination, from 14.725 ha to 9.106 ha, but the magnitude of total forest loss is higher than in the Meranti and Dangku sub-wtershed. We found a unique result in the Meranti and Dangku sub-landscape, whereas during the period from 1989 to 2013 both sub-landscapes have similar amplitude and phase of forest fragmentation: Dissipation – Attrition – Dissipation – Dissection – Attrition. However, in each stage of the forest fragmentations, both sub-landscapes have different the measure on reduction of the number of patches, and the magnitude of total forest loss. In addition, both these locations have a different in the inter-correlation characteristics and the predictor variables of the multiple regression models of forest fragmentation. At both of adjacent locations, showed have similarity in the pattern of drivers and pressures of deforestation, although with different levels of intensity. Despite having undergone various phases of the forest fragmentation, but the value of the patch cohesion index in Kapas, Meranti and Dangku sub-landscape remains high (Table 5), more than indicating over 98,42%. This indicates that the physical size of the connectedness of the current forest patch is still high, where the type of the remaining forest patches becomes more clumped or aggregated in its distribution. It is, therefore, physically more connected. However, the fragmentation of the forest produces a large number of small-sized patch, where some fauna species probably could not cross the area of the non-habitat, will be limited by the large number of other patches type with small size. Each patch of habitat would be too small to sustain the local population, or perhaps also against individual territory, so it would be reduced of the opportunities to survive, and would be reduced to the overall population size. 4. Conclusion In this research, to find the magnitude of the lost of forest in the process of fragmentation, it would be better if preceded by doing a review of the pattern of spatial structure of forest landscape change, as well as exposing the properties of the unknown, rather than simply evaluating the change on closure of the forest. Thus, we will find the behavior of the spatial forest fragmentation processes. When some locations have the same of amplitude and phases of the fragmentation of the forest, but at each stage and each location of the forest fragmentation have the distinction of size of the reduction of the number of patches and the magnitude of the total forest loss, then this research found the difference in the characteristics of the inter-correlation and predictor variables of

17 Vol. 2 No. 1, 8-18 http://dx.doi.org/10.22135/sje.2017.2.1.8-18
fragmentation of the forest. We convinced that at these locations have the same drivers and pressures that influence the patterns of deforestation. We affirm that the core-set of the landscape metrics is not have like it. Of the three locations of this study area have a different core set metrics, where the other metrics may be more appropriate to another location; and metrics should be always be used critically, aware of the usefulness and limitations of the resulting range of the metric-derived values. The understanding of the relationship between series of the forest loss rate and the spatial transformation process based on the decision tree models provides a more comprehensive approach in the determining of the rapid change of the forest landscape structure of the forest fragmentation phases, and can be complemented to the Protocol of the Forest Monitoring. The landscape ecology approaches to be adopted in the Protocol of Conventional Forest Inventory and Monitoring, so the planning and management of the habitat could be based on the quantitative analysis of spatial changes of landscape structure of the forest. Needed more research for to find the linkages between the dynamics of the spatial change in the tropical forest fragmentation and its effect on the forest biodiversity. Acknowledment This study is part of the first author’s dissertation in the Graduate School of Environmental Science, University of Sriwijaya. The last author is supported by the Ministry of Research, Technology and Higher Education through “Hibah Kompetensi (No. 023/Sp2H/LT/DPRM/II/ 2016)”. References [1] B. A. Margono, P. V Potapov, S. Turubanova, F.
Stolle, and M. C. Hansen, “Primary forest cover loss in Indonesia over 2000–2012,” Nat. Clim. Chang., vol. 4, no. June, pp. 1–6, 2014.
[2] M. J. Fortin, M. R. T. Dale, and J. Hoef, “Spatial analysis in ecology,” Encycl. Environmetrics, vol. 4, pp. 2051–2058, 2002.
[3] J. Sun, Z. Huang, J. Southworth, and Y. Qiu, “Mapping fractality during the process of deforestation in an Amazon tri-national frontier,” Remote Sens. Lett., vol. 4, no. March 2013, pp. 37–41, 2013.
[4] A. Botequilha Leitão and J. Ahern, “Applying landscape ecological concepts and metrics in sustainable landscape planning,” Landsc. Urban Plan., vol. 59, no. 2, pp. 65–93, Apr. 2002.
[5] P. R. Claggett and J. S. Tilley, “A Landscape Indicator Approach to the Identification and Articulation of the Ecological Consequences of Land Cover Change in the Chesapeake Bay,” Situ, no. June, 2007.
[6] R. T. T. Forman, “Some general principles of landscape and regional ecology,” Landsc. Ecol., vol. 10, no. 3, pp. 133–142, 1995.
[7] C. D. Hargis, J. A. Bissonette, and J. L. David, “The behavior of landscape metrics commonly used in the study of habitat fragmentation,” Landsc. Ecol., no. 1992, pp. 167–186, 1998.
[8] B. Goodwin and L. Fahrig, “How does landscape structure influence landscape connectivity?,” Oikos, vol. 3, no. June, pp. 552–570, 2003.
[9] M. Martínez-Ramos, I. A. Ortiz-Rodríguez, D. Piñero, R. Dirzo, and J. Sarukhán, “Anthropogenic disturbances jeopardize biodiversity conservation within tropical rainforest reserves,” Proc. Natl. Acad. Sci., vol. 113, no. 19, pp. 5323–5328, 2016.
[10] H. S. Alikodra, Zulfikhar, L. B. Prasetyo, H. Zulkifli, M. Wijayanti, T. Partomihardjo, H. Soedjito, A. Yanuar, A. Rafiastanto, Y. Hastiana, I. Imanda, W. Novariano, and Sunarto, The Concept Towards the Development of Essential Areas of a Wildlife Corridor. Harapan Forest – Dangku Wildlife Conservation Area, South Sumatra Province, I. Palembang: Sriwijaya University Press, 2013.
[11] S. A. Abdullah, “Quantifying forest fragmentation spatial process in the developing State of Selangor, peninsular Malaysia,” J. Land Use Sci., vol. 4248, no. November, pp. 1–16, 2016.
[12] H. Liu and Q. Zhou, “Accuracy analysis of remote sensing change detection by rule-based rationality evaluation with post-classification comparison,” Int. J. Remote Sens., vol. 25, no. 5, pp. 1037–1050, 2004.
[13] Frochn, A. R.C., B.C., Lane, C.R., And, and M. Reif, “No Title,” Int. J. Remote Sens., vol. 32(5), p. pp.1471-1489, 2011.
[14] T. Blaschke, “Object based image analysis for remote sensing,” ISPRS J. Photogramm. Remote Sens., vol. 65, no. 1, pp. 2–16, 2010.
[15] R. C. Weih and N. D. Riggan, “Object-based classification vs. pixel-based classification: Comparitive importance of multi-resolution imagery,” Int. Arch. Photogramm. Remote Sens. Spat. Inf. Sci., vol. XXXVIII, pp. 1–6, 2010.
[16] A. S. Laliberte, A. Rango, K. M. Havstad, J. F. Paris, R. F. Beck, R. McNeely, and A. L. Gonzalez, “Object-oriented image analysis for mapping shrub encroachment from 1937 to 2003 in southern New Mexico,” Remote Sens. Environ., vol. 93, no. 1–2, pp. 198–210, 2004.
[17] B. S. Nasional, “Metode penghitungan perubahan tutupan hutan berdasarkan hasil penafsiran citra penginderaan jauh optik secara visual,” 2014.
[18] I. Vorovencii, “Assessment of some remote sensing techniques used to detect land use/land cover changes in South-East Transilvania, Romania,”

18 Vol. 2 No. 1, 8-18 http://dx.doi.org/10.22135/sje.2017.2.1.8-18
Environ. Monit. Assess., vol. 186, no. 5, pp. 2685–2699, May 2014.
[19] J. Puyravaud, “Standardizing the calculation of the annual rate of deforestation,” Ecol Manag., vol. Vol. 177, pp. 593–596, 2003.
[20] R. T. T. Forman, “Some general principles of landscape and regional ecology,” Landsc. Ecol., vol. 10, no. 3, pp. 133–142, Jun. 1995.
[21] K. McGarigal and B. J. Marks, “FRAGSTATS: spatial pattern analysis program for quantifying landscapesStructure,” Gen. Tech. Rep. PNW-GTR-351. U.S. Dep. Agric. For. Serv. Pacific Northwest Res. Station. Portland, OR, vol. 97331, no. 503, p. 134, 1994.
[22] McGarigal K, C. SA, N. MC, and E. E., FRAGSTATS: Spatial pattern analysis program for categorical maps, Comp. software prog. Univ. Mass., Amherst., 2002.
[23] Slonecker and E.T., “A Landscape Indicator Approach to the Identification and Articulation of the Ecological Consequences of Land Cover Change in the Chesapeake Bay Watershed, 1970-2000.,” 2008.
[24] D. Bogaert, J., Cuelemans. R. And Salvador-Van Eysenrode, “A Decision tree algorithm for detection of spatial processes in landscape transformation,” Environ. Manage., vol. 33, pp. 62–73, 2004.
[25] M. van Sharifi, Herwijnen and and W. H. van T. van Den., Spatial Decision Support Systems. Enschede, the Netherlands: International Institute for Aerospace Survey and Earth Sciences (ITC), Enschede, 2007.
[26] K. H. Ritters, R. V. O’Neill, C. T. Hunsaker, J. D. Wickham, D. H. Yankee, S. P. Timmins, K. B. J. And, Jackson, and B.L., “A factor analysis of landscape pattern and structure metrics,” Landsc. Ecol., vol. 10, pp. 23–39, 1995.
[27] L. Fahrig, “Effects of habitat fragmentation on biodiversity,” Annu Rev Ecol Evol Syst, vol. 34, pp. 487–515, 2003.