the queensland mycologist - royal botanic gardens victoria3).pdf · what does the atlas of living...
TRANSCRIPT

What does the Atlas of LivingAustralia tell us about the
distribution of Mycenainterrupta in Queensland and
South Australia?
Tom MayRoyal Botanic Gardens Victoria
The report of the bright blue Mycena interrupta from Cairns in north Queensland in a recent issue of Queensland Mycologist (Webster & Leonard 2015) is intriguing because it would extend the known distribution of this distinctive fungus by more than 1,500 km. This record, and a recent record of the same species from near Adelaide, are examined using the Atlas of Living Australia, to showcase the tools available in the ALA and to promote further recording of M. interrupta and other species of fungi.
The Atlas of Living AustraliaThe Atlas of Living Australia (ALA) (http://www.ala.org.au/) provides a 'one stop shop' for viewing and interpreting distribution information for Australia's flora, fauna and fungi.The ALA aggregates data from a variety of sources and puts all the occurrences for each species on a map, that can be viewed at differentscales.
The power of the ALA is that it brings together both specimen data (compiled through Australia's Virtual Herbarium, which in turn brings together data from all the major herbaria in Australia) and observation data, such as from Fungimap. This is much more efficient than having to consult websites of each individual data contributor, if indeed their data are available on-line. Fungi are fully integrated into the ALA, and it is a fantastic resource for exploring the distribution of Australian fungi. [However, see Endnote about names].
ALA Spatial portalIn the ALA, maps of individual species are presented on species pages. There are more advanced mapping options in the Spatial portal, where it is possible to overlay distribution records over other layers. These layers can be the distribution of other species, or a large number of environmental variables, such as climate and soil characteristics. The ALA Spatial
portal also enables creation of predictive models, based on combinations of environmental variables.
Information about recordsIn ALA maps, by clicking on a point for an individual record, you can see information associated with the record, including who made the observation or collection, the date, the description of the locality and so on. Unfortunately, there are not specific fields in the ALA at the moment for associated vegetation, host and substrate (even if these fields are present in the original data). Sometimes however, notes (especially if they come from Fungimap records) contain information on the substrate and host and/or the vegetation type in which the fungus occurred.
Species listsThe ALA allows searching for particular species, and also the useful facility for assembling a species list (including for fungi) for a particular location or region (http://www.ala.org.au/species-by-location/). Thelocation can be radius (1, 5 or 10 km) around a specific point. Various pre-defined regions are also available such as states and local government areas.
Mycena interrupta distributionThere are a staggering 2,858 records across Australia and New Zealand for Mycena interrupta. Some records may be doubled up such as when individual recorders supply the same data to different organisations, such as state biodiversity atlases (e.g. the Tasmanian Natural Values Atlas) and Fungimap. Nevertheless, the level of recording of this species is impressive, given that at the start of the Fungimap project the species was known in Australia from only a handful of records.
Mapping Mycena interrupta in the ALA (Fig. 1) shows a distribution from Kangaroo Island in South Australia to the far south of Queensland, and throughout Tasmania (where the species is most commonly recorded in terms of records pergrid cell). In mainland Australia, the distribution is more or less continuous between the South Australia-Victoria border and the Sydney region, with more isolated occurrences to the west, on Kangaroo Island and near Adelaide, and to the north in Lamington NP in south Queensland.
5
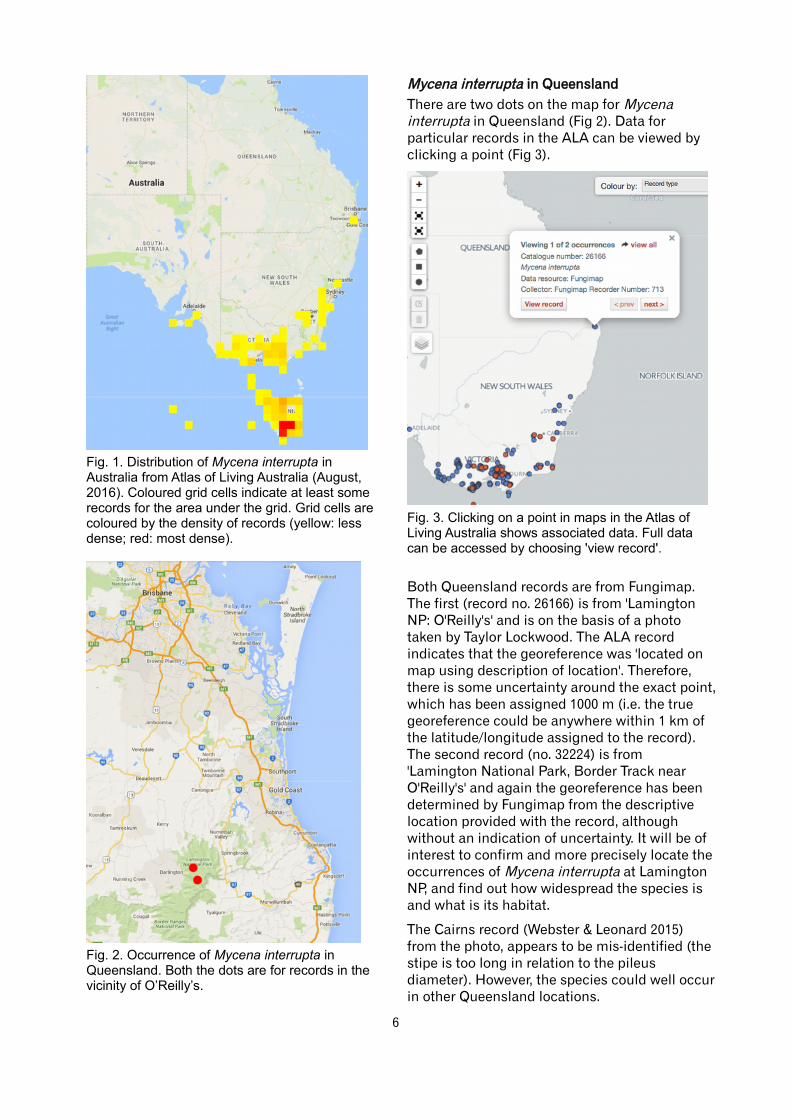
Fig. 1. Distribution of Mycena interrupta in Australia from Atlas of Living Australia (August, 2016). Coloured grid cells indicate at least some records for the area under the grid. Grid cells are coloured by the density of records (yellow: less dense; red: most dense).
Fig. 2. Occurrence of Mycena interrupta in Queensland. Both the dots are for records in the vicinity of O’Reilly’s.
Mycena interrupta in QueenslandThere are two dots on the map for Mycena interrupta in Queensland (Fig 2). Data for particular records in the ALA can be viewed by clicking a point (Fig 3).
Fig. 3. Clicking on a point in maps in the Atlas of Living Australia shows associated data. Full data can be accessed by choosing 'view record'.
Both Queensland records are from Fungimap. The first (record no. 26166) is from 'Lamington NP: O'Reilly's' and is on the basis of a photo taken by Taylor Lockwood. The ALA record indicates that the georeference was 'located on map using description of location'. Therefore, there is some uncertainty around the exact point,which has been assigned 1000 m (i.e. the true georeference could be anywhere within 1 km of the latitude/longitude assigned to the record). The second record (no. 32224) is from 'Lamington National Park, Border Track near O'Reilly's' and again the georeference has been determined by Fungimap from the descriptive location provided with the record, although without an indication of uncertainty. It will be of interest to confirm and more precisely locate the occurrences of Mycena interrupta at Lamington NP, and find out how widespread the species is and what is its habitat.
The Cairns record (Webster & Leonard 2015) from the photo, appears to be mis-identified (the stipe is too long in relation to the pileus diameter). However, the species could well occurin other Queensland locations.
6

Co-occurring speciesSpecies with similar distributions can provide pointers for where to check for novel occurrences. Where one species is present, the other may be there too, but unrecorded.
Using the 'Explore your area' feature of the ALA (http://biocache.ala.org.au/explore/your-area) enables compilation of a list of species from a particular location. Placing the pointer at the cafe at O'Reilly's there are 193 species of fungi (including lichens) recorded from a 5 km circle centred on this location. Among these species is Porpolomopsis lewelliniae (=Humidicutis lewelliniae). Comparing the distribution of this species with Mycena interrupta (Fig. 4) shows a rather similar overall distribution, but P. lewelliniae is present in South Australia only in the very far south-east, and occurs in other sites in Queensland in the south-east of that state.
Fig. 4. Distribution of Porpolomopsis lewelliniae (blue dots) overlaid on distribution of Mycena interrupta (yellow to red-coloured grid cells, as in Fig. 1). From Atlas of Living Australia.
The occurrences of P. lewelliniae in north-east New South Wales along with the other Queensland sites are places to check for occurrence of M. interrupta.
There might be other species of fungi that have amore similar distribution, which provides better pointers to likely occurrences. Other methods
that could be applied to predicting further locations for Mycena interrupta are analysis of associated vegetation and bioclimatic modelling (see below).
Mycena interrupta in South AustraliaLooking more closely at the South Australian records (Fig. 5), they are specifically from (1) the western end of Kangaroo Island, (2) the foot of the Fleurieu Peninsula, (3) near Adelaide, and (4)in the far south-east of the state. For this map, the Spatial Portal was utilised to provide a background layer showing rainfall.
Fig. 5. Distribution of Mycena interrupta in South Australia (blue dots) overlaid on Mean Annual Precipitation [coloured from blue-green (low) to orange (high)]. Map produced in Atlas of Living Australia Spatial portal.
The record from near Adelaide is the most recent, from 2012. The location is 'Mitcham, Adelaide foothills, 150m along Melville Gully Rd from Karka', which is within the Belair National Park. Given the intensive collecting for fungi in this and other locations around Adelaide by mycologist John Cleland in the first half of the 20th century, it was surprising to receive a new record of a mushroom as distinctive as Mycena interrupta. However, when compared to the known distribution from South Australia, the record is credible, because the habitat, 'Eucalyptus obliqua woodland' is the same as that occurring at the M. interrupta site at the foot
7

of the Fleurieu Peninsula to the south. The rainfall at Mitcham is also within the same higher rainfall zone as the other South Australian sightings.
Previous bioclimatic predictionBioclimatic predictions use knowledge of the climate of known locations to predict where a species might occur. Using a set of climate variables, known locations are matched against locations with similar climate. A bioclimatic analysis of the distribution of Mycena interrupta was carried out by Tonkin & May (1999), when there were around 200 records. The particular program used (BIOCLIM) was able to predict most of the known distribution (at that time) from a 'training set' that was a subset of the records for which altitude was known. However, the analysis was not able to predict some knownareas that were far away from the main distribution, probably due to the low number of records in the 'training set' (because BIOCLIM required knowledge of altitude, and there were only nine records that included altitude).
The bioclimatic analysis did not predict the later discovery of Mycena interrupta from Kangaroo Is. However, the analysis did predict occurrencesin Victoria in the Strzelecki Ranges and Mount Buffalo that have later been confirmed, althoughanother predicted region approximately betweenFalls Creek in Victoria and Perisher Valley in N.S.W. has not yielded any records yet.
Current bioclimatic predictionThe ALA Spatial portal includes a modelling facility. Using a set of climatic layers, the program Maxent generates a prediction layer showing where a species is expected on the basis of the climate of the known occurrences. Aprediction was generated for Mycena interrupta (Fig. 6), excluding points in the ocean. A set of five climatic variables was utilised: the ''BIOCLIM 1960 Best 5” set, consisting of: Precipitation driest quarter, Precipitation seasonality, Radiation seasonality, Radiation warmest quarter and Moisture Index highest quarter mean.
The prediction layer shows medium predictive strength broadly coinciding with the existing distribution. It is possible that other combinations of variables might make a better model. Nevertheless, the predicted area (the greener colouring) fits the known sites reasonably well. The prediction layer shows additional areas where the species might be
expected, particularly in the alpine areas of Victoria-N.S.W., on Flinders Is. in Bass Strait, and in central Tasmania. Lack of sightings in parts of the latter area might be related to land clearing leading to lack of suitable vegetation.
Fig. 6. Known distribution of Mycena interrupta (white rectangles) overlaid on predictive model layer derived from the 'BIOCLIM 1960 Best 5' set of climatic variables. Prediction scale is lower left: very low (blue) to medium (green) and high (red). Analysis carried out in the Spatial portal of the Atlas of Living Australia.
Where to look for Mycena interruptaThe presence of Mycena interrupta in LamingtonNational Park is a significant outlier, with a large distance to the occurrences in mid coastal N.S.W. Searches of seemingly suitable intervening habitat, such as in the Border Ranges and cool, wet forests at Barrington Tops and New England NP, are of interest. Indeed, much of New South Wales north of the Sydney-Newcastle region is poorly recorded for fungi.
The distribution of co-occurring species such as Porpolomopsis lewelliniae (see above) suggests
8

additional sites for survey of Mycena interrupta in northern New South Wales and Southern Queensland. However, in the bioclimatic analysis, the prediction layer shows very low values for these areas.
Data errorsMaps from the ALA are shown here 'warts and all'. With thousands of records there are bound to be some mistakes. Most misplaced dots on maps result from simple numerical errors in the georeference, such as transposition of numbers (34 for 43), either in the data as supplied, or introduced during data entry. Mistakes in identification are another potential source of error.
For Fungimap records, we check and correct these as they are detected. Inspecting maps is one useful method of spotting likely incorrect occurrences. Dots in the sea are obviously incorrect (there are several in Fig. 1), but dots a long way outside of the distributions are also inspected and checked against the original record details, and images if available.
Are your data in the ALA?It should be noted that the ALA does not collate every known record, because it relies on three things (1) the record must be digitised (i.e. in a database or submitted directly to the ALA as an individual record), (2) the digitised record must have a georeference, and (3) the digitised data must be supplied to the ALA.
For specimens, herbaria supply data to the ALA at different intervals. Additionally, in some herbaria many fungal collections remain to be databased, or those that are databased do not have georeferences. The ALA itself is a wonderful example of full integration of fungi into a biodiversity portal, but unfortunately the coverage of fungi in individual institutions (in terms of databasing) is not always at the same level as for vascular plants. It must also be remembered that there are considerable collections of Australian fungi in non-Australian herbaria, and most of these are not yet available on-line. If you have supplied specimens or sight records to an institution or organisation, and there is no dot in the ALA - ask what has happened to your data!
For Fungimap, the data upload to the ALA is about once a year, but we plan to increase the frequency of updates.
Supporting data for new observationsFor readily recognisable species, Fungimap accepts observations without photos. The Fungimap image database is not set up to cope with tens of thousands of photos! However, photos are always welcome, especially if you have any doubt about identification. Especially, ifyour observation is a long way from the known distribution, it is ideal to submit a photo with therecord, and if possible to lodge a voucher collection in your local herbarium.
ConclusionThe Atlas of Living Australia offers a variety of ways of exploring occurrence data. There are sufficient data in the ALA for many species of fungi to show the overall distribution, but there is still much scope to add further data to flesh out known distributions. Keep an eye out for Mycena interrupta - your record could add valuable information on the distribution of this iconic mushroom.
ReferencesTonkin, J.E. & May, T.W. (1999). A preliminary
bioclimatic analysis of the distribution of Mycena interrupta, Fungimap Newsletter 11: 3-4.
Webster, S. & Leonard, P. (2015) Cairns Foray, Queensland Mycologist 10(4): 10-13.
Endnote about namesThere are some issues at present with names of fungi in the ALA. The ALA is underpinned by the National Species List (NSL). Fungi names in the NSL come from AusFungi, a database maintained by Royal Botanic Gardens Victoria. AusFungi is the successor to ICAF (The Interactive Catalogue of Australian Fungi) which is still on line (http://data.rbg.vic.gov.au/cat/index.php/fungicatalogue), but was last updated around 2004. AusFungiis not available on line at present, but there are plans to deliver an online version. At present, AusFungi does not cover all Australian fungi, and because the ALA relies on having names in the NSL, if the name is not present in AusFungi and is also absent in global fungi names lists such as Species Fungorum, no results are retrieved from searches in the ALA, even if there are records from Australia. This problem is being addressed.
9