the quantitative qualitative correlation of friction … 3_2013_rus … · the quantitative...
TRANSCRIPT
Mechanical Testing and DiagnosisISSN 2247 – 9635, 2013 (III), Volume 3, pp. 15-39
THE QUANTITATIVE – QUALITATIVE CORRELATIONOF FRICTION AND WEAR IN LINEAR DRY CONTACT
BETWEEN STEEL SURFACES AND SHORT GLASSFIBER REINFORCED POLYMERS
Dorin Rus1, Lucian Capitanu2, Virgil Florescu1
1 Institute of Civil Engineering, Bucharest, [email protected] Institute of Solid Mechanics of the Romanian Academy, Bucharest
ABSTRACTThe aim was to highlight the evolution of the wear process depending on
the evolution of the friction coefficient and the dependency between wear andload, coupled with the sliding speed. As a result, it was possible tographically illustrate the evolution of the friction coefficient and the resultingchange in the wear process, emphasizing the abrasive, adhesive andcorrosive wear. The evolution of the plastic material transfer as a function ofthe contact temperature, namely of the power lost by friction (productbetween the contact pressure and sliding speed, pv) was aimed at and it was,thus, highlighted. It has been demonstrated that in the case of a 30% shorglass fibers (SGF) content the contact temperatures can reach and evenexceed the yield limit of the plastic material. We illustrated the evolution ofthe steel surface wear and the contact temperature as a function of thefriction coefficient. A detailed evaluation of the influence of the normal loadand the sliding speed (and, also, of the metallic surface roughness) on thefriction coefficient was conducted.
Keywords: PTFE + glass fiber composites, water lubrication, wear
Composite thermoplastic materials are biphasic materials consisting of a mass ofpolymer and the reinforcement embedded in it. The polymer provides the material withcompressive strength while the reinforcement improves the tensile strength. Thehomogeneity of the material and its cohesion play an important part in obtaining goodmechanical characteristics. The disposition of the reinforcement considerably influences thetensile strength. Conversely, the elasticity of the polymer can also improve the compressionor bending resistance of the reinforcement. The role of the basic polymer is first of allmechanical, that is, to provide the bond with the reinforcement fibers. The polymer deliversthe stresses between the reinforcement fibers. It is therefore necessary to ensure the properminimum adhesion between these two substances.
16
Mechanical Testing and Diagnosis, ISSN 2247 – 9635, 2013 (III), Volume 3, 15-39
As the adhesion cannot be achieved by mechanical means, it is necessary to create achemical bond for the polymer coating with the basic polymer. Treatments applied in thissense are specific to each thermoplastic material.
The basic polymer acts as a bridge between the reinforcement glass fibers. If the binderis slightly deformable, the fibers cannot move, so only a small number of them will supportthe loads. The polymer must allow a balanced distribution of load stresses between thereinforcement fibers, but at the same time must limit their movement to prevent excessivedeformation. The basic polymer also provides waterproofing, as most reinforcement fibershave a high affinity for water which can result in the loss of some of their properties. Thenature of the short glass fibers is quite important in respect to the preservation of themechanical, electrical and chemical properties of the reinforced thermoplastic material.Alkali-free glass is used in order to obtain stable products, as fibers with a high Na or Kcontent have characteristics that rapidly deteriorate as a result of superficial hydrolysis inthe presence of humidity. Glass containing metal oxides is used in certain proportions inorder to improve some mechanical properties, the elastic modulus, in particular.
The glass fibers used to reinforce the thermoplastic materials have a minimum tensilestrength of 25 MPa, when they are defect free; however, taking into account usual surfacedefects, they achieve a maximum tensile strength of 15 MPa, although the glass itself onlyhas a resistance of 0.5 – 0.6 MPa. The achieved elastic modulus ranges from 750 – 790MPa. The fiber elongation is about 2 – 3 %, completely elastic. No permanent deformationsoccur before breaking and there is no hysteresis at normal temperatures.
Also, the presence of glass fibers leads to the reduction of the factor time in the slidingprocess. Dimensional changes due to water absorption remain a polymer inherent,hygroscopical problem. By incorporating glass fibers in the thermoplastic materials, theirmechanical properties are preserved even under the influence of a wide temperature range.
Thermoplastic materials with glass fibers feature a structural mechanical associationbetween the glass fibers and the polymer. The thermoplastic compounds are characterizedby high plasticity under certain temperature conditions and by their returning to the initialstage, when cooling. In the plastic stage, they can be processed into finished products.
In 1964, Bowdon and Tabor [1] experimentally found that the values of the frictioncoefficient of the "clean" metal on plastic couples in the presence of some moderate loads aresimilar to those of the plastic on plastic friction couples. They concluded that the shear forceis due to friction of the micro-junctions, formed on the contact surface of the two samples.
Several studies provide values for the friction coefficient of plastic on metal and plasticon plastic couples, either reinforced or unreinforced, operating both under dry friction andin the presence of lubricants. Jacobi [2] finds friction coefficient values ranging between0.04 and 0.5 for polyamide reinforced with glass fibers. Bilik [3] determins values of up to2.0 for the friction coefficient of polyamides on steel. These studies emphasize the fact thatthe value of the friction coefficient is not constant, but dependent on relative sliding speed,contact pressure, surface roughness, temperature, etc.
Clerico [4], studying the friction behavior of polyamide on metal couple, found that thefriction coefficient values are higher for short periods of operation than those obtained forthe long term operation of the couple. He indicates friction coefficient values rangingbetween 0.1 and 0.65, for the first three hours of the couple operation, values that decreaseto 0.42 in the next 67 operation hours. He explains this through the viscoelastic propertiesof the polymer.
Hrusciov and Babicev [5, 6] show the growth of the microcutting component of thefriction force for plastic material reinforced with glass fibers acting on steel, whenincreasing the polymer content.

17
Mechanical Testing and Diagnosis, ISSN 2247 – 9635, 2013 (III), Volume 3, 15-39
Bely [7], Bartenev and Laventiev [8] studied the influence on the friction coefficient ofthe polymer nature and of the glass fibers orientation in its mass and found that the frictioncoefficient values increase when glass fibers do not have the same orientation as part of thebasic polymer.
Watanabe et al. [9] show the increase of the friction coefficient as a consequence of anincrease in the normal load. They explain the influence of temperature on the decrease ofthe friction coefficient value through the obviously intensified transfer of plastic material tothe steel, at high temperatures.
Lancaster [10], while studying the friction behavior of the polymers reinforced withdifferent fibers, established the dependence of the friction coefficient of the ratio vd3/Nfor lubricated couplings beak (of diameter d) to the disc type. He found the decrease of thefriction coefficient with the reduction of the metallic surface roughness and with theincrease of the value of the mentioned ratio. The friction coefficient decreases from 0.19 to0.04, when the ratio vd3/N increases from 10-14 to 10-11, for a roughness of 0.15 m of thesteel surface. For roughness values of 0.46 m, the friction coefficient is constant when thementioned ratio increases from 10-14 to 10-11. Studying the friction behavior of thethermoplastic materials, Barlow [11] provides values of 0.1 0.28, for the frictioncoefficient, applicable to these surfaces on lubricated steel. He notes the increase in thevalue of the friction coefficient with the increase of the relative sliding speed and thefriction torque between the surfaces.
West [12], while examining the friction behavior of the polyethylene/steel couple,shows the reduction of the friction coefficient from 1.24 to 0.78 when the normal loadincreases from 10 N to 5000 N. He demonstrates that for normal loads of 250 N to 1500 N,the friction force is proportional to the factor (N0.88) and the friction coefficient isproportional to (N0.22).
Bartenev, Lavrentiev et al. [13] establish that, in the case of friction bweeen plasticmaterials and metallic surfaces, the friction force increases at the same time as thelogarithmic increase in the sliding speed. This dependence is also expressed by Vinogradovfor the friction of crystalline polymers on metals. Where adhesion processes areoverwhelming, he also found an increase in the friction force, dependent on the normalload.
All of the above works lead to conclude that the friction process in thermoplasticmaterials is extremely complex, with a variety of parameters influencing both the value ofthe force and of the friction coefficient.
Although research and published works are quite numerous on the theme of the frictionbehavior of couples thermoplastic materials on metal, not the same can be said about thosepublished in the wear domain. The data presented in the specialty literature concerning thewear of this couple are specific to certain limited domains of use for reinforcedthermoplastic materials. Most papers treat qualitative aspects of the wear phenomenon andonly a few have touched on its qualitative side. Thus, Bowden and Tabor [14] havehighlighted the importance of the distribution of stresses on the contact surface, showingthat, for a Hertzian contact with elliptically distributed pressure, the central area of thecontact surface will be more seriously damaged than the marginal areas due to highervalues of surface tensile stresses (μp) that tend to exceed a certain critical value (μp)c.
Jost [15] points out that adhesion wear is predominant for polyamide/metal couples,both in dry friction conditions and in the presence of a lubricant.
Lancaster and Evans [16], studying the wear behavior of reinforced polymers underhydrodynamic lubrication, observed a decrease in the wear rate when increasing the valueof the factor vd3/ N for beak type couples with diameter (d), made of plastic material,
18
Mechanical Testing and Diagnosis, ISSN 2247 – 9635, 2013 (III), Volume 3, 15-39
undergoing friction on metal discs. The decrease is more pronounced as the roughness ofthe metallic surface is reduced.
In a comparative study of the wear behavior of high density injection processedpolyethylene and polyoxymethylene (of Delrin 150 commercial type), Shen and Dumbleton[17] discover wear coefficient values of 7.8×10⁻¹⁰ to 28.6×10⁻¹⁰. Their proposal for acalculation of the linear wear of high density polyethylene (UHMWPE) is a relation of thetype:
xpkh (1)where h – linear wear; k - wear factor; p - nominal pressure; x - sliding distance. Based onthe above relation they have documented values ranging from 1.33×10⁻¹¹ to 3×10-11 cm2/N,for the wear factor of high-density polyethylene.
Myshkin [18] studied the deformation component in the friction process as a result ofthe polymer resistance to the “ploughing” effect caused by the asperities of the roughercounterpart. The asperities of the polymer surface bear elastic, plastic and viscous-elasticdeformations, according to material characteristics. The adhesion component of frictionaccrues from the adhesion junctions formed as “stains” on the real contact area, whichappear between twined surfaces. For polymer composites, the abrasive component of thefriction force is more significant than the adhesive component.
Special care must be taken in the case of transfer films as they are the key factor thatdetermines the tribological behavior of polymers and polymer composites. A strong abrasioncomponent appears in the case of polymers reinforced with glass fibers [19]. Several modelswere developed to describe the contact adhesion. The Johnson-Kendall-Roberts (JKR) model(sometimes mentioned as a model of contact mechanics) [20-21] and the Derjaguin-Muller-Toporov (DMT) model [22] are the best known. A model comparative analysis [23] indicatesthat the JKR model applies to bodies of micrometric sizes or larger, while the DMT model isvalid for bodies of nanometric sizes, with metal characteristics.
Short fibers reinforced polymers (SFRP) form an important class of tribo-materials,beginning with their high specific wear resistance, good and fast loading capacity and lowcost processing. Nevertheless, their evolution is still in development, their properties need toadapt to more extreme loading conditions and there is a niche to expand the application fieldsfor these materials. Recently, nano sizes started to be taken into consideration in regards toorganic particles. It was determined that, by adding a small percentage of rigid nanoparticlesin SFRP, their resistance to wear improves significantly, especially in high pv conditions.However, the detailed mechanisms of such improvements were not fully understood yet.
To deeply understand the role of nanoparticles in the modification of the SFRPmaterials behavior to sliding wear, Chang and Friedrich [24] investigated the effects thatnanoparticles have on contact mechanics and on the wear behavior of the film transfer. Itwas determined that supplementary nanoparticles do not directly contribute to the highperformance of film transfer. Nevertheless, the presence of such nanoparticles within thecontact area may efficiently reduce the adhesion between the transfer film and thepolymeric sample, thus obtaining a smaller value for the friction coefficient. The rollingbehavior of nanoparticles in particular may significantly improve the tribologicalperformance of SFRP materials, when it comes to extreme sliding conditions.
The benefic tribological effects, observed in the behavior of composite polymers withshort fibers, was attributed to a low ploughing and tearing capacity and to other non-adhesive wear components [25].
Vos et al. [26] examined the wear behavior of polyetheretherketone compositesreinforced with short glass fibers and carbon fibers, in extremely different loadingconditions. Sliding wear tests were carried out on plan steel surfaces, revealing that, by
19
Mechanical Testing and Diagnosis, ISSN 2247 – 9635, 2013 (III), Volume 3, 15-39
adding short fibers, the wear rate decreases for certain sliding speed and contact pressureconditions, mostly when it involves carbon fiber reinforcement. The wear rate is alsoinfluenced by a change in the polymeric matrix morphology due to thermal treatment.However, no improvements of the wear resistance on abrasive paper could be obtained byreinforcements containing short fibers.
In comparison to polymers reinforced with continuous fibers, SFRP have theadvantages of faster processing and lower costs through injection and jet molding [27].However, due to fibers fracture and thermal failure of the polymeric matrix, machinecomponents made of SFRP risk suffering severe wear and sometimes abrupt obstruction,mostly in the case of large loads. This risk is naturally related to increases in friction as wellas contact temperature [28]. Current tendencies in SFRP development are to adapt theircharacteristics (properties) to more extreme loading conditions and environments and toexplore new application fields for these materials.
Chang et al. [29] investigated the tribological properties of two types of compositesmade of thermoplastic material resistant to high temperature, polyetheretherketone (PEEK)and polyetherimide (PEI), reinforced with short carbon fibers (SCF), graphite flakes andsubmicron particles of TiO2 and ZnS, in dry sliding conditions. They carried out theexperiments of friction and wear in a device of pin-on-disk type, using composite pins onpolished steel counter-pieces. Tests were carried out in a moderate pv range, at roomtemperature, as well as at high temperatures of up to 150 C. It was determined thatconventional fillers, such as SCF or graphite flakes may efficiently improve the wearresistance as well as the stress capacity of the polymeric matrix. By adding submicronparticles, both the friction coefficient and the wear rate of the composites were reduced,mostly in the case of high temperatures. Authors discussed the dominant wear mechanisms,based upon the microscopic analysis of worn surfaces.
Kukureka et al. [30] studied the effect of fiber reinforcement on the friction and wearof PA66 in rolling-sliding contact. They examined three types of composites with shortfibers: aramid, carbon and glass, rolling on identical materials, in a testing machine withtwin discs. It was determined that the aramid fibers reinforcement significantly modifies thefriction of the matrix material. However, both carbon fiber and glass fiber reinforcementssubstantially reduce the friction coefficient. The wear of composites with aramid andcarbon fibers was, essentially, linear in time, and in general, approximately 10 times higherthan that of the non-reinforced material. The wear of glass fiber composite was complex,with an initial period where the wear rate was similar with the one of the non-reinforcedmaterial. After a significant wear depth was produced, the wear rate changed to a similarvalue, but slightly higher than that of other reinforced materials. It seems that one of themain benefits of the introduction of fiber reinforcement, mostly of the one containing glass,is that it reduces friction coefficient and, consequently, it allows the material to be used athigher stresses, without surpassing the matrix softening point. However, the increase ofstress is in the detriment of component life expectancy, which is shorter, due to anincreased wear rate.
Wang et al. [31] studied samples of Nylon 1010 composite with MoS2 filler and shortcarbon fibers as reinforcement. The friction and wear behavior of composite materials wereinvestigated on a block-on-ring wear tester, where the sliding takes place in conditions ofdry friction, at a speed of 0.42 ms-1, under different loadings. The results indicated that theaddition of carbon fibers was efficient in reducing friction and wear of pure nylon, butMoS2 filler increased its wear. The reduction of wear and friction was more significantwhen carbon fibers were used as reinforcement together with MoS2 filler. Tribochemicalstudies through XPS indicated that particles of MoS2 decomposed and, while sliding,
20
Mechanical Testing and Diagnosis, ISSN 2247 – 9635, 2013 (III), Volume 3, 15-39
MoO3, FeS, FeSO4 and Fe2(SO4)3 were produced. They concluded that FeS, FeSO4 andFe2(SO4)3 compounds might increase the adherence between the transfer film and thecounter surface. The filler synergic capacity to form a fine, uniform and continuous transferfilm may contribute to the increase in wear resistance of nylon composites.
Cho and Bahadur [32] studied compression formed samples of polyphenylene filledwith nanosize CuO and polyphenylene sulfide composites (PPS) reinforced with fibers. Thetribological behavior of these materials, as well as the synergism due to the incorporation ofnanoparticles and fibers, were also investigated. The employed reinforcement materialswere short carbon fibers (CF) and aramid fibers (Kevlar grade). The proportions of thefilling material varied from 1% to 4% vol. and that of the reinforcing material from 5% to15% vol. In order to measure the wear volume and friction coefficient, a pin-on-disk slidingconfiguration was employed. The counterface was made of tool steel, hardened at 55-60HRC and finished at an average roughness Ra=0.09-0.11 µm. The wear tests were carriedout at a sliding speed of 1 m/s and for more than 6 hours, tests which provided wear datafor steady state sliding. For filler only, the lowest steady state was registered for thecomposite with PPS 2% CuO and in the case of fiber reinforcement for the composite PPS10% Kevlar.
Guo et al. [33] prepared composites based on epoxy pitch filled with hybrid nano-SiO2particles and carbon fibers. Styrene copolymer and maleic anhydride were spliced on(“blended into”) nanoparticles beforehand, so that they would be covalently connected to thecomposite matrix. The reaction, however, only appeared between the anhydride and epoxidegroups during maturation. Consequently, the nano-SiO2/matrix interface interaction wasincreased. By assessing the sliding wear characteristics of composites according tocompounds’ concentrations, a positive synergetic effect was found. The wear rate as well asthe friction coefficient of hybrid composites were significantly smaller than those ofcomposites containing nano-SiO2 particles or short individual carbon fibers. The compositewith 4 wt.% nano-SiO2 and 6 wt.% carbon fibers indicated the best tribological performance.
When polymers slide on metal surfaces, transfer films are formed. The samephenomenon occurs when sliding takes place between two polymers. In the case ofpolymer/polymer sliding, the material transfer was documented by Schwartz and Bahadur[34] through infrared studies that have shown that the polymer having a low densitycohesion energy transfers its material to the one that has a higher density cohesion energy.The transfer film formed on a non-polymeric counterface is regulated by the counterfaceroughness and the material that it is made of and, of course, by the sliding conditions.Another documented fact was that the transfer film increases with the number of iterations.The effect of counterface roughness on the process is also examined. The wear mechanismis discussed in correlation with the transfer film. This discussion leads to the conclusionthat when polymers are modified, such as by adding fillers, the transfer film affects thetribological behavior. Some fillers affect the transfer film development and theimprovement in its adhesion to the counterface. These filling materials often drasticallyreduce the wear rate of the polymer. On the other side, there are many types of fillers thatdo not have this effect on the transfer film and wear is increased in these particular cases.
Li et al. [35] published a study aimed at the experimental and analytical determinationof the tribological properties of the epoxide nano-composites reinforced with short carbonfibers (SCF), containing nano-TiO2 particles, polytetrafluorethylene (PTFE) powder andgraphite flakes, in order to understand the role the filler plays in modifying the wearbehavior of materials. The influence of two solid lubricants, PTFE and graphite, wasstudied and compared. The transfer films established in the presence of these two lubricantsin the sliding wear process of two epoxide nano-composites on metal counterpieces were

21
Mechanical Testing and Diagnosis, ISSN 2247 – 9635, 2013 (III), Volume 3, 15-39
characterized for different sliding conditions. The transfer film morphology was examinedusing electronic scanning microscopy (SEM), while the mechanic properties of the filmwere investigated through micro-hardness tests. A method based on micro-indentation wasproposed for determining the thickness of the transferred films. The role of the transfer filmin heat dissipation due to friction was also studied.
Components frequently fail during contact due to abrasion caused by solidcontaminants contained in the lubricant. This process is classified by Dwyer-Joyce [36] asvery close to the abrasion involving three bodies. The mechanisms through whichembedded particles induce material removal are not fully understood. The study describestests using the elasto-hydro-dynamic contacts model to study these mechanisms. An opticassembly of elastic-hydro-dynamic lubrication was employed to study the deformation aswell as the ductile and friable fractures produced by the particles borne by the lubricator. Aball-on-disk machine was employed to study the behavior of particles in partial slidingcontact. Small diamond particles were employed as abrasive materials as they do notdecompose in contact. In such case, wear could be directly related to a known dimension ofthe particles. Particles were found to be embedded on the softer surface, grating the hardersurface.
Stachowiak et al. [37] studied the effects of certain features of abrasive particles,mainly their shape and hardness, in the process of three body abrasion in metal samples.Experimental tests were carried out on a modified pin-on-disk tribometer with dry abrasiveparticles and on a ball-on-flat model employing suspension. The best correlation betweenwear rates and particle angularity was observed during the tests on the ball-on-flat model.Quartz particles were the exception, as they generated less wear than expected during alltests. Additional characteristics, such as the particle tenacity, its orientation during contactand the embedment in worn surfaces, further affected the wear results.
Capitanu et al. [38, 39] reported on the behavior of polyamide and polycarbonatereinforced with glass fibers in friction on steel surfaces. Capitanu and Florescu [19]presented some tribological aspects of steel surfaces wear with polymer compositesreinforced with glass fibers, during dry friction.
As it may be observed, studies published in specialized literature focused mostlyon polymer wear and not on steel counterpiece wear.
Generally, the results presented in this review of the specialty literature are inaccordance with the results of our researches. But no published study has yet presented acorrelation between friction and wear. The authors believe their paper will provide thereader with an overview of the complex process of friction - wear.
The authors studied the friction and wear of steel surfaces on Timken type couples(with linear contact), in dry sliding friction conditions, for contacts with polyamidereinforced with 20 - 30% glass fibers and polycarbonate reinforced with 20% glass fibers.Their focus was to establish the influence of the glass fiber content, the normal load (and,implicitly, the contact pressure), the relative sliding speed and the contact temperature onthe friction and wear mechanisms of steel surfaces.
2. MATERIALS AND METHODS
The friction and wear processes were analyzed for a relatively wide range oftribological parameter values that affect them (load, relative speed, contact temperature).The range of values used for the afore mentioned parameters includes both valuescommonly encountered in industrial applications and some extreme, less common valuesthat are nonetheless interesting from the point of view of studying the friction and wear
22
Mechanical Testing and Diagnosis, ISSN 2247 – 9635, 2013 (III), Volume 3, 15-39
mechanisms. Although the values of the stresses and the speeds, some parts made ofthermoplastic materials usually work in the range between 0.2 MPa – 1 MPa, respectively1.0 cm/s – 500 cm/s, attempts were made at speeds well outside these ranges.
The two elements of friction couples, the cylindrical liner and the flat sample, weremade of plastic and, respectively, metal. The metallic elements of the examined coupleswere made of steels of different qualities, exhibiting different surface states. Out of thetested steels, only few quality ones, widely used in industrial practice, have been selectedfor presentation.
For friction and wear tests, polyamides and polycarbonates were selected from thewide range of thermoplastic materials processed in industry on account of their increasedreinforcing possibilities when using glass fibers and high density polyethylene because ofits use as a replacement of metals in some practical applications. Experimental tests havebeen conducted using polyamides and polycarbonates reinforced with 20% and 30% glassfibers. Experimental tests have used the thermoplastic materials whose characteristics arepresented in [39]. A certain variation of such characteristics according to the variouscommercial types is observed, variation which occurs in rather limited ranges.
Nylonplast AVE Polyamide [40] has incorporated 30% glass fibers of a 12 mdiameter, resulting in an accentuated decrease in product deformation. At 50 0C and acompression of 140 daN/cm2, the deformation decreases from 1.4% in the case ofunreinforced polyamide, to 0.2% for the reinforced one. Noryl Polyamide [41] reinforcedwith 20% glass fibers is characterized by very low water absorption and high values for theelastic modulus. Lexan Polycarbonate [42] reinforced with 20% glass fibers has a highmechanical strength, a very good dimensional stability and a high resistance to shock.
The friction and wear behavior of the above materials, a significant factor in thetribological behaviour of the polyamides and polycarbonates, has been studied and will bepresented in detail in this paper.
The metallic samples of the tribologically tested couples were made of the followingsteel grades: C 120 steel grade hardened to 59 HRC and Rp3 steel grade, hardened to 62HRC. Their mechanical characteristics, chemical compositions and some microstructureconsiderations are provided in [39].
The surfaces of metal samples were processed by grinding, wet polishing withaluminium oxide and then polishing with a diamond paste, for different grain sizes. Thistechnology has allowed to obtain surfaces with Ra=0.025 m, Ra=0.045 m, Ra=0.075 mand Ra=0.125 m. However, the authors have experimented with samples exhibitingroughness values higher or lower than the ones just mentioned, in order to obtain a morecomplete characterization of the friction and wear process.
An experimental installation with a Timken type friction couple (with linear contact)was used due to the wide range of loads and speeds that could be considered and the needto achieve the greatest possible variety of working conditions (contact pressures, slidingspeeds and temperatures) for a more complete characterization of the tribological behaviorof composite material / steel couple. This can achieve very high contact pressures (between16 MPa and 36 MPa). The testing rig is presented in detail elsewhere [39].
The tests were carried out in order to determine the influence of the main factorsaffecting friction of thermoplastic material reinforced with glass fibers on metal couples.The well known Coulomb law (1780) establishes that the friction force Ff is directlyproportional to the normal force applied N:
NFf (1)Later studies have shown that , the friction coefficient, is dependent on more than the
normal force.
23
Mechanical Testing and Diagnosis, ISSN 2247 – 9635, 2013 (III), Volume 3, 15-39
Relations for variations of the friction force, varying with the applied load can beconsidered in the form of:
nf bNaNF (2)
or more simply:bNaFf (3)
or:n
f bNaF (4)Last relationship leads to the conclusion that when the normal force is equal to 0, the
friction force has other values than 0 ( aFf ). This could be explained by the presence of aremanent force of adhesion between the two surfaces, even after the removal of the normalload. However, The authors propose a more accurate use of a relationship of the form:
nf kNF (5)
where n is sub-unitary.The friction coefficient, according to Coulomb's Law, is expressed as N/Ff . The
friction coefficient for plastic materials can also be expressed as:cf p/ (6)
where f represents the shear strength of the softer material, and cp represents the flowpressure of the same material.
Because 3/HBpc , it results:HB/3 f (7)
The authors found that equation (7) is in agreement with preliminary experimentalresults.
As it is shown in [28], the characterization of the wear rate of a material may be donewith the help of a wear factor k, defined by the relation:
uV k N v t (8)where Vu is the volume of material removed through wear; N is the normal load; v is therelative sliding speed; t is the functioning time; k is the wear factor.
Dividing both relation terms (1) by the contact nominal area A, we obtain the relation:uV / A k v t N / A (9)
that is:tvpkh u (10)
where hu is the depth of the layer of worn material; p is the pressure over the contactnominal surface.
Eq. (10) expresses a general law of wear dependency, according to the pressurebetween the bodies in contact (p), and the distance run through friction, meaning Lf = vt.
Hence, we can write:fuu pL/hpvt/hk (11)
respectively:fuu NL/VNvt/Vk (12)
The wear tests were aimed at determining the volumes of material removed throughwear, the average depths of worn layers and, also, the volumetric and linear wear rates.
Tests were carried out at six different speeds: 18.56 cm/s, 27.85 cm/s, 37.13 cm/s, 46.41cm/s, 55.70 cm/s and 111.4 cm/s.

24
Mechanical Testing and Diagnosis, ISSN 2247 – 9635, 2013 (III), Volume 3, 15-39
3. EXPERIMENTAL RESULTS AND DISCUSSION
Increasing the friction coefficient increases the wear rate, but so far there is nomathematical relation between the two parameters, although one is widely accepted. In thefollowing, The authors will give some suggestive graphical representations that make aqualitative correlation between these two, tying them to the contact temperature. All testshave lasted 1 hour and, as such, wear rates are expressed in either cm3/h or mm/h.Quantitative data concerning wear rates have been detailed elsewhere [39].
This paper presents the variation gradient in wear rates (as worn volume and depth)while also measuring the contact temperature during tests. Diagrams (a) and (b), on top ofmain figures, represent the variation in the normal load and the contact pressure. For a morecomplete view of the wear process, the authors have included, at the bottom of mainfigures, variation curves in the contact temperature and the friction coefficient with thenormal load. The authors also show, through optical microphotography images, representativefor the wear scars. The authors believe this quantitative-qualitative approach can be used tobetter highlight the complexity of the friction – wear process and its evolution in time.
The influence of the load on the friction coefficient of the Nylonplast AVE PA + 30%glass fibers/ C120 steel couple is shown in Figures 1 and 2, for Timken type couple withlinear contact, at the sliding speed of 18.56 cm/s.
(a) (b)
(c)Fig. 1. Wear evolution as a scar wear volume (a) and depth (b) function of the normal load
and the contact temperature and the variation of the contact temperature (c)as a function of the normal load and friction coefficient at the sliding speed
of 18.56 cm/s, for Nylonplast AVE Polyamide + 30% SGF / C120 steel
25
Mechanical Testing and Diagnosis, ISSN 2247 – 9635, 2013 (III), Volume 3, 15-39
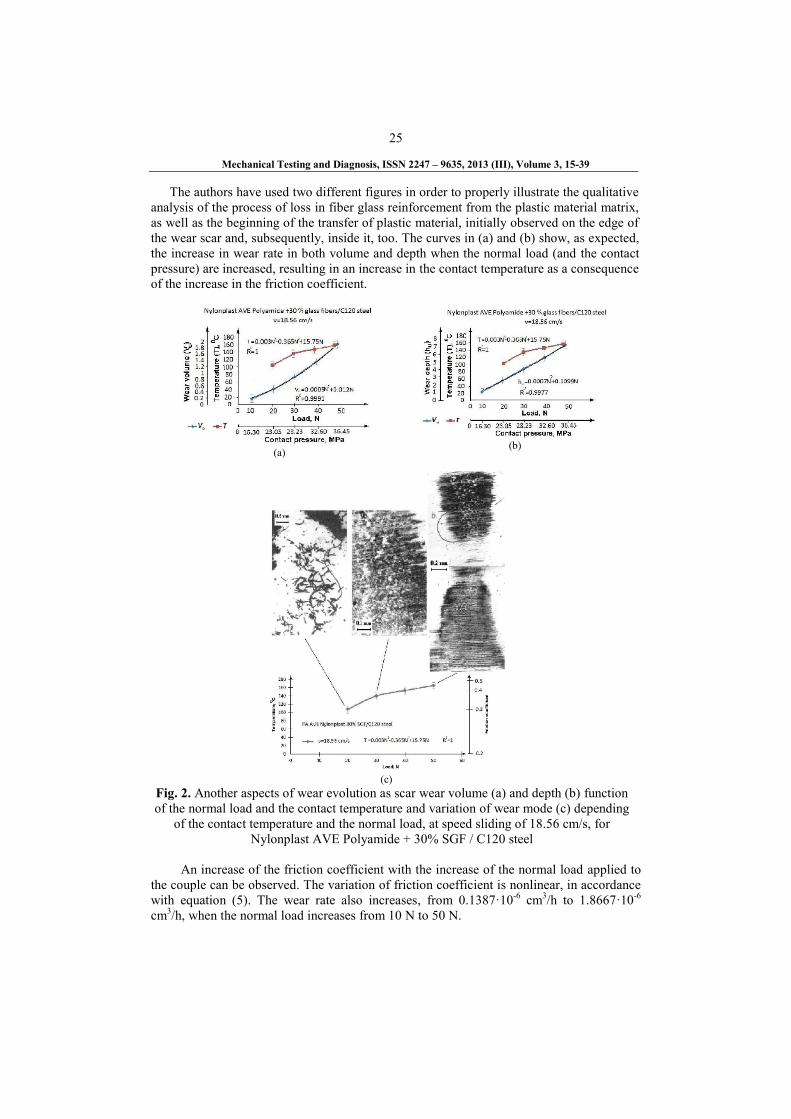
The authors have used two different figures in order to properly illustrate the qualitativeanalysis of the process of loss in fiber glass reinforcement from the plastic material matrix,as well as the beginning of the transfer of plastic material, initially observed on the edge ofthe wear scar and, subsequently, inside it, too. The curves in (a) and (b) show, as expected,the increase in wear rate in both volume and depth when the normal load (and the contactpressure) are increased, resulting in an increase in the contact temperature as a consequenceof the increase in the friction coefficient.
(a)(b)
(c)Fig. 2. Another aspects of wear evolution as scar wear volume (a) and depth (b) functionof the normal load and the contact temperature and variation of wear mode (c) depending
of the contact temperature and the normal load, at speed sliding of 18.56 cm/s, forNylonplast AVE Polyamide + 30% SGF / C120 steel
An increase of the friction coefficient with the increase of the normal load applied tothe couple can be observed. The variation of friction coefficient is nonlinear, in accordancewith equation (5). The wear rate also increases, from 0.1387·10-6 cm3/h to 1.8667·10-6
cm3/h, when the normal load increases from 10 N to 50 N.

26
Mechanical Testing and Diagnosis, ISSN 2247 – 9635, 2013 (III), Volume 3, 15-39
At this sliding speed, the dry friction coefficient on C120 steel grade has valuesranging from 0.27 to 0.37, for a contact temperature between 108 0C and 165 0C. In the caseof friction on C120 steel grade, dry friction coefficient values (Fig. 2) are between 0.25 and0.38, the contact temperature ranging between 78 0C and 155 0C. The polynomial variationof the friction coefficient is remarkable, as is the wear rate (both in volume and in depth) asa function of the load (contact pressure). An increase of the friction coefficient with theincrease of the normal load applied to the couple can be observed. The variation of frictioncoefficient is nonlinear, in accordance with equation (5). The wear rate also increases from0.1387·10-6 cm3/h to 1.8667·10-6 cm3/h, when the normal load increases from 10 N to 50 N.
For the same sliding speed and for friction on Rp3 steel grade, dry friction coefficientvalues (Fig. 3) were found to be between 0.25 and 0.38 while the contact temperaturesrange between 81 0C and 155 0C. Here, the authors can observe the same polynomialgrowth in the friction coefficient, the wear speed and the contact temperature as a functionof the normal load. However, the wear rate increases from 0.2136·10-6 cm3/h to 1.1247·10-6
cm3/h and from 2.3815·10-4 mm/h to 3.9708·10-4 mm/h, respectively, for increases in thenormal load from 10 N to 40 N. The increase in the wear rate is not as pronounced as forC120 steel grade, probably owing to greater hardness of Rp3 steel grade.
It can also be seen the corrosion wear (upper left), the plastic material transfercontaining glass fibers removed from the matrix (upper centre) and the adhesion marks onthe wear scar (upper right), in Fig. 3c.
(a) (b)
(c)Fig. 3. Wear evolution in scar wear volume (a) and depth (b) as a function of the normal load and the
contact temperature with a variation of the contact temperature (c) as a function of the normal load andthe friction coefficient at the sliding speed of 18.56 cm/s, for Nylonplast AVE Polyamide + 30% SGF /
Rp3 steel grade

27
Mechanical Testing and Diagnosis, ISSN 2247 – 9635, 2013 (III), Volume 3, 15-39
(a) (b)
(c)Fig. 4. Wear evolution of the scar wear volume (a) and depth (b) as a function of the normalload and the contact temperature and the variation in contact temperature (c) as a function ofthe normal load and the friction coefficient atthe sliding speed of 27.85 cm/s, for Nylonplast
AVE Polyamide + 30% SGF / C120 steel grade
Figure 4 shows the variation of wear, friction coefficient and contact temperature as afunction of the normal load, for Nylonplast AVE + 30% glass fibers / C120 steel couple, ata sliding speed of 27.85 cm/s.
Comparing the images in Figs 2, 3 and 4, they show different facets for the adhesiveand abrasive wear of metallic surfaces, at small loads (20 N), followed by a powerfulplastic transfer at 30 N - 40 N loads, with the formation of bridges at 30 N and even plasticflow at 40 N, in which case the metal surface temperature reaches 190 0C (Fig. 4). At thebeginning of the wear process, glass fibers are ripped from the polymer matrix, broken andexpelled on the output of the wear scar. At a sliding speed of 27.85 cm/s, the wear rateranges between 0.2352∙10-6 cm3/h to 1.3796∙10-6 cm3/h and 2.9149 ∙10-6 mm/h to 6.1374∙10-
6 mm/h, at loads between 10 N and 40 N.
28
Mechanical Testing and Diagnosis, ISSN 2247 – 9635, 2013 (III), Volume 3, 15-39
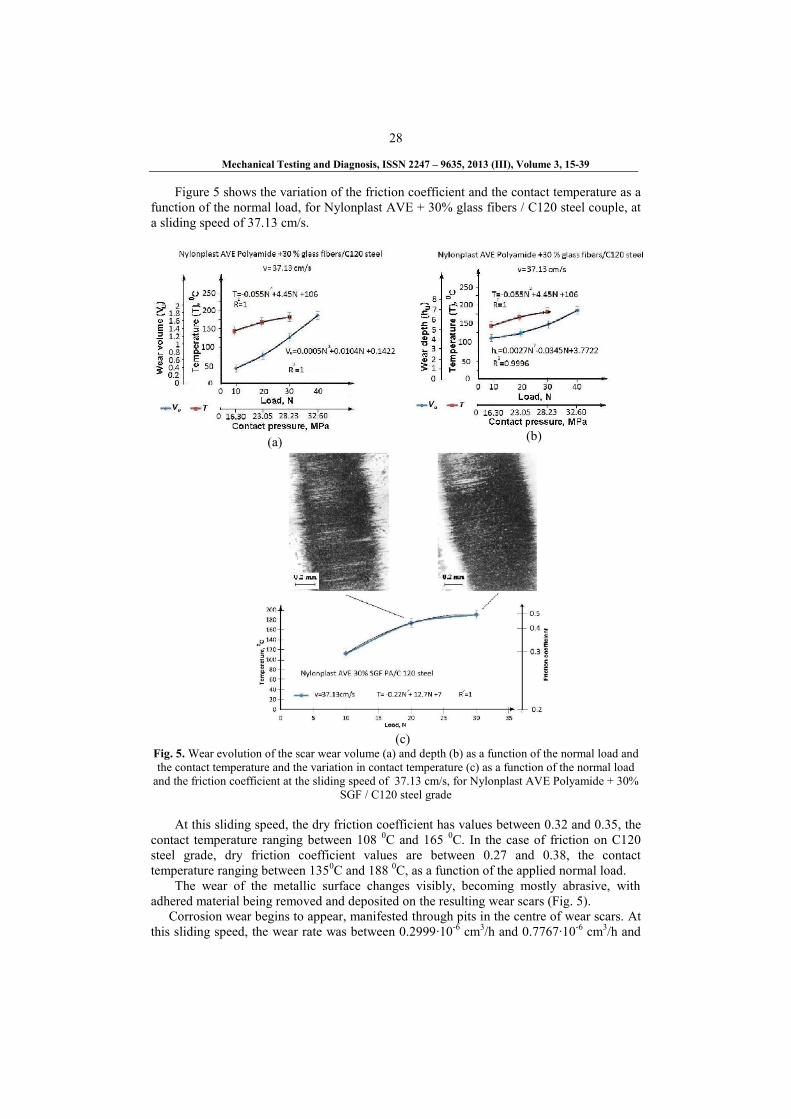
Figure 5 shows the variation of the friction coefficient and the contact temperature as afunction of the normal load, for Nylonplast AVE + 30% glass fibers / C120 steel couple, ata sliding speed of 37.13 cm/s.
(a) (b)
(c)Fig. 5. Wear evolution of the scar wear volume (a) and depth (b) as a function of the normal load andthe contact temperature and the variation in contact temperature (c) as a function of the normal load
and the friction coefficient at the sliding speed of 37.13 cm/s, for Nylonplast AVE Polyamide + 30%SGF / C120 steel grade
At this sliding speed, the dry friction coefficient has values between 0.32 and 0.35, thecontact temperature ranging between 108 0C and 165 0C. In the case of friction on C120steel grade, dry friction coefficient values are between 0.27 and 0.38, the contacttemperature ranging between 1350C and 188 0C, as a function of the applied normal load.
The wear of the metallic surface changes visibly, becoming mostly abrasive, withadhered material being removed and deposited on the resulting wear scars (Fig. 5).
Corrosion wear begins to appear, manifested through pits in the centre of wear scars. Atthis sliding speed, the wear rate was between 0.2999∙10-6 cm3/h and 0.7767∙10-6 cm3/h and
29
Mechanical Testing and Diagnosis, ISSN 2247 – 9635, 2013 (III), Volume 3, 15-39
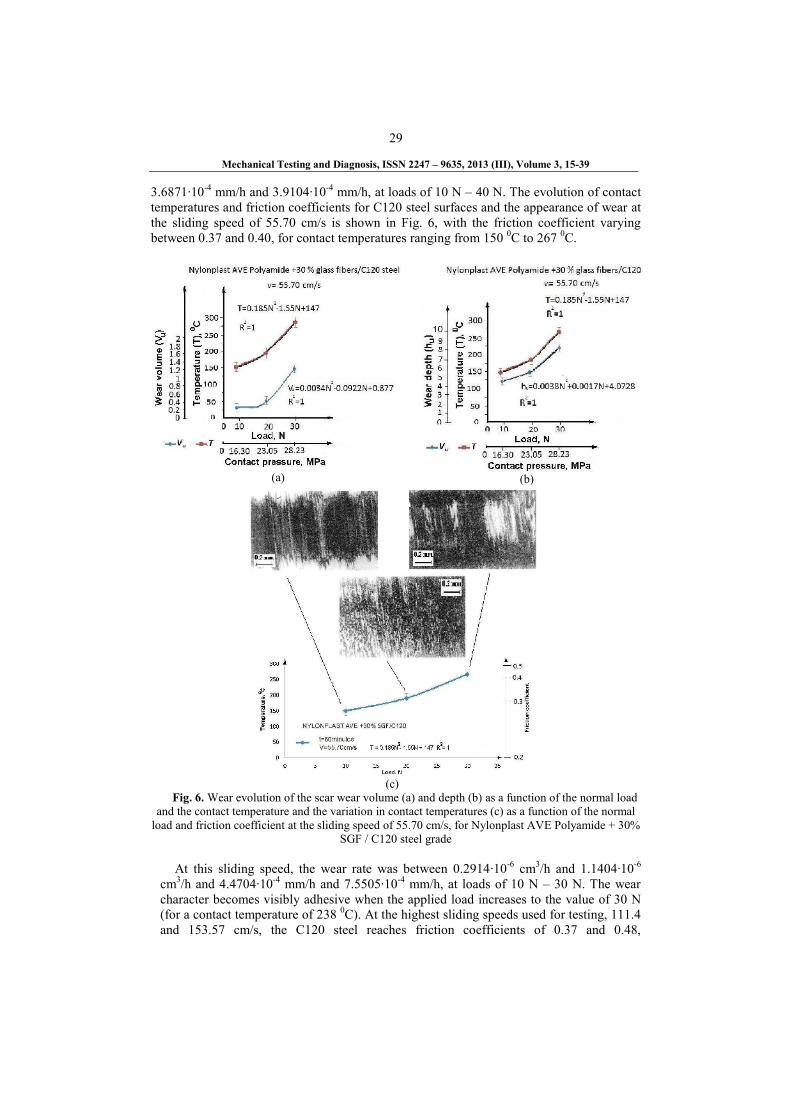
3.6871∙10-4 mm/h and 3.9104∙10-4 mm/h, at loads of 10 N – 40 N. The evolution of contacttemperatures and friction coefficients for C120 steel surfaces and the appearance of wear atthe sliding speed of 55.70 cm/s is shown in Fig. 6, with the friction coefficient varyingbetween 0.37 and 0.40, for contact temperatures ranging from 150 0C to 267 0C.
(a) (b)
(c)Fig. 6. Wear evolution of the scar wear volume (a) and depth (b) as a function of the normal load
and the contact temperature and the variation in contact temperatures (c) as a function of the normalload and friction coefficient at the sliding speed of 55.70 cm/s, for Nylonplast AVE Polyamide + 30%
SGF / C120 steel grade
At this sliding speed, the wear rate was between 0.2914∙10-6 cm3/h and 1.1404∙10-6
cm3/h and 4.4704∙10-4 mm/h and 7.5505∙10-4 mm/h, at loads of 10 N – 30 N. The wearcharacter becomes visibly adhesive when the applied load increases to the value of 30 N(for a contact temperature of 238 0C). At the highest sliding speeds used for testing, 111.4and 153.57 cm/s, the C120 steel reaches friction coefficients of 0.37 and 0.48,

30
Mechanical Testing and Diagnosis, ISSN 2247 – 9635, 2013 (III), Volume 3, 15-39
respectively, the measured contact temperatures ranging between 279 0C and 295 0C. Thistranslates in the wear manifesting itself mainly by adhesion and corrosion (Figs 7 and 8).
The wear character becomes visibly adhesive when the applied load increases to thevalue of 20 N (contact temperature 238 0C, at 111.4 cm/s). At this sliding speed the wearrate ranged between 4.9482∙10-4 mm/h and 8.0003∙10-4 mm/h, or 0.2830 and 1.1732 cm3/h,respectively, for loads of 10 N -30 N.
(a) (b)
(c)Fig. 7. Wear evolution of the scar wear volume (a) and depth (b) as a function of the normal load
and contact temperature and the variation in contact temperature (c) as a function of the normal loadand friction coefficient at the sliding speed of 111.4 cm/s, for Nylonplast AVE Polyamide + 30%
SGF / C120 steel
At the highest sliding speed used for testing, 153.57 cm/s, C120 steel frictioncoefficient values between 0.37 and 0.48 are reached, with the measured contacttemperatures ranging between 279 0C and 295 0C. Again, the wear is characterised mainlyby adhesion and corrosion (Fig. 8).
At loads of 40 N, the tests are inconclusive because the surface of polymeric samplemoves into a vitrification (glassy) state due to very high temperatures, covering the metalwith a glassy layer. At this sliding speed, the wear rate decreased to values between5.1760∙10-6 cm3/h to 9.0170∙10-6 cm3/h, and between 0.3101∙10-4 mm/h and 1.2435∙10-4
mm/h, at loads of 10 – 30 N.For the friction of polymers reinforced with 30% glass fibers on Rp3 steel surfaces
(that are harder than C120 steel surfaces, having – 62 HRC), the authors obtained the same
31
Mechanical Testing and Diagnosis, ISSN 2247 – 9635, 2013 (III), Volume 3, 15-39
results on the wear evolution as a function of the normal load and the sliding speed as in thecase of C120 steel grade.
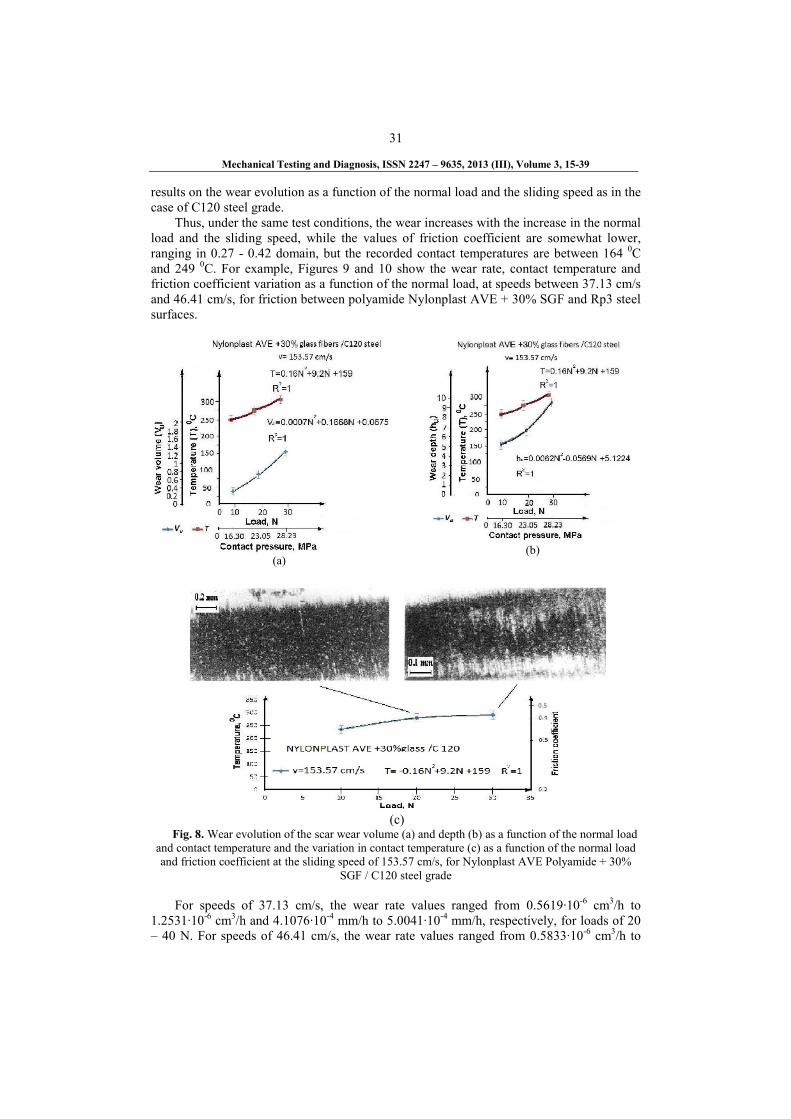
Thus, under the same test conditions, the wear increases with the increase in the normalload and the sliding speed, while the values of friction coefficient are somewhat lower,ranging in 0.27 - 0.42 domain, but the recorded contact temperatures are between 164 0Cand 249 0C. For example, Figures 9 and 10 show the wear rate, contact temperature andfriction coefficient variation as a function of the normal load, at speeds between 37.13 cm/sand 46.41 cm/s, for friction between polyamide Nylonplast AVE + 30% SGF and Rp3 steelsurfaces.
(a)(b)
(c)Fig. 8. Wear evolution of the scar wear volume (a) and depth (b) as a function of the normal load
and contact temperature and the variation in contact temperature (c) as a function of the normal loadand friction coefficient at the sliding speed of 153.57 cm/s, for Nylonplast AVE Polyamide + 30%
SGF / C120 steel grade
For speeds of 37.13 cm/s, the wear rate values ranged from 0.5619∙10-6 cm3/h to1.2531∙10-6 cm3/h and 4.1076∙10-4 mm/h to 5.0041∙10-4 mm/h, respectively, for loads of 20– 40 N. For speeds of 46.41 cm/s, the wear rate values ranged from 0.5833∙10-6 cm3/h to
32
Mechanical Testing and Diagnosis, ISSN 2247 – 9635, 2013 (III), Volume 3, 15-39
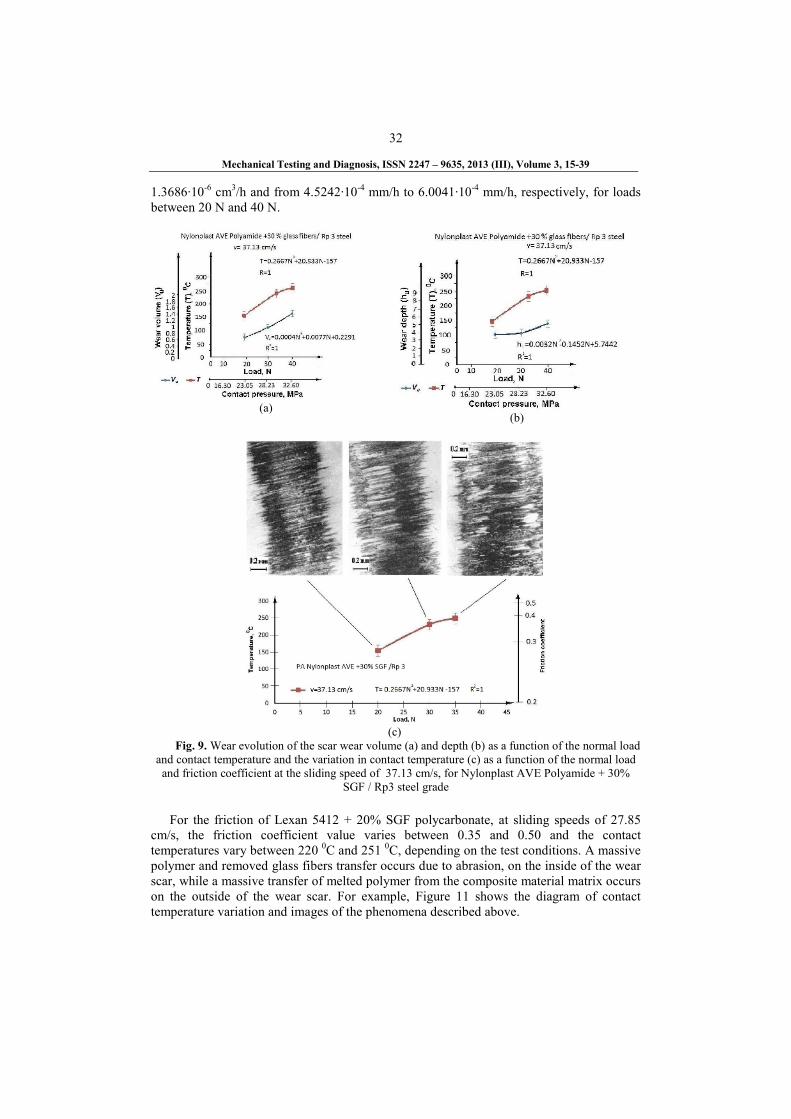
1.3686∙10-6 cm3/h and from 4.5242∙10-4 mm/h to 6.0041∙10-4 mm/h, respectively, for loadsbetween 20 N and 40 N.
(a)(b)
(c)Fig. 9. Wear evolution of the scar wear volume (a) and depth (b) as a function of the normal load
and contact temperature and the variation in contact temperature (c) as a function of the normal loadand friction coefficient at the sliding speed of 37.13 cm/s, for Nylonplast AVE Polyamide + 30%
SGF / Rp3 steel grade
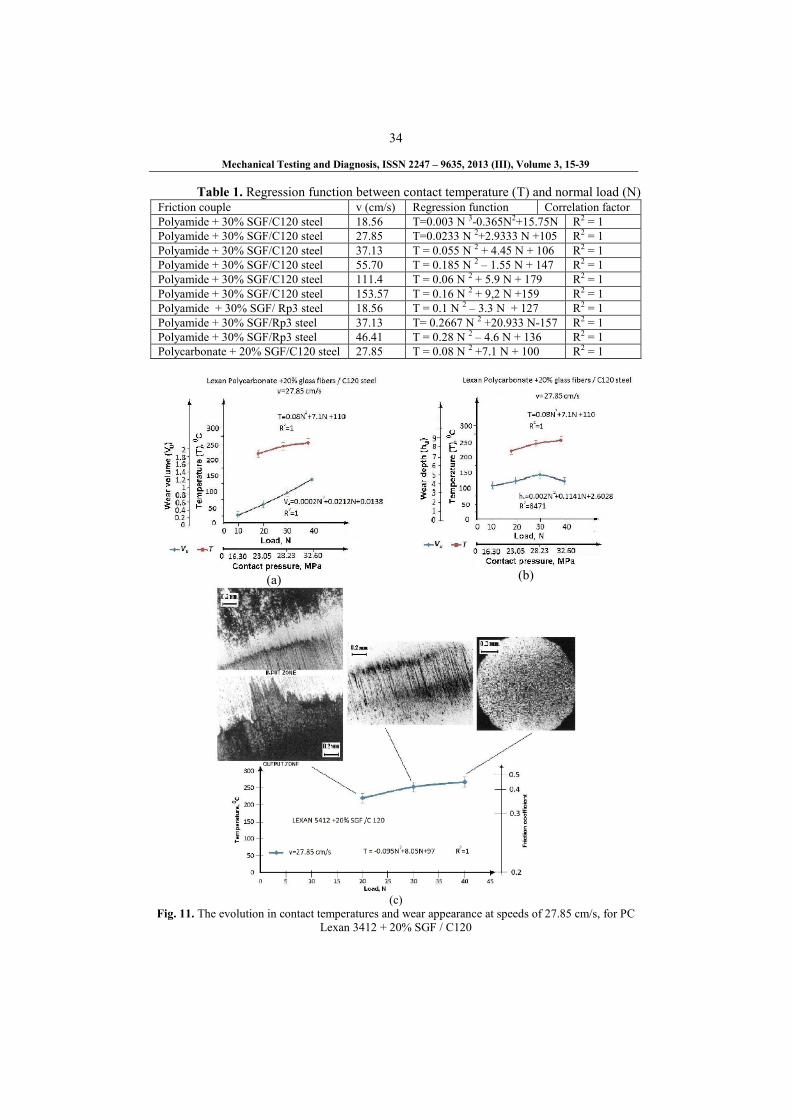
For the friction of Lexan 5412 + 20% SGF polycarbonate, at sliding speeds of 27.85cm/s, the friction coefficient value varies between 0.35 and 0.50 and the contacttemperatures vary between 220 0C and 251 0C, depending on the test conditions. A massivepolymer and removed glass fibers transfer occurs due to abrasion, on the inside of the wearscar, while a massive transfer of melted polymer from the composite material matrix occurson the outside of the wear scar. For example, Figure 11 shows the diagram of contacttemperature variation and images of the phenomena described above.

33
Mechanical Testing and Diagnosis, ISSN 2247 – 9635, 2013 (III), Volume 3, 15-39
(a) (b)
(c)Fig. 10. Wear evolution of the scar wear volume (a) and depth (b), as a function of the normal
load and contact temperature and the variation in contact temperature (c) as a function of the normalload and friction coefficient at the sliding speed of 46.41 cm/s, for Nylonplast AVE Polyamide + 30%
SGF / Rp3 steel grade
At this sliding speed, the wear rate ranges between 0.2440∙10-6 cm3/h and 1.1594∙10-6
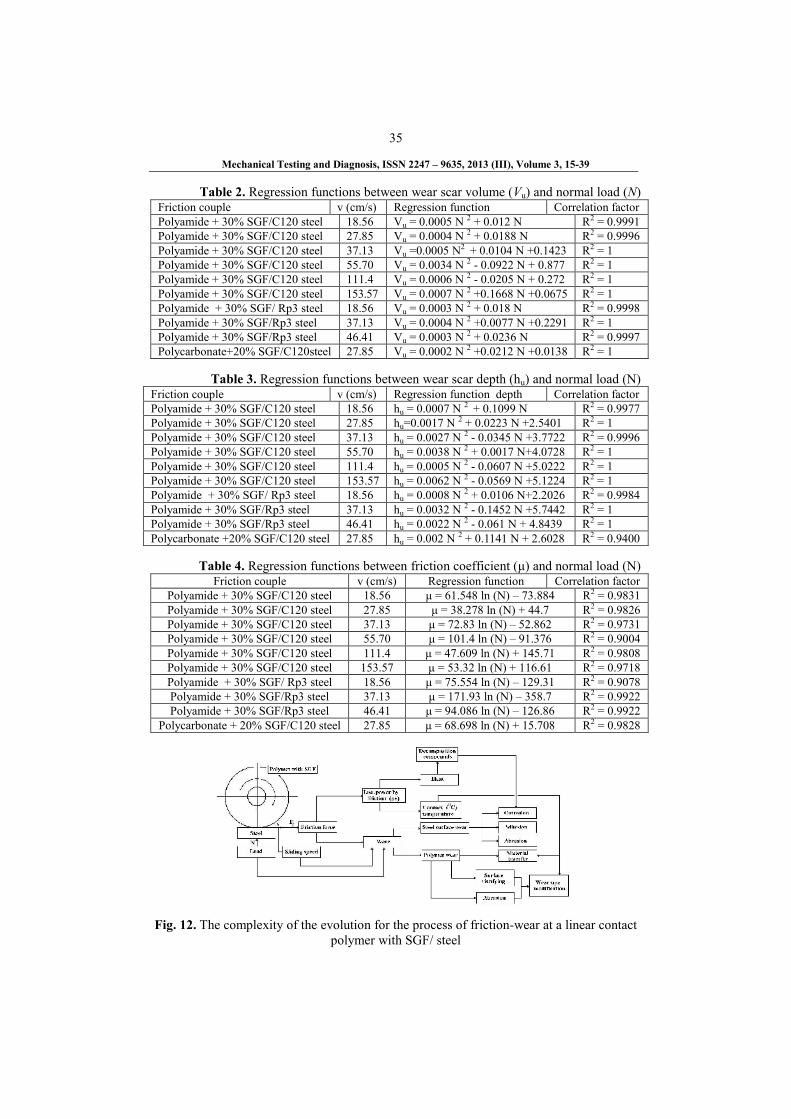
cm3/h, or 3.5917∙10-4 mm/h to 4.9169∙10-4 mm/h, respectively, for loads between 10 N to40 N. Tables 1, 2, 3 and 4 synthesize the correlation between volume (Vu) and depth (hu) ofthe wear scar, functions between the contact temperature (T), the friction coefficient (μ) andthe normal load (N). There is a notable polynomial variation of these parameters as afunction of the normal load.
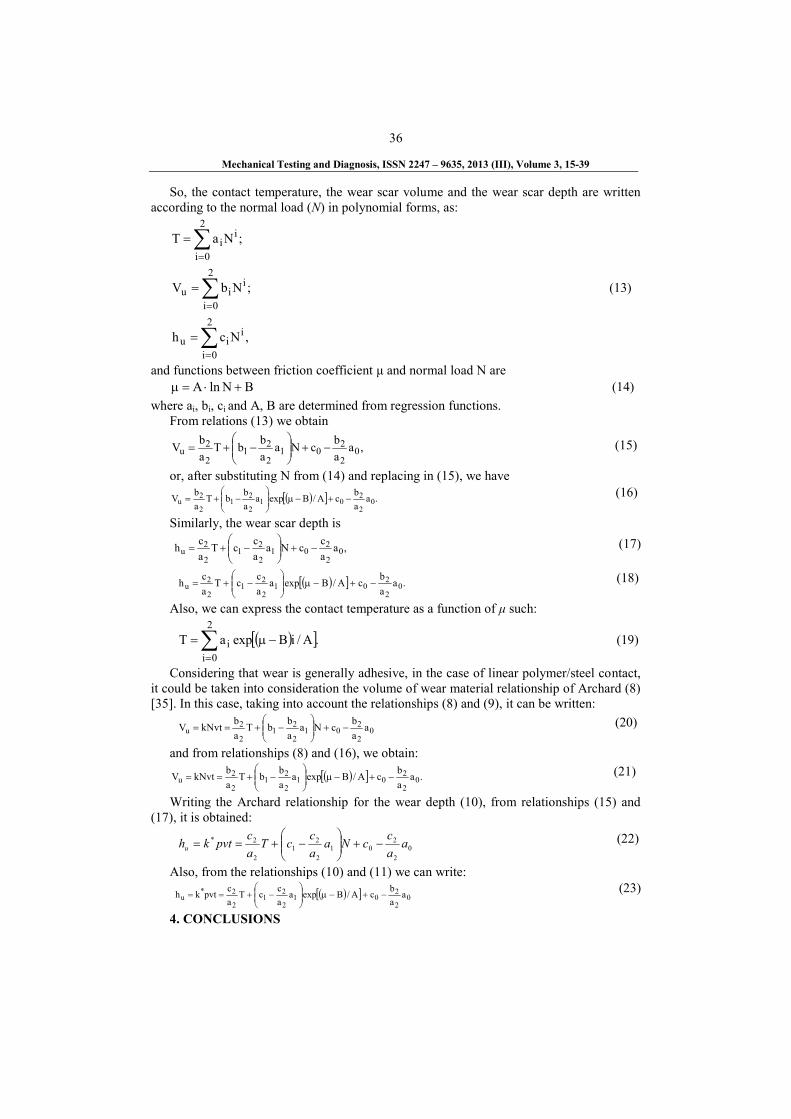
The complexity of the processes of friction and wear in the case of dry friction contactplastics with SGF on steel surfaces, which the authors tried to present in quantitative andqualitative terms, as well as clear as possible, can be synthesized through a suggestiveschematic representation of the process, with input, output factors (consequences) and theirinfluence on the evolution of the entire tribological process (Fig. 12).
The authors give some correlation functions between wear scar volume (Vu) or wearscar depth (hu) and the normal load (N), friction coefficient (μ), contact temperature (T).
34
Mechanical Testing and Diagnosis, ISSN 2247 – 9635, 2013 (III), Volume 3, 15-39
Table 1. Regression function between contact temperature (T) and normal load (N)Friction couple v (cm/s) Regression function Correlation factorPolyamide + 30% SGF/C120 steel 18.56 T=0.003 N 3-0.365N2+15.75N R2 = 1Polyamide + 30% SGF/C120 steel 27.85 T=0.0233 N 2+2.9333 N +105 R2 = 1Polyamide + 30% SGF/C120 steel 37.13 T = 0.055 N 2 + 4.45 N + 106 R2 = 1Polyamide + 30% SGF/C120 steel 55.70 T = 0.185 N 2 – 1.55 N + 147 R2 = 1Polyamide + 30% SGF/C120 steel 111.4 T = 0.06 N 2 + 5.9 N + 179 R2 = 1Polyamide + 30% SGF/C120 steel 153.57 T = 0.16 N 2 + 9,2 N +159 R2 = 1Polyamide + 30% SGF/ Rp3 steel 18.56 T = 0.1 N 2 – 3.3 N + 127 R2 = 1Polyamide + 30% SGF/Rp3 steel 37.13 T= 0.2667 N 2 +20.933 N-157 R2 = 1Polyamide + 30% SGF/Rp3 steel 46.41 T = 0.28 N 2 – 4.6 N + 136 R2 = 1Polycarbonate + 20% SGF/C120 steel 27.85 T = 0.08 N 2 +7.1 N + 100 R2 = 1
(a) (b)
(c)Fig. 11. The evolution in contact temperatures and wear appearance at speeds of 27.85 cm/s, for PC
Lexan 3412 + 20% SGF / C120
35
Mechanical Testing and Diagnosis, ISSN 2247 – 9635, 2013 (III), Volume 3, 15-39
Table 2. Regression functions between wear scar volume (Vu) and normal load (N)Friction couple v (cm/s) Regression function Correlation factorPolyamide + 30% SGF/C120 steel 18.56 Vu = 0.0005 N 2 + 0.012 N R2 = 0.9991Polyamide + 30% SGF/C120 steel 27.85 Vu = 0.0004 N 2 + 0.0188 N R2 = 0.9996Polyamide + 30% SGF/C120 steel 37.13 Vu =0.0005 N2 + 0.0104 N +0.1423 R2 = 1Polyamide + 30% SGF/C120 steel 55.70 Vu = 0.0034 N 2 - 0.0922 N + 0.877 R2 = 1Polyamide + 30% SGF/C120 steel 111.4 Vu = 0.0006 N 2 - 0.0205 N + 0.272 R2 = 1Polyamide + 30% SGF/C120 steel 153.57 Vu = 0.0007 N 2 +0.1668 N +0.0675 R2 = 1Polyamide + 30% SGF/ Rp3 steel 18.56 Vu = 0.0003 N 2 + 0.018 N R2 = 0.9998Polyamide + 30% SGF/Rp3 steel 37.13 Vu = 0.0004 N 2 +0.0077 N +0.2291 R2 = 1Polyamide + 30% SGF/Rp3 steel 46.41 Vu = 0.0003 N 2 + 0.0236 N R2 = 0.9997Polycarbonate+20% SGF/C120steel 27.85 Vu = 0.0002 N 2 +0.0212 N +0.0138 R2 = 1
Table 3. Regression functions between wear scar depth (hu) and normal load (N)Friction couple v (cm/s) Regression function depth Correlation factorPolyamide + 30% SGF/C120 steel 18.56 hu = 0.0007 N 2 + 0.1099 N R2 = 0.9977Polyamide + 30% SGF/C120 steel 27.85 hu=0.0017 N 2 + 0.0223 N +2.5401 R2 = 1Polyamide + 30% SGF/C120 steel 37.13 hu = 0.0027 N 2 - 0.0345 N +3.7722 R2 = 0.9996Polyamide + 30% SGF/C120 steel 55.70 hu = 0.0038 N 2 + 0.0017 N+4.0728 R2 = 1Polyamide + 30% SGF/C120 steel 111.4 hu = 0.0005 N 2 - 0.0607 N +5.0222 R2 = 1Polyamide + 30% SGF/C120 steel 153.57 hu = 0.0062 N 2 - 0.0569 N +5.1224 R2 = 1Polyamide + 30% SGF/ Rp3 steel 18.56 hu = 0.0008 N 2 + 0.0106 N+2.2026 R2 = 0.9984Polyamide + 30% SGF/Rp3 steel 37.13 hu = 0.0032 N 2 - 0.1452 N +5.7442 R2 = 1Polyamide + 30% SGF/Rp3 steel 46.41 hu = 0.0022 N 2 - 0.061 N + 4.8439 R2 = 1Polycarbonate +20% SGF/C120 steel 27.85 hu = 0.002 N 2 + 0.1141 N + 2.6028 R2 = 0.9400
Table 4. Regression functions between friction coefficient (μ) and normal load (N)Friction couple v (cm/s) Regression function Correlation factor
Polyamide + 30% SGF/C120 steel 18.56 μ = 61.548 ln (N) – 73.884 R2 = 0.9831Polyamide + 30% SGF/C120 steel 27.85 μ = 38.278 ln (N) + 44.7 R2 = 0.9826Polyamide + 30% SGF/C120 steel 37.13 μ = 72.83 ln (N) – 52.862 R2 = 0.9731Polyamide + 30% SGF/C120 steel 55.70 μ = 101.4 ln (N) – 91.376 R2 = 0.9004Polyamide + 30% SGF/C120 steel 111.4 μ = 47.609 ln (N) + 145.71 R2 = 0.9808Polyamide + 30% SGF/C120 steel 153.57 μ = 53.32 ln (N) + 116.61 R2 = 0.9718Polyamide + 30% SGF/ Rp3 steel 18.56 μ = 75.554 ln (N) – 129.31 R2 = 0.9078Polyamide + 30% SGF/Rp3 steel 37.13 μ = 171.93 ln (N) – 358.7 R2 = 0.9922Polyamide + 30% SGF/Rp3 steel 46.41 μ = 94.086 ln (N) – 126.86 R2 = 0.9922
Polycarbonate + 20% SGF/C120 steel 27.85 μ = 68.698 ln (N) + 15.708 R2 = 0.9828
Fig. 12. The complexity of the evolution for the process of friction-wear at a linear contactpolymer with SGF/ steel
36
Mechanical Testing and Diagnosis, ISSN 2247 – 9635, 2013 (III), Volume 3, 15-39
So, the contact temperature, the wear scar volume and the wear scar depth are writtenaccording to the normal load (N) in polynomial forms, as:
2
0i
ii ;NaT
2
0i
iiu ;NbV (13)
2
0i
iiu ,Nch
and functions between friction coefficient μ and normal load N areBNlnA (14)
where ai, bi, ci and A, B are determined from regression functions.From relations (13) we obtain
,aabcNa
abbT
abV 0
2
201
2
21
2
2u
(15)
or, after substituting N from (14) and replacing in (15), we have .a
abcA/Bexpa
abbT
abV 0
2
201
2
21
2
2u
(16)
Similarly, the wear scar depth is
,aaccNa
accT
ach 0
2
201
2
21
2
2u
(17)
.aabcA/Bexpa
accT
ach 0
2
201
2
21
2
2u
(18)
Also, we can express the contact temperature as a function of μ such:
.A/iBexpaT2
0ii
(19)
Considering that wear is generally adhesive, in the case of linear polymer/steel contact,it could be taken into consideration the volume of wear material relationship of Archard (8)[35]. In this case, taking into account the relationships (8) and (9), it can be written:
02
201
2
21
2
2u a
abcNa
abbT
abkNvtV
(20)
and from relationships (8) and (16), we obtain:
.aabcA/Bexpa
abbT
abkNvtV 0
2
201
2
21
2
2u
(21)
Writing the Archard relationship for the wear depth (10), from relationships (15) and(17), it is obtained:
02
201
2
21
2
2* aaccNa
accT
acpvtkhu
(22)
Also, from the relationships (10) and (11) we can write: 0
2
201
2
21
2
2*u a
abcA/Bexpa
accT
acpvtkh
(23)
4. CONCLUSIONS

37
Mechanical Testing and Diagnosis, ISSN 2247 – 9635, 2013 (III), Volume 3, 15-39
From all of the above, the authors can draw several conclusions:- the wear process of metallic surfaces in dry friction contact against plastic materials
reinforced with short glass fibers evolves over time and depends on the load, moving fromthe initial abrasive wear, caused by glass fibers, to adhesion wear characterized especiallyby the transfer of plastic material on the metallic surface, but also by corrosion;
- the friction coefficient has values in a wide range, comprised between 0.2 and 0.5;- the contact temperatures increase as a function of the applied load and the sliding
speed, reaching values of 295 0C, resulting in the flow of plastic material, exceeding thetransition temperature to the glassy state and even reaching the flow state of the latter;
- the values of friction coefficient for the reinforced plastic materials on the surfaces ofthe C120 steel samples are higher than those obtained on the surfaces of Rp3 steel samples.The explanation for this phenomenon lies in the difference in hardness of the two steelsample surfaces. This behavior confirms equations (6) and (7). Equation (7) is consistentwith the results shown in Figures 4, 10 and 11;
- the values of friction coefficient for thermoplastic materials reinforced with glassfibers on the C120 steel pass through a minimum located in the normal loads domain of 20N - 30 N. In the case of the same materials friction on the Rp3 steel surfaces, the increase ofthe friction coefficient with the normal load is quasi-linear. The explanation for thisphenomenon is that, under the action of the stress states, the C120 steel grade undergoessuperficial cold hardening, manifested by an increase in its hardness in the friction area.Hardening occurs at contact pressures between 1.75 MPa and 2.0 MPa, corresponding forthe linear contact couples used for a load of 20 N. At higher loads and respective greaterefforts, the hardened layer is destroyed and, in turn, it entails an increase of the frictioncoefficient as a function of the decreasing in hardness;
- although any mathematical relation cannot be established among the frictioncoefficient, the contact temperatures and the metallic surface wear, the authors believe thatthe manner in which they graphically presented the wear state of the metallic surface as afunction of the contact temperature (friction coefficient) allows for significant conclusionsto be drawn in the plastic material on studied steel contacts.
However, this research has some limitations. At high contact temperatures it is likelythat the elastic contact assumption, under which the modelling was made, is invalid. Also,the contact temperatures were measured at 1 mm below the metallic contact surface, so,obviously, the real temperature was even higher. The evaluation of the friction coefficientwas done over time as an average of the friction coefficient during the test and not as thefriction coefficient value at a fixed point in time.
The wear rate of the steel sample increases with an increase in the normal load and,respectively, with an increase in the contact pressure. The increase is not linear, each of thestudied couples exhibiting particular behaviors. The only common change was an increasein the wear rate of the metal element with the increase in the sliding speed.
Comparing the values of the wear rates of the metal element at the sliding speeds of46.41 cm/s and normal loads of 40 N allowed to conclude that, in the case of the polyamidereinforced with 30% glass, the C120 steel grade wears off approximately 1,110 times morethan the Rp3 steel grade. The authors believe that this phenomenon is due to the higherhardness of samples made of Rp3 (62 HRC), in comparison to those made of C120 steelgrade (59 HRC). The fact that the polycarbonate reinforced with 20% glass wears off theC120 steel grade 1.48 times less than the polyamide with 30% glass, demonstrates that notonly the reinforcement content, but also the physical-mechanical characteristics of the basicpolymer influence the wear rate of the metal element of the friction couple.
38
Mechanical Testing and Diagnosis, ISSN 2247 – 9635, 2013 (III), Volume 3, 15-39
In the case of plastic material couples + 20% glass/steel, tests indicated that the wear ofthe material gennerally manifests an abrasive character. This stage is of short duration, afterwhich, due to the increase of temperature in the contact area, the wear acquires apronounced adhesive character, characterized through the transfer of plastic material ontothe metal surface. The higher the load and the speed, the more intense is the transfer. Theplastic material transferred onto the metal surface reduces the influence of abrasive wear,due to the obstruction in the direct contact of the glass fibers with the metal, the former notbeing able to completely remove the bridges created though transfer. The observationsmentioned above are confirmed by the microphotography of the wear imprints obtainedduring the experimental tests presented in this study.
In the case of plastic materials with a higher content of glass fibers (30%), the abrasiveeffect due to the reinforcement increases, leading to the removal of transferred material andan accentuated increase in the wear rate of the metal, as compared to the one compliantwith the quantitative law of adhesive wear.
The increase of the duration of tests also indicated an increase in wear. However, thisincrease is not proportional to the test duration. Experiments lasting 120 minutes indicatedthat the wear of the metal element during the first 60 minutes is higher than the wearproduced during the rest of the test. The authors estimate that this phenomenon may beexplained through the existence of a stage in the initial period of the friction couplefunctioning, when a geometric conformation takes place for the surfaces of the twoelements that are in contact.
All of the above mentioned observations are confirmed by the microphotography of thewear imprints obtained during the experimental tests presented in this study.
REFERENCES
1. Bowden, F., P., Tabor, D., 1967, Friction and Lubrication, Metheuen & Co. Ltd. London.2. Jacobi, H., R., 1957, Neue Erkenntnisse über Gleitenschaften von Polyamiden, Kunststoffe, 47 (5):234-239.3. Bilik, M., 1965, Parî trenia metal-plastmassa v maşinah i mechanizmah, Izd. Maşinostroienie,Moskva.4. Clerico, M., 1969, A Study of the Friction Wear of Nylon against Metal, Wear, 13(3), pp. 183-197.5. Hrusciov, M., M., 1957, Resistance of Metals to Wear by Abrasion, as related to Hardness, Proc.Conference on Lubrication and Wear, Inst. Mech. Eng., London, pp. 979-986.6. Hrusciov, M., M., Babicev, M., A., 1982, Resistance to Abrasive Wear of structurallyInhomogeneous Materials, Friction and Wear in Machinery, part 2, ASME, New York, 1958, pp. 5-23.7. Bely, V.A., Sviridenok, A., I. et al., 1982, Friction and Wear in Polymer based Materials, PergamonPress.8. Bartenev, G., M., Lavrentiev, V., V., 1972, Trenie i iznos polimerov”, Izd. Himia, Leningrad.9. Watanabe, M., Korusawa, M., Marsubara, K., 1968, The Frictional Properties of Nylon, Wear 32(3). pp 185-191.10. Lancaster J.K., 1972, Lubrication of Carbon Fibre reinforced Polymers, Wear 28(3). pp. 315-352.11. Barlow D.A., 1972, Some Observations of the Friction Properties of Vinyl, Wear 20(2), pp.151-157.12. West G.H., Senior J.M., 1973, Frictional Properties of Polyethylene”, Wear 19(1): pp. 37-52.13. Bartenev, G., M., Lavrentiev, V., V., Konstantinova, N., A., 1971, The actual Area and frictionProperties of Elastomers under Frictional Contact with Solid Surfaces, Wear 18(6): pp. 439-448.14. Bowden, F., P., Tabor, D., 1964, The Friction and Lubrication of Solids, part I-II, Clarendon Press,Oxford.15. Jost, H., 1970, Zum Verschleissverhalten von Polyamid, Plaste und Kautschuk 17(4), pp. 266-270.16. Lancaster, J., K., Evans, D., C., 1979, Wear of Polymers in Treatise on Mat. Sci. And Technology”.Academic Press, pp. 13-86.
39
Mechanical Testing and Diagnosis, ISSN 2247 – 9635, 2013 (III), Volume 3, 15-39
17. Shen, C., Dumbleton, J., H., 1978, The Friction and Wear Behavior of Polyoximethylene inConvection with Joint Replacement, Wear 38(2), pp. 291-303.18. Myshkin, N., K., Petrokovets, M., I., Kovale, A., V., 2005, Tribology of polymers: Adhesion,friction, wear, and mass-transfer”, Tribology International 38, pp. 910-921.19. Briscoe, B., J., 1986, Friction and Wear of Polymer Composites, Elsevier, Amsterdam, p. 25.20. Johnson, K., L., Kendall, K., Roberts, A.,D., 1971, Surface energy and the contact of elastic solids,Proc. Roy. Soc. A 324, p. 301.21. Johnson, K., L., 1987, Contacts Mechanics”, Cambridge Uni versity Press, Cambridge, p. 468.22. Deryagin, B., V., Muller, V., M., Toporov, Yu., P., 1975, Adhesive contact deformation of a singlemicroelastic sphere, J. Colloid Interface Sci. 53, pp. 314.23. Jonson, K., L., Greenwood, J., A., 1997, An adhesion map for the contact of elastic spheres, J.Colloid Interf. Sci. 192, p. 326.24. Chang, L., Friedrich K., 2010, Enhancement effect of nanoparticles on the sliding wear of thesliding wear of short fiber-reinforced polymer composites: A critical discussion of wear mechanisms,Tribology International 43, pp. 2355-2364.[25] Hager, A., M., Davies, M., 1993, Advances in Composites Tribology: Short-fiber reinforced, high-temperatur eresistant polymers for a wide field of tribological applicants, Elsevier Science Publishers,BV, pp. 104-157.[26] Voss, H., Friedrich, K., 1987, On the wear behavior ofshort-fiber-reinforced PEEK composites,Wear 116, pp. 1-18.[27] Tewari, U., S., Bijwe, J., 1993, Advances in Composites Tribology, Recent development intribology of fiber reinforced composites with thermoplastic and thermosetting matrices, Elsevier SciencePublishers, BV, pp. 159-207.[28] Chang, L., Zhang, Z., 2006, Tribological properties of epoxy-nanocomposites: 2. A combinativeeffect of short car -bon fiber and nano-TiO2, Wear 206, pp. 869-878.[29] Chang, L., Zhang, Z., Zhang, H. Schlarb, A., K., 2006, On the Sliding wear of nanoparticlesfilled polyamide 66, Composites Science and Technology 66, pp. 3188-3198.[30] Kukureka, S., N., Hooke, C., J., Rao, M., Liao, P., Chen, Y., K., 1999, The effect of fibrereinforcement on the friction and wear of polyamide 66 under dry rolling-sliding contact. TribologyInternational 32, pp. 107-116.[31] Wang, J., Bai, Songhao, M., G., Shirong, G., 2003, Investigation of the influence of MoS2 filleron the tribological properties of carbon fiber reinforced nylon 1010 composites. Wear 255, pp. 774-779.[32] Bahadur, S., The development of transfer layers and their role in polymer tribology. Wear 245(2000) 92-99.[33] Guo, Q., B., Rong, M., Z., Jia, G., L., Lau, K., T., Zang, M., Q., 2009, Sliding wear performanceof nano SiO2 / short carbon fibre / epoxy hybrid composites. Wear, 266, pp. 658-665.[34] Schwartz, C., J., Bahadur, S., 2003, The role of deformability, filler-polymer bonding andcounterface material on the tribological behaviour of polyphenyl sulfide (PPS). Wear, 251, pp. 1532-1540.[35] Zhong, C. Li, Z., Lin, Y., Frederich K., 2007, Tribological properties of epoxy nanocomposites:III. Characteristics of transfer films, Wear 262, pp. 799-706.[36] Davyer-Joice, R., S., Ioannides Sayles E., 1994, An investigation into the mechanisms of closedthree-body abrasive wear. Wear 175, pp. 133-142.[37] Stachowiak, G., B., Stachowiak G.,W., 2001, The effects of particle characteristics on three-bodyabrasive wear, Wear 249, pp. 201-207.[38] Capitanu, L., Iarovici, A., Onisoru, J., 2003, On polyamide and polycarbonate materialsbehaviour under dry friction, The Annals of University “Dunarea de Jos” Galati, fascicle VIII,Tribology.[39] Capitanu, L., Florescu, V., 2013, Tribological aspects of wear of polished steel surfaces in dryfriction contact on polymer composites with glass fibres, American Jounal of Materials Science 3(1), pp.8-18. DOI 10.5923/j.materials.20130301.02.[40] Viers, D., Brendt, 1999, Polymer Data Handbook. Oxford University Press, Inc. p. 189. ISBN978-0195107890[41] *** Material Selection Guide, 1.888.CURBELL, www.curbellplastics.com[42] *** Lexan, Polycarbonate Resin, General Electric Data Sheet, www.vistatek.com