the quality system pamela youde nethersole eastern ... 3_basic... · pamela youde nethersole...
TRANSCRIPT

Basic QC Concepts
Lo Yun Chuen, SO (M)Chemical Pathology Laboratory
Pamela Youde Nethersole Eastern Hospital10 September 2014
Purchasing & Inventory
AssessmentOccurrence Management
Information Management
Process Improvement
Customer Service
Facilities & Safety
The Quality SystemOrganization Personnel Equipment
Documents & Records
Process Control
(QC & EQA) & Specimen
Management
Module 1: Core Laboratory / Rapid Response Laboratory - Automation / Instrumentation
Module 2: General equipmentModule 3: Quality control: Basic
concept, IQC, EQAP, case studyModule 4: Quality Management in
Laboratory Operation
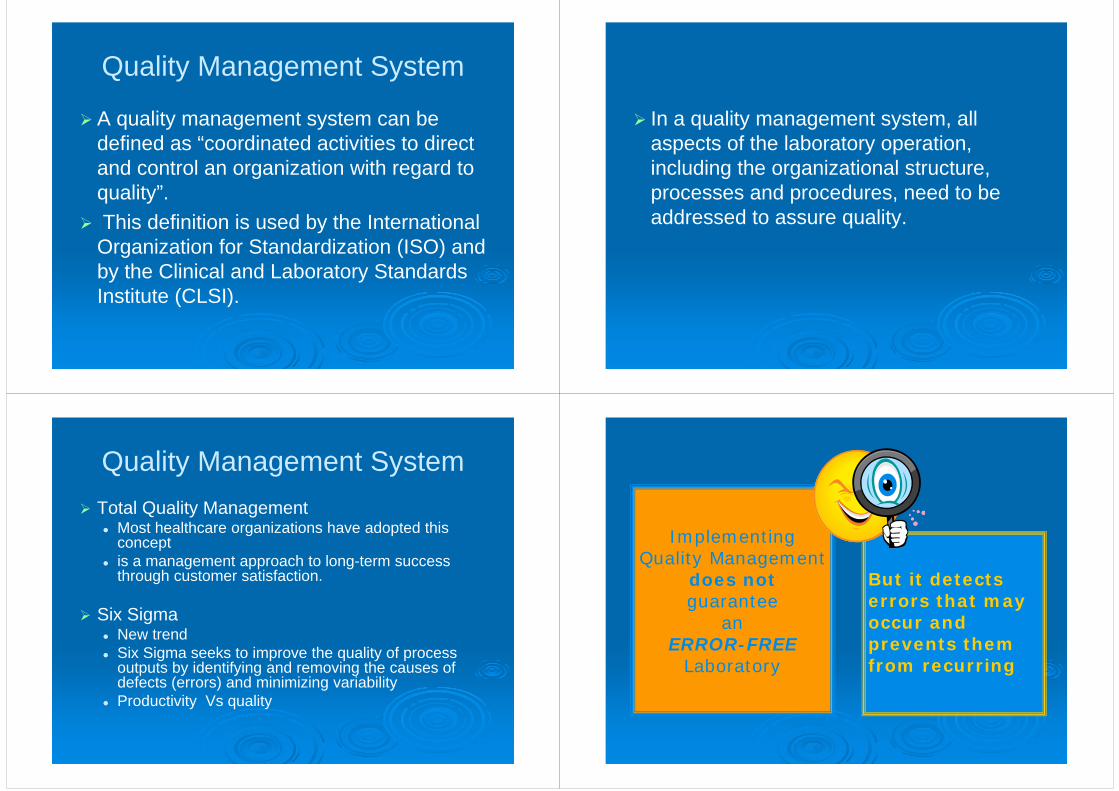
Quality Management System
A quality management system can be defined as “coordinated activities to direct and control an organization with regard to quality”.
This definition is used by the International Organization for Standardization (ISO) and by the Clinical and Laboratory Standards Institute (CLSI).
In a quality management system, all aspects of the laboratory operation, including the organizational structure, processes and procedures, need to be addressed to assure quality.
Quality Management System Total Quality Management
Most healthcare organizations have adopted this concept
is a management approach to long-term success through customer satisfaction.
Six Sigma New trend Six Sigma seeks to improve the quality of process
outputs by identifying and removing the causes of defects (errors) and minimizing variability
Productivity Vs quality
ImplementingQuality Management
does notguarantee
anERROR-FREE
Laboratory
But it detects errors that may occur and prevents them from recurring

Organization
Personnel Equipment
Purchasing &
Inventory
Process Control
Information Management
Documents&
Records
Occurrence Manageme
ntAssessmen
t
Process Improvement
Customer Service
Facilities &
Safety
Laboratories notimplementing aquality managementsystem guaranteesUNDETECTED ERRORS
Total Quality Management (TQM)
Definition:Management philosophy and approach
Focus on processes and their improvements in order to satisfy customer need
TQM
Components:1. Quality Laboratory Process (QLP)2. Quality Control (QC)3. Quality Assurance (QA)4. Quality Improvement (QI)5. Quality Planning (QP)

TQM
QLP:Refer to analytical processes, general
policies, practices and procedure that define how all aspects of the work are done
TQMQC: Emphasize statistical control procedures and
non-statistical check procedures
Non-statistical checks including linearity checks, reagent and calibrator checks and temperature monitors
To assess the validity of results and control release of results in real time within the laboratory
TQMQA: Primarily measures performance characteristics
that beyond the borders of laboratory to areas of direct and immediate concern of our customers
Include turnaround time, specimen identification, patient identification and test utility
Determine the quality of the results generated by laboratory
A overall management plan to guarantee the integrity of system
Quality System
Quality Assurance
Quality Control

TQM
QI: Problems identified Re-plan the process to prevent the problem from
recurringQP: QP provides the focus on customers and
emphasizes the importance of understanding their needs and expectations,
Lead to the definition of quality goals.
TQMSummary:QC+QA: Detect the problems early to
prevent their consequences
QI+QP: Provide structured solving process to identify and rectify the problems to document new QLP to achieve quality requirements
New QLP measured and monitored through QC and QA
TQM
Quality System Overview
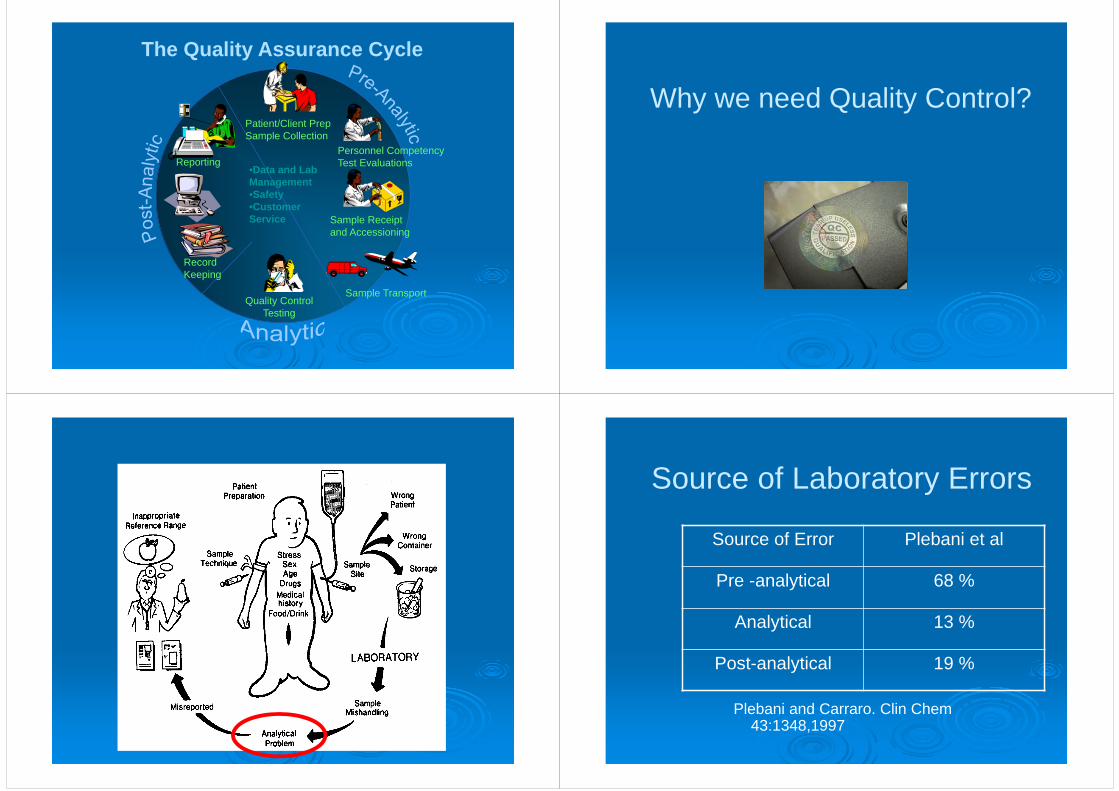
The Quality Assurance Cycle
•Data and Lab Management•Safety•Customer Service
Patient/Client PrepSample Collection
Sample Receipt and Accessioning
Sample TransportQuality Control
Testing
RecordKeeping
ReportingPersonnel CompetencyTest Evaluations
Why we need Quality Control?
Source of Laboratory Errors
Plebani and Carraro. Clin Chem 43:1348,1997
Source of Error Plebani et al
Pre -analytical 68 %
Analytical 13 %
Post-analytical 19 %

Why do laboratory errors occur?
QualityControl &
Assessment
PoorWorkload
Management
Understaffed
Non-validatedTests
InadequateAttentionTo Detail
Time Pressures
Poor Results Verification
Poor Sample Control
PoorQuality
Management
Quality control
Why we need QC? To detect, reduce and correct errors in
analytical process before release of patient results in order to produce accurate and precise results
Quality control
Why we need QC?
QC is one of the most important variables reviewed as part of the Laboratory Accreditation
ISO Family of QM Standards
Testing or
Calibration Laboratory
ClinicalLaboratory
Industry
Environment

Quality Control Quality Control
Components:1. Procedure2. Control materials3. Data interpretation
Normal Distribution
All values are symmetrically distributed around the mean
Characteristic “bell-shaped” curve Assumed for all quality control statistics
Normal Distribution
Freq
uenc
y
4.7’ 4.8’ 4.9’ Mean 5.1’ 5.2’ 5.3’
X

Normal Distribution
02468
10121416
# of
Obs
erva
tions
192 194 196 198 200 202 204 206 208 210 212
Serum glucose (mg/dL)
Mean
Accuracy and Precision The degree of fluctuation in the measurements
is indicative of the “precision” of the assay. The closeness of measurements to the true
value is indicative of the “accuracy” of the assay. Quality Control is used to monitor both the
precision and the accuracy of the assay in order to provide reliable results.
Accuracy Vs. PrecisionAccuracyHow well a measurement agrees with an accepted value
PrecisionHow well a series of measurements agree with each other
Precise and inaccurate
Precise and accurate
Precision and AccuracyPrecision and Accuracy

Imprecise and inaccurate Measures of Dispersion or Variability
There are several terms that describe the dispersion or variability of the data around the mean:
• Range• Variance• Standard Deviation• Coefficient of Variation
Range
Range refers to the difference or spread between the highest and lowest observations.
It is the simplest measure of dispersion. It makes no assumption about the shape
of the distribution or the central tendency of the data.
Calculation of Variance (S2)
222
1N)X(X2 /dlmgS 1

Calculation of Variance Variance is a measure of variability about
the mean. It is calculated as the average squared
deviation from the mean. the sum of the deviations from the mean,
squared, divided by the number of observations (corrected for degrees of freedom)
Degrees of Freedom
Represents the number of independent data points that are contained in a data set.
The mean is calculated first, so the variance calculation has lost one degree of freedom (n-1)
Calculation of Standard Deviation
mg/dlS 1N)x(x 2
1
variance
Calculation of Standard Deviation
The standard deviation (SD) is the square root of the variance it is the square root of the average squared
deviation from the mean SD is commonly used (rather than the
variance) since it has the same units as the mean and the original observations
SD is the principle calculation used in the laboratory to measure dispersion of a group of values around a mean

Standard Deviation and Probability
For a set of data with a normal distribution, a value will fall within a range of: +/- 1 SD 68.2% of the time +/- 2 SD 95.5% of the time +/- 3 SD 99.7% of the time
68.2%
95.5%99.7%
Freq
uenc
y-3s- 2s -1s Mean +1s +2s +3s
X
Standard Deviation and Probability
In general, laboratories use the +/- 2 SD criteria for the limits of the acceptable range for a test
When the QC measurement falls within that range, there is 95.5% confidence that the measurement is correct
Only 4.5% of the time will a value fall outside of that range due to chance; more likely it will be due to error
Calculation of Coefficient of Variation
The coefficient of variation (CV) is the standard deviation (SD) expressed as a percentage of the mean
Ideally should be less than 5%
100x meanSDCV
Monitoring/Interpretation of QC Data

Monitoring QC Data
Use Levey-Jennings chart Plot control values each run, make
decision regarding acceptability of runMonitor over time to evaluate the
precision and accuracy of repeated measurements
Review charts at defined intervals, take necessary action, and document
Levey-Jennings Chart
A graphical method for displaying control results and evaluating whether a procedure is in-control or out-of-control
Control values are plotted versus time Lines are drawn from point to point to
accent any trends, shifts, or random excursions
Levey-Jennings Chart- 20 - 15 - 10 - 5 0
+3SD
+2SD
+1SD
Mean
-1SD
-2SD
-3SD0
0.4
0.8
1 .2
Levey-Jennings Chart -Record Time on X-Axis and the Control Values on Y-Axis
80859095
100105110115
1 2 3 4 5 6 7 8 9 10 11 12 13 14 15 16 17 18 19 20 21 22 23 24Con
trol
Val
ues
(e.g
. mg/
dL)
Time (e.g. day, date, run number)

Levey-Jennings Chart -Plot Control Values for Each Run
80859095
100105110115
1 2 3 4 5 6 7 8 9 10 11 12 13 14 15 16 17 18 19 20 21 22 23 24Con
trol
Val
ues
(e.g
. mg/
dL)
Time (e.g. day, date, run number)
Levey-Jennings Chart Calculate the Mean and Standard Deviation;
Record the Mean and +/- 1,2 and 3 SD Control Limits
80859095
100105110115
1 2 3 4 5 6 7 8 9 10 11 12 13 14 15 16 17 18 19 20 21 22 23 24
Mean
Day
+1SD
+2SD
+3SD
-1SD
-2SD-3SD
Levey-Jennings Chart -Record and Evaluate the Control Values
80
85
90
95
100
105
110
115
1 2 3 4 5 6 7 8 9 10 11 12 13 14 15 16 17 18 19 20 21 22 23 24
Mean
Day
+1SD
+2SD
+3SD
-1SD
-2SD
-3SD
LJ chart
Aims : All assayed values for QC material should
be plotted and compared with the limits To detect and monitor process variation
over time Tool for long term monitoring of a process
such as shift and imprecision
LJ chart False rejection problems with LJ charts that use mean
+/-2s as control limits.- No. of control per run=1, false rejection rate=5%- No. of control per run=2, false rejection rate=9%- No. of control per run=3, false rejection rate=14%- No. of control per run=4, false rejection rate=18%
Review the chart using Westgard Rules based on statistical methods
To detect random error and systemic error
Systematic errorVs
Random error
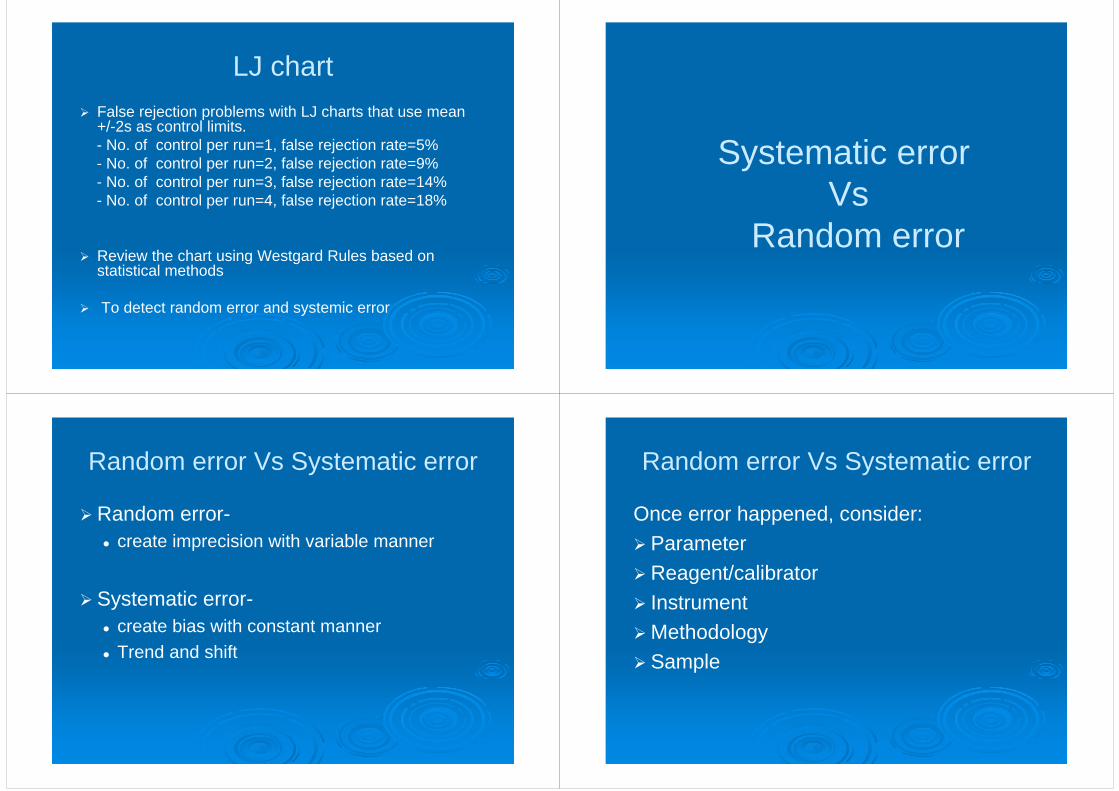
Random error Vs Systematic error
Random error- create imprecision with variable manner
Systematic error- create bias with constant manner Trend and shift
Random error Vs Systematic error
Once error happened, consider: ParameterReagent/calibrator InstrumentMethodology Sample
Random error Vs Systematic error
Examples:
Random errors: Lack of maintenance Inconsistent reagent preparation Intermittent dripping (sample probe/reagent
probe) Faulty lamps/detectors Scratched reagent mixers ISE selectivity deteriorated; etc
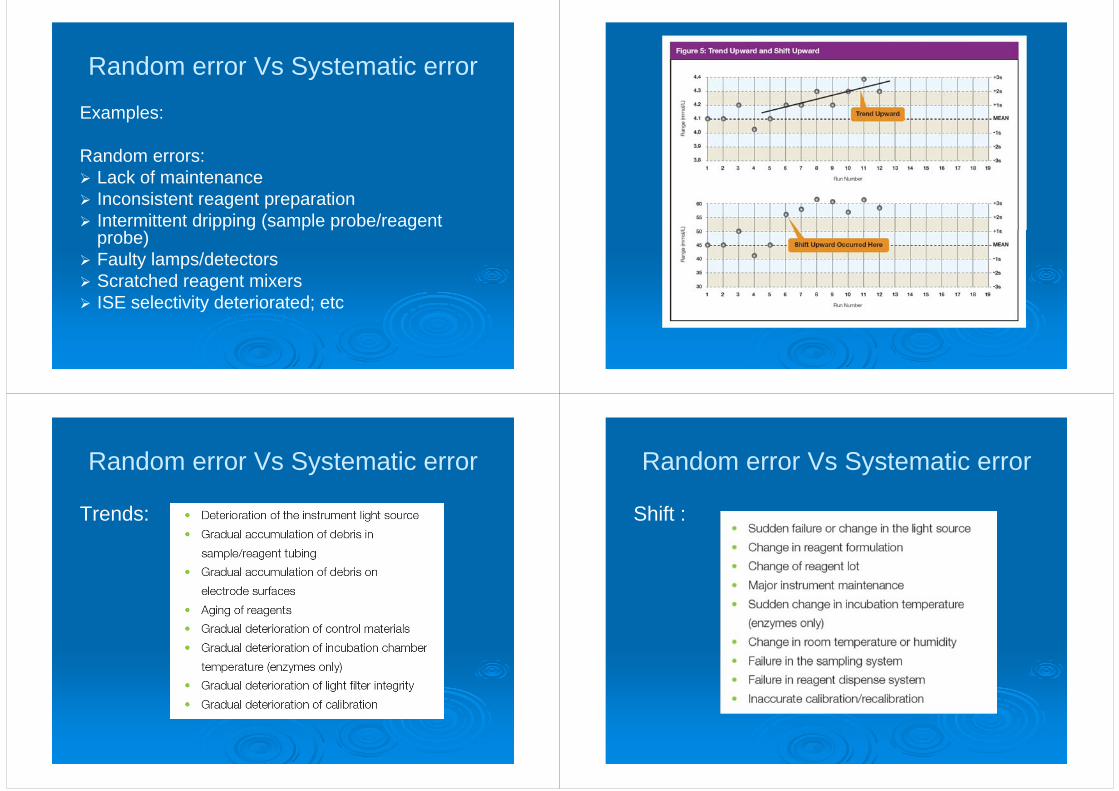
Random error Vs Systematic error
Trends:
Random error Vs Systematic error
Shift :

Findings Over Time Ideally should have control values clustered
about the mean (+/-2 SD) with little variation in the upward or downward direction
Imprecision = large amount of scatter about the mean. Usually caused by errors in technique
Inaccuracy = may see as a trend or a shift, usually caused by change in the testing process
Random error = no pattern. Usually poor technique, malfunctioning equipment
When does the Control Value Indicate a Problem?
Consider using Westgard Control RulesUses premise that 95.5% of control values
should fall within ±2SDCommonly applied when two levels of
control are usedUse in a sequential fashion
Westgard Rules(Generally used where 2 levels of
control material are analyzed per run)12S rule13S rule22S rule
R4S rule41S rule10X rule
Westgard multi-rules
Warning forpossible systematicor random error

Westgard multi-rules
Identify systematicor random error
Westgard multi-rules
Identify systematicerror
Westgard multi-rules
Identify random error
Westgard multi-rules
Identify systematicerror

Westgard multi-rules
Identify systematicerror
Westgard Multi-rule approach
Combination of rules decided by individual laboratory applying on individual test
When a rule is violatedWarning rule = use other rules to inspect
the control pointsRejection rule = “out of control”
Stop testing Identify and correct problem Repeat testing on patient samples and controls Do not report patient results until problem is solved
and controls indicate proper performance
Solving “out-of-control” problems Policies and procedures for remedial
action
Troubleshooting
Alternatives to run rejection

LJ chart
Summary: 5% values will exceed 2SD when no error
existsDetect random error or systematic error
based on Westgard rules 100% error detection and 0% false
rejection cannot be achievedUsually power of error detection around
90% and false rejection around 5%
QC Planning
Single rule? Multi-rules?
Number of control measurements?
Concept of Six-Sigma
Total Analytical Error, TE
TE = Inaccuracy + Imprecision
Total Allowable Error (Medical Usefulness) should be greater than TE (Method / Assay Performance)
Source:http://www.qcnet.com/Portals/0/PDFs/BVValues1Final.pdf
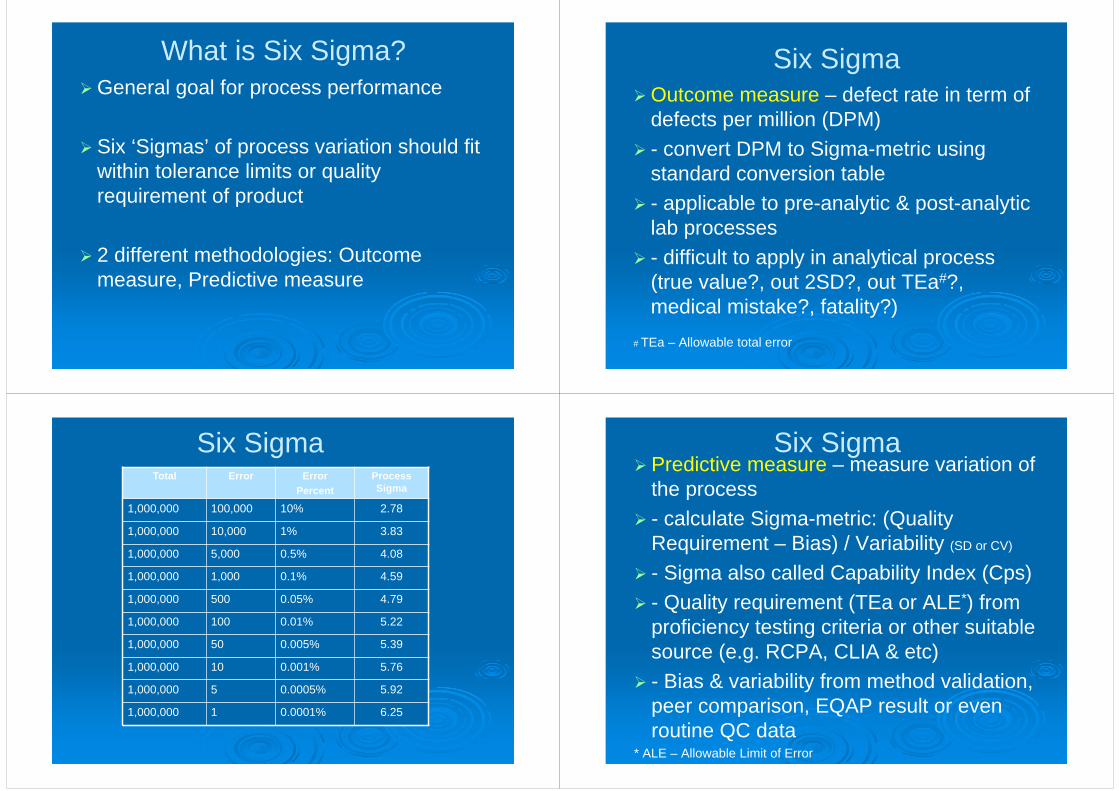
What is Six Sigma?General goal for process performance
Six ‘Sigmas’ of process variation should fit within tolerance limits or quality requirement of product
2 different methodologies: Outcome measure, Predictive measure
Six SigmaOutcome measure – defect rate in term of
defects per million (DPM) - convert DPM to Sigma-metric using
standard conversion table - applicable to pre-analytic & post-analytic
lab processes - difficult to apply in analytical process
(true value?, out 2SD?, out TEa#?, medical mistake?, fatality?)
# TEa – Allowable total error
Six SigmaTotal Error Error
PercentProcess Sigma
1,000,000 100,000 10% 2.78
1,000,000 10,000 1% 3.83
1,000,000 5,000 0.5% 4.08
1,000,000 1,000 0.1% 4.59
1,000,000 500 0.05% 4.79
1,000,000 100 0.01% 5.22
1,000,000 50 0.005% 5.39
1,000,000 10 0.001% 5.76
1,000,000 5 0.0005% 5.92
1,000,000 1 0.0001% 6.25
Six Sigma Predictive measure – measure variation of
the process - calculate Sigma-metric: (Quality
Requirement – Bias) / Variability (SD or CV)
- Sigma also called Capability Index (Cps) - Quality requirement (TEa or ALE*) from
proficiency testing criteria or other suitable source (e.g. RCPA, CLIA & etc)
- Bias & variability from method validation, peer comparison, EQAP result or even routine QC data
* ALE – Allowable Limit of Error

Six Sigma
Analyte Conc. Precision (%CV)
Bias (% Bias) TEa Limit (%) Calculated Sigma
3 2.2 6.7 10 1.53 1.0 6.7 10 3.33 2.2 2.7 10 3.3
500 4.2 5.8 10 1.0500 4.2 5.8 20 3.4
Six Sigma Same bias, lower variability = Higher
Sigma Same variability, lower bias = Higher
Sigma Same bias & variability, less stringent
quality requirement = Higher Sigma
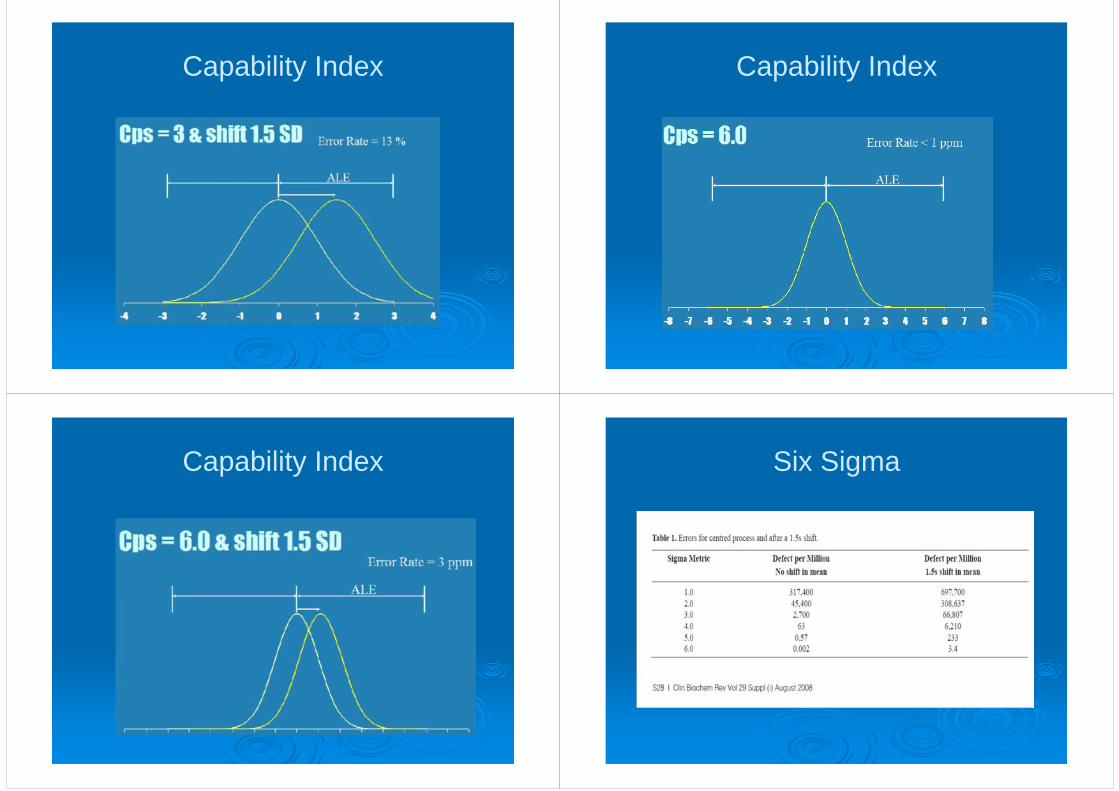
Sigma Error Rate3 66,803 / 106
4 6280 / 106
5 233 / 106
6 3.4 / 106
Capability Index
Based on Six Sigma concept
Definition:
In most cases can assume bias=0
Capability Index
Capability Index Capability Index
Capability Index Six Sigma

Capability Index
Cps<3 Incapable
Cps between 3 and 4 Barely capable
Cps between 4 and 6 Capable
Cps>6 Highly capable(World Class)
Capability IndexQC rules application based on Cps value: Cps>6-Any single rule Cps=5-Single rule QC with 2.5SD limits with 2-
3 controls Cps=4-Single rule QC with 2.5SD limits or
multi-rule QC with 3-6 controls Cps=3-Multi rule QC with 6-8 controls or More!! Cps<3-Nothing to do Consider change
methodology
Capability IndexSummary: Identify the performance of the assay
Select the appropriate QC rule to maximize the error detection
Select the appropriate number of QC run per day to reduce costs
Desirable laboratory QC system
Set up QC program including the QC material selection, QC limit set up, QC rule and no. of QC run per day selection ;etc
Follow program
Document all activities-QC procedures, QC failure and remedial actions
Take home message
Basic TQM structure
LJ QC chart setup and interpretation
Applications of capability index
References
1. R Pang. A practical Guide to Internal Quality Control. July 2010
2. CA Burtis and ER Ashwood (eds). Chapter 17 Quality Management. Clinical Chemistry Tietz textbook 1999. WB Saunders Co.
3. http://www.Westgard.com