the pulmonary circulation during mechanical ventilation
TRANSCRIPT

Acta Anaesthesiol Scand 1990: 34, Supplementum 94: 51-62
The pulmonary circulation during mechanical ventilation A. VERSPRILLE Pathophysiological Laboratory, Department of Pulmonary Diseases, Erasmus University, Rotterdam, The Netherlands
During mechanical ventilation two types of volume and pressure changes are exerted on the intrathoracic structures. End-expiratory volume (EEV) and end- expiratory pressure (EEP) are the sustained or static components of volume and pressure on which the dy- namic changes during insumation and expiration are superimposed. After a change in EEV and EEP these static components are usually maintained for a certain time. The reactions to these changes will not only be the result of mechanical effects. They will also be due to regulation mechanisms of neurogenic origin. Reflex mechanisms on the circulation have a latency or a delay time of 2-5 s and the response time is even larger
During a ventilatory cycle, only a few seconds are available to increase and to recover lung volume and intrapulmonary pressure. These dynamic changes will primarily exert directly acting mechanical effects on the functions of intrathoracic structures. They will have much shorter time constants than those of the reflex mechanisms.
A time constant is the time necessary to develop 63% of a full reaction of a dependent variable to a change of an imposed variable. This time is taken from the start of a reaction to a stimulus. We must be aware that additionally a delay might be present between a stimulus (or applied variable) and the start of a reac- tion. Mechanisms with short time constants will be found in the group of direct mechanical interactions. A delay is hardly present.
In this review both types of effects will be con- sidered, i.e. the effects elicited by changes in the static type of lung volume and pressure, and those due to the dynamic changes in volume and pressure during each ventilatory cycle. The emphasis will be on the pulmonary circulation, but to understand the changes in the pulmonary circulation a consideration of specific aspects of the systemic circulation is necessary.
(1, 2).
INTRATHORACI C PRESSURE To consider the circulatory responses to changes in lung volume and intrapulmonary pressure, respec-
tively, it is useful to remember that during mechanical ventilation intrapulmonary pressure depends on lung volume and the combined recoil forces of thorax and lungs, whereas intrathoracic pressure depends on lung (i.e. thoracic) volume and thoracic recoil forces. These dependences will be considered with the use of a simple schematic model of lungs and thorax (Fig. l ) , modified from Netter (3) and based on the model of recoil forces as first described by Rahn et al. (4).
Fig. 1A represents the situation of FRC-level after spontaneous expiration. The respiratory muscles are relaxed and do not exert any force on the system. The same will be true at end-expiratory volume during mechanical ventilation with a zero end-expiratory pressure (ZEEP) and muscle paralysis. Thus, the recoil forces of the lungs and the thorax balance each other in opposite direction. Intrathoracic pressure (PiJ is equal to -PL as well as to -Pc, when we assume alveolar pressure (PA) equal to ambient air pressure and when we reset ambient air pressure to zero.
Deep inspiration as shown in Fig. 1B will increase lung recoil forces, PL. During inspiration the pressure Pc, due to the thoracic recoil forces, is firstly decreased and next increased in the opposite direction when inspiration continues. Pc then exerts a positive pressure on the intrathoracic structures. To balance both ex- piratory directed recoil pressures P, + P,, a counteract- ing pressure P, delivered by the inspiratory muscles is needed. Pi, will be more negative and again equal to P,, and also equal to - P, + P,. During spontaneous breathing Pi, is negative and dependent on PL.
In Fig. 1 C the situation is modelled during mechan- ical ventilation. When muscle forces are zero by paral- ysis, a force will be needed after deep insumation to balance both P, and P,. This force is PA, which is measured as tracheal pressure (PT). Then, Pi, = PA-PL, and Pi, = P,, where Pc became positive due to the large volume. During mechanical ventilation and muscle paralysis intrathoracic pressure depends on Pc, which depends on lung volume, i.e. thoracic volume. How- ever, Pi, does not depend on PA and on PL.
When the recoil forces (PL) of the lungs increase, e.g. in ARDS (adult respiratory distress syndrome),

52 A. VERSPRILLE
and thoracic volume is kept constant, intrapulmonary pressure will increase by the same amount, but intra- thoracic pressure will not be changed.
Although intrathoracic pressure is not directly de- pendent on the pulmonary recoil forces under circum- stances of mechanical ventilation, stiffening of the lungs can exert an indirect effect on Pi, via a change in lung volume. At any end-expiratory pressure a pa- tient's end-expiratory lung volume will be decreased when lung compliance is decreased. Then, thoracic volume will be decreased until a new equilibrium is established between PT on the one side and P, and Pc on the other. This implies a decrease of the recoil forces of the thorax and, thus, a lower intrathoracic pressure. But a superimposed insumation will increase intrathor- acic pressure independent of the increase in intrapul- monary pressure.
The reasoning, sometimes heard in lectures, that a stiff lung prevents or inhibits transmission of intrapul- monary pressure to the intrathoracic structures ne- glects the basic relationship between lung (i.e. tho- racic) volume and intrathoracic pressure. A stiff lung will decrease lung and thoracic volume, which co-
incides with a low or even negative intrathoracic pressure.
The independence of the intrathoracic pressure rise of the intrapulmonary pressure rise implies that during a ventilatory cycle the changes in intrapulmonary pressure will not directly affect venous return to the right ventricle. Changes in intrapulmonary pressure will affect venous return when central venous pressure is changed via a change in afterload on the right ventricle. Intrapulmonary pressure will primarily ex- ert a direct effect on the pulmonary circulation, as will be considered in the section on venous return to the left ventricle. The effect of central venous pressure on venous return during the ventilatory cycle is mainly a result of the changes in intrathoracic pressure.
EFFECTS O F PEEP Pulmonary artery pressure (PPJ The effect of PEEP on the pulmonary artery pressure (PPa) has been extensively reported in the literature. For consideration of hemodynamic mechanisms, the transmural pressure (Ppa,[,,,) is the most interesting vari-
PC
DEEP InsD.
I P P V
Fig. 1. Models of recoil pressures. A. At end-expiratory level (FRC-level) the recoil forces of lungs and thorax balance each other. PA: alveolar pressure; PT: tracheal pressure as a substitute of intrapulmonary pressure (Pa); Pit: intrathoracic pressure; P,: pressure of the recoil forces in the lung tissue; Pc: pressure of the recoil forces in the thoracic wall. B. After deep inspiration when PA is equal to ambient air pressure again P, is in opposite direction compared with the end-expiratory level. P, is the pressure delivered by the muscles. P, balances P, and P,. C. After deep insufflation during mechanical ventilation, when P,=O, an intrapulmonary pressure (PA) is necessary to balance P, and P,.

PULMONARY CIRCULATION AND MECHANICAL VENTILATION
able because it represents afterload of the right ven- tricle and it eliminates changes in intrathoracic press- ure from the value of Ppa. Unfortunately, intrathoracic pressure is usually not available in clinical routine.
Transmural pulmonary artery pressure Although P,, is usually higher than Pi,, the changes in its mean values during changes in PEEP appeared to be a useful substitute for the changes in intrathoracic pressure (5). Thus, the changes in the differences be- tween P,, and P,, can be regarded as useful to evaluate changes in transmural P,, but not to determine its precise level. When we recalculated the changes in P,, to changes in Ppa,tm from PPa-P,,, we found in many papers (6-10) an increase in Ppa,tm when PEEP was applied.
Recalculated results of Hobelman et al. (11) re- vealed no changes in Ppa,,,,, at all when PEEP was increased from ZEEP to 10 and 20 mmHg respectively, and Prewitt & Wood (12) reported a slight decrease. Schreuder et al. (5) studied the effect of a continuous increase in PEEP from 0 to 15 cmH,O on Ppa,,,,, at end-expiration and at peak insumation (Fig. 2d), re- presenting the change in Ppa,tm during insumation of tidal volume. These values were calculated from P,, (Fig. 2C) and P,, (Fig. 2e) at end-expiration and at peak insuflation, respectively. Below a PEEP of 5-6 cmH,O Ppa,,m was decreasing during insumation, which was certainly due to the fall in stroke volume of the right ventricle (Fig. 4b). Above this level Ppa,lm was decreasing during insumation in spite of the de- crease in RV stroke volume. This decrease in RV stroke volume will be considered later.
Recently, we reported a larger increase in P,, than in P,, during insumation as shown in Fig. 4d ( 13). The Ppa,,,,, at peak-insumation in our PEEP study (5) will have been overestimated 1-2 cmH,O by using P,, at peak-insumation as a substitute for Pi,. Thus, whereas a change in P,, appeared to be a useful substitute for a change in Pi, under conditions of PEEP, this was not true for the fast changes during the ventilatory cycle. The PEEP value where Ppa,(,,, started to increase during insumation instead of decreasing was corrected for that reason to a level of about 8-10 cmH20. The increase in Ppa,,,,, during insumation above this PEEP-level, whereas output decreased substantially, indicates a progressive obstruction of pulmonary vessels during insumation. Besides this fall in Ppa,tm during insuf- flation, the values themselves at end-expiration and peak-insumation, respectively, tended to increase above a PEEP of 10 cmH,O, whereas cardiac output was decreasing, indicating again a gradually increas- ing obstruction of pulmonary vessels at an increasing level of PEEP.
53
a
2 0 . CI
I
I I 13 IS 1 3 S 7 9 PEEP (cmHzO)
Fig. 2. The hemodynamic effects of PEEP. These hemodynamic effects of PEEP were studied during a continuous rise with a velocity of I cmH,O in I l l 2 min (5). The closed symbols are the values during the rise of PEEP; the open symbols during the decrease of PEEP. Vertical bars are f s.d., given in one direction a: cardiac output; b: aortic pressure (Pa") averaged over the ventilatory cycle; c: pulmon- ary artery pressure (Ppa) averaged over a cardiac cycle at cnd- expiration (0) and peak-insumation (A); d: mean transmural pul- monary artery pressure (Ppa,& at end-expiration and peak-insuf- flation; e: mean central venous pressure (Pcv) at end-expiration and peak-insumation; f: heart rate averaged over a ventilatory cycle. (With permission o f 3 Appl Physiol, taken from (5)).

54 A. VERSPRILLE
It must be emphasized that these results were found in animals with normal lungs. We might expect a different result when animals or patients have less com- pliant lungs. This difference will be indicated by the level of PEEP where the progressive increase in Ppa,tm starts to develop. As mentioned in the paragraph on intrathoracic pressure in conditions with stiff lungs, a higher PEEP value will certainly be needed for the same lung volume compared with conditions with nor- mal lungs. The same counts for the intrathoracic press- ure, and thus also for the interstitial pressure in the alveolar tissue. Therefore, I expect a higher PEEP to be needed for the same obstructive effect on the pulmonary vessels in animals and patients with de- creased lung compliance.
Cardiac output There is a general agreement in the literature on the decrease in cardiac output when PEEP increases. This has been found in patients (14-18), volunteers (19), baboons (7) , dogs (6-10, 12, 20-23) and pigs (5, 24, 25). Schreuder et al. (5) described a non-linear fall in cardiac output (Fig. 2a) when PEEP was gradually increased from 0 to 15 cmH,O in 2 2 i min. A slight decrease occurred between a PEEP of 0-3 cmH,O, then a steeper fall was observed between a PEEP of 3-10 cmH,O, and above a PEEP of 10 cmH,O the decrease in cardiac output was less steep again. The difference between the decrease in cardiac output in the PEEP-range of 3-10 c m H 2 0 and that in both other ranges was highly significant. We attributed the extra fall in cardiac output in the PEEP-range of 3 to
1 3 5 7 9 11 13 15
Fig. 3. Mechanism involved in the effects of PEEP on cardiac output. A the hypothetical decrease in cardiac output due to the rise in P,, according to Guyton’s theory on venous return (49, 61, 62); B: the hypothetical decrease in cardiac output after recovery from A due to the baro-reflexes as a compensatory control mechanism; C: the decrease in cardiac output as found in 47 pigs (5). The difference between line C and B has been attributed to lung stretch reflexes ( 5 , 24). (With permission ofJ Apt1 P/ysio/, taken from (5)).
P E E P (cmH2O)
10 cmHpO to a negative effect of a lung stretch reflex (24, 26) and supposed this effect to be superimposed on two counteracting mechanisms, which were sup- posed to be active over the whole range of PEEP from 0-15 cmH,O:
1) A negative effect of central venous pressure on cardiac output due to the increase in intrathoracic pressure when PEEP is raised, and
c 50 - I
Ppa.ryat.tm I I
-”( T I M E see. I I I . I
~ - 1 0 1 2 3 4 5
f - - A - I v . I I T I M E sac. 1 I I . I
3 4 5 0 - 1 0 1
- 2
- 4
Fig. 4. Hemodynamic changes during a ventilatory cycle. Time is the abscissa of each diagram. Insufflation occurred from 0 to 2.4 s and was immediately followed by an expiration. A cycle lasted 6 s; negative time is part of the preceding cycle. The hemodynamic values are averaged over each cardiac cycle unless otherwise indicated. a: mean aortic pressure (Pso), mean transmural aortic pressure (Pa,,,,,), and transmural systolic pressure in the right ventricle as a substitute of the corresponding pressure in the pulmonary artery (Ppa,syr,,tm); b: stroke volume (QJ of right (rv) and left ventricle (Iv), loss of pulmon- ary blood volume per beat ( A Q , ) measured from Qs,rv-Qs,,v; c: end-diastolic pressures of right and left ventricle; d: central venous (Pcv) and intrathoracic pressure (Pit); note the mutual shift of the ordinates of these two pressures to demonstrate the decrease in trans- mural P,, during insumation. (This figure was published in Actu Anaesthesiol &and (1 3) ) .

PULMONARY CIRCULATION AND MECHANICAL VENTILATION 55
2) A compensatory effect of the baroreceptor reflexes elicited by the decrease in aortic pressure (Fig. 2b) when cardiac output is decreased. The combination of these three mechanisms is schematically presented in Fig. 3.
Another mechanism contributing to the decrease in cardiac output can be regarded as of minor import- ance. Thromboxane, released by lung stretch, should act like a negative inotropic humoral substance (27-31). This hypothesis was recently tested during high frequency ventilation at mean airway pressures of 4, 10 and 20 mmHg, respectively (32). Imidazol, a specific inhibitor of thromboxane, did not change the negative hemodynamic effects of these increases in air- way pressure. Thus, the hypothesis could not be veri- fied. A contribution of any negative inotropic agent on cardiac contractility to the negative hemodynamic effects of PEEP can be doubted (5, 33-37). Decreases in RV and LV volumes (34) and filling pressures (35, 36) were reported in the PEEP studies, where intraper- icardial pressure was measured.
Literature data on cardiac output illustrate the com- ment made in the last paragraph of the former chapter of this review, implying that results in pigs with normal lungs do not necessarily count for patients. A large difference in quantitative results compared with those of Schreuder et al. (5) was found by Hobelman et al. ( 1 l ) , who observed hardly any decrease in cardiac output up to a PEEP of 10 cmH,O. Above this value cardiac output decreased with a further rise of PEEP. The change in lung volume when PEEP was changed could have been of crucial importance. When lung volume is not increased much with the rise of PEEP, as happens in stiff lungs, intrathoracic pressure will also not rise very much. Then, a negative effect on cardiac output will be minimal. This mechanism might be an explanation of the small effect on cardiac output in the PEEP range of 0 to 10 cmH,O in Hobel- man’s patients.
DYNAMIC EFFECTS DURING A VENTILATORY CYCLE Beat-to-beat changes in pressures andJow Since electromagnetic flow measurements (EM) be- came available, studies on venous return and ventricu- lar output attained the accuracy which was necessary to understand the mechanisms behind the effects of spontaneous respiration and mechanical ventilation. A further improvement was obtained from signal analy- ses with the use of a computer, which enabled us to quantify the changes. We performed beat-to-beat analyses of right and left ventricular output during a normal ventilatory cycle. An example of such an analy-
sis is given in Fig. 4, which has been published recently in this journal (13). It reflects, in quantitative terms, previously published results of many authors (38-52).
During insumation intrathoracic pressure increased and in parallel also central venous pressure but to a lesser extent (Fig. 4d). Due to the increase in central venous pressure right ventricular stroke volume de- creased (Fig. 4b), whereas left ventricular stroke vol- ume followed that fall with a delay of several beats, implying a loss of pulmonary blood volume during insumation. The fall in stroke volume of both ventricles coincided with a fall in filling pressure, i.e. transmural end diastolic pressure (Fig. 4c), indicating a decrease in venous return to be the main reason for the decrease in RV and LV stroke volumes. More or less in parallel with the decrease in output, a fall in arterial pressure occurred (Fig. 4a). Not only did systolic pulmonary artery pressure decrease during insumation, but mean pressure also decreased as shown in Fig. 2d. This de- crease was restricted to the lower PEEP range. As mentioned before, an increase of mean Ppa,,,,, will occur above a PEEP of about 8-10 cmH,O, attributed to a progressive obstruction of the pulmonary vessels by insumation.
Pulmonary blood volume The dots around the abscissa of Fig.4b indicate the beat-to-beat changes in pulmonary blood volume; the number indicates the cumulative loss of all beats during insumation and its recovery during expiration. During insumation a shift of blood volume occurred from the pulmonary circulation into the systemic circulation (ebb tide in the pulmonary vessels). During expiration a recovery was observed (flood tide). About 7% of this shift was ascribed to a change in left ventricular vol- ume (13).
In Fig. 5 the changes in pulmonary blood volume are plotted as a function of tidal volume. These changes were estimated in four pig experiments from manoeuvres (Fig. 6) in which insumation was followed by a short inspiratory pause in which input into and output from the pulmonary circulation, i.e. RV-output and LV-output, respectively, became equal again soon after peak insumation. Extrapolated to humans these results indicate a loss of about 15-20% of pulmonary blood volume after insumation of a tidal volume of 1 1.
Venous return to the left ventricle At early insumation output of the pulmonary circu- lation, i.e. output of the left ventricle, is maintained for several beats (Fig. 4b), whereas input into the pulmonary circulation, i.e. output of the right ven- tricle, and pulmonary artery pressure (Fig. 4a) have

56 A. VERSPRILLE
started to decrease. It is even possible that output from the pulmonary circulation is increased in early insumation (48, 52). In Fig. 4b it is demonstrated that throughout insumation the output from the pulmonary circulation remained higher than its input. To establish a larger output, or to maintain it constant while the input and the driving force at the arterial side are decreasing, needs an additional force on the pressure gradient. Three main mechanisms have been postu- lated to explain this additional driving force.
1) A decrease in afterload of the left ventricle (LV), i.e. a decrease in transmural aortic pressure due to an increase in intrathoracic pressure should cause an in- crease in LV stroke volume. As a consequence, the filling pressure of the LV should decrease, causing a positive effect on the pressure gradient. This concept came from observations of an increase in LV output during a Valsalva manoeuvre, i.e. a forced expiration against a closed airway opening, causing a decrease in transmural aortic pressure, as demonstrated by Hoffman et al. in dogs (38) and later by Buda et al. in patients (53). This afterload mechanism was firstly hypothesized by Schrijen et al. (54) for the decrease in LV-output during Miiller manoeuvres, i.e. a forced
A Q P ml Kg-' A
A 0 0
A 0
0
0
inspiration activity against a closed airway opening. The mechanism of afterload was also accepted for mechanical ventilation (55).
In our results (Fig. 4a) we could not observe a decrease of transmural aortic pressure in the early phase of insumation. In the second part of insumation aortic pressure decreased when LV-output also de- creased. Thus, LV-afterload was rather dependent on LV-output than LV-output on LV-afterload. If a de- crease in afterload maintained stroke volume during a decreased venous return in the early phase of insuf- flation, a consequence should have been a fall in LV filling pressure which we did not observe. In our ex- periments (13) LV filling pressure fell in parallel with stroke volume (Fig. 4c + b).
Changes in afterload might be effective during an asthmatic attack (53) when the type of breathing re- sembles a series of alternating Muller and Valsalva manoeuvres. However, afterload does not seem to be a mechanism during mechanical ventilation, also not when the ventilatory rate is as low as 10 per min as in our experiments.
2 ) Interdependence between right and left ventricle, which means a change in LV filling pressure due to a change in RV end-diastolic volume reflected by a change in Prv,ed,,m, would cause the decrease in Plv,ed,,m
VT ml Kg-'
Fig. 5. Changes in pulmonary blood volume as a function of tidal volume. The changes in pulmonary blood volume ( A Q , ) were meas- ured during an inspiratory pause procedure as demonstrated in Fig. 6. Tidal volume (V,) was insumated and kept in the lungs for 7.2 s. (This figure was published in Acta Anaesthesiol Scand (13)).
Fig. 6. Hemodynamic effects during an inspiratory pause procedure. Time is given in s at the bottom of this recording. Qa0: flow curves in the aorta; qP: flow curves in the pulmonary artery; both flows were measured with electromagnetical flow probes which were placed intrapericardially; all other variables are defined in Fig. 1 and 2. (This recording was published in Acta Anaesthesiol Scand ( 1 3 ) ) .

PULMONARY CIRCULATION AND MECHANICAL VENTILATION 57
during insumation. Then, the pressure fall from pul- monary veins to the left ventricle could be maintained or enlarged in the early phase of insurnation, causing a maintained or even a larger LV output (55). This mechanism was also adopted from studies on inspira- tory manoeuvres (56).
If interdependence is a main mechanism in main- taining or increasing venous return to the left ventricle, we would expect a decrease in Plv,ed,,m, from the start of insumation in parallel with Prv,ed,tm because interde- pendence is a direct mechanical interaction with a linear relationship between the filling pressures in both ventricles (57-59).
LV filling pressure was constant as long as LV out- put, i.e. venous return to the LV, was constant. We found the same phase shift in the fall in LV filling pressure with respect to the fall in RV filling pressure as we observed in the corresponding stroke volumes (Fig. 4b+c) . Such a phase shift, as shown in Fig. 7, where we plotted Plv,ed,$,, against Prv,ed,tm, jeopardizes any linearity and any relationship between RV and LV filling pressure. The circular diagrams of the two individual examples from two different experiments indicate no relationship at all between the two vari- ables during a ventilatory cycle. Therefore, we rejected interdependence as a mechanism for the maintenance of flow from the pulmonary circulation into the LV during early insumation.
3) Squeezing of the pulmonary vessels by an intrapul- monary pressure rise was first suggested by Buhlman et al. in 1964 (15); they concluded that there was a shift of blood from the pulmonary circulation into the
I I
3 4
7
I I
4 5 P r v e d , t m mmHg
Fig. 7 . Filling pressures in both vcntricles during a ventilatory cycle. Transmural left ventricular end-diastolic pressure (P,ved,Lm) is plotted against the corresponding values in the right ventricle (Prued,lm) during one ventilatory cycle. Both correlation diagrams were obtained from two different experiments.
systemic circulation caused by the increase in alveolar pressure during mechanical ventilation with PEEP. They did not yet mention PEEP in their paper but PEEP was undoubtedly present in their observations with patients. According to Jardin et al. (48), squeez- ing would support the driving force of blood flow into the LV and, therefore, would increase the preload and output of the LV.
The rejection of two of the three mentioned hypo- theses and the absence of experimental data which would falsify the squeezing mechanism, justify this hypothesis as a potential explanation.
Squeezing will deliver an extra force to empty pul- monary circulatory capacities and to maintain output from the pulmonary circulation under the conditions of a lower input and a decreasing pulmonary artery pressure during early insumation (Fig. 4a, b), whereas LV filling pressure is not yet decreasing.
There is no need to attribute the loss of blood vol- ume from the pulmonary circulation during insuf- flation only to the squeezing effect of increased intra- pulmonary pressure. Additionally, the increased stretch of lung tissue surrounding the pulmonary ves- sels might contribute. The supposition of such an ad- ditional contribution from increased lung stretch is based on a study in humans (60) on diffusing capacity, D,, and its components, membrane diffusing capacity, DM, and capillary blood volume, Q, related to al- veolar volume. Above a level in between functional residual capacity and total lung capacity, an increase in lung volume caused a decrease in capillary blood volume, whereas intrapulmonary pressure was main- tained at ambient air pressure during the breath hold- ing procedures of the diffusion test.
A decrease in capillary blood volume under circum- stances of spontaneous breath holding does not imply that during mechanical insumation the loss in pulmon- ary blood volume has to be attributed to a loss from the capillaries only. Our results (13) did not discriminate between a loss from the arteries, the capillaries and the veins.
When during early expiration venous return recov- ered with an overshoot, LV output continued tempo- rarily to decrease before it started to recover gradually (Fig. 4b). This continued low LV-output in spite of the augmented input into the pulmonary circulation from the RV can be attributed to a refilling of the pulmonary circulation due to the sudden fall of intra- pulmonary pressure during spontaneous expiration.
The phase shift in recovery between RV-output and LV-output yields a n important key to the explanation of the negative effect of mechanical ventilation on car- diac output. This explanation is given in the final paragraph of this paper.
58 A. VERSPRILLE
Venous return to the right ventricle It is generally accepted that the decrease in venous return to the RV during insumation is due to the increase in intrathoracic pressure, i.e. the concomitant increase in central venous pressure. This increase in P,, is relative to ambient air pressure because venous return is governed by a pressure gradient in the sys- temic circulation found from pressures measured against ambient air pressure. As a consequence of the decreased venous return, transmural P,, decreases (Fig. 4d), as was already reported in 1966 by Morgan et al. (39). The fall in transmural P,, is also reflected in the fall in Prv,ed,,m (Fig. 4c).
A rise in P,, will decrease venous return linearly, when both variables are measured in the stationary phase after the transient changes, and when nervous and humeral control mechanisms are not involved (61, 62). We confirmed these studies of Guyton's group on the mechanical effects of P,, on venous return in ani- mals with intact circulation by application of a series of inspiratory pause procedures (IPP), i.e. a short period of an inspiratory pause after insumation of a tidal volume to raise P,, (49), which is demonstrated in Fig. 6. Different values of P,, were achieved by different tidal volumes in each IPP. We found a de- crease in blood flow, a fall in aortic pressure and
pcv m m H g
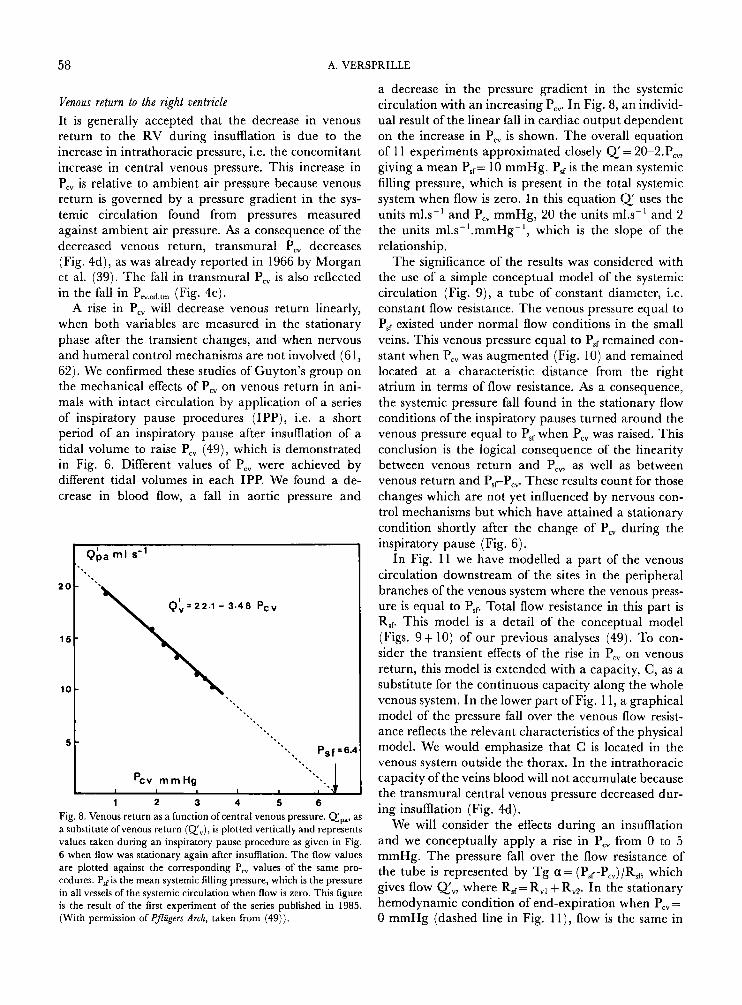
1 2 3 4 5 6 Fig. 8. Venous return as a function ofcentral venous pressure. Qpa, as a substitute ofvenous return (Q',.), is plotted vertically and represents values taken during an inspiratory pause procedure as given in Fig. 6 when flow was stationary again after insufflation. The flow values are plotted against the corresponding P,, values of the same pro- cedures. P,,is the mean systemic filling pressure, which is the pressure in all vessels of the systemic circulation when flow is zero. This figure is the result of the first experiment of the series published in 1985. (With permission of Pjlcggers Arch, taken from (49)).
a decrease in the pressure gradient in the systemic circulation with an increasing Pcv. In Fig. 8, an individ- ual result of the linear fall in cardiac output dependent on the increase in P,, is shown. The overall equation of 1 1 experiments approximated closely Q' = 20-2.P,, giving a mean PET= 10 mmHg. P,,is the mean systemic filling pressure, which is present in the total systemic system when flow is zero. In this equation Q' uses the units m1.s-l and P,, mmHg, 20 the units m1.s-' and 2 the units ml.s-'.mmHg-', which is the slope of the relationship.
The significance of the results was considered with the use of a simple conceptual model of the systemic circulation (Fig. 9) , a tube of constant diameter, i.e. constant flow resistance. The venous pressure equal to PsT existed under normal flow conditions in the small veins. This venous pressure equal to Psf remained con- stant when P,, was augmented (Fig. 10) and remained located at a characteristic distance from the right atrium in terms of flow resistance. As a consequence, the systemic pressure fall found in the stationary flow conditions of the inspiratory pauses turned around the venous pressure equal to P,, when P,, was raised. This conclusion is the logical consequence of the linearity between venous return and P,, as well as between venous return and PsrPcv. These results count for those changes which are not yet influenced by nervous con- trol mechanisms but which have attained a stationary condition shortly after the change of P,, during the inspiratory pause (Fig. 6).
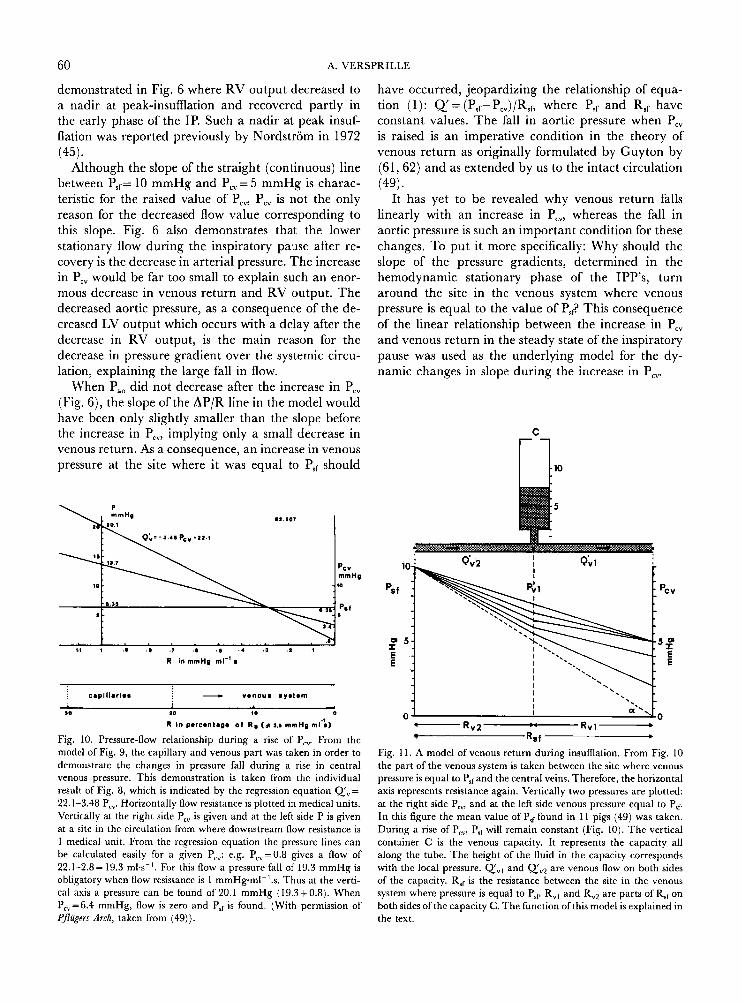
In Fig. 11 we have modelled a part of the venous circulation downstream of the sites in the peripheral branches of the venous system where the venous press- ure is equal to P,, Total flow resistance in this part is Rrp This model is a detail of the conceptual model (Figs. 9 + 10) of our previous analyses (49). To con- sider the transient effects of the rise in P,, on venous return, this model is extended with a capacity, C, as a substitute for the continuous capacity along the whole venous system. In the lower part of Fig. 1 1, a graphical model of the pressure fall over the venous flow resist- ance reflects the relevant characteristics of the physical model. We would emphasize that C is located in the venous system outside the thorax. In the intrathoracic capacity of the veins blood will not accumulate because the transmural central venous pressure decreased dur- ing insumation (Fig. 4d).
We will consider the effects during an insumation and we conceptually apply a rise in P,, from 0 to 5 mmHg. The pressure fall over the flow resistance of the tube is represented by T g a = (P,,-P,,)/RSn which gives flow Q',, where Rsf= R,, + Rv2. In the stationary hemodynamic condition of end-expiration when P,, =
0 mmHg (dashed line in Fig. 1 l ) , flow is the same in

PULMONARY CIRCULATION AND MECHANICAL VENTILATION 59
all parts of the tube, i.e. at all cross-sections of the total venous tree.
Thus, T g CY, = Q'" = (P,r- Pcv) /Rsr ( 1 ) = Q ' v l = P,,- PC")/R"I(2) = Q l v 2 = (psl-pvl)/R", (3)
Flow could be calculated when the value of flow resist- ance is given. Such numerical data are not relevant now, but they can be found in our former analyses
When P,, increases (see right Y-axis) and flow over R,, remains constant, the same increase should occur in the venous pressure PV1 at C, according to equation (1) . Such an immediate increase would only be poss- ible if C is tilled up immediately to the level which is characteristic of the increased P,,. The filling up of a capacity needs time. This is the reason why P,, in- creases gradually. This behaviour is analogous to the function of an RC element in electricity.
As long as PVI has not yet adapted, a decrease in the pressure gradient over RV1 and thus a decrease in
(49).
m u ) UI U I U I al
m .- L
- - .- P m 0
QIYl (equ.1) will be present. When part of QV2 is going into C, less is left for QV1. The decrease in Q',, will be larger when P,, increases faster. When P,, has reached its maximal value of 5 mmHg at peak-insuf- flation, the filling up of C coincides with an increase in P,, and consequently with a recovery of the pressure fall over Rvl. Then, Q, increases again up to a new equilibrium, as indicated by the slope of the highest (continuous) line in the diagram. This slope is smaller than the slope at end-expiration. It indicates the characteristic flow corresponding to the new value of Pc., The broken lines in the graphical diagram demon- strate the effect of the capacity on the flow in the model during the increase of P,, and shortly after peak insumation in the early phase of the inspiratory pause. Actually, these broken lines will be smooth concave curves due to a capacity function all along the veins.
The model predicts an extra fall in venous return during insumation. After peak-insumation is reached, a partial recovery of flow will occur. This consequence of the model is in agreement with our observations, as
v) UI v) al al
E 0)
- a
> - - m E v)
E al > .-
al m L m J
m > m 0
m C 0 >
100 90 8 0 7 0 60 50 40 30 2 0 10 0
P r e s s u r e in mm H g
Fig. 9. Projection of the systemic circulation on a tube of constant diameter. A tube of constant diameter implies also a tube of constant resistance. When pressure fall in the systemic circulation is projected on such a tube, the length of the projection of each type of vessel indicates the total flow resistance in these vessels. The arterioles are represented by 55% of the tube, whereas the much larger aorta and large arteries are represented by only 20/,. These differences indicate the large differences in flow resistance and, therefore, in pressure fall in both areas of the circulation, Such a linearized model is very useful for analyses of pressure-flow relationships. (With permission of Pfliigers Arch, taken from (49)).
60 A. VERSPRILLE
demonstrated in Fig. 6 where RV output decreased to a nadir at peak-insufflation and recovered partly in the early phase of the IP. Such a nadir at peak insuf- flation was reported previously by Nordstrom in 1972
Although the slope of the straight (continuous) line between Psf= 10 mmHg and P,, = 5 mmHg is charac- teristic for the raised value of P,,, P,, is not the only reason for the decreased flow value corresponding to this slope. Fig. 6 also demonstrates that the lower stationary flow during the inspiratory pause after re- covery is the decrease in arterial pressure. The increase in P,, would be far too small to explain such an enor- mous decrease in venous return and RV output. The decreased aortic pressure, as a consequence of the de- creased LV output which occurs with a delay after the decrease in RV output, is the main reason for the decrease in pressure gradient over the systemic circu- lation, explaining the large fall in flow.
When P,, did not decrease after the increase in P,, (Fig. 6), the slope of the AP/R line in the model would have been only slightly smaller than the slope before the increase in P,,, implying only a small decrease in venous return. As a consequence, an increase in venous pressure at the site where it was equal to Psf should
(45).
have occurred, jeopardizing the relationship of equa- tion (1): Q'= (P,r-P,,)/R,~, where PSI and Rsr have constant values. The fall in aortic pressure when P,, is raised is an imperative condition in the theory of venous return as originally formulated by Guyton by (61,62) and as extended by us to the intact circulation
It has yet to be revealed why venous return falls linearly with an increase in P,,, whereas the fall in aortic pressure is such an important condition for these changes. To put it more specifically: Why should the slope of the pressure gradients, determined in the hemodynamic stationary phase of the IPP's, turn around the site in the venous system where venous pressure is equal to the value of Ps$ This consequence of the linear relationship between the increase in P,, and venous return in the steady state of the inspiratory pause was used as the underlying model for the dy- namic changes in slope during the increase in Pcv.
(49).
ao 10 10 0
R in porcmntog. o f R 8 (n 1.1 mmHp mi-:)
Fig. 10. Pressure-flow relationship during a rise of Pcv. From the model of Fig. 9, the capillary and venous part was taken in order to demonstrate the changes in pressure fall during a rise in central venous pressure. This demonstration is taken from the individual result of Fig. 8, which is indicated by the regression equation Q',= 22.1-3.48 Pcv. Horizontally flow resistance is plotted in medical units. Vertically at the right side P,, is given and at the left side P is given at a site in the circulation from where downstream flow resistance is 1 medical unit. From the regression equation the pressure lines can be calculated easily for a given P,": e.g. P,,=0.8 gives a flow of 22.1-2.8= 19.3 ml.s-'. For this flow a pressure fall of 19.3 mmHg is obligatory when flow resistance is 1 mmHgml-'.s. Thus at the verti- cal axis a pressure can be found of 20.1 mmHg (19.3+0.8). When P,,=6.4 mmHg, flow is zero and P,, is found. (With permission of Pflugers Arch, taken from (49)).
- R v 2 Rvl- Rsf b
Fig. I 1. A model of venous return during insufflation. From Fig. 10 the part of the venous system is taken between the site where venous pressure is equal to PSfand the central veins. Therefore, the horizontal axis represents resistance again. Vertically two pressures are plotted: at the nght side P,,, and at the left side venous pressure equal to P,, In this figure the mean value of P,, found in 1 I pigs (49) was taken. During a rise of P,,, P,, will remain constant (Fig. 10). The vertical container C is the venous capacity. It represents the capacity all along the tube. The height of the fluid in the capacity corresponds with the local pressure. Q'", and QV2 are venous flow on both sides of the capacity. R,, is the resistance between the site in the venous system where pressure is equal to P,, R,, and R,, are parts of R,, on both sides ofthe capacity C. The function of this model is explained in the text.
PULMONARY CIRCULATION AND MECHANICAL VENTILATION 61
The decrease in cardiac output during mechanical ventilation In Fig. 4b the decrease in cardiac output (RV output) during insumation was much larger than the com- pensatory recovery during early expiration, causing a net deficit in output by the action of ventilation. The net deficit was on average 10.3% f 3.2% (s.d.), n = 135, of the end-expiratory flow during mechanical ven- tilation at a rate of 10 per min (13). When an accumu- lation of blood into the venous capacities occurs during insumation and this accumulated blood volume is re- leased again in the early phase of expiration, one would expect a complete recovery of the loss of flow during inspiration, resulting on average in a flow over the ventilatory cycle equal to the end-expiratory flow. Our results did not confirm this expectation. Why not?
The answer is in Fig. 4. In the early phase of expir- ation aortic pressure was low, due to the decrease in LV output. As a consequence flow from the arterial to venous system will be low. At this moment the accumulated blood volume comes from the venous capacities and contributes to the venous return. How- ever, together with the low arterial to venous flow, it delivers an increase in flow which is lower than the overall decrease during insumation. Thus, the main reason for the net deficit is the low LV output in early expiration when venous return recovers. It prevents recovery with full compensation for the loss during insumation.
REFERENCES 1.
2.
3.
4.
5.
6.
7.
8.
9.
Scher A M, Young A C. Servoanalysis of carotid sinus reflex effects on peripheral resistance. Circ Res 1963: 12: 152- 162. Donald E D, Edis A J. Comparison of aortic and carotid barore- flexes in the dog. 3 Physiol 1971: 215: 521-538. The Ciba Collection of Medical Illustrations, Val. 7 Respiratory System, FH Netter, 1979: section 11, Plate 4, p 50. Rahn H, Otis A B, Chadwick L E, Fenn W 0. The pressure- volume diagram of the thorax and lung. Am J Physiol 1946: 146:
Schreuder J J, Jansen J R C, Bogaard J M , Versprille A. Hemo- dynamic effects of PEEP applied as a ramp. J Appl Physiol 1982:
Lenfant C, Howell B J. Cardiovascular adjustments in dogs during continuous pressure breathing. J Appl Physiol 1960: 15: 425428. Sykes M K, Adams A P, Finley W E I, McCormick P W, Economides A. The effect ofvariations in end-expiratory inflation pressure on cardio-respiratory function of normo-, hypo- and hypervolaemic dogs. Br J Anaesth 1970: 42: 669-677. Zarins C K, Virgilio R W, Smith D E, Peters R M. The effect of vascular volume on positive end-expiratory pressure-induced cardiac output depression and wedge-left atrial pressure discrep- ancy. J Surg Res 1977: 23: 348-360. Scharf S M, Caldini P, Ingram R H Jr. Cardiovascular effects of increasing airway pressure in the dog. Am 3 Physiol 1977:
161-178.
53: 1239-1247.
232: H35-H43.
10. Scharf S M, Ingram R H Jr. Effects of decreasing lung com- pliance with oleic acid on the cardiovascular response to PEEP. Am J Physiol 1977: 233: H635-641.
11. Hobelmann C F Jr, Smith D E, Virgilio R W, Shapiro A R , Peters R M. Hernodynamic alterations with positive end-expira- tory pressure: the contribution of the pulmonary vasculature. J Eaauma 1975: 15: 951-985.
12. Prewitt R M, Wood L D H . Erect of positive end-expiratory pressure on ventricular function in dogs Am J Physiol 1979: 235: H534-544.
13. Versprille A, Jansen J R C, Frietman R C, Hulsmann A R, Klauw M M van der. Negative effect of insumation on cardiac output and pulmonary blood volume. Acta Anaesthesiol Scand 1990: 34: 607-615.
14. Cournand A, Motley H L, Werko L, Richards D W Jr. Physi- ological studies of the effects of intermittent positive-pressurc breathing on cardiac output in man. Am J Physiol 1948: 152:
15. Biihlman A, Gattiker H, Hossli G. Die Behandlung des Lungeno- dems rnit uberdruckbeatmung. Schweiz Med Wochenschr 1964: 94:
16. McIntyre R W, Laws A K, Ramachandran P R. Positive expira- tory pressure plateau: improved gas exchange during mechanical ventilation. Can Anaesthesiol Soc J 1969: 16: 477486.
17. Lamy M, Deghislage J, Lamalle D, Hanquet M. Hemodynamic cffccts of intermittent or continuous positive-pressure breathing in man. Acta Anaesthcsiol Belg 1973: 24: 270-287.
18. Suter P M, Fairley M B, Isenberg M D. Optimum end-expira- tory pressure in patients with acute pulmonary failure. N Enpl J Med 1975: 292: 284-289.
19. Cassidy S S, Eschenbacher W L, Robertson C H Jr. Nixon J V, Blomqvist G, Johnson R L Jr. Cardiovascular effects of positive- pressure ventilation in normal subjects. 3 Appl Physiol 1979: 47:
20. Morgan B C, Crawford E W, Hornbeiri T F, Martin W E, Guntheroth W G. Hemodynamic effects of changes in arterial carbon dioxide tension during intermittent positive pressure ven- tilation. Anesthesiology 1966: 28: 866-873.
21. Qvist J, Pontoppidan H , Wilson R S, Lowenstein E, Laver M B. Hemodynamic responses to mechanical ventilation with PEEP: the effect of hypervolemia. Anesthesiology 1975: 42: 45-55.
22. Cassidy S S, Robertson C H Jr, Pierce A K, Johnson R L. Cardiovascular effects of positive end-expiratory pressure in dogs. J Appl Physiol 1978: 44: 743-750.
23. Fewell J E, Abendschein D R , Carlson C J, Murray J F, Rapa- port E. Continuous positivc-pressure ventilation decreases right and left ventricular end-diastolic volumes in the dog. Circ Res
24. Schreuder J J, Jansen J R C, Versprille A. Contribution of lung stretch depressor reflex to nonlinear fall in cardiac output during PEEP. 3 Appl Physiol 1984: 56: 1578-1582.
24. Schreuder J J, Jansen J R C, Versprille A. Hemodynamic erects of PEEP applied as a ramp in normo-, hyper- and hypovolemia. J Appl Physiol 1985: 59: 1178-1 184.
26. Daly M de B, Hazzledine J L, Ungar A. The reflex effects of alterations in lung volume on systemic vascular resistance in the dog. J Physiol ( L ) 1967: 188: 331-351.
27. Manny J, Grindlinger G A, Math6 A A, Hechtrnan H B. Positive end-expiratory pressure, lung stretch, and decreased myocardial contractility. Surgey 1978: 84: 127-133.
28. Grindlinger G A, Manny J, Justice R, Dunham B, Sherpo D, Hechtrnan H B. Presence of negative inotropic agents in canine plasma during positive end-expired pressure. Circ Res 1979: 45:
29. Grindlinger G A, Vegas A M, Manny J, Hechtman H B. Prosta-
162-1 74.
1547-155 1,
453-46 1.
1980: 46: 125-132.
460-467.

62 A. VERSPRILLE
glandin-mediated decreases in contractility during PEEP. Surg Forum 1979: 39: 163-166.
30. Sunahara F A, Sun C, Harding S. Effects of positive end-expira- tory pressure and counterpressurization on circulating prosta- glandins in the dog. Aviation Space Environ Med 1984: 55: 550-555.
3 1. Dunham B M, Grindlinger G A, Utsunomiya T, Krausz M M, Hechtman H B, Shepro D. Role of prostaglandins in positive end-expiratory pressure-induced negative inotropism. Am J Phy-
32. Durante W, Sunahara F A. Cardiovascular effects of high fre- quency ventilation - the possible involvement of thromboxane. Prostagl Leuk Med 1987: 28: 127-139.
33. Scharf S M, Brown R, Saunders N, Green L H, Ingram R H Jr. Changes in canine left ventricular size and configuration with positive end-expiratory pressure. Circ Res 1979: 44: 672-678.
34. Fewell J E, Abendschein D R, Carlson C J, Murray J F, Rapa- port E. Continuous positive-pressure ventilation decreases right and left ventricular end-diastolic volumes in the dog. Circ Res
35. Fewell J E, Abendschein D R, Carlson C J, Rapaport E, Murray J F. Mechanism of decreased right and left ventricular end- diastolic volumes during continuous positive-pressure ventilation in dogs. Circ Res 1980: 47: 467472.
36. Haynes J B, Carson S D, Whitney W P, Zerbe G 0, Hyers T M, Steele P. Positive end-expiratory pressure shifts left ventricle diastolic pressure-area curves. 3 Appl Physiol 1980: 48: 670-676.
37. Robotham J L, Lixfield W, Holland L et al. The effects of positive end-expiratory pressure on right and left ventricular performance. Am Rev Respir Dis 1980: 121: 677683.
38. Hoffman J I E, Guz A, Charlier A A, Wilcken D E L. Stroke volume in conscious dogs; effect of respiration, posture, and vascular occlusion. 3 Appl Physiol 1965: 20: 865-877.
39. Morgan B C, Martin W E, Hornbein T F, Crawford E W, Guntheroth W G. Hemodynamic effects of intermittent positive pressure respiration. Anesthesiology 1966: 27: 584-590.
40. Wong M, Escobar E E, Martinez G, Butler J, Rapaport E. Effect of continuous pressure breathing on right ventricular volumes. J Appl Physiol 1967: 22: 1053-1060.
41. Moreno A H, Burchell A R, Woude R van der, Burke J H. Respiratory regulation ofsplanchnic and systemic venous return. Am J Physiol 1967: 213: 455-465.
42. Morgan B C, Crawford E W, Winterscheid L C, Guntheroth W G. Circulatory effects of intermittent positive pressure venti- lation. Northw Med 1968: 67: 149-152.
43. Morgan B C, Crawford E W, Guntheroth W G. The hemody- namic effects of changes in blood volume during intermittent positive-pressure ventilation. Anesthesiology 1969: 30: 297-305.
44. Abel F L, Waldhausen J A. Respiratory and cardiac effects on venous return. Am Heart 3 1969: 78: 266-275.
45. Nordstrom L. O n automatic ventilation. Part 11: Haemodyn- amic effects ofintermittent positive-pressure ventilation with and without an end-inspiratory pause. Acta Anaesthesiol Scand (Suppl)
46. Charlier A A, Jaumin P M, Pouleur H. Circulatory effects of deep inspirations, blocked expirations and positive pressure in- flations at equal transpulmonary pressures in conscious dogs. J Physiol 1974: 241: 589405.
47. Versprille A, Jansen J R C, Schreuder J J. Dynamic aspects of the interaction between airway pressure and the circulation. In: Prakash 0, ed. Applied physiology in clinical respiratory care. The Hague: Martinus Nijhoff Publishers, 1982: 447-463.
si01 1981: 241: H783-H788.
1980: 46: 125-132.
1972: 47: 29-56.
48. Jardin F, Farcot J-C, Gueret P, Prost J-F, Ozier Y, Bourdarius J-P. Cyclic changes in arterial pulse during respiratory support. Circulation 1983: 68: 266-274.
49. Versprille A, Jansen J R C. Mean systemic filling pressure as a characteristic pressure for venous return. Pflugers Arch 1985: 405: 226-233.
50. Versprille, A. Pulmonary blood flow and blood volume during positive pressure ventilation. In: Vincent J L, ed. Update in Intensive Care and Emergency Medicine, 3, Update 1987. Brus- sels: Springer-Verlag, 1987: 213-222.
5 1. Versprille A. Pulmonale Zirkulation unter Beatmung. Beitr Anaesth Intensivmed 1988: 25: 102-1 14.
52. Perel A, Segal E, Pizov R. Assessment of cardiovascular function by pressure waveform analysis. In: Vincent J L, ed. Update in Intensive Care and Emergency Medicine, Update 1989, Brussels: Springer-Verlag, 1989: 541-550.
53. Buda A J, Pinsky M R , Ingels N B Jr, Daughters G T, Stinson E B, Alderman E L. Effect of intrathoracic pressure on left ventricular performance. N Engl 3 Med 1979: 301: 45-59,
54. Schrijen F, Ehrlich W, Permutt S. Cardiovascular changes in conscious dogs during spontaneous deep breaths. Pflugers Arch
55. Robotham J L, Cherry D, Mitzner W, Rabson J L, Lixfield W, Bromberger-Barnea B. A re-evaluation of the hemodynamic consequences of intermittent positive pressure ventilation. Crit Care Med 1983: 11: 783-793.
56. Summer W R , Permutt S, Sagawa K , Shoukas AA, Bromberger- Barnea B. Effects of spontaneous respiration on canine left ven- tricular function. Circ Rrs 1979: 45: 719-728.
57. Moulopoulos S D, Sarcas A, Stamatelopoulos S, Arealis E. Left ventricular performance during by-pass or distention of the right ventricle. Circ Res 1965: 17: 484-491.
58. Bemis C E, Serur J R , Borkenhagen D, Sonnenblick E H, Urschel C W. Influence of right ventricular filling pressure on left ven- tricular pressure and dimension. Circ Res 1974: 34: 498- 504.
59. Versprille A, Harinck E, Nie C J van, Jansen J R C, Neef K J de. Functional interaction of both ventricles at birth and the changes during the neonatal period in relation to the changes of geometry. In: Longo L D, Reneau D D, eds. Fetal and newborn cardiovascular physiology, vol. 1: Developmental aspects. New York: Garland STPM Press, 1978: 399-413.
60. Stam H, Versprille A, Bogaard J M. The components of the carbon monoxide diffusing capacity in man dependent on al- veolar volume. Bull Eur Physiopathol Respir 1983: 19: 17-22.
61. Guyton A C, Jones C E, Coleman T G. Circulatory physiology: cardiac output and its regulation. Philadelphia: W B Saunders Company, 1973.
62. Guyton A C, Lindsey A W, Abernathy B, Richardson T. Venous return at various right atrial pressure and the normal venous return curve. Am 3 Physiol 1957: 189: 609-615.
1975: 355: 205-215.
Address: A . Versprille Pathophysiology Laboratory Dept. of Pulmonary Diseases Erasmus University Rotterdam The Netherlands