the prospects for us oil and gas exports - ief · 7/18/2018 · shale has driven us oil and gas...
TRANSCRIPT

The Prospects for US Oil and Gas Exports
Kenneth B Medlock III, PhDJames A Baker III and Susan G Baker Fellow in Energy and Resource Economics, and
Senior Director, Center for Energy StudiesRice University’s Baker Institute
July 18, 2018

Recent History of Crude Oil and Natural Gas
in the US
2

Shale has driven US oil and gas production…• The last 10 years has born witness to a dramatic shift in US oil and gas
production and stimulated a very different view of the future.– Light tight oil production is now about 50% of domestic output and is Texas-centric,
coming from the Permian (40%), Eagle Ford (23%), Bakken (23%), Others (14%).– Shale gas production now accounts for about 63% of all domestic dry gas production,
and is heavily concentrated in the Mid-Atlantic and Gulf Coast regions, coming from Marcellus/Utica (49%), Barnett/Haynesville/Eagle Ford/Permian (35%), Others (16%).
Source: Data from EIA

… causing US oil and gas exports to increase…• Domestic production has been outpacing demand and allowing a significant
increase in exports of natural gas, crude oil and petroleum products.• The US is not “independent” from the global market, and it never will be. But, it
now holds a different place in the global market balance.– Oil: a reliable source of supply driven by commercial interest, not policy.– Natural gas: driving expanded market liquidity that has implications for the future of supply,
demand and pricing.
• The “credible threat” hypothesis and shifts in global oil and gas supply and trade.
Source: Data from EIA
0
1,000
2,000
3,000
4,000
5,000
6,000
7,000
8,000
9,000
Jan-
2000
Jul-2
000
Jan-
2001
Jul-2
001
Jan-
2002
Jul-2
002
Jan-
2003
Jul-2
003
Jan-
2004
Jul-2
004
Jan-
2005
Jul-2
005
Jan-
2006
Jul-2
006
Jan-
2007
Jul-2
007
Jan-
2008
Jul-2
008
Jan-
2009
Jul-2
009
Jan-
2010
Jul-2
010
Jan-
2011
Jul-2
011
Jan-
2012
Jul-2
012
Jan-
2013
Jul-2
013
Jan-
2014
Jul-2
014
Jan-
2015
Jul-2
015
Jan-
2016
Jul-2
016
Jan-
2017
Jul-2
017
Jan-
2018
Crude Oil and Petroleum Product Exports ('000 b/d)
Crude Oil Petroleum Products

… with expanding geographic reach…
Source: Data from EIA
Natural Gas Exports
Crude Oil and Petroleum
Products Exports

… and balance of trade implications
• The “era of abundance” has driven a dramatic shift in the US oil and gas trade balance.
– The US is now a net exporter of natural gas and rapidly approaching the same for combined crude oil and petroleum products.
Source: Data from EIA

Global Implications
7

The global oil supply impact of US shale is significant…
• Production declines have been largely in regions with civil strife, sanctions, or sector mismanagement. Less than a third of observed decline is due to geologic factors.
• Growth in the US (5.5 million b/d) offset the declines due to above-ground factors (5.0 million b/d), and high prices encouraged positive supply response from other regions.
• Production remains robusteverywhere, especially as prices have recovered. Near term market balance hinges largely on global demand.
8Source: BP
Global Supply Changes, 2007-2016

… with paradigm shifting portfolio implications…
• Global production has continued to grow and the distribution of suppliers has shifted with the US providing the biggest source of change.
- OPEC market share has held serve at around 42% since the late 1990s.
- Russian market share has remained steady for the last decade.
- The US has increased its role dramatically…
9
Source: BP
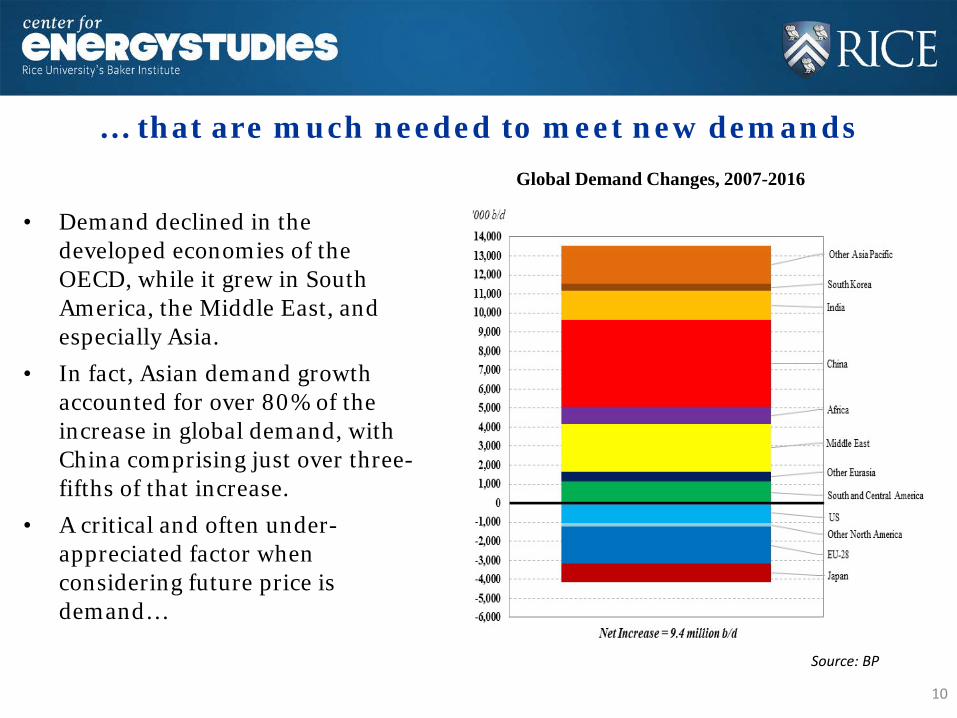
… that are much needed to meet new demands
• Demand declined in the developed economies of the OECD, while it grew in South America, the Middle East, and especially Asia.
• In fact, Asian demand growth accounted for over 80% of the increase in global demand, with China comprising just over three-fifths of that increase.
• A critical and often under-appreciated factor when considering future price is demand…
10
Source: BP
Global Demand Changes, 2007-2016

Will it Last?
Long Run Demand&
Cost, Price, and Productivity:US Shale as a Price Setter?
11

This conversation begins with the future of energy…
12

Energy market evolution a long run story
13
• Economic growth and population drive energy demand. As such, developing nations, not developed nations, will dictate future energy demand growth as well as composition, or the “energy mix”.
• Technology, scale and legacy are each important factors.
- Technology signals how fuels will ultimately compete. This can work in multiple, sometimes competing, directions by raising the efficiency of use of existing fuels and by introducing new competitive energy sources.
- Scale matters because energy systems must accommodate expanding access.
- Legacy of infrastructure and energy delivery systems is the footprint for change.
• Scale and legacy affect the diffusion of new technology.
• Economics matter. The cost-benefit must be favorable for sustainable diffusion of new technologies because, in the long run, fundamentals win.
• Finally, policy and geopolitics shape, and are shaped, by all of the above.
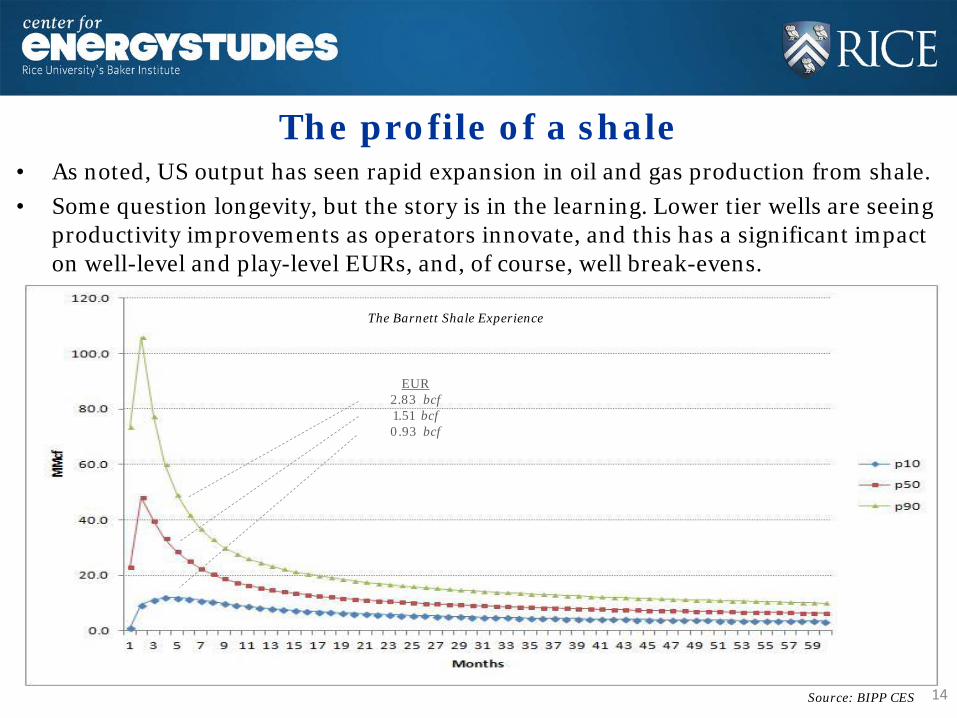
The profile of a shale• As noted, US output has seen rapid expansion in oil and gas production from shale. • Some question longevity, but the story is in the learning. Lower tier wells are seeing
productivity improvements as operators innovate, and this has a significant impact on well-level and play-level EURs, and, of course, well break-evens.
14
EUR2.83 bcf1.51 bcf0.93 bcf
The Barnett Shale Experience
Source: BIPP CES
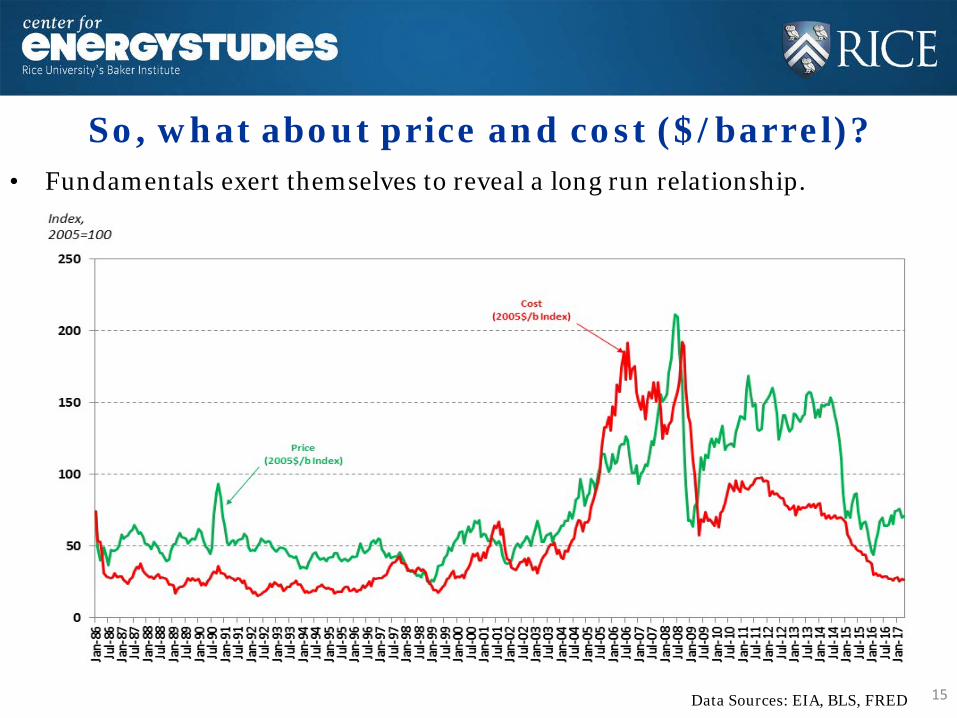
So, what about price and cost ($/barrel)?
15Data Sources: EIA, BLS, FRED
• Fundamentals exert themselves to reveal a long run relationship.

Breaking down US per barrel costs:Cost and productivity per well
16Data Sources: EIA, BLS, FRED

Comments on cost and productivity in US shales
17
• Productivity is a critical element in understanding the responsiveness of shale production to price increases.
- Productivity improvements occurred as operators simultaneously (a) high-graded production efforts toward premium acreage in an attempt to maintain profitable operations and (b) employed different completion techniques (longer laterals, more water and sand, etc.).
- As operators moved into better acreage in an effort to maintain profitable operations, their productivity naturally improved. So, it is unclear to what extent the productivity gains realized over the last two years will persist as drilling ramps up and operators move into more marginal acreage.
- If productivity gains can be maintained, costs per barrel would only increase slightly, which would convey a relatively minor impact to the profitability of new wells drilled, all else equal.
• Of note… recent data indicates the marginal benefit of new drilling and completion techniques may be greater in lower tier acreage than in the “sweet spots”. This is currently under investigation.

Closing Remarks
18
• The US has ample opportunity to increase exports of oil and gas, but price matters.- Too often people forget this is a classic trade question.
- Exports only occur if they are profitable.
• Innovations continue in shale, which will drive long term growth. But, questions about costs related to shifting drilling targets remain. That said, innovation may offset these concerns.
• Natural gas is especially abundant, particularly as associated gas is produced from oil-directed developments.
- Thus, infrastructure will be increasingly important. There is real opportunity in the US midstream, particularly where environmentally-motivated opposition is minimal.
- As a result, expect Texas to lead the way in terms of output growth.
- Expect innovative ways to monetize associated gas to emerge, which will raise profitability of oil-directed developments.
• Shale is NOT a “swing” supply. - It is price responsive and commercially driven; it is not a policy vector.
- It has made global “fringe” supply more elastic, thus having implications for price volatility, the value of inventory and spare capacity, and the role of OPEC.

A parting question: does history repeat itself?
19
• The early 1980s was a period of robust promise for renewable energy and distributed generation. Why?
- High oil prices and energy security.
- Natural gas supply concerns.
• What happened?- Incumbent fuel costs fell and efficiency
increased.
- Fixed costs of adoption matter.
- Coal expanded.
• How is the present different?- Renewables costs are lower and coal is
encumbered, each aided by policy.
- Energy and environmental security.
- Natural gas supply is robust.
• Are recent developments lasting?


Disclaimer: Forecasting 101 – Precision is Folly!• Long term price projections are rarely accurate, and appear adaptive. • Too much emphasis on the recent past, can ignore long run fundamentals.• “The best cure for high (low) prices is high (low) prices”
Source: US EIA

Selected previous and ongoing CES research• 2011 study of the prospects for and implications of US LNG exports.• 2015 study on the effects of the restrictions on oil exports from the US
focused on the interconnectedness of crude oil prices and the market implications of constraints on trade.
• 2015 study on the macroeconomic implications of LNG exports from the US focused global gas market developments as a determinant for commercially viable US exports.
- Since 2002, CES researchers have published a variety of studies and journal articles on the evolution of natural gas markets and the role of shale, trade, and LNG, as well as the nature of pricing and contracting.
• Ongoing study aimed at developing a framework for understanding commodity markets in general, with a focus on identifying “signposts” for market evolution. Learnings will be applied specifically to LNG markets.
• Ongoing work related specifically to oil market evolution, with focus on the roles of inventory and OPEC for short-term and long-term market balance.
• This all is or will be available on the Baker Institute website.
A Snapshot View of Long Run Energy Demand
23

Global GDP by Country
24Data Sources: World Bank, PWT, IMF, BIPP CES

Global Population by Country
25Data Sources: World Bank, UN

Total Primary Energy Requirement by Country
26Data Sources: IEA, BIPP CES

Oil Demand by Country
27Data Sources: IEA, BIPP CESNote: The reference case assumes EVs are 5% and 15% of all new sales by 2023 and 2030, respectively, up from 1% today displacement of 2.1 million b/d by 2030.

Natural Gas Demand by Country
28Data Sources: IEA, BIPP CESNote: Natural gas demand growth is driven primarily by growth in power generation and reinforced by shifting market structure different impact in developing nations vs OECD.

Coal Demand by Country
29Data Sources: IEA, BIPP CESCoal use slows in China, rises in India and some ASEAN nations, but declines in the OECD Economic growth versus new sources.

The Global Energy Mix
30
Charting a new energy future will requireunprecedented levels of investment, and it is aglobal challenge. Firms and governmentsmust figure out the most impactful measuresof capital investment given desired energysecurity and environmental goals. Here iswhere “legacy” and “scale” are paramount.Moreover, global goals will require significantcapital investment in the developing world.

Global TPER by Source
31

Global “Business as Usual” to 2050
32

Some Key Points
Energy efficiency and new technology will be a major part of any path forward. But, regardless of the view of global energy markets, fossil fuels –especially natural gas – will play a significant role in the global energy mix for the next few decades.
Much of the projected energy demand growth over the next 2-3 decades will be in developing Asia, where there is a paucity of resource. Price will dictate energy choice, so cost reductions for all energy types will be paramount in an increasingly competitive energy landscape.
Shale in the US has been paradigm shifting for both natural gas and crude oil markets. Questions remain regarding shale and other frontier resource opportunities outside the US. Nevertheless, when examining the oil and gas future, there appears to be an important and expanding role for the Western Hemisphere.
33

US LNG as an Instigator of Change
34

North American Natural Gas Supply• Including all gas resources, there is about 2,500 tcf available at wellhead
prices below $6, and 1,700 tcf at well head prices below $4. So, North America is likely to be a driver of global gas market developments.
Source: Baker Institute CES Research

LNG Trade*
• LNG exports increase in multiple locations, with the US emerging as the 3rd
largest LNG exporter in the world behind Australia and Qatar, and…
36
• … new consumers enter the market as global demands increase. The market continues to deepen, altering trading paradigms.
* Data depicted are from the CES/Oxford study completed for the US DOE, “The Macroeconomic Impacts of Increased US LNG Exports.”

Prices*
* Data are from the CES/Oxford study completed for the US DOE, “The Macroeconomic Impacts of Increased US LNG Exports.”
Select Global Price Spreads
• US price remains among the lowest in the world.• Note, the long run price in the reference case is contingent upon the long run cost
environment. Note that costs are currently below this level, exacerbated by recent lower rig activity and weak global demand.
• Scenario analysis indicates the outlook for price level can vary, but spreads are not affected similarly as greater global trade establishes regional price relationships.
Select Global Prices

How have LNG Markets Evolved?
Source: GIIGNL
• LNG trade has almost tripled in the last 17 years...

Who is Buying?
Source: GIIGNL
• In addition to the market being almost 3x larger, the composition of LNG importers has changed significantly.

Who is Selling?
Source: GIIGNL
• The composition of LNG exporters has also changed significantly.

Spot Market Development?
Source: GIIGNL
• Spot and short term trades are taking a larger share of the market.

Spot Trading and Market Depth
Sources: Data from GIIGNL and Analysis by Peter Hartley, “Recent Developments in LNG Markets and Possible Implications for the Future”
• As markets deepen, spot transactions grow. Economic theory suggests that spot trading will grow with market depth. This is supported by data and indicates a rapidly evolving global LNG market.

A Comment on EVs
43

The Example of Electric Vehicles• “After 2020 is when EVs will start to destroy oil demand.” This is a common statement. But,
what impact will EVs actually have on global oil demand?
• We must first address adoption rates and total vehicle stock growth.
44
• The CES reference case depicted assumes EV sales expand to 27x current levels by 2030 and 70x current levels by 2040. Through 2040, this is an annual growth of 19.4%.
• The growth rate of EVs will depend on things such as
- battery cost and supply chain rigidities.
- consumer preferences, especially in emerging markets.
- EV infrastructure deployment charging and assembly.
- ICE efficiency, fuel price, etc.
Note: The calculations assume 12,000 mpy and 25 mpg vehicle displacement and Gompertz-type adoption. Note that this puts the calculations on the high side, particularly if early adopters are displacing more efficient vehicles.
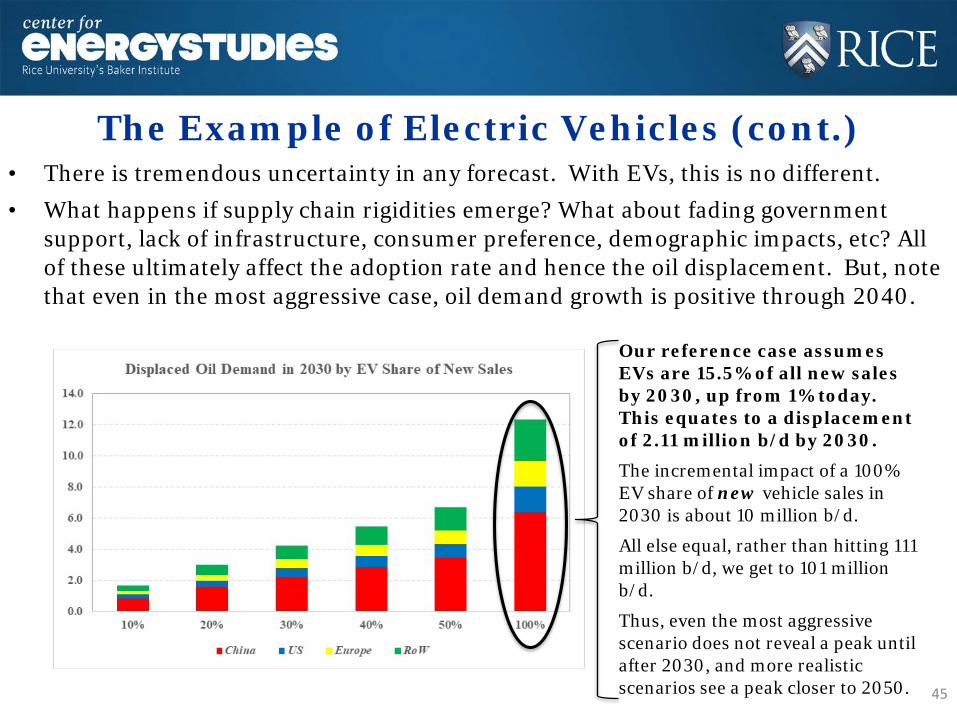
The Example of Electric Vehicles (cont.)• There is tremendous uncertainty in any forecast. With EVs, this is no different. • What happens if supply chain rigidities emerge? What about fading government
support, lack of infrastructure, consumer preference, demographic impacts, etc? All of these ultimately affect the adoption rate and hence the oil displacement. But, note that even in the most aggressive case, oil demand growth is positive through 2040.
45
Our reference case assumes EVs are 15.5% of all new sales by 2030, up from 1% today. This equates to a displacement of 2.11 million b/d by 2030.
The incremental impact of a 100% EV share of new vehicle sales in 2030 is about 10 million b/d.
All else equal, rather than hitting 111 million b/d, we get to 101 million b/d.
Thus, even the most aggressive scenario does not reveal a peak until after 2030, and more realistic scenarios see a peak closer to 2050.

An Additional Comment on Crude Oil Price
46

Separating SR and LR Price Movements:Short Term Price Floors
Source: EIA, Rystad, author calculations
• Unexpected demand reductions and geopolitical premiums result in inventory build and, eventually, price collapse. Price must cover variable costs, but low price will slow investment until output declines and demand recovery eliminates inventory overhang.
Recent Price Lows

Separating SR and LR Price Movements:Long Term Price Floors
Source: EIA, Rystad, author calculations
• Price must recover to incentivize new investment. But, to what level? • Cost is dynamic, so understanding the drivers of cost is critical. The graph below is a snapshot.
Recent Price Lows

Separating SR and LR Price Movements:Dynamic Costs and Price Implications
Source: EIA, BLS, Rystad, author calculations
• Supply-demand imbalances trigger price and investment cycles. • Predicting price is a inexact, and the long run is dynamic!