the prospects for coal-fired power generation in … prospects for coal-fired power generation in...
TRANSCRIPT

1The Prospects for Coal-fired Power Generation in Saudi Arabia
The Prospectsfor Coal-firedPower Generationin Saudi Arabia
Walid Matar, Rodrigo Echeverri, and Axel PierruDecember 2015 / KS-1528-DP022A

2The Prospects for Coal-fired Power Generation in Saudi Arabia
About KAPSARC
Legal Notice
The King Abdullah Petroleum Studies and Research Center (KAPSARC) is an independent, non-profit research institution dedicated to researching energy economics, policy, technology, and the environment across all types of energy. KAPSARC’s mandate is to advance the understanding of energy challenges and opportunities facing the world today and tomorrow, through unbiased, independent, and high-caliber research for the benefit of society. KAPSARC is located in Riyadh, Saudi Arabia.
© Copyright 2015 King Abdullah Petroleum Studies and Research Center (KAPSARC). No portion of this document may be reproduced or utilized without the proper attribution to KAPSARC.

3The Prospects for Coal-fired Power Generation in Saudi Arabia
Almost all of Saudi Arabia’s electric power generation is fueled by oil and gas. Plans for future capacity envisage nuclear and renewables supplementing this mix and freeing up oil for other revenue-generating opportunities. Coal-fired generation has been promoted in some Gulf
Cooperation Council (GCC) countries but not, so far, in the Kingdom. Our analysis finds that:
At current administered prices of oil and gas, other resources of energy such as solar, nuclear, or imported coal are not competitive for power generation.
If decisions were made based on deregulated oil and gas prices:
• with the reference coal price, only moderate levels of coal-fired capacity would be introduced. If the remaining capacity were made up of nuclear and solar, this would result in lower Saudi CO2 emissions from power generation than under a ‘business as usual’ scenario.
• with the low coal price, CO2 emissions in 2030 cannot be maintained at their current level since coal, rather than solar and nuclear, is used to displace oil and gas from the generation fuel mix.
Some forecasts of coal markets anticipate significant increases in real export prices, which would make coal-fired power generation unattractive compared with constructing nuclear power.
Key Points

4The Prospects for Coal-fired Power Generation in Saudi Arabia
Our analysis provides the following insights:
It is not economically viable for local utilities to invest in coal-fired steam capacity and to import coal when the domestic prices of other fuels remain fixed at today’s levels.
When decisions are based on deregulated fuel prices and the utilities do not anticipate higher coal prices in the long term, the relatively lower price of steam coal makes it economically ideal for the power sector to meet part of the base load using coal-fired plants.
Our model suggests up to 8.9 GW of supercritical coal plants would be constructed by 2030, based on reference coal price projections. This corresponds to 26 million tons of annual coal imports. The coal-fired capacity built and its utilization levels are sensitive to the coal import price.
We also examine the effects of preventing the construction of coal plants when fuel prices are deregulated. We find small deviations in the overall economic benefits, indicating that, even without coal, the deployment of other technologies can still be a viable option for decision-makers. The electricity that would be supplied by coal plants until 2030 is then mostly produced by nuclear plants and some solar thermal capacity.
If power utilities anticipate increasing long-term coal prices, then coal ceases to be an attractive option. In this sense, coal-fired generation can be viewed as a transitional base load technology until nuclear can compete with it. In the constant price scenario, coal continues to be an attractive option until the end of the horizon.
Due to constrained natural gas supply, substantial quantities of crude oil are burned to satisfy electricity demand in Saudi Arabia.
The Electricity & Co-generation Regulatory Authority (ECRA) (2014) reported that crude oil and refined products constituted 54 percent of the fuels used to generate electricity in 2013. In addition, the low administered oil and gas prices offered to utilities do not encourage the deployment of alternative power generation technologies. As we look ahead, Saudi decision-makers have expressed interest in evaluating the displacement of oil by adding other fuels and technologies to the domestic power generation mix.
Several countries in the region have already shown willingness to use coal for electricity generation. In this paper, we explore the potential role of coal in the Saudi power system. We use the KAPSARC Energy Model for Saudi Arabia (KEM-SA) that now includes supercritical coal steam plants as a prospective technology. The analysis covers the period from 2015 until 2030. Projections of macroeconomic parameters and market prices used to inform our policy scenarios are derived from Oxford Economics’ Global Economic Model and Global Industry Model.
We assess the economic feasibility of using coal in two policy scenarios:
A scenario where we maintain the current pricing policies throughout.
A scenario where industrial fuel prices are immediately deregulated. Transfer prices of fuels between sectors are raised to world market equivalents, but prices for households are kept unchanged.
Summary
5The Prospects for Coal-fired Power Generation in Saudi Arabia
In the deregulated scenario without coal in the mix, we estimate cumulative CO2 emissions between 2015 and 2030 that are 24 percent lower than under the reference coal price case, or about 670 million tons. However, based on the short-run coal price projections, if coal is incorporated in the energy mix then CO2 emissions increase, but are still lower than the ‘business as usual’ trajectory. Higher penetration of coal-fired capacity resulting from low coal prices in the long-run could potentially produce higher than desired emission levels, which could be a key factor in assessing the viability of coal-fired generation.
Summary

6The Prospects for Coal-fired Power Generation in Saudi Arabia
The Regional Interest in Coal for Power Generation
Saudi Arabia and the greater Gulf region have not been endowed with large coal reserves. As a result, and given the relatively low
domestic prices of other fuels, coal has not been part of the Saudi energy mix. However, domestic gas production will likely not keep up with the forecasted growth in the Kingdom’s electricity demand. Similar considerations have encouraged countries in the GCC region to look for alternative fuel resources for power generation.
Matar et al (2015a, 2015b) and Matar (2015) previously used KEM-SA to investigate the effects of reforming industrial fuel prices and residential energy efficiency in Saudi Arabia. In a static analysis, they found that more than 850,000 barrels per day of crude oil could have been saved in 2011 by changing industrial fuel prices and introducing investment credits for alternative power generation technologies. They later explored the effects of similar fuel pricing policies in an analysis from 2015
to 2032, particularly looking at encouraging price induced investments in renewable and nuclear power generation technologies in Saudi Arabia. As an extension to the previous analyses, we here investigate the viability of importing coal for electricity generation.
Some countries in the Arabian Peninsula already import coal for industrial production, motivated by the limited gas supply and the need to provide reliable supply of fuel for electricity generation. In the United Arab Emirates (UAE), Fujairah Cement operates a 40-MW coal-fired power plant to support its production, and other cement plants currently use imported coal to produce clinker, as reported in McCloskey Newswire (2015). Yemen and Kuwait also use small quantities of imported coal for cement production. As shown in Figure 1, coal has so far been mainly imported from South Africa and Indonesia, with small quantities of the fuel also sourced from Australia.
0.0
0.5
1.0
1.5
2.0
2.5
3.0
3.5
4.0
2003 2004 2005 2006 2007 2008 2009 2010 2011 2012 2013 2014
Million tons
South Africa Australia IndonesiaKuwait, 0.34
UAE, 2.97
Yemen, 0.38
Figure 1 – Coal imports in the Arabian Peninsula
Source: IHS McCloskey, KAPSARC analysis

7The Prospects for Coal-fired Power Generation in Saudi Arabia
Logistics are favorable for bulk commodity trade in the region. Saudi Arabia has access to deep water ports in the Red Sea, which facilitate the use of large Capesize bulk carrier vessels of up to 16 meters in draft and would potentially result in relatively low coal transportation costs. Access to the eastern coast might be more limited due to draft restrictions, but Panamax or Supramax vessels could be used, albeit with slightly higher transportation costs per ton.
A more diverse energy mix in the United Arab EmiratesThe Dubai Integrated Energy Strategy 2030 showed the Emirate’s ambition to diversify its power generation mix. The initial electricity mix targets called for 5 percent solar, 12 percent coal, 12 percent nuclear power, and 71 percent natural gas by 2030. As shown in Figure 2, the Dubai Electricity and Water Authority (DEWA) (2015) increased the target for renewables from its initial plan, slightly reducing the share of coal to 7 percent. The target
to diversify the power generation mix would be an improvement on the situation in 2010, when gas-fired plants generated 99 percent of the electricity.
Instead, the curve represents the long run cost of constructing and operating the various projects over their 20-year useful lives. The average LCOE for Spanish commissioned wind projects in our dataset is €84/MWh, while the median is €77.5/MWh.
LCOE varies by geography, as a result of the different conditions in different locations. We plotted the projects on a map, as shown in Figure 2. The capacity of each project is represented by the size of the dot, while the band in which the LCOE falls is represented by the color of the dot. The lighter the green, the lower the unit cost of the electricity provided by the project and the darker the red, the higher the unit cost provided by the project. The lowest cost projects are in the north and southeastern parts of Spain. On the other hand, the center of the country has poorer wind resources, and projects there are more expensive per unit of generation.
The Regional Interest in Coal for Power Generation
0%
20%
40%
60%
80%
100%
2010 2020 2030
Share of electricity
gen
eration
by inpu
t
Solar Nuclear Coal Diesel Natural gas
Figure 2 – The planned electricity mix in Dubai
Source: DEWA (2015)

8The Prospects for Coal-fired Power Generation in Saudi Arabia
As part of its Energy Strategy plan, DEWA tendered for the construction of a clean coal independent power producer in April 2014. This power plant will be part of the Hassyan complex, which is planned to become one of the largest power parks in the world with a capacity of 9 GW. The facility will include a 1.2-GW ultra-supercritical coal-fired plant. In May 2015, bids for the engineering, procurement and construction contract were opened, with a lowest price of 5.17 ¢/kWh (US) for a 1.2-GW plant and 4.90 ¢/kWh for a 1.8-GW plant (Ballard (2015), MEES (2015)).
The use of coal has raised concerns over carbon dioxide emissions. The possible implementation of carbon capture and storage (CCS) for the Hassyan power plant has been discussed but no decision has been made. It is also unclear whether the project will be awarded as a CCS-ready plant, with plans to include CCS at a later stage. The Gulf region is participating in the development of CCS technologies with the Uthmaniyah project in Saudi Arabia and the Abu Dhabi CCS project in the UAE. In both of these cases, carbon is captured and used for enhanced oil recovery (Global CCS Institute (2014, 2015)). Successful development of this technology can help significantly reduce the impact of carbon emissions from coal and could help public acceptance of the construction of coal-fired power plants in the region.
Egypt explores the use of coal to meet power demand Egypt has also been considering coal to mitigate its electricity supply challenges. The Egyptian power mix is currently composed of fossil fuels and renewable energy sources, with 88 percent of total installed capacity burning oil and gas. With declining hydrocarbon production domestically and electricity demand growing at 6 percent annually, the country
intends to diversify its energy mix by increasing the share of renewables and possibly introducing coal-fired generation.
In April 2014, Egypt’s cabinet approved the use of coal to generate electricity. The move was seen as supporting the local cement industry, a sector that is responsible for 10 percent of all industrial energy use in Egypt. The energy-intensive cement companies are the first affected by gas cutoffs because priority is given to power generators in order to avoid public unrest, according to Daily News Egypt (2015).
The Egyptian government has announced preliminary plans for four coal-fired power projects totaling 15.6 GW of generation capacity. These projects aim to use coal for 20 percent of the electricity generation, which would reduce dependence on oil and gas and lower electricity generation costs. The use of coal in Egypt could help alleviate the current energy shortages, but it will not come without public resistance, as reported by Reuters (2014). However, a reliable source of base load power is so greatly needed that the compromise might be worthwhile for the Egyptian government.
A More Diverse Energy Mix in The United Arab Emirates

9The Prospects for Coal-fired Power Generation in Saudi Arabia
Introducing Steam Coal and Coal-Fired Power Plants in KEM-SA
A description of KEM-SA and past model developments have been documented by Matar et al (2014, 2015a, 2015b). In this
paper, we have added supercritical coal-fired steam plants to the set of technologies already present in KEM-SA. Based on estimates published by the Energy Information Administration (2013), the plants are assigned a heat rate of 8,800 Btu/kWh. Other operational, cost and investment characteristics are detailed in Appendix B.
Due to South Africa’s status as one of the world’s leading coal exporters and the current use of South African steam coal in other GCC countries, we assume in our scenarios that bituminous steam coal would be imported through Jeddah’s Islamic Port from South Africa’s Richards Bay Coal Terminal. Free on board (FOB) price projections for South African steam coal are made using the baseline case in Oxford Economics’ Global Industry Model (GIM). Freight costs are added to the FOB price based on Capesize coal transport from Richards Bay to India’s west coast, a major coal trade route, and normalized for distance.
Using the plants’ thermal efficiency and an energy density of 24.7 megajoules per kg (5,900 kcal per kg) for future steam coal exported from South Africa (Eberhard (2011)), we estimate a fuel use rate for the plants of 376.2 tons per GWh of electricity.
Scenario descriptionsThe effects of policy options are assessed from 2015 until 2030. The 15-year horizon allows us to fully consider the portfolio of power generation technologies in KEM-SA, specifically accounting for the long lead-time for nuclear plant construction and the decreasing costs of renewables. To find
the equilibrium for every year until 2030, as described by Matar et al (2015b), the simulations are performed using a moving five-year optimization horizon for each sector until there are less than five years remaining in the 15-year period. At that point, the optimization horizon decreases linearly until the last year, which is treated as a single long-term year. This planning framework is a compromise between ‘myopia’ and ‘perfect foresight’ into the future. In all scenarios, current transportation fuel and electricity prices are unchanged in real terms for end-consumers and no cap is imposed on the quantity of imported coal. All prices are in 2013 U.S. dollars.
Macroeconomic projections used to inform the scenarios are derived from Oxford Economics’ Global Economic Model (GEM) and GIM. Appendix B describes the set of data used for projecting macroeconomic parameters, such as economic growth, oil and coal prices and domestic demand for industrial goods. Oxford Economics foresees coal prices rising strongly in real terms. The current set of projections shows higher natural gas supply and a lower oil price than was used by Matar et al (2015b).
Current policy (baseline)In this scenario, we keep the current administered prices of fuels purchased by the industrial sectors constant in real terms until 2030; these prices are summarized in Table 1. For simplicity, we take the projected domestic gas supply in each year and allocate it to the consuming sectors based on their shares of consumption in 2011. This assumption may result in excess supply in some consuming sectors over time since the demands for the sectors’ products do not grow at the same rate and the technology stock may change over time. Any excess gas is diverted to the power sector in the same region it is not used.

10The Prospects for Coal-fired Power Generation in Saudi Arabia
Current policy (baseline)
Table 1: Administered fuel and feedstock prices for the industrial sectors in Saudi Arabia
Sources: Council of Ministers Resolution No. 55 and Electricity & Co-generation Regulatory Authority (ECRA)). All prices in 2013 U.S. dollars.
Administered fuel and feedstock prices for the industrial sectors in Saudi Arabia
Fuel Price
Methane and ethane 0.75 $/MMBtu
Arab Light 4.24 $/bbl
Diesel 0.65 $/MMBtu
Heavy fuel oil 360 cSt 0.36 $/MMBtu
When fuel prices are administered, we stipulate that future consumption of heavy fuel oil (HFO) and diesel for electricity production and other industrial processes cannot exceed the levels observed in 2011. This restriction is lifted for the use of HFO in steam plants with desulfurization.
Immediate deregulationBeginning in 2015, sectors purchase crude oil and refined products at international market prices and natural gas at the domestic market clearing price. No sectoral gas quotas are required in this scenario as available gas flows freely to where it adds the most value. To honor existing long-term contracts between petrochemical firms and the upstream sector, however, the quantities of methane and ethane purchased by the petrochemicals sector in 2014 are priced at $0.75 per MMBtu for the entire
horizon. The price paid by the power sector for steam coal is set as equal to the marginal cost of its delivery from the western region.
Testing the sensitivity of the results to the price of coalBecause energy prices generally experience high volatility, we test the impact of multiple coal price paths on the decisions made by the utilities. We apply the projections derived from Oxford Economics’ GEM to establish the reference price trajectory. In addition, a low price scenario maintains the projected price in 2015 constant until the end of the analysis horizon (and would hence reflect the possibility of a market oversupply that might result from policies designed to reduce consumption of coal in OECD markets and China). Figure 3 illustrates the two price paths.

11The Prospects for Coal-fired Power Generation in Saudi Arabia
Introducing Steam Coal and Coal-Fired Power Plants in KEM-SA
405060708090100110120130140
2013 2016 2019 2022 2025 2028
Free on bo
ard price of steam co
al
expo
rted
from
Sou
th Africa (2013 $
per ton
)
Low
Figure 3: The reference and low coal-price projections used to test model sensitivity
Sources: KAPSARC analysis, Oxford Economics’ GIM)
Valuing the oil saved from domestic consumptionIn the Immediate Deregulation scenario, we first assume that crude oil is valued at its international market price. However, since the Kingdom is a major oil exporting country with spare production capacity and large reserves, it often values a barrel of oil saved from domestic consumption at a price that is lower than the international market price.
As a consequence, to study the sensitivity of our results to the value attributed to the oil saved, we also make the alternative (and purely illustrative) assumption that this value is equal to half the market oil price in every year. We call this the reduced oil price scenario. We simulate both scenarios using all combinations of paths for crude oil value and coal price.

12The Prospects for Coal-fired Power Generation in Saudi Arabia
Results and Discussion
The following sections present the model results for both fuel pricing scenarios. We focus on the investment and operation
decisions made by the electricity producing firms as to technology deployment and the fuel mix. Because burning coal produces higher levels of greenhouse gases than other fuels, we also illustrate the results for projected carbon dioxide emissions.
The mix of power generation technologiesFor all scenarios, Figure 4 shows the results for the shares of technologies used to produce electricity in Saudi Arabia until 2030. The projected supply of natural gas is sufficient to warrant a high penetration of combined-cycle power plants in every scenario. Under current policies, the share of combined-cycle plants increases significantly as a result of the installation of new plants and the upgrading of existing open-cycle gas turbines. If low administered prices of fuels to the utilities are maintained, importing coal at an international market price is not economically viable.
When decisions are based on deregulated fuel prices, however, the relatively low prices of coal in the early projection years make it economic for the power sector to invest in supercritical coal-fired steam plants and purchase the imported fuel. As the reference coal prices increase into the year 2030 and nuclear power plants are able to come online after their long construction time has passed, nuclear plants are instead brought online to satisfy part of the base load demand. In this sense, coal-fired generation is treated as a transitional base load technology until nuclear can come online. Photovoltaic plants also become the main renewable technology.
In the Immediate Deregulation case, with reference coal prices and crude oil valued at the market price, the production share of supercritical coal plants in 2030 corresponds to 8.9 GW of capacity (5 percent of total installed capacity); the associated capital investment cost over the time horizon would be around $26 billion. In 2030, this coal-fired capacity would be complemented by around 6 GW of nuclear, 63 GW of combined-cycle plants, and close to 60 GW of PV. Some gas turbines still remain to either serve as backup to PV generation or for operation during the peak hours.
In the deregulation case, where the prices of steam coal deviate from the reference values, the results highlight the substitution effect between coal-fired and nuclear plants. Supercritical coal plants become less costly than nuclear until the end of the analysis period, when anticipated coal prices remain flat at the low 2015 value. The utilities would continue constructing coal plants, resulting in a mix of 27 GW of coal-fired capacity, 51 GW of combined-cycle plants, 31 GW of PV and no nuclear plants.
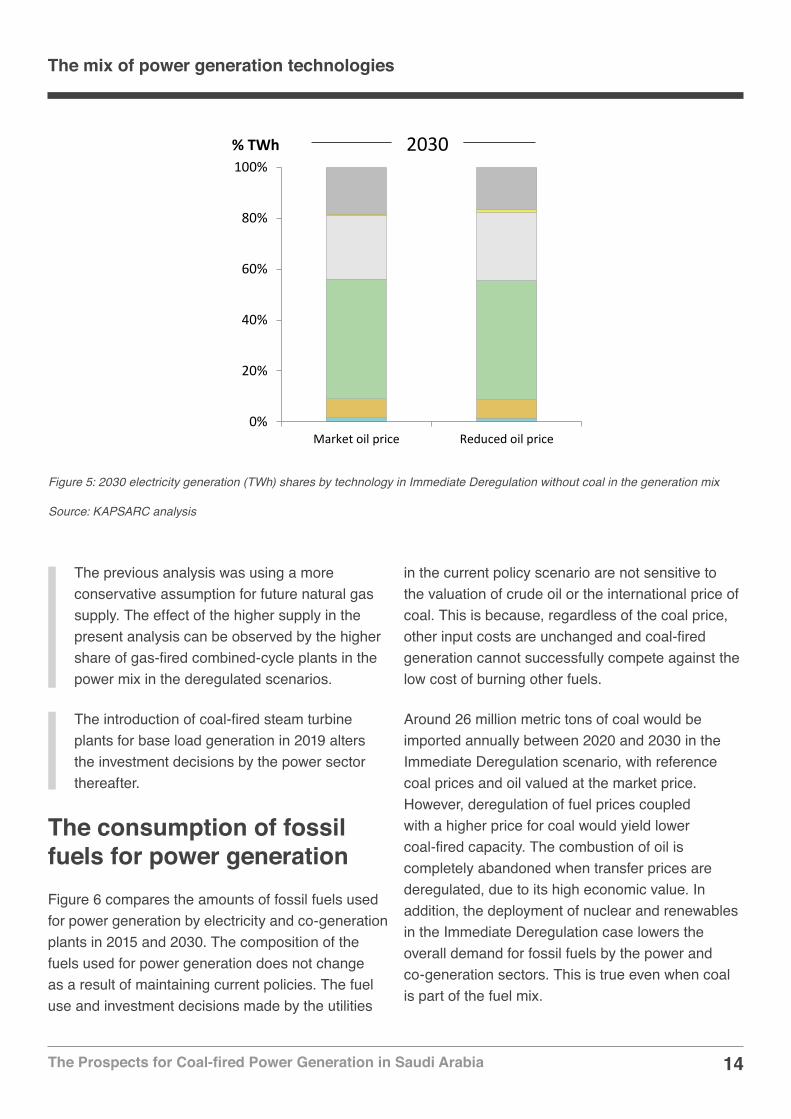
For comparison, we also ran the simulations with no utilization of coal in the Saudi power system. Figure 5 shows that, for the most part, nuclear is used as the substitute technology. In this case, around 16 GW of nuclear would be installed by the year 2030.
The presented results show the optimal technology mix given the economic conditions characterizing each scenario. Matar et al (2015b) previously found different results for the power generation mix projected by studying similar scenarios. The reasons for these differences are traced back to two key features in the model:

13The Prospects for Coal-fired Power Generation in Saudi Arabia
Results and Discussion
0%
20%
40%
60%
80%
100%
Current policy Current policy Market oil price Reduced oil price Market oil price Reduced oil price
Coal Steam Nuclear Wind CSP Photovoltaic CCGTCCGT Cogen Steam Steam Cogen Open Cycle GT GT Cogen
Low coal priceReference coal price
Immediate deregulation% TWh
2020 2015
Figure 4: The share of electricity production (TWh) by technology between 2015 and 2030
Source: KAPSARC analyisis
0%
20%
40%
60%
80%
100%
Current policy Market oil price Reduced oil price Market oil price Reduced oil priceReference coal price Low coal price
Immediate deregulation% TWh 2025
2025 2025
0%
20%
40%
60%
80%
100%
Current policy Market oil price Reduced oil price Market oil price Reduced oil priceReference coal price Low coal price
Immediate deregulation% TWh
2030
14The Prospects for Coal-fired Power Generation in Saudi Arabia
The mix of power generation technologies
The previous analysis was using a more conservative assumption for future natural gas supply. The effect of the higher supply in the present analysis can be observed by the higher share of gas-fired combined-cycle plants in the power mix in the deregulated scenarios.
The introduction of coal-fired steam turbine plants for base load generation in 2019 alters the investment decisions by the power sector thereafter.
The consumption of fossil fuels for power generationFigure 6 compares the amounts of fossil fuels used for power generation by electricity and co-generation plants in 2015 and 2030. The composition of the fuels used for power generation does not change as a result of maintaining current policies. The fuel use and investment decisions made by the utilities
0%
20%
40%
60%
80%
100%
Market oil price Reduced oil price
% TWh 2030
Figure 5: 2030 electricity generation (TWh) shares by technology in Immediate Deregulation without coal in the generation mix
Source: KAPSARC analysis
in the current policy scenario are not sensitive to the valuation of crude oil or the international price of coal. This is because, regardless of the coal price, other input costs are unchanged and coal-fired generation cannot successfully compete against the low cost of burning other fuels.
Around 26 million metric tons of coal would be imported annually between 2020 and 2030 in the Immediate Deregulation scenario, with reference coal prices and oil valued at the market price. However, deregulation of fuel prices coupled with a higher price for coal would yield lower coal-fired capacity. The combustion of oil is completely abandoned when transfer prices are deregulated, due to its high economic value. In addition, the deployment of nuclear and renewables in the Immediate Deregulation case lowers the overall demand for fossil fuels by the power and co-generation sectors. This is true even when coal is part of the fuel mix.

15The Prospects for Coal-fired Power Generation in Saudi Arabia
Results and Discussion
0
1
2
3
4
5
Current policy
Current policy
Market oil price
Reduced oil price
Market oil price
Reduced oil price
Market oil price
Reduced oil price
Coal Crude oil Natural gas Diesel HFO2015 2030Qua
drillionBtu
Immediate deregulation
Reference coal price Low coal price No coal
Figure 6: Fossil fuel use for power generation in Saudi Arabia in 2015 and 2030
Source: KAPSARC analysis
The use of crude oil is prolonged by around a decade when oil is assigned the reduced market value. This prolonged oil use, and the subsequent introduction of nuclear, lower the extent to which coal is used when the coal price follows the reference trajectory. When the coal price tracks lower than the reference projection, some crude oil is still used beyond 2017, but a large proportion of it is displaced by coal-fired generation.
Carbon dioxide emissions in the power sectorGenerating one unit of electricity using coal produces higher levels of carbon dioxide compared with the emissions from the fuels already being used in Saudi Arabia. Figure 7 shows the evolution of CO2 emissions in the power sector over the analysis horizon. We apply the CO2 emission factors published by the International Energy Agency
(IEA) (2013) for fuel combustion in power plants, as displayed in the figure. Although the use of oil is partially replaced by renewable and nuclear power plants when industrial fuel prices are deregulated, their low emissions benefits would be offset by the utilization of coal-fired plants. The integration of nuclear and renewable plants in the reference coal price case still results in lower overall CO2 emissions in the power sector compared with the continuation of current policies. As expected, the amount of carbon dioxide produced in the Immediate Deregulation case increases when coal prices decrease. The continued deployment of coal-fired generation when low coal prices are sustained to 2030 produces slightly higher emissions at the end of the horizon than even the Current Policy scenario.
We also present the model results for CO2 emissions from power plants when Saudi Arabia does not incorporate coal in its power mix. The use

16The Prospects for Coal-fired Power Generation in Saudi Arabia
Carbon dioxide emissions in the power sector
of natural gas and then the higher penetration of nuclear and renewables to take the place of coal-fired generation produce significantly less CO2. Without coal in the mix, we estimate that cumulative CO2 emissions would be 670 million tons lower between 2015 and 2030, compared with a case based on the reference coal price projections. The implications for national emissions of using coal is a key factor in the decision-making process.
Measuring total economic benefitsKnowledge of the costs and benefits associated with the cases analyzed is relevant for decision-makers. This is especially true when we consider different valuations for the oil price. We measure the effectiveness of the alternative scenarios by the magnitude of the economic gains realized relative to
the continuation of current policies. The net annual economic gains are defined as the yearly difference between export revenues and total cost for the aggregate energy system, relative to those observed in the Current Policy scenario. We then calculate the discounted sum of the annual values using a social discount rate of 5 percent to obtain the overall economic gain. Only scenarios applying the same set of crude oil and steam coal price projections are compared against each other.
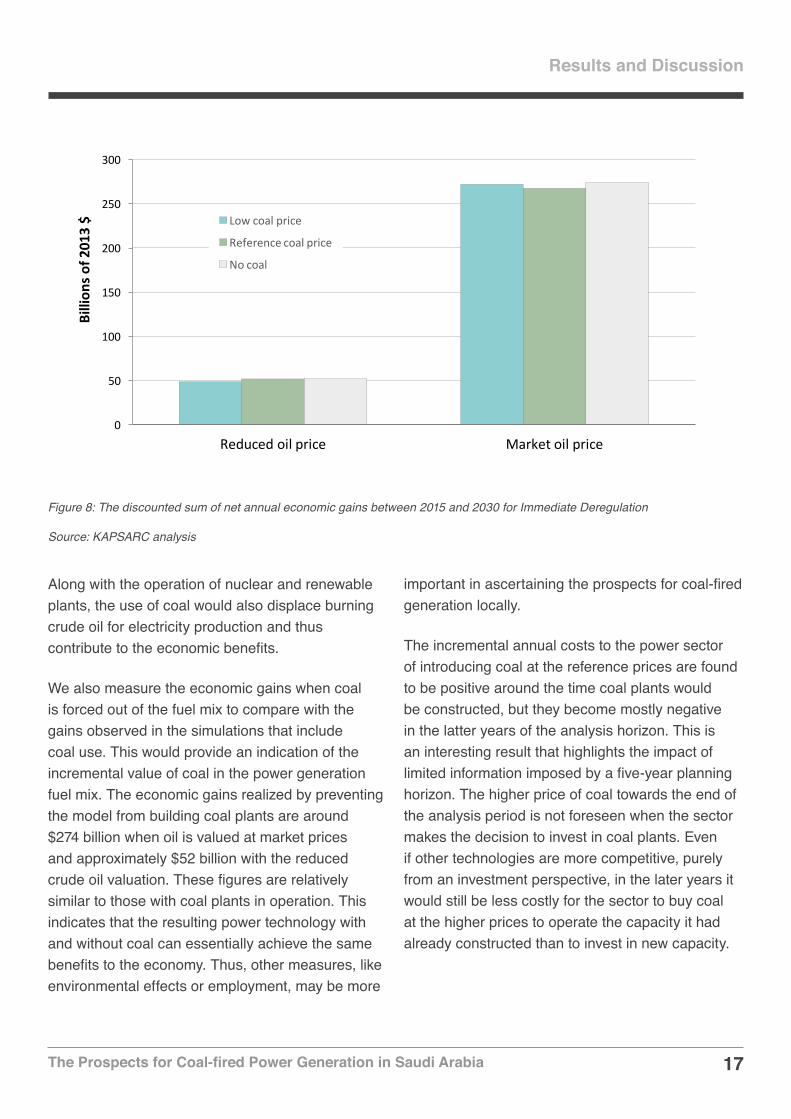
Figure 8 illustrates the magnitudes of the overall economic gain for all scenarios. Although the investment and fuel use decisions are sensitive to the price of the imported coal, the economic gains do not exhibit significant variation. Slightly higher gains are, however, realized at lower prices for imported coal and with the continued deployment of coal-fired capacity. The economic gains are mainly driven by the crude oil saved from domestic use.
50
100
150
200
250
300
2015 2017 2019 2021 2023 2025 2027 2029
Carb
on d
ioxi
de e
miss
ions
by
pow
er se
ctor
(m
illio
n m
t)
Emission factors (g CO2/kWh)Bituminous coal 860Crude oil 635HFO 670Diesel 715Natural gas 400
Market oil price
Immediate deregulation(Low coal price)
Figure 7: Carbon dioxide emissions in the power sector by scenario (valuing oil at the market price)
Source: KAPSARC analysis
17The Prospects for Coal-fired Power Generation in Saudi Arabia
Results and Discussion
Along with the operation of nuclear and renewable plants, the use of coal would also displace burning crude oil for electricity production and thus contribute to the economic benefits.
We also measure the economic gains when coal is forced out of the fuel mix to compare with the gains observed in the simulations that include coal use. This would provide an indication of the incremental value of coal in the power generation fuel mix. The economic gains realized by preventing the model from building coal plants are around $274 billion when oil is valued at market prices and approximately $52 billion with the reduced crude oil valuation. These figures are relatively similar to those with coal plants in operation. This indicates that the resulting power technology with and without coal can essentially achieve the same benefits to the economy. Thus, other measures, like environmental effects or employment, may be more
important in ascertaining the prospects for coal-fired generation locally.
The incremental annual costs to the power sector of introducing coal at the reference prices are found to be positive around the time coal plants would be constructed, but they become mostly negative in the latter years of the analysis horizon. This is an interesting result that highlights the impact of limited information imposed by a five-year planning horizon. The higher price of coal towards the end of the analysis period is not foreseen when the sector makes the decision to invest in coal plants. Even if other technologies are more competitive, purely from an investment perspective, in the later years it would still be less costly for the sector to buy coal at the higher prices to operate the capacity it had already constructed than to invest in new capacity.
0
50
100
150
200
250
300
Reduced oil price Market oil price
Billion
s of 2
013 $ Low coal price
Reference coal price
No coal
Figure 8: The discounted sum of net annual economic gains between 2015 and 2030 for Immediate Deregulation
Source: KAPSARC analysis

18The Prospects for Coal-fired Power Generation in Saudi Arabia
With its constrained supply of natural gas, the Kingdom is looking to adopt alternative fuels and technologies
to mitigate the growing use of crude oil and oil products in industrial sectors. Other oil rich countries in the region already import coal for cement production. The UAE and Egypt have further announced plans to utilize coal to generate electricity.
Accordingly, this paper explores the potential role of coal-fired power generation in Saudi Arabia. We examine the utilities’ operational and investment decisions between 2015 and 2030 under two policy scenarios. We also test the sensitivity of the results to the projected import coal price and the value attributed to the oil no longer consumed domestically.
Our research indicates that, with a continuation of the current administered fuel prices, fuel use and technology investment decisions are not sensitive to the market valuation of crude oil or the market price of coal. This is because, regardless of the coal price, other input costs encountered by the utilities do not change, and coal-fired generation cannot successfully compete against the low prices of other fuels.
When fuel prices offered to industrial sectors are deregulated, utilities use gas to satisfy about half of total electricity production. The remainder is generated using nuclear, solar, and/or coal-fired capacities. Under the reference coal price projections that see increasing prices in the future, supercritical coal capacity is only constructed when the prices are sufficiently low in relative
Conclusions
terms, which is around 2020. As the import price of coal increases, nuclear technology becomes the attractive choice to meet base load demand. Alternatively, utilities continue to build coal plants in place of nuclear capacity when we fix the projected real coal prices at 2015 levels. Excluding coal from the fuel mix results in the construction of nuclear plants to supplement the use of gas. We find that similar economic benefits are achieved with and without coal in the fuel mix. Therefore, utilities can flexibly choose whether or not to use the fuel without sacrificing overall economic gain.
However, coal combustion may raise concerns over carbon dioxide emissions. Even with coal in the mix, the complementary deployment of non-hydrocarbon technologies in a deregulated industrial fuel pricing scenario could produce less CO2 than when current fuel prices are maintained. The power sector’s continued use of oil in the current policy scenario translates into a high growth of CO2 emissions by 2030. By contrast, an Immediate Deregulation scenario without coal would give the benefit of lower CO2 emissions.
Higher levels of coal-fired capacity brought about by lower coal prices could negate any emissions benefits associated with the deployment of non-hydrocarbon technologies unless combined with CCS.

19The Prospects for Coal-fired Power Generation in Saudi Arabia
Al-Yousef, N., 2013. Demand for Oil Products in OPEC Countries: A Panel Cointegration Analysis. International Journal of Energy Economics and Policy 3(2), pp. 168-177.
Ballard, D.D., 2015. DEWA shortlists bids for Hassyan clean coal power plant project. Accessed May 4, 2015. Available at: http://www.pennenergy.com/articles/pennenergy/2015/05/dewa-shortlists-bids-for-hassyan-clean-coal-power-plant-project.html.
CDSI, 2010. Mid-year estimates of the population in administrative areas and provinces (2010-2025), pp. 9. (Released in Arabic)
Daily News Egypt, 2015. NGOs criticise amendments on using coal. Accessed May 19, 2015. Available at: http://www.dailynewsegypt.com/2015/05/19/ngos-criticise-amendments-on-using-coal/.
DEWA, 2015. DEWA reviews bids for first phase of Hassyan clean-coal power plant after receiving lowest international tariff. Accessed May 1, 2015. Available at: https://e-services.dewa.gov.ae/NewsHist/details.aspx?id=0252902600000000000000002529026.
Eberhard, A., 2011. The Future of South African Coal: Market, Investment, and Policy Challenges. Program on Energy and Sustainable Development Working Paper #100, Stanford University, pp. 3.
ECRA, 2014. Activities and Achievements of the Authority in 2013, pp. 85, 110.
ECRA, 2010. Revised Generation Planning Report: Electricity Generation and Transmission Plan (EGTP), pp. 3-6.
Energy Information Administration, 2013. Updated Capital Cost Estimates for Utility Scale Electricity Generating Plants. April 2013, pp. 3-4 – 3-6.
References
Global CCS Institute, 2015. Abu Dhabi CCS project (formerly Emirates Steel Industries (ESI) CCS project). Available at: http://www.globalccsinstitute.com/project/esi-ccs-project.
Global CCS Institute, 2014. Uthmaniyah CO2 EOR demonstration project. Available at: http://www.globalccsinstitute.com/project/uthmaniyah-CO2-eor-demonstration-project-0.
IEA, 2013. CO2 emissions from fuel combustion: highlights. 2013 Edition, OECD/IEA, pp. 43.
IEA, 2014. World Energy Investment Outlook 2014: Power Generation Investment Assumptions. Last Accessed May 30th, 2015: http://www.worldenergyoutlook.org/media/weowebsite/2014/weio/WEIO2014PGAssumptions.xlsx.
IRENA, 2012. Concentrating Solar Power: Volume 1: Power Sector Issue 2/5. Renewable Energy Technologies: Cost Analysis Series, pp. 14.
Matar, W., 2015. Beyond the end-consumer: How would improvements in residential energy efficiency affect the power sector in Saudi Arabia? Energy Efficiency (Article-in-press).
Matar, W., Murphy, F., Pierru A., and Rioux, B., 2015a. Lowering Saudi Arabia’s fuel consumption and energy system costs without increasing end consumer prices. Energy Economics 49, pp. 558-569.
Matar, W., Murphy, F., Pierru A., Rioux, B., and Wogan, D., 2015b. Efficient Industrial Energy Use: The First Step in Transitioning Saudi Arabia’s Energy Mix. KAPSARC Discussion paper KS-1519-DP013A.
Matar, W., Murphy, F., Pierru A., and Rioux, B., 2014. Modeling the Saudi Energy Economy and Its Administered Components: The KAPSARC Energy Model. USAEE Working Paper No. 13-150. Available at SSRN: http://ssrn.com/abstract=2343342.
20The Prospects for Coal-fired Power Generation in Saudi Arabia
References
McCloskey Newswire, 2015. UAE cement buyers step back from thermal market. Accessed May 7, 2015. Available at: http://cr.mccloskeycoal.com/.
Middle East Economic Survey (MEES), 2015. DEWA Deliberates on Coal Plant Bids. Accessed May 8, 2015. Available at: http://archives.mees.com/issues/1581/articles/52719.
Reuters, 2015. Egypt’s cement firms overcome gas shortages by importing coal. Accessed November 5, 2014. Available at: http://www.reuters.com/article/2014/11/05/egypt-cement-coal-idUSL6N0SU2YB20141105.
SAMA, 2014. Saudi Arabian Monetary Agency: Annual Statistics. Available at: http://www.sama.gov.sa/en-US/EconomicReports/Pages/YearlyStatistics.aspx.
Saudi Aramco, 2014. Annual Review 2013, pp. 60-65.
Stratener, 2015. Arab Oil & Gas Directory. Stratégies et Politiques Energétiques, pp. 426-442.
UNIDO, 1998. Fertilizer Manual. Kluwer Academic Publishers. Dordrecht, The Netherlands, pp. 374-375.

21The Prospects for Coal-fired Power Generation in Saudi Arabia
Rodrigo Echeverri
A former Research Fellow analyzing coal markets. He has worked at Adaro Energy in Indonesia and Cerrejon Coal in Colombia and Europe.
Axel Pierru
A Senior Research Fellow and Program Director, economic modeling and analytics, at KAPSARC. He has a doctorate in economics from Pantheon-Sorbonne University (Paris).
About the Authors
About the ProjectWe developed the KAPSARC Energy Model for Saudi Arabia (KEM-SA) to understand the dynamics of the country’s energy system. It is a partial equilibrium model formulated as a mixed complementarity problem to capture the administered prices that permeate the local economy. KEM-SA has been previously used to study the impacts of various industrial fuel pricing policies and improved residential efficiency on the energy economy. In the present paper, we use it to assess the feasibility of a power generation technology.
Walid Matar
A Research Associate developing energy systems models. He holds a master’s degree in mechanical engineering from North Carolina State University.
22Title Here
Appendix
22Comparing Renewables Support Policies: Quantifying the Trade-Offs
Appendix 1
Calibrating the KAPSARC Energy Model to the year 2013 Previous versions of KEM-SA used 2011 as the initial condition. This section describes the steps taken to update model calibration and establish 2013 as the base year.
Discretized power load demands were calculated for each combination of region, season, and day type using the 2013 hourly load profiles obtained from ECRA; Saudi Arabia experienced a weekend change in 2013 that has been taken into account when discretizing the loads by day type. We also acquired the generation and inter-regional transmission capacities through our correspondence with ECRA personnel.
The administered prices of naphtha and propane prices offered to petrochemicals firms in Saudi Arabia were calculated relative to the 2013 naphtha CFR price in Japan. Regional production capacities of petrochemicals were updated using data assembled by Stratener (2015). The production of di-ammonium phosphate was also added; the associated operational characteristics and cost inputs come from UNIDO (1998) and engineering calculations.
In the upstream sector, updated production values for crude oil, methane, ethane and other natural gas liquids were sourced from Saudi Aramco (2014). International market prices for Arabian crude grades were derived from the Saudi Arabian Monetary Agency (SAMA) (2014) and the Middle East Economic Survey.
Updates to regional water desalination capacities and municipal water demand were made using the data reported by the Ministry of Water and Electricity.
The Saudi Aramco Total Refining and Petrochemicals Company (SATORP) plant came online in late 2013. Applying a capacity factor that accounts for this later start in the year, we updated the refining capacities in Saudi Arabia using the IHS Midstream database. Domestic consumption of refined products was taken from SAMA (2014).
Cement production capacities in 2013 were sourced from company financial reports. Values for on-site electricity generation capacity were changed based on recent data published by ECRA (2014). For the industry sub models, the upper bounds on exports and the associated international prices were calculated using data published by the Saudi Central Department of Statistics and Information (CDSI). Domestic demand for cement in 2013 was estimated using data available for total production, export and import.

23Title Here
Appendix
23Comparing Renewables Support Policies: Quantifying the Trade-Offs
Appendix 2
Model assumptions
Costs for power generation technologies
Model inputs for plant costs, lead-times, and design lifetimes are summarized in Table B1. All costs are denominated in 2013 U.S. dollars. Costs and lead-times for supercritical coal-fired steam plants were based on data published by the Energy Information Administration (2013). Costs for other conventional thermal technologies were obtained from ECRA (2010), costs for parabolic trough concentrating
Power TechnologyCapital cost(2013 thousand $/kW)
Fixed O&M cost (2013 $/kW/year)
Non-fuel variable O&M cost (2013 $/MWh)
Lead-time (years)
Design lifetime (years)
Gas turbine 1.48 11.20 4.00 -* 25
Combined cycle 1.74 12.40 3.30 3 30
Conversion of single-cycle gas turbine to combined cycle**
0.24 - - 1 20
Oil- or gas-fired steam 2.12 11.20 1.64 2 35
Oil-fired steam with SO2 Scrubber 2.57 16.70 4.43 2 35
Supercritical coal-fired steam 2.98 38.35 4.53 4 35
Nuclear 4.50 100.00 2.14 7 35
PV 2.62 26.80 0 2 25
Parabolic trough CSP (with eight hours of thermal storage)
7.39 70.00 2.88 3 30
Wind (on-shore) 1.59 39.75 0 3 20
solar power with thermal energy storage were derived from IRENA (2012) and the costs for other renewable plants are taken from the IEA (2014). While the costs of nuclear and conventional thermal technologies were maintained constant in real terms until 2030, we considered decreasing costs for renewable plants based on the rates reported by IEA (2014). The decrease in the cost of renewables reflects learning effects as the technologies mature and their global deployment levels increase. The resulting capital costs for renewables are shown in Figure B1.
Table B1: Model inputs for power generation technologies in 2013
Sources: KAPSARC analysis, ECRA (2010), IRENA (2012), and IEA (2014))

24Title Here
Appendix
24Comparing Renewables Support Policies: Quantifying the Trade-Offs
Projections until 2030Electricity demand growth was estimated by shifting the 2013 loads for every region by the corresponding growth forecast published by ECRA (2010). We estimate future regional municipal water demand using the population projections released by the CDSI (2010).
Projections used for gross domestic product (GDP), industrial gross outputs, commodity prices and hydrocarbon production were specified using the baseline results of the Oxford Economics Global Economic and Industry models; we used the databases released in February and April 2015, respectively. The future domestic demands for petrochemicals, refined oil products and cement were calculated by multiplying the products’ income elasticities by the projected GDP growth. We assumed an elasticity of unity for petrochemicals
and cement. For the basket of oil products, we used a value of 0.58 as estimated by Al-Yousef (2013) for Saudi Arabia. We set future upper bounds on each sector’s exports by subtracting the domestic demand for its goods from its projected gross output.
The growth figures for natural gas and oil production were taken exogenously from GEM. We assumed the splits of crude oil grades in total oil production and methane and ethane in gas supply remained stable over time. We also assumed that Saudi Arabia maintained its policy of not importing or exporting natural gas.
The reference international prices for crude oil until 2030 were calculated using the growth of the real Arabian Light price projected by GEM. The spreads between the prices of other crude oil grades and that of Arabian Light were maintained throughout
!
0
1
2
3
4
5
6
7
8
2013 2015 2017 2019 2021 2023 2025 2027 2029
Capi
tal c
osts
(tho
usan
d 20
13 $
/kW
)
Parabolic trough CSP with terminal
PV
On-shore wind
Figure B1: Capital cost assumptions for renewable technologies over time
Sources: KAPSARC analysis, IRENA (2012), IEA (2014))
Appendix 2

25Title Here
Appendix
25Comparing Renewables Support Policies: Quantifying the Trade-Offs
the study period. The future price of steam coal was scaled by the growth in the price of steam coal in the African region. Table B2 shows the input production levels over the analysis horizon.
We projected the export prices of refined products by keeping the same spreads relative to the oil price observed in 2013 over time. The international prices
2013 2015 2020 2025 2030
Arabian Light crude price (2013 $/bbl) 106.53 54.33 82.03 99.07 105.46
Methane and ethane supply (QBtu) 3.47 3.67 4.19 4.75 5.37
of petrochemicals were scaled in accordance with the growth of the oil price. Since the administered prices of naphtha and propane offered to petrochemical firms are linked to an international market price for naphtha, these administered prices change in the model at the same rate as the projected export price of naphtha.
Table B2: Projected Saudi Arabian natural gas supply and the price of crude oil to 2030
Sources: KAPSARC analysis, GEM
Projections until 2030

26The Prospects for Coal-fired Power Generation in Saudi Arabia
Notes

27The Prospects for Coal-fired Power Generation in Saudi Arabia
Notes

28The Prospects for Coal-fired Power Generation in Saudi Arabia
www.kapsarc.org