the production of novelty in music: a relational...
TRANSCRIPT

WORKING DRAFT—PLEASE DO NOT CIRCULATE
1
The Production of Novelty in Music:
A Relational Perspective
Michael Mauskapf
Kellogg School of Management
Northwestern University
ABSTRACT
Creativity and innovation are central to the process of cultural production, but
what makes certain producers more likely to innovate than others? I revisit the
concept of embeddedness to evaluate how different dimensions of relational
structure affect the production of novelty in music. Using original data on over
10,000 unique artists and 115,000 songs recorded and released between 1960
and 1995, I estimate how musicians’ social, cultural, organizational, and
geographic embeddedness shape their propensity to create novel products.
Results from a series of Relational Event Models (REM’s) suggest that artists
who are highly culturally and geographically connected are more likely to create
and release novel songs, especially when they span multiple genres, are women,
or are in the early stages of their careers. Surprisingly, variations in social and
organizational embeddedness do not significantly affect this outcome. These
findings produce new insights into the production of novelty in music, and
encourage us to reconsider the multiplexity of embeddedness and its role in
organizing innovation.
WORKING DRAFT—PLEASE DO NOT CIRCULATE
2
INTRODUCTION
“All music is collaboration. Even if you are a one-man band, writing and recording all the
parts in your bedroom, you are collaborating with the ideas of your predecessors and your
peers, both consciously and subconsciously...” (Matty Kuras, 2016)
Creativity and innovation are central to the professional activity of cultural producers. The
work of musicians, painters, writers, stage directors, chefs, and even academics is concerned in
part with the production of novelty—not only as a means to an end, but as an end in and of itself
(Jones, Lorenzen, and Sapsed 2015). This does not mean that all cultural actors are equally
interested in or oriented toward being “innovative”—most would probably agree that the music
of David Bowie is more novel than the music of Billy Joel, and intentionally so—but the
inevitability of such variance highlights the role novelty and innovation play in the everyday life
of cultural production.
But what makes certain actors more likely to produce novelty than others? While there has
been considerable research on the successful diffusion of innovation and the link between
innovation and performance, both for individuals (e.g., Uzzi et al. 2013) and organizations (e.g.,
Ahuja 2000; also see Berlyne 1971), we know less about the origins of novelty itself, which
serves as a critical first step in the emergence of innovation (Ruef 2002; Seidel and Greve 2016).
Much of the research on this topic focuses on individual creativity (Schumpeter 1942; Simonton
1984), or the dynamic capabilities of firms (Daneels 2002; Eisenhardt and Martin 2000), but
more recent scholarship has emphasized the generative role of collaborative interaction in teams
(Ruef 2010; Uzzi and Spiro 2005) and networks (Burt 2004; Obstfeld 2005). The motivation and
ability to create new things is shaped not only by individual characteristics, but by the
connections between people and the relational structures in which they are embedded. Thus, we
can understand the production of novelty as a process that is shaped by the social structures

WORKING DRAFT—PLEASE DO NOT CIRCULATE
3
constituting organizations, institutions, and markets (Bourdieu 1993; Fligstein and Dauter 2007;
White 1981, 2002).
My goal in this paper is to revisit the concept of embeddedness to evaluate how different
types of relationships between actors provide distinct resources—and generate distinct
opportunities—for innovation. Drawing from work on the production of culture, the sociology of
entrepreneurship, and the foundations of social capital, I begin by developing a multi-
dimensional framework to understand how cultural producers are embedded in their broader
social environment. Empirical research on social networks has largely focused its attention on
how direct or indirect social ties structure economic action (Burt 1992, 2005; Granovetter 1985;
Uzzi 1996, 1997), but I argue that there are other channels through which producers are
consequentially connected and influenced. As the quote at the beginning of this paper suggests,
the act of “collaboration” need not occur through direct contact or conscious borrowing. Scholars
have long recognized the multiplexity of networks (Emirbayer and Goodwin 1994; Pachucki and
Breiger 2010; Padgett and Powell 2012; Zukin and DiMaggio 1990), yet our understanding of
how different types of network embeddedness generate opportunities for innovation is limited.
In the analysis that follows, I measure and test the effect of four distinct types of
embeddedness—social, cultural, organizational, and geographic—on the production of novelty in
music. I am not the first scholar to recognize multiple types of embeddedness and their roles in
organizing social behavior (e.g., Zukin and DiMaggio 1990; Goldberg et al. 2016; Ruef 2002),
but no one to my knowledge has generated a typology to understand how different dimensions of
structural constraint independently shape innovation outcomes. To summarize: social
embeddedness is defined by collaboration between actors; cultural embeddedness is a function of
an actor’s position in a network defined by shared category membership; organizational
WORKING DRAFT—PLEASE DO NOT CIRCULATE
4
embeddedness refers to an actor’s connections with others through organizational affiliation; and
geographic embeddedness reflects a network position defined by physical proximity or co-
location.1 Note that, while social embeddedness assumes some kind of direct contact or
collaboration, the other types define “relations” based on positional similarity, shared resources,
or latent associations. Each of these dimensions generates a unique structure that positions actors
in different ways, shaping their propensity to create new and novel products through channels
that are not accounted for in current research.
To test whether and how these different dimensions of embeddedness shape the production
of novelty, I use data from the global music industry, a context in which innovation is
particularly important but poorly understood (Negus 1992; Ratliff 2016). The dataset used for
this analysis was constructed over the course of two years, and describes over 10,000 unique
artists and 115,000 songs recorded and released between 1960 and 1995. The scope and
granularity of this data allow me to (1) construct a measure of product novelty using
algorithmically-derived features summarizing the sonic character of songs, and (2) calculate
dynamic relational measures of artist embeddedness using information about band membership,
genre attributions, record labels, and artist location. I then use these embeddedness measures,
along with a host of artist-level attributes, to predict the relative “hazard” or likelihood of
producing and releasing a novel song. To account for the exact sequence of song release dates
present in the data, I use a series of Relational Event Models (REM’s). This approach allows me
to generate parameter estimates that are sensitive to longitudinal variation as well as robust
1 It is worth pointing out that, unlike some previous treatments of cultural embeddedness (e.g., Goldberg
et al. 2016; Ruef 2002), we view each of these dimensions as a type of “structural” embeddedness, in that
they each reflect characteristics of the configuration of relations between actors. The distinction between
dimensions is predicated on how the ties between actors are drawn, rather than the strength or weakness
of the tie (see Moran 2005); or the more general cultural, organizational, or geographic context in which
social networks exist (see Pachucki and Breiger 2010).

WORKING DRAFT—PLEASE DO NOT CIRCULATE
5
across multiple specifications (Butts 2008; Quintane et al. 2014), thereby recognizing the
historical contingencies of product innovation.
The rest of the paper proceeds as follows. After providing an overview of the relevant
theoretical and empirical research on the social origins of innovation, I unpack the concept of
structural embeddedness, disambiguating the four dimensions described above. I then use extant
theory to generate a series of hypotheses predicting how different types of producer
embeddedness might affect the production of novelty. Most work in this area suggests that low
levels of structural constraint provide advantages for the creation and performance of new ideas,
products, and ventures (Burt 1992, 2004; de Vaan et al. 2015; Fleming, Mingo, and Chen 2007;
Zaheer and Bell 2005). Yet while ample opportunities for brokerage may increase the likelihood
for innovation, there is some evidence that suggests that actors who are highly connected are
more likely to create new products, due to increased access to resources, trust, and legitimacy
(Ahuja 2000). This finding usually focuses on the evaluation of innovation, and is most relevant
in highly normative contexts (Cattani and Ferriani 2008; Rao et al. 2003; Walker, Kogut, and
Shan 1997), but I argue that high levels of social connectedness in different contexts may also
aid the production of novelty in music, where creativity and aesthetic innovation are core tenets
of the field and more-or-less accepted by—and expected of—producers (Becker 1982). Findings
from the REM’s partially support this prediction, and suggest that artists who are highly
culturally and geographically embedded are in fact more likely to create novel products,
especially when they span multiple genres. Variations in social and organizational embeddedness
do not significantly affect this outcome. I conclude by elaborating on these results and discussing
their consequences for understanding how different types of embeddedness structure the “the

WORKING DRAFT—PLEASE DO NOT CIRCULATE
6
typology of the possible” to shape the production of novelty and innovation more generally
(Padgett and Powell 2012: 3–4).
INNOVATION IN CULTURAL PRODUCTION
The “production of culture” perspective in sociology explicitly recognizes the integrated
role of producers, institutions, and their environments in shaping symbolic and material culture
(Hirsch 1972; Peterson 1990; Peterson and Anand 2004; Rubio 2012), and the production of
novelty is an important part of this process. For example, while Becker emphasizes the shared
conventions that lend coherence to domains of cultural production, he also recognizes that “the
limitations of conventional practice are not total. You can always do things differently if you are
prepared to pay the price” (Becker 1982: 33). The “price” here refers to the possible costs
associated with taking artistic risks and producing something that challenges the status quo,
highlighting the performance implications of innovation in cultural markets. Relatedly, work on
cultural entrepreneurship emphasizes the resources and strategies actors deploy to enhance the
legitimacy of their new creations (Lounsbury and Glynn 2001). From this perspective, the
production of novelty only becomes consequential when audiences recognize it as such (Burt
2004).
The study of innovation more generally has followed a similar trajectory, focusing on its
adoption or diffusion rather than its emergence (Seidel and Greve 2016; for early exceptions see
Ahuja 2000; Shan, Walker, and Kogut 1994). Indeed, most organizational research defines
“innovation” as the successful adoption or valuation of some new product, practice, or venture
(Damanpour 1991). In this paper, I focus instead on the creative process that leads to new and
novel products. The production of novelty is an important first steps in the innovation process,
leading to the emergence of new product lines, organizational forms, institutions, and markets
WORKING DRAFT—PLEASE DO NOT CIRCULATE
7
(Padgett and Powell 2012). It also serves as an important signifier of creativity and competence
in fields of cultural production, where “being innovative” is intrinsically valued by peer
producers and critics. Consumers may be less inclined to value novelty for novelty’s sake, but
moderate levels of atypicality can help producers differentiate themselves from their competition
and provide significant ecological advantages (Askin and Mauskapf 2016; Ruef 2000; Uzzi et al.
2013).
Extant research on the origins of innovation in organizations and markets highlights the role
played by individual characteristics, group dynamics, and institutional environments. In the
context of individuals, Dyer and colleagues argue that the ability to learn and internalize the
skills of association, observation, and experimentation will enhance entrepreneurial efforts and
make them more likely to succeed (Dyer, Gregersen, and Christensen 2011). Organizations can
also develop these skills, acquiring dynamic capabilities that enable them to achieve some goal
or outcome, such as producing and selling new products or building new markets (Daneels 2002;
Eisenhardt and Martin 2000). Much of the research in this area, however, has emphasized the
critical role of collaboration in the production of novelty. Through collaboration, individuals and
organizations are able to access the diverse viewpoints, experiences, and resources necessary to
generate innovative solutions to complex problems. This is the primary reason teams and small
groups outperform individuals across so many different contexts , including entrepreneurial
startups (Ruef 2010), the production of scientific knowledge (Uzzi et al. 2013), and Broadway
musicals (Uzzi and Spiro 2005).
Relations, Networks, & Opportunities
Teams and groups may be more likely to innovate than individuals, but the fundamental unit
behind this effect is that of the “relation” (Emirbayer 1997). The proliferation of network science

WORKING DRAFT—PLEASE DO NOT CIRCULATE
8
has highlighted the relational nature of all kinds of social behavior, including creativity and
innovation (e.g., Simonton 1984). Connections between people or organizations represent
opportunities for collaboration, allowing diverse information to be shared and novel ideas to
spread (Ruef 2002). However this “network effect” is not limited to dyadic connections between
actors. Indeed, the field of economic sociology is largely predicated on the idea that social
relationships generate macro-level structures or markets that influence production and
consumption dynamics (Bourdieu 1993; Fligstein and Dauter 2007; White 1981, 2002). These
structures can reflect relationships between producers and consumers, or among producers
themselves (the focus of this paper), shaping individual orientations toward entrepreneurship and
innovation (Ruef and Lounsbury 2007).
Before discussing the concept of structural embeddedness, it is informative to recognize
some of the other ways in which scholars have explored the relationship between social structure
and innovation. Some of our earliest theories of entrepreneurship recognized the importance of
not only the “entrepreneurial actor,” but also the “entrepreneurial opportunity—situations in
which people can create a new means-ends framework for recombining resources” (Shane 2004;
see also Schumpeter 1934). From a sociological perspective, these situations or opportunities are
contingent on, or even defined by, social structure, which creates certain affordances or “action
possibilities” that actors may exploit in their pursuit of innovation (for a cognitive account, see
Gibson 1979). Or, to couch it in less strategic terms: an actor’s position in the broader social
structure exposes them to resources that will affect their motivation and ability to innovate.
There has been a steady stream of research investigating this phenomenon. In the context of
organizational innovation, Powell and colleagues find that, in complex industries where sources
of expertise are dispersed, inter-organizational collaborations form “networks of learning” that
WORKING DRAFT—PLEASE DO NOT CIRCULATE
9
positively affect R&D and firm growth rates (Powell, Koput, and Smith-Doerr 1996). The same
effect occurs within organizations, where actors positioned in integrated collaboration networks
that are high in knowledge diversity are more likely to develop recombinant capabilities
(Carnabuci and Operti 2013). In the context of popular culture, work by DiMaggio (1977; 1982),
Peterson (1990; 2004), and others highlights the determinative role of the production
environment, and the structure of producer networks in particular, in shaping the creation of new
products, genres, and fields. Taken together, these insights highlight the relationship between
innovation and social structure, which is itself “the memory of the social process” (Abbott 2001).
Below, I unpack the concept of structural embeddedness to understand how different dimensions
of this structure affect the production of novelty.
STRUCTURAL EMBEDDEDNESS & THE PRODUCTION OF NOVELTY
As early as 1944, Polanyi argued that economic action was embedded in the social
structures present inside and outside markets. Granovetter (1985) further developed this idea,
defining structural embeddedness as the “contextualization of economic exchange in patterns of
ongoing interpersonal relations.” In this conception, economic transactions are shaped not only
by the quality of relations themselves—what Moran (2005) calls “relational” embeddedness—
but by the configuration of those relations and the way in which they position actors in the
market. Much of the subsequent empirical work on embeddedness has studied its effect on firm
performance (e.g., Uzzi 1996, 1997), peer evaluation (e.g., Cattani, Ferriani, and Allison 2014),
and knowledge transfer (e.g., Reagans and McEvily 2003; Wang 2015).2 For example, Uzzi’s
work on the garment industry in New York City finds that firms engaged in embedded, rather
2 I also recognize that there is a considerable stream of research studying how embeddedness affects
innovation through the presence (or absence) of structural holes (e.g., Burt 1992, 2004, 2005); I review
this work in the section titled Social Embeddedness below.

WORKING DRAFT—PLEASE DO NOT CIRCULATE
10
than arms-length, relationships are more likely to survive and succeed. This advantage only
holds up to a point, however; being too embedded—measured here by the presence of strong ties
between producers—can derail economic performance by insulating firms from diverse forms of
information that exist outside their direct contacts. In their study of the film industry, Cattani and
colleagues (2014) find that producer embeddedness also affects how peers evaluate each other’s’
work, although this effect does not extend to critic’s evaluations.
Note that the work cited above has focused almost exclusively on the “social” dimension of
structural embeddedness, where ties between actors are defined by direct collaboration or
contact. Recent work on the multiplexity of networks suggests, however, that people are bound
together by different kinds of relationships or connections (Boccaletti et al. 2014; Breiger and
Puetz 2015; White, Powell, and Owen-Smith 2003). Not only are social networks historically
and culturally contingent (Emirbayer and Goodwin 1994; Pachucki and Breiger 2010), but
different kinds of networks exist between actors (e.g., Padgett and Ansell 1993). Given the
diversity of social life, it is not unreasonable to assume that actors are likely to have distinct
positions in different kinds of networks, which in turn are likely to have independent effects on
outcomes such as performance, reputation, and innovation (Heaney 2014). At the level of
organizations and markets, Padgett and Powell (2012) argue that emergence is in essence a
function of the coevolution of multiple networks. Yet our understanding of how different types
of structural embeddedness affect innovation is limited.
To address this gap, I identify four types of embeddedness—social, cultural, organizational,
and geographic—and develop predictions for how each influences the production of novelty.
Table 1 provides an overview of each type. It is worth pointing out that each of these dimensions
is “structural,” in so much as they each reflect systems of relations (e.g., ties) connecting actors
WORKING DRAFT—PLEASE DO NOT CIRCULATE
11
(e.g., nodes). While direct social relationships may continue to play an important role in the
production of novelty, it is not the only means by which cultural producers are connected to and
influenced by one another. Different contexts define the content and boundaries of relevant
social comparison in distinct ways, increasing the likelihood of influence through structural
equivalence. I argue that exposure to the same context—whether it be defined culturally,
organizationally, or geographically—will both increase the odds that producers cross paths, and
provide a latent channel through which ideas and resources flow (cf., Podolny 2001).
----INSERT TABLE 1 HERE----
Moreover, I do not claim that these dimensions are exhaustive, or that they represent the
most important types of connectivity for all domains of social life. Nevertheless, extant research
suggests that they comprise important contextual factors in fields of cultural production
(Crossley 2009; de Vaan et al. 2015; Goldberg, Hannan, and Kovacs 2016; Kovacs and Hannan
2015; Lopes 1990; Peterson and Berger, 1971; Phillips 2011, 2013). Nor am I the first scholar to
recognize that distinct dimensions of embeddedness exist. Zukin and DiMaggio (1990) discuss
cognitive, cultural, and political embeddedness in their book on structures of capital, but their
focus remains on how these dimensions shape logics of exchange. They also note that “the time
is ripe…to begin to compare, classify, and develop analytic theories about varieties of informal
social structures” (Zukin and DiMaggio 1990: 18), but few scholars have answered the call (for
exceptions, see de Vaan et al. 2015; Goldberg et al. 2016; Ruef 2002).
Social Embeddedness
Social embeddedness refers to an actor’s position in networks defined by direct social
relations. This dimension is identical to Granovetter’s conception of “structural” embeddedness,

WORKING DRAFT—PLEASE DO NOT CIRCULATE
12
and thus constitutes the most well-theorized and empirically documented relationship with
innovation. The networks in which actors are socially embedded are defined by direct
interaction, which may occur regularly or irregularly. In the case of music, I operationalize this
as an artist’s connections to other artists via shared band membership.
In addition to some of the research cited above, other scholars have directly linked the
concept of social embeddedness to creativity and innovation. The majority of this research
employs Burt’s concept of structural hole, which refers to a gap between two or more individuals
in a network who have complementary sources of information (Burt 1992, 2004). The presence
of structural holes is associated with low levels of social embeddedness or constraint, and
generates opportunities that entrepreneurs and other actors can exploit through brokerage. Robust
empirical findings support the argument that brokerage drives idea generation and reception, the
creation of game-changing products, and innovation in firms through access to non-redundant
information (Burt 2004; Cox, McDonald, Wang, and Hallen 2015; de Vaan et al. 2015; Fleming,
Mingo, and Chen 2007; Zaheer and Bell 2005).
This and other work on structural holes clearly suggests that being embedded in a densely
connected network of social ties hinders creativity. Actors with low levels of constraint are more
likely to encounter diverse ideas and perspectives, which may aid them in their quest to
innovate.3 Thus, I predict:
3 My primary analysis uses degree centrality, rather than constraint, to measure social, organizational, and
geographic embeddedness. I recognize the limitations of this measure, which fails to explicitly account
for the tie structure of a focal actor’s alters, but believe it allows for clearer interpretation of how producer
connectivity affects the production of novelty. Degree is strongly negatively correlated with constraint in
the data (~-0.80), meaning that those actors who are highly connected also tend to have greater access to
structural holes. Supplementary analyses using constraint produce consistent results (models available
upon request). I provide a more thorough rationale for using degree centrality in the Data & Methods
section of this paper.

WORKING DRAFT—PLEASE DO NOT CIRCULATE
13
H1a: Cultural producers who are more centrally connected in networks defined by direct social
relations will be less likely to produce novel products.
Despite the considerable evidence that social embeddedness dampens innovation efforts,
other research makes a competing claim: namely, that being densely connected is positively
associated with the production of novelty. This assertion stems from Coleman’s (1990) work on
network closure, which argues that being embedded provides actors with the social capital they
need to challenge the status quo and engage in innovation (see also Burt 2005). Some empirical
research supports this claim, finding that social embeddedness increases rates of successful
innovation by generating trust, reducing opportunism, and facilitating the enforcement of norms
(Ahuja 2000; Walker, Kogut, and Shan 1997; Tsai and Ghoshal 1998). This work suggests that
the positive effects of embeddedness are strongest when measuring the evaluation of innovation,
rather than the production of novelty per se, or in fields that are highly normative, such as
gastronomy (Rao et al. 2003). In the context of music, I argue that high base rates of creativity,
coupled with an explicit acceptance and expectation of innovation, make structural holes
unnecessary to access non-redundant information. Given the diversity of ideas distributed among
producers, those who are more centrally connected will be more likely to tap into new ideas,
even if their sources are connected to each other. This compels me to make a competing
prediction:
H1b: Cultural producers who are more centrally connected in networks defined by direct social
relations will be more likely to produce novel products.
Cultural Embeddedness
For the purposes of this paper, cultural embeddedness refers to an actor’s position in
networks defined by shared category membership. Alternative definitions have focused on the
WORKING DRAFT—PLEASE DO NOT CIRCULATE
14
presence of trust (Ruef 2002) and linguistic similarity (Goldberg et al. 2016), but I follow Zukin
and DiMaggio (1990), who emphasize the role of shared collective understandings in shaping
social behavior (see also Vilhena et al. 2014). The “cultural” dimension of embeddedness refers
to these collective understandings and the schematic classification structures that organize them
(DiMaggio 1997). Unlike its social counterpart, cultural embeddedness is comprised of relations
that reflect shared context, rather than direct contact. Thus, my conception aligns closely with
work on genres (Lena and Peterson 2008) and categories (Hsu and Hannan 2005), which act as
important signifiers of meaning and community in music (Holt 2007). I operationalize this
dimension as an artist’s connections to other artists via shared genre membership.
To my knowledge, there has been no empirical research on the relationship between cultural
embeddedness and innovation, so it is difficult to formulate a strong hypothesis a priori. Much of
the work on categories finds that spanning boundaries confuses audiences and hurts performance
(Zuckerman 1999), but more recent findings suggest that such behavior can also increase access
to diverse viewpoints and sources of information, much like brokerage (Hsu 2006). This and
other work like it (e.g., Goldberg, Hannan, and Kovacs 2016) highlight the consequences of
category (mis)fit for audience evaluation and consumption, but we can also apply these findings
to producers, who engage in consumption throughout the cultural production process. As artists
begin to create new work, they search the art worlds around them for inspiration, drawing on
existing frameworks and features, and then recombining them to create something new (Becker
1982). Spanning categories or genres in new ways may provide opportunities for innovation, but
engaging others who are culturally similar—e.g., those who share the same collective
understandings or “world view”—provides producers with a blue print for innovation, granting
them legitimacy and minimizing risk. To account for both of these forces, I predict:

WORKING DRAFT—PLEASE DO NOT CIRCULATE
15
H2: Cultural producers who are more centrally connected in networks defined by shared
category membership will be more likely to produce novel products, but only up to a point; being
too embedded will negatively affect their likelihood of producing novel products.
Organizational Embeddedness
Organizational embeddedness refers to an actor’s position in networks defined by common
organizational affiliation. This is different than the degree to which an actor is embedded within
an organization (e.g., their position in intra-organizational networks, or the strength of their
affiliation; see Ng and Feldman 2010). Rather, I conceive of organizational embeddedness as the
degree to which an actor’s organizational affiliation connects them to other actors in the same
domain. Shared organizational affiliation may bring actors into direct contact with one another,
but this is not necessary for a connection to exist. Simply being a part of the same organization
provides them with shared culture, capabilities, and resources that tie them together, much like
cultural embeddedness ties together actors of the same category. Further, organizations are likely
to have strategic emphases and resources that motivate their members’ actions and production
efforts in similar ways. In the context of music, I operationalize organizational embeddedness as
an artist’s connections to other artists via a shared record label.
The resource-based view of the firm provides a helpful framework to understand how
organizations develop certain tendencies that are likely to be shared by its members, including
the dynamic capability of innovation (Daneels 2002; Eisenhardt and Martin 2000). Members of
the same organization develop strategies for creating and sharing knowledge (Walsh 1995),
producing an “organizational advantage” that begets future performance and innovation gains
(Nahpiet and Ghoshal 1998). Finally, organizational members develop shared culture (Schein
1990), producing stories and rituals that connect them through symbolic values and material
practice (Lounsbury and Glynn 2001). In the music industry, record labels have developed
WORKING DRAFT—PLEASE DO NOT CIRCULATE
16
different strategies to address changes in the technical and resource environment, leading to
systematic variation in the creativity (e.g., Peterson and Berger 1971) and success (e.g., Benner
and Waldfogel 2016) of their artists. For example, Lopes (1990) found that, in the 1970s and
1980s, major labels supported an open production environment that led to more diversity and
innovation in musical production. To account for the role organizational affiliation might play in
the production of novelty, I predict that:
H3: Cultural producers who are more centrally connected in networks defined by shared
organizational affiliation will be more likely to produce novel products.
Geographic Embeddedness
The fourth dimension of embeddedness identified in this paper—geographic
embeddedness—refers to an actor’s position in networks defined by geographic proximity or co-
location. This definition is designed to highlight the connections formed between musicians
based in the same region or city, rather than the degree to which they are embedded in social
networks that are geographically contingent. These connections may constitute explicit
relationships or more latent associations based on shared context. Like the ties that define
cultural and organizational embeddedness, actors that are physically proximate to one another
are more likely to share resources, audiences, influences, and experiences, regardless of whether
they have ever collaborated or met.
A growing stream of research on the geography of entrepreneurship has produced
considerable evidence that certain regions are more “ripe” for entrepreneurial action than others,
due to the presence of like-minded actors, community support systems, and accumulated
resources (Cooper and Folta 2000; Lippmann and Aldrich 2016; Thornton and Flynn 2003).
Moreover, geographic proximity can significantly affect the flow of information and resources
that shape innovation, moderating the effect of intraorganizational networks (Funk 2014) and

WORKING DRAFT—PLEASE DO NOT CIRCULATE
17
producing systematic variations in the capacity to innovate at local, regional, and national levels
(Jian and Yongsheng 2009). In the music industry, geographically-defined networks of artists
generate “scenes” that cultivate particular identities, audiences, and aesthetic or stylistic
tendencies (Crossley 2009). Relatedly, Phillips’ (2011, 2013) study of jazz found that highly
“disconnected” cities are more likely to release records that will be re-recorded in the future, but
significantly less likely to produce original recordings. Drawing from this work, I predict that:
H4: Cultural producers who are more centrally located in networks defined by geographic
proximity will be more likely to produce novel products.
DATA & METHODS
To model how different dimensions of embeddedness influence the production of novelty, I
conduct a series of analyses using data on commercial recordings and recording artists in the
global music industry. This context represents an ideal setting to study this phenomenon for
several reasons. First, creativity and innovation play a central role in musical composition and
production. Most musicians and critics consider novelty a preferred outcome of the creative
process, and evidence suggests consumers value moderate levels of atypicality as a means to
differentiate songs from one another (Askin and Mauskapf 2016). Second, musical production is
an inherently collaborative process involving a range of different actors and interests (Becker
1982; Hirsch 1972; Negus 1992). Even in cases where a musical work is composed and recorded
by a single artist (the most common mode of production in my dataset), this process incorporates
the direct and indirect influences of other artists, past and present. Third, the music industry as an
empirical setting is inherently relevant and interesting. With domestic wholesale and retail
revenue surpassing $10 billion in 2014, and more than 50 million subscribers utilizing digital

WORKING DRAFT—PLEASE DO NOT CIRCULATE
18
streaming services each month, music represents one of the largest fields of cultural production
and consumption today (Friedlander 2014).
There has of course been considerable research on cultural production in music, but the
scientific literature on innovation in this context is surprisingly small. Most contributions focus
on the emergence and evolution of genres (Lena and Peterson 2008), market concentration
among record labels (Dowd 2004), or diffusion dynamics (Rossman, Chiu, and Mol 2008), and
the few studies that have seriously investigated the production of musical novelty have been
limited by difficult-to-scale data and methods (Cerulo 1998; de Laat 2014). Fortunately, these
difficulties have been partially attenuated by the application of digital data sources and
computational methods to the study of culture (Bail 2014). In the case of music, parallel
advances in music information retrieval (MIR)—a subfield of computer science—and digital
streaming technologies have generated a wave of new data this is ideal for answering the types of
questions laid out in this paper. MIR researchers have used this data to study the relationship
between song features and symbolic classification (e.g. Mauch et al. 2015; Serrà et al. 2012), but
their treatments have been purely technical or descriptive in nature. This study represents one of
the first efforts to deploy this data in service of social scientific inquiry.
The data used in this paper comes from an original database describing over 20 million
songs, albums, artists, and consumers, and was collected by scraping several digital data sources,
including The Echo Nest (now owned by Spotify) and MusicBrainz (see Askin and Mauskapf
2016 for a detailed description of the dataset). Although the database covers music released
between ~1930 and 2015, I chose to limit my study to songs released between 1960 and 1995.
Abbreviating the time horizon of the analysis allowed me to (1) address incomplete data in the
early years of the dataset (the LP was not developed until 1959, which is why data before then is
WORKING DRAFT—PLEASE DO NOT CIRCULATE
19
so sparse), and (2) limit the computational requirements of the analysis, which would otherwise
be prohibitive. For the years 1960–1995, I include all original recordings for which there is
complete artist- and song-level information available. The resulting sample comprises 114,386
original songs produced by 10,434 artists across more than 20 countries, and is designed to
represent as complete a picture as possible of the field of (commercial) music production during
these years, though there is a bias toward Western popular music. For every song in the sample,
data includes: day-level release dates; song-level sonic features (used to construct a novelty
measure); artist demographics and attributes, including band membership, genre affiliations,
record labels, and city/country of origin (used to construct embeddedness measures); and
associated meta-data. Below, I summarize each of the measures used in the analysis, as well as
the modeling procedure used to estimate results.
Song Novelty (Dependent Variable)
Work in psychology suggests that features play an important role in shaping how actors
interpret and make sense of products (Tversky 1977). In music, preferences are linked to a series
of high-dimensional features that structure musical space, such as speed, repetition, sadness, and
loudness (Greenberg et al, 2016; Ratliff 2016). While research recognizes that innovation occurs
through the recombination of both features and labels (Pontikes and Hannan 2014), most
empirical tests have used only labels to describe and compare products (for exceptions, see
Cerulo 1988; Saleh et al. 2014).
Rather than focus on category blending or some other aspect of label recombination, I use
data summarizing songs’ constitutive features to construct a comparative measure of product
novelty. All of the songs in the dataset are assigned a value for each of ten features, which were
designed by The Echo Nest to describe a song’s most important sonic characteristics. While

WORKING DRAFT—PLEASE DO NOT CIRCULATE
20
these features necessarily distill the complexity of music into a handful of discrete summary
statistics, and thus fail to capture what makes music “art”, they are well suited for comparing
songs to each other (Friberg et al. 2014; Mauch et al. 2015), and are used explicitly for that
purpose by Spotify and other streaming services. These features include several standard musical
attributes (e.g., “tempo,” “mode,” “key,” “time signature”), as well as a series of algorithmically-
derived measures that represent particular aural or emotive dimensions of music (“valence,”
“danceability,” “acousticness,” “energy,” “liveness,” “speechiness”). Table 2 briefly describes
each of the features used in the analysis.
----INSERT TABLE 2 HERE----
After normalizing all ten features and collapsing them into a single vector for each song, I
use a cosine distance approach to calculate the similarity between relevant song-pairs’ feature
vectors (Katenka and Klaczyk 2012; Saleh et al. 2014). For each focal song 𝑥𝑛 released at time
𝑡𝑛 , I define the relevant set of song-pairs as those songs released prior to 𝑥𝑛. This allows me to
account for the relative (dis)similarity between 𝑥𝑛 and all songs that were released before it in
my novelty measure. Each pairwise cosine similarity falls between 0 and 1, with 0 representing
absolute dissimilarity and 1 representing absolute similarity across the ten-dimensional feature
space. After calculating each of these pairwise similarities, I produce an average weighted
(dis)similarity, or Novelty Score, for each focal song,
(1) 𝑁𝑜𝑣𝑒𝑙𝑡𝑦 𝑆𝑐𝑜𝑟𝑒(𝑥𝑛) =
1
cos(𝑥𝑛, 𝑥1) ∗ log (𝑡𝑛 − 𝑡1)+
1cos(𝑥𝑛, 𝑥2) ∗ log (𝑡𝑛 − 𝑡2)
+ ⋯1
cos(𝑥𝑛, 𝑥𝑛−1) ∗ log (𝑡𝑛 − 𝑡𝑛−1)
𝑛 − 1
WORKING DRAFT—PLEASE DO NOT CIRCULATE
21
where 𝑐𝑜𝑠(𝑥𝑛, 𝑥1) represents the cosine similarity between focal song 𝑥𝑛 and 𝑥1, calculated for
all songs in the relevant comparison set. The cosine similarity for each relevant song-pair is
multiplied by 𝑙𝑜𝑔(𝑡𝑛 − 𝑡1), the log of the difference in release dates between songs 𝑥𝑛 and 𝑥1
in number of days.4 This expression serves to weight the similarities of songs by their temporal
distance, such that songs released in close proximity to each other are weighted more heavily
than those that are not. This accounts for the fact that the relative novelty for any given song is
more likely to be defined in comparison to its “nearest neighbors,” rather than the entire world
of possible comparisons.5 Finally, we aggregate the inverse of each of these products, so that
larger values represent more novel songs, and then normalize each value by dividing it by 𝑛 −
1, or the total number of songs that have been released prior to 𝑥𝑛.
The distribution of novelty scores for all songs in the sample is shown in Figure 1
(max = 1.255, min = 0.148, mean = 0.193, standard deviation = 0.024). Interestingly, the most
novel songs are distributed across a number of genres and time periods, including Simon and
Garfunkel’s “Bridge Over Troubles Waters” (1970), David Bowie’s “Golden Years” (1976),
Lionel Richie’s “Hello” (1983), and a handful of film scores and instrumental jazz ballads. The
common thread among these examples is the presence of two or three feature-values that
deviate significantly from what is expected. For example, “Bridge Over Troubled Waters” is 1.8
standard deviations below average energy and 2.1 σ below average danceability, while “Hello”
is 2.8 σ below average danceability but 2.5 σ above average liveness. This pattern suggests that
significant deviation from the mean across a few notable feature-dimensions is all that it takes to
produce a novel song.
4 Songs with identical release dates were randomly ordered and assigned a release-date difference of one
day. 5 I considered constructing a “within-genre” measure of song novelty to account for the possibility that
some more culturally distant songs may not belong in the comparison set, but decided instead that it was
important to capture disparate influences that cross genre boundaries.
WORKING DRAFT—PLEASE DO NOT CIRCULATE
22
----INSERT FIGURE 1 HERE----
Social Embeddedness (Independent Variable)
To measure an artist’s social embeddedness, I first construct the collaboration network
between all active artists (individuals or bands) at the time of each release event, 𝑥𝑛. A tie
between artists exists if they previously collaborated on a recording, or performed as members of
the same band. I then count the number of collaboration ties for a focal artist at time 𝑡𝑛. The
resulting value can be interpreted as the degree centrality for that artist (Freeman 1979).6 Thus,
artists high in degree are more centrally connected in the collaboration network, and likely to
have recorded music with multiple bands. Because I recalculate this network for each release
event, and only include producers who have entered the market, this statistic may change over
time for a given artist.7 For example, Eric Clapton’s degree centrality in 1970 is markedly higher
than it is in 1965, when he had only released recordings with The Yardbirds. Finally, while I do
my best to account for all relevant collaborators in the production of a new song, I recognize that
the data may be incomplete in certain cases. 8
6 The decision to measure embeddedness using degree centrality rather than constraint was a conscious
one, and reflects the complex nature of artist connections in this data, as well as the computational effort
required to recalculate the collaboration network for each of the ~115,000 song releases. The structure of
the aggregate collaboration network consists of a densely connected giant component surrounded by
relatively isolated subcomponents. This structure makes it hard to interpret measures like constraint,
which one would expect to be negatively correlated with degree centrality (this is exactly what I find;
degree and constraint are correlated at -.80 in this data). Moreover, I do not weight the presence of
collaborative ties by the frequency of collaboration (although I hope to do this in the future).
Supplementary analyses using constraint produce consistent results, and suggest that artists who are high
in degree centrality tend to be less constrained and have greater access to structural holes (models
available upon request). 7 The term “producer” here refers to the cultural producer or creator (e.g., the song writer/performer),
rather than the technical producer or engineer per se. For the remainder of the paper, I use the terms
“producer,” “artist,” and “musician” interchangeably. 8 Where possible, I try to isolate the original “cultural producer(s)” for each recording, identifying the
individual(s) or group credited with the actual creation of a focal song. Many times this coincides with the
performer(s) credited on a recording, but not always. When the data does not allow me to adjudicate

WORKING DRAFT—PLEASE DO NOT CIRCULATE
23
Cultural Embeddedness (IV)
To measure cultural embeddedness, I measure connections between artists based on genre
overlap. The data I use for this task is drawn from The Echo Nest, and is more fine-grained and
descriptive than traditional musicological conceptions of genre (cf., Lena 2012).9 Individual
artists are tagged with anywhere from 0 to 20 genre labels, with the distribution of genres per
artist following a power law. Following existing research (e.g., Kovacs and Hannan 2015), I
measure the cultural similarity between two artists by calculating their Jaccard coefficient,
(2) 𝐽(𝑥𝑛, 𝑥1) = |𝑥𝑛∩ 𝑥1|
|𝑥𝑛∪ 𝑥1|
which represents the ratio of the number of genre categories affiliated with focal song 𝑥𝑛 and 𝑥1,
to the number categorized as 𝑥𝑛 or 𝑥1. For example, if Eric Clapton is labeled as “rock,”
“blues,” and “R&B,” and George Harrison is labeled simply as “rock” and “R&B,” their cultural
similarity would be |2|
|3| = 0.66. To calculate an artist’s cultural embeddedness at the time of a
given song release, I average the pairwise similarities between a focal artist and all others who
are active at the same time in the production network.10
This results in an artist-level score that
falls between 0 and 1, representing the degree to which an artist is culturally similar to others at
the time of a given release. 11
between these actors and their role in the cultural production process, I impute the performer(s) as cultural
producer(s). 9 Genre labels were attributed post hoc through a machine-learned process that combines sonic
characteristics and similarities, information scraped from the web, listener-generated tags, and other
relevant cultural information. 10
I am in the process of re-constructing this measure using a “nearest neighbors” approach based on a
more localized network structure, but I prefer to start by considering all possible connections in the global
category structure. 11
In the analysis that follows, this measure is multiplied by 100 for scaling purposes. Cultural
embeddedness was also calculated using degree centrality, producing similar results.

WORKING DRAFT—PLEASE DO NOT CIRCULATE
24
Organizational Embeddedness (IV)
I use the record labels that represent artists to indicate organizational affiliation in the
music industry, and measure organizational embeddedness by counting the number of
connections between a focal artist and others who are represented by the same label. For the
most part, musical artists operate outside of formal organizational boundaries, but record labels
provide a critical source of human and financial capital through A&R departments, booking
agents, and marketing and production teams. The scale of these resources may offer significant
performance and innovation benefits, particularly for “major” label artists (Lopes 1990).
Calculating their degree centrality through common organizational membership allows me to test
how labels with larger and more connected artist rosters affect the creation of new products.
Geographic Embeddedness (IV)
To measure geographic embeddedness, I again use degree centrality, counting the number of
ties between artists who are based out of the same city or country at the time of a release.12
For
example, an artist writing and recording music in the Seattle during the early 1990s—the height
of the grunge scene—would likely be more centrally connected than a musician working in
Boise, Idaho. As noted earlier, physical proximity to a community of like-minded individuals can
have a significant effect on artist propensities for innovation. I measure geographic co-location at
the city-level wherever possible, only using country-level connections in more remote regions of
the world.13
Artist-locations reflect “home base” rather than birth place and remain static over
time, but I re-calculate geographically-defined connections at each release data to ensure only
active users are included in degree centrality.
12
In the analyses that follow, all four embeddedness measures are represented as normalized z-scores to
(1) account for the skewed nature of the distribution, and (2) allow for comparison across dimensions of
embeddedness. 13
In the future, I plan to calculate a continuous measure of geographic proximity using physical distance.
WORKING DRAFT—PLEASE DO NOT CIRCULATE
25
Additional Variables & Controls
In addition to measuring these different dimensions of embeddedness, I include a suite of
song- and artist-level variables to account for potential confounds that may influence the
production of novelty in music. These include: song’s independent sonic features (e.g., those
used to construct the novelty score outlined above), duration, and decade, which accounts for the
changing nature of music production over time; dummy variables for groups, females, U.S.-
based, and popular artists (=1 for those artists who have had a song appear on the Billboard Hot
100 Charts)14
; and the number of genres spanned. To capture artists’ past experience and
propensity to create novel products, I also include (a) a variable measuring the number of days
an artist has been active in the production network (“artist tenure”), (b) variables for the number
of songs an artist has released in the past, both cumulatively and recently (2-year window), and
(c) variables measuring the proportion of an artist’s previous output deemed novel (again, both
cumulatively and recently). Table 3 includes descriptive statistics and simple correlations for
each of these variables.
----INSERT TABLE 3 HERE----
Relational Event Modeling Approach
Before presenting results, I provide a brief explanation of the model estimation technique
employed in this paper. Recently pioneered as a means of modeling the likelihood of discrete
events over time, Relational Event Models (or “REM’s”) constitute a newly developed class of
statistical models that allow scholars to predict social behaviors as a function of interrelated
events that are located in specific temporal sequence (Butts 2008). These models have a series of
14
The proportion of each of these in the data is as follows: ~50% groups/~50% individuals; ~80%
male/~20% female; ~45% US-based/~20% UK-based/~35% other; ~44% popular/~56% not popular.

WORKING DRAFT—PLEASE DO NOT CIRCULATE
26
important advantages over more traditional panel regression methods, including: (1) they allow
for fine-grained longitudinal analysis of specific “events”—here, song releases—and their
associated covariates; (2) they retain information about the exact sequence of events, rather than
aggregating sequences across summary count measures or cross-sectional panels; (3) they
include a randomly-generated risk set of “potential” events to enhance one’s ability to make
predictions based on observational data; and (4) their output can be interpreted as a Cox
proportional hazard (e.g., conditional logistic regression) model, generating a likelihood-based
understanding of predicted event outcomes. It is important to note that this last point requires
REM’s to predict dichotomous, rather than continuous, outcome variables (see Butts 2008). As
discussed below, transforming a continuous variable into a discrete outcome sacrifices some
precision, but it also increases the intuitive interpretation of results, which in this case will
represent the proportional increase or decrease in relative likelihoods of producing a novel song
(for a more complete description and explanation, see Quintane et al. 2014; Quintane and
Carnabuci 2016).
The process by which I used the data described above to specify these models is as follows.
First, I generated all of the statistics (e.g., dependent and independent variables) associated with
each relational event—here, the release of a new song. To transform “song novelty” into a
dichotomous outcome, I used the variable’s original distribution (see Figure 1) to generate a
threshold above which all songs are considered “very novel”. The models presented below define
this threshold at 2 𝜎 above the mean value of song novelty (e.g., Novelty Score > 0.241), thus
predicting the relative likelihood of producing a song that is more novel than ~98% of all other
songs (e.g., one of the ~2,500 most novel songs in this dataset).15
Alternative specifications were
15
This does not include the first 2,000 songs released in the dataset, which are left out of these models
due to a lack of sufficient data to predict stable parameters.

WORKING DRAFT—PLEASE DO NOT CIRCULATE
27
estimated for 1 𝜎 and 3 𝜎 above mean song novelty, and results did not significantly change.16
To predict the likelihood of producing a novel song, I then estimated a series of models using
measures of producer’s social, cultural, organizational, and geographic embeddedness, as well as
the other artist- and song-level variable described above. Importantly, each of these measures
was re-calculated for each song release to account for the continuous evolution of the
surrounding social structure. Subsequent parameter estimates were determined by including a
risk set of over ~2.3 million “potential” events—randomly-generated combinations of artists and
song releases—that did not occur, but could have. Incorporating these data into the models
ensures the stability and robustness of the results.
RESULTS
My primary interest lies in the multi-dimensional effect of embeddedness on the production
of novelty, but I begin by summarizing some of the other individual-level predictors of novelty
included in these models. The results included in Models 1 and 2 support some of the existing
research on drivers of innovation in cultural production (see Table 4 for complete results). For
example, teams and groups are more likely to produce successful innovations than individuals
(Ruef 2010; Uzzi and Spiro 2005), and this effect is supported by the finding for “Individual”
(reference = “Group”) in Model 2. Solo artists are marginally less likely to produce novel songs
than their multi-member counterparts, and this effect becomes more significant in later models,
equating to nearly a 30% decrease in the likelihood of producing a novel song. Popular artists are
also less likely to innovate than their peers. After appearing on the Billboard Hot 100 Charts,
musicians are 17% less likely on average to record and release novel new songs, choosing
instead to appeal to audience expectations and stick with the status quo. Finally, songs released
16
These results are available upon request.
WORKING DRAFT—PLEASE DO NOT CIRCULATE
28
between 1990 and 1995 (reference = “1990s”) are more likely to be novel than their
predecessors, with the 1970s representing the least generative decade of musical innovations.
----INSERT TABLE 4 HERE----
Interestingly, individual female artists are marginally more likely to produce novel songs
than their male counterparts, an effect that becomes increasingly pronounced in later models. It is
true that women are outnumbered by men four-to-one in the dataset, but there is sufficient
variation to suggest that this effect is robust. Women may face systematic barriers to entry into
the music industry, suggesting that those who “make it” into our dataset have already been
selected on being artistically forward-thinking. Or, perhaps women produce novelty as a means
to distinguish themselves from their male peers. I will revisit some of the possible mechanisms
driving this effect at the end of the results section.
In Model 3, I incorporate variables measuring an artist’s past experience to assess the
contingent nature of novelty creation. Although the linear term for “Artist Tenure” is not a
significant predictor of product novelty, results suggest that the artists’ past production efforts
affect their propensity to generate novel products in the future. For example, the more songs that
an artist has released over the course of his or her career, the less likely they are to produce
something novel. This relationship reverses, however, when I measure recent artist production.
Someone who experiences a 1 𝜎 increase in productivity over the past two years is more than
twice as likely to create a novel song. Moreover, I find that the propensity to create novel songs
in the past makes artists more likely to create novel songs in the future, especially if their recent
production history is marked by innovation. This result suggests that the capacity to produce
novel products is imprinted over time, highlighting the way in which production outcomes are
embedded in producer’s personal histories (Lippmann and Aldrich 2016).

WORKING DRAFT—PLEASE DO NOT CIRCULATE
29
Model 4 includes several interesting results that require additional interpretation. First, artist
tenure becomes a significant predictor of product novelty. Producers’ propensity to innovate
seems to decrease over time, echoing extant research on the relationship between age and
innovation (Becker 1982; de Laat 2014; Ruef 2002; Stephan and Levin 1992). But when I
include a quadratic term for tenure, I find that this relationship reverses, as artists near the end of
their career start to become more likely to produce novelty again (see Jones 2010). This U-
shaped finding suggests that, while young artists may be less constrained by the norms and
expectations surrounding fields of cultural production (in part because they don’t know any
better), artists in the twilight of their careers have accrued sufficient social, political, and artistic
capital to innovate without incurring the penalty assigned to producers in the middle of their
careers.
Model 4 also includes my indicator for social embeddedness. Remember that this variable is
designed to measure artists’ connectedness to others through direct contact or collaboration.
Following competing research findings on structural holes, network closure, and innovation, I
made competing predictions about how social embeddedness might affect the propensity to
produce novelty (cf., Burt 2005). Surprisingly, I find no support for either prediction—artists
who collaborate with others and span multiple music groups are not more or less likely to release
novel songs. The effect of social embeddedness becomes marginally significant when predicting
the release of a song that is at least 1 𝜎 (rather than 2 𝜎) greater than the mean song novelty
score, but the effect size remains small (results available upon request). Given all of the research
on social embeddedness, this finding is certainly startling, but not inexplicable. Part of the reason
that I sought to test different dimensions of embeddedness was to establish whether and how
they generated different outcomes. In the context of musical production, this null result suggests
WORKING DRAFT—PLEASE DO NOT CIRCULATE
30
that the degree to which artists are directly connected to each other may not be as consequential
for innovation as previously thought. The channels through which producers access new and
different information may instead be defined by other dimensions of connectedness.
In Model 5, I test the effect of these other dimensions. Social embeddedness continues to be
an insignificant predictor of product innovation, as does organizational embeddedness. Although
some research suggests that artist affiliations with certain record labels is linked to gains in
performance and innovation (Lopes 1990; Peterson and Berger 1971), the connection between
artists and labels is relatively weak, especially when compared to other professions. Part of the
reason for this may be because the relationship between artists and labels is one of
representation, rather than employment. Thus, sharing a position on a label’s roster with other
artists seems to not play a significant role in how likely you are to create novel music.
Although results from these models do not provide support for H1 or H3, I find robust
support for H2 and H4. Specifically, artists who are more centrally connected in geographic
space are much more likely to produce novel products. For every 1 𝜎 increase in artists’
geographic degree centrality, they experience a whopping 58.5% increase in the likelihood of
creating a novel song. This is true even when controlling for US-based artists, who are more
likely to be connected due to their disproportionate presence in the dataset. Artists who are
culturally embedded are also more likely to produce innovations. An initial positive effect for
this variable, which measures the degree to which producers are culturally similar to each other,
suggests that a 1 𝜎 increase in cultural embeddedness results in a 37.6% increase in artists’ “risk”
of creating novel products. Model 6 incorporates a quadratic term for cultural embeddedness,
signaling a significant inverted U-shaped relationship between cultural similarity and innovation.
As predicted, displaying moderate levels of cultural embeddedness allows artists to tap into the

WORKING DRAFT—PLEASE DO NOT CIRCULATE
31
influence of others who are associated with some, but not all, of the same genre categories,
encouraging them to incorporate new ideas while sharing common ground.17
To try and develop a better understanding of when cultural embeddedness is an effective
tool for the production of novelty, I interacted it with several artist-level characteristics (see
Table 5 for full results).18
In Model 7, I find a positive interaction between cultural
embeddedness and the number of genres spanned by a given artist. The main effect of this
variable was positive in Model 5, but the interaction suggests that this is only true for artists who
exhibit high levels of cultural similarity (see Figure 2). Put another way, the producers who are
best positioned to take advantage of the diversity present across multiple genres are those who
are highly culturally embedded. When it comes to producing novel products, those artists who
span genres in a similar way to others are more likely to succeed.
----INSERT TABLE 5 & FIGURE 2 HERE----
Model 8 includes an interaction term for cultural embeddedness and gender. The result
suggests that women are particularly likely to benefit from the structural advantages of cultural
embeddedness, making them more likely than men to create novel musical products (see Figure
3). One plausible explanation for this effect is that being culturally similar to others may erase
some of the barriers women face in their efforts to produce novelty in fields of cultural
production, empowering them to innovate, rather than play it safe. Finally, in Model 9, I interact
17
In supplementary analyses, I use constraint to measure each dimension of structural embeddedness.
These estimates generated consistent results, with large significant effects for cultural and geographic—
but not social or organizational—embeddedness. Given the strong negative correlation between degree
and constraint, these results can be interpreted as follows: artists with greater access to culturally- and
geographically-defined structural holes (e.g., those with lower levels of constraint in these contexts) are
more likely to produce novel products. 18
Although I did not have any a priori hypotheses concerning tradeoffs between different dimensions of
embeddedness, I did try to interact them with each other as well (see for example Goldberg et al. 2016;
Ng and Feldman 2010). None of these interaction effects were significant.
WORKING DRAFT—PLEASE DO NOT CIRCULATE
32
cultural embeddedness with artist tenure. Although the effect here is not as strong, its
significance suggests that cultural embeddedness is particularly helpful for artists at the
beginning of their careers. Just like for women, or producers who span multiple genres,
musicians who are just starting out receive additional benefit from being culturally embedded, as
it provides them with a form of cultural capital that may encourage risk-taking and innovation.
----INSERT FIGURES 3 & 4 HERE----
DISCUSSION & CONCLUSIONS
The findings presented in this paper provide compelling evidence that cultural production—
and the production of novelty in particular—is shaped by the embeddedness of cultural
producers, but not in the way previous theory suggests. Using novel data on over 100,000 songs
and 10,000 artists from the global music industry, I find support for the independent effect of
different dimensions of structural embeddedness on product innovation. Results suggest that
producers who are centrally connected across genre categories and geographic contexts are
significantly more likely to create novel products. Moreover, producers who are young, female,
or span multiple genres benefit the most from being culturally embedded. By contrast, social and
organizational embeddedness do little to explain the production of novelty within the music
industry. This null result is particularly salient, as it reaffirms the motivation for conceptualizing
embeddedness as a multi-dimensional construct. Existing research has primarily focused on how
direct social ties impact innovation and performance outcomes, but considering how actors might
be connected to each other in other ways—through shared category membership, organizational
affiliation, or geographic proximity—generates new conclusions and encourages us to think
more deeply about how shared context can influence the production of novelty.

WORKING DRAFT—PLEASE DO NOT CIRCULATE
33
For example, cultural embeddedness operates through exposure to shared norms, values, and
assumptions that transcend direct social interactions or collaborations. Artists who are members
of the same category may be more likely to cross paths and collaborate (although we do not find
this to be the case in our dataset); but even if they do not, they still share common ground and
compete for audience attention. The same can be said for geographic embeddedness, which
describes how actors immersed in the same musical scene or local community are likely to share
resources, experiences, and audiences, whether or not they come into direct contact with each
other. Indeed, being embedded in the same geographic or cultural context not only increases your
propensity to share overlapping resources and influences; it also makes you more likely to
compete against one other, suggesting that competition, rather than collaboration, may be the
predominant driver of innovation in this domain.
Taken together, these findings provide a more holistic perspective on how producer
characteristics and networks generate competing “typologies of the possible,” which in turn
influence the production of novelty (Padgett and Powell 2012: 3–4). Nevertheless, this work has
some important limitations that merit consideration. As with most empirical investigations
relying on “big” data sources and methods, the conclusions drawn above are limited by the
nature of the data. For example, the algorithmically-derived sonic features used to measure
product novelty are inherently reductionist, and may not align perfectly with audience
assessments of what is or isn’t “novel.” Validating this measure in the lab would help to ensure
that my operationalization of musical novelty accurately reflects listener interpretations. There
are also limitations associated with the measurement of producer embeddedness. Geographic
location and genre affiliations are fixed for artists across the duration of the dataset, and thus do
not allow me to account for within-artist variation over time. Moreover, I do not currently

WORKING DRAFT—PLEASE DO NOT CIRCULATE
34
measure the relative strength (or weakness) of a given tie between actors. Collecting additional
data and estimating new models that isolate within-artist variation will help resolve these issues
in the future. This may also allow me to address the possibility of a bidirectional relationship
between producer embeddedness and product novelty, informing a stronger causal argument than
is currently possible given the modeling strategy used in this paper.
To conclude, I would like to highlight several contributions this paper makes that have
theoretical, methodological, and practical implications. First, conceiving of structural
embeddedness as a multi-dimensional phenomenon highlights the fact that information and
influence flow not only through direct social relationships, but other relational structures that
organize social life. It may not be surprising that cultural and geographic embeddedness play
such an important role in the production of new music, but exactly which dimensions of
embeddedness matter most, and in what ways, may be context dependent. Future research can
unpack the relationships between these dimensions and test how they operate across different
domains. Second, recognizing the mutiplexity of embeddedness may have important
consequences for the way entrepreneurs and the organizations that support them structure
innovation. Rather than focusing on collaborative teams or social networks, they might identify
other channels that simultaneously maximize information diversity and social cohesion. Finally,
the data and methods used in this study present a host of exciting opportunities for empirical
research on cultural production. Using computational and network methods like REM’s to study
large quantities of data that are rich in information about cultural content and social relations will
continue to generate new insights into this process.
WORKING DRAFT—PLEASE DO NOT CIRCULATE
35
References
Abbot, A.2001. Time Matters: On Theory and Method. University of Chicago Press.
Ahuja, G. 2000. Collaboration networks, structural holes, and innovation: a longitudinal study.
Administrative Science Quarterly 45: 425–455.
Askin, N. and M. Mauskapf. 2016. What Makes Popular Culture Popular?: Cultural Networks
and Optimal Differentiation in Music. Working Paper.
Bail, C.A. 2014. The Cultural Environment: Measuring Culture with Big Data. Theory and
Society 43: 465–482.
Becker. H. 1982. Art Worlds. Berkeley, CA: University of California Press.
Benner, M.J. and J. Waldfogel. 2016. The Song Remains the Same?: Technological Change and
Positioning in the Recorded Music Industry. Strategy Science 1(3): 129–147.
Berlyne, D.E. 1971. Aesthetics and Psychobiology. New York: Appleton-Centure-Crofts.
Boccaletti, S., G. Bianconi, R. Criado, C. del Genio, J. Gomez-Gardenes, M. Romance, I.
Sendina-Nadal, Z. Wang, and M. Zanin. The Structure and Dynamics of Multilayer Networks.
Physics Reports 544(1): 1–122.
Bourdieu, P. 1993. The Field of Cultural Production: Essays on Art and Literature. New York:
Columbia University Press
Breiger, R.L. and K. Puetz. 2015. Culture and Networks. The International Encyclopedia of the
Social and Behavioral Sciences. Pp. 557–62 in International Encyclopedia of Social and
Behavioral Sciences, vol. 5, edited by J. D. Wright. Oxford, UK: Elsevier.
Burt, R.S. 1992. Structural Holes: The Social Structure of Competition. Cambridge, MA:
Harvard University Press.
_______. 2004. Structural Holes and Good Ideas. American Journal of Sociology 110(2): 349–
399.
_______. 2005. Brokerage and Closure: An Introduction to Social Capital. New York: Oxford
University Press.
Butts, C.T. 2008. A Relational Event Framework for Social Action. Sociological Methodology
38(1): 155–200.
Carnabuci, G. and E. Operti. 2013. Where do Firm’s Recombinant Capabilities Come From?:
Intraorganizational Networks, Knowledge, and Firm’s Ability to Innovate through Technological
Recombination. Strategic Management Journal 34(13): 1591–1613.

WORKING DRAFT—PLEASE DO NOT CIRCULATE
36
Cattani, F., S. Ferriani, and P.D. Allison. 2014. Insiders, Outsiders, and the Struggle for
Consecration in Cultural Fields: A Core-Periphery Perspective. American Sociological Review
79(2): 258–281.
Cerulo, K. 1988. Analyzing Cultural Products: A New Method of Measurement. Social Science
Research 17: 317-352.
Coleman, J.S. 1990. Foundations of Social Theory. Cambridge, MA: Harvard University Press.
Cooper, A. and T. Folta. 2000. Entrepreneurship and High-technology Clusters. In D.L. Sexton
and H. Landstrom (eds.), The Blackwell Handbook of Entrepreneurship , pp. 348–367. Oxford:
Blackwell Business.
Cox, E., R. McDonald, D. Wang, and B. Hallen. 2015. Exposed: Venture Capital, Competitor
Ties, and Entrepreneurial Innovation. Academy of Management Journal 58(5): 1334–1360.
Crossley, N. 2009. The Man Whose Web Expanded: Network Dynamics in Manchester’s
Post/punk Music Scene, 1976–1980. Poetics 37: 24–49.
Damanpour, F. 1991. Organizational innovation: A meta-analysis of effects of determinants and
moderators. Academy of Management Journal, 34(3): 555-590.
Danneels, E. 2002. The Dynamics of Product Innovation and Firm Competences. Strategic
Management Journal 23(12): 1095–1121.
de Laat, K. 2014. Innovation and Diversity Redux: Analyzing Musical Form and Content in the
American Recording Industry, 1990–2009. Sociological Forum 29(3): 673–697.
de Vaan, M., D. Stark, and B. Vedres. 2015. Game Changer: The Topology of Creativity.
American Journal of Sociology 120:1144-1194.
DiMaggio, P. 1977. Market Structure, the Creative Process, and Popular Culture: Toward an
Organizational Reinterpretation of Mass-Culture Theory. The Journal of Popular Culture 11(2):
436–452.
___________. 1997. Culture and Cognition. Annual Review of Sociology 23: 263–287.
Douglas, M. and B.C. Isherwood. 1996. The World of Goods: Towards an Anthropology of
Consumption. New York: Routledge.
Dowd, T.J. 2004. Concentration and Diversity Revisited: Production Logics and the U.S.
Mainstream Recording Market, 1940–1990. Social Forces 82(4): 1411–1455.
Dyer, J., H. Gregersen, and C.M. Christensen. 2011. The Innovator’s DNA: Mastering the Five
Skills of Disruptive Innovators. Boston: Harvard Business Review Press.
WORKING DRAFT—PLEASE DO NOT CIRCULATE
37
Eisenhardt, K.M.and J.A. Martin. 2000. Dynamic Capabilities: What Are They? Strategic
Management Journal 21(10-11): 1105–1121.
Emirbayer, M. 1997. Manifesto for Relational Sociology. American Journal of Sociology 103(2):
281–317.
Emirbayer, M. and J. Goodwin. 1994. Network Analysis, Culture, and the Problem of Agency.
American Journal of Sociology 99 (6): 1411–1454.
Fleming, L., S. Mingo, and D. Chen. 2007. Collaborative Brokerage, Generative Creativity, and
Creative Success. Administrative Science Quarterly 52:443-475.
Fligstein, N. and L. Dauter. 2007. The Sociology of Markets. Annual Review of Sociology
33(1):105–28.
Freeman, L.C., 1979. Centrality in social networks: conceptual clarification. Social
Networks 1 (3), 215–239
Friberg, A., W. Schoonderwaldt, A. Hedblad, M. Fabiani, and A. Elowsson. 2014. Using
Listener-based Perceptual Features as Intermediate Representations in Music Information
Retrieval. Journal of the Acoustical Society of America 136(4): 1951–1963.
Friedlander, J.P. 2014. News and Notes on 2014 RIAA Music Industry Shipment and Revenue
Statistics. Recording Industry Association of America.
Funk, R.J. Making the Most of Where You Are: Geography, Networks, and Innovation in
Organizations. Academy of Management Journal 57(1): 193–222.
Gibson, J.J. 1979. The Ecological Approach to Visual Perception. New York: Psychology Press.
Goldberg, A., M,T. Hannan, and B, Kovács. 2016. What Does It Mean to Span Cultural
Boundaries? Variety and Atypicality in Cultural Consumption. American Sociological Review
81:215-241.
Goldberg, A., S.B. Srivastava, V.G. Manian, W. Monroe, and C. Potts. Forthcoming. Fitting in
or Standing Out?: The Tradeoffs of Structural and Cultural Embeddedness. American
Sociological Review.
Granovetter, M.S. 1985. Economic Action and Social Structure: The Problem of Embeddedness.
American Journal of Sociology 91:481-510.
Greenberg, D.M., M. Kosinski, D.J. Stillwell, B.L. Monteiro, D.J. Levitin, and P.J. Rentfrwo.
2016. The Song is You: Preferences for Musical Attribute Dimensions Reflect Personality.
Social Psychological and Personality Science.

WORKING DRAFT—PLEASE DO NOT CIRCULATE
38
Heaney, M.T. 2014. Multiplex Networks and Interest Group Influence Reputation: An
Exponential Random Graph Model. Social Networks 36: 66–81.
Hirsch, P.M. 1972. Processing Fads and Fashions: An Organization-Set Analysis of Cultural
Industry Systems. American Journal of Sociology 77(4):639–59.
Holt, F. 2007. Genre in Popular Music. Chicago: University of Chicago Press.
Hsu, G. 2006. Jack of All Trades and Masters of None: Audiences’ Reactions to Spanning
Genres in Feature Film Production. Administrative Science Quarterly 51: 420–450.
Hsu, G. and M.T. Hannan. 2005. Identities, Genres, and Organizational Forms." Organization
Science 16:474-490.
Jones, B.F. 2010. Age and Great Invention. Review of Economics and Statistics 92(1): 1–14.
Jones, C., M. Lorenzen, and J. Sapsed (eds.). 2015. The Oxford Handbook of Creative Industries.
New York: Oxford University Press.
Katenka, N. and E.D. Kolaczyk. 2012. Inference and Characterization of Multi-Attribute
Networks with Application to Computational Biology. The Annals of Applied Statistics 6(3):
1068–1094.
Kovacs, B. and M.T. Hannan. 2015. Conceptual Spaces and the Consequences of Category
Spanning. Sociological Science 2: 252–286.
Lena, Jennifer C. 2006. Social Context and Musical Content of Rap Music, 1979-1995. Social
Forces 85(1): 479–495.
Lena, Jennifer C. and Richard A. Peterson 2008. Classification as Culture: Types and
Trajectories of Music Genres. American Sociological Review 73(5): 697-718.
Lippmann, S. and H.E. Aldrich. 2016. A Rolling Stone Gathers Momentum: Generational Units,
Collective Memory, and Entrepreneurship. Academy of Management Review 41(4): 658–675.
Lopes, P.D. Innovation and Diversity in the Popular Music Industry, 1969 to1990. American
Sociological Review 57(1): 56–71.
Lounsbury, M. and M.A. Glynn. 2001. Cultural Entrepreneurship: Stories, Legitimacy, and the
Acquisition of Resources. Strategic management journal 22(6-7):545–64.
Mahood, I.P., H. Zhu, and E.J. Zajac. 2011. Where Can Capabilities Come From?: Network Ties
and Capability Acquisition in Business Groups. Strategic Management Journal 32: 820–848.
Mauch, M., R.M. MacCallum, M. Levy, and A.M. Leroi. 2015. The Evolution of Popular Music:
USA 1960–2010. Royal Society Open Science 2.

WORKING DRAFT—PLEASE DO NOT CIRCULATE
39
Moran, P. Structural vs. Relational Embeddedness: Social Capital and Managerial Performance.
Strategic Management Journal 26(12): 1129–1151.
Nahapiet, J. and S. Ghoshal. 1998. Social Capital, Intellectual Capital ,and the Organizational
Advantage. Academy of Management Review 23(2): 242–266.
Negus, K. 1992. Producing Pop: Culture and Conflict in the Popular Music Industry. London:
Edward Arnold.
Ng, T.W.H. and D.C. Feldman. 2010. The Effects of Organizational Embeddedness on
Development of Social Capital and Human Capital. Journal of Applied Psychology 95(4): 696–
712.
Obstfeld, D. 2005. Social networks, the tertius iungens orientation, and involvement in
innovation. Administrative Science Quarterly 50(1): 100-130.
Pachucki, Mark A. and R.L. Breiger. 2010. Cultural Holes: Beyond Relationality in Social
Networks and Culture. Annual Review of Sociology 36: 205-224.
Padgett, J.F. and W.W. Powell. The Emergence of Organizations and Markets. Princeton:
Princeton University Press.
Peterson, Richard A. 1990. Why 1955?: Explaining the Advent of Rock Music. Popular Music
9(1): 97–116.
Peterson, R.A. and N. Anand. 2004. The Production of Culture Perspective. Annual Review of
Sociology 30: 311–334.
Peterson, R.A. and D.G. Berger. 1971. Entrepreneurship in Organizations: Evidence from the
Popular Music Industry. Administrative Science Quarterly 16(1): 97–106.
Phillips, D.J. 2011. Jazz and the Disconnected: City Structural Disconnectedness and the
Emergence of a Jazz Canon, 1897–1933. American Journal of Sociology 117(2): 420–483.
________. 2013. Shaping Jazz: Cities, Labels, and the Global Emergence of an Art Form.
Princeton: Princeton University Press.
Podolny, J.M. 2001. Networks as the Pipes and Prisms of the Market. American Journal of
Sociology 107(1): 33–60.
Polanyi, K. 1944. The Great Transformation. New York: Academic Press.
Pontikes, E.G. and M.T. Hannan. 2014. An Ecology of Social Categories. Sociological Science
1:311–43.

WORKING DRAFT—PLEASE DO NOT CIRCULATE
40
Powell, W.W., K.W. Koput, and L. Smith-Doerr. 1996. Interorganizational collaboration and the
locus of innovation: Networks of learning in biotechnology. Administrative Science Quarterly,
41(2): 116-145.
Quintane, E., G. Conaldi, M. Tonellato, and A. Lomi. 2014. Modeling Relational Events: A Cade
Study on an Open Source Software Project. Organizational Research Methods 17(1): 23–50.
Quintane, E. and G. Carnabuci. 2016. How do Broker’s Broker?: Temporality of Structural
Holes and Un-Embedded Brokerage. Working Paper.
Rao, H., P. Monin, and R. Durand. 2003. Institutional Change in Toque Vile: Nouvelle Cuisine
as an Identity Movement in French Gastronomy. American Journal of Sociology 108(4):795–
843.
Ratliff, B. 2016. Every Song Ever: Twenty Ways to Listen in an Age of Musical Plenty. New
York: Farrar, Straus and Giroux.
Reagans, R. and B. McEvily. 2003. Network Structure and Knowledge Transfer: The Effects of
Cohesion and Range. Administrative Science Quarterly 48(2): 240–267.
Rossman, Gabriel. 2012. Climbing the Charts: What Radio Airplay Tells Us about the Diffusion
of Innovation. Princeton, NJ: Princeton University Press.
Rossman, G., M.M. Chiu, and J.M. Mol. 2008. Modeling Diffusion of Multiple Innovations via
Multilevel Diffusion Curves. Sociological Methodology 38(1): 208–230.
Rubio, F.D. 2012. The Material Production of the Spiral Jetty: A Study of Culture in the Making.
Cultural Sociology 6(2): 143-161.
Ruef, M. 2000. The Emergence of Organizational Forms: A Community Ecology Approach.
American Journal of Sociology 106(3): 658–714.
______. 2002. Strong Ties, Weak Ties and Islands: Structural and Cultural Predictors of
Organizational Innovation. Industrial and Corporate Change 11(3): 427–449.
______. 2010. The entrepreneurial group: Social identities, relations, and collective action.
Princeton, NJ: Princeton University Press.
Ruef, M. and M. Lounsbury. 2007. The Sociology of Entrepreneurship. Research in the
Sociology of Organizations 25: 1–29.
Schein, E.H. 1990. Organizational Culture. American Psychologist 45(2): 109–119.
Shane, S.A. 2004. A General Theory of Entrepreneurship: The Individual Opportunity Nexus.
Northampton, MA: Edward Elgar Publishing.
WORKING DRAFT—PLEASE DO NOT CIRCULATE
41
Schumpeter, J.A. 1934. The Theory of Economic Development. Cambridge, MA: Harvard
Economic Studies.
______________ 1942. Capitalism, Socialism and Democracy. New York, NY: Harper.
Seidel, M-D.L. and H.R. Greve. Forthcoming. Emergence: How Novelty, Growth, and
Formation Shape Organizations and their Ecosystems. Research in the Sociology of
Organizations.
Simonton, D.K. 1984. Artistic Creativity and Interpersonal Relationships Across and Within
Generations. Journal of Personality and Social Psychology 46(6): 1273–1286.
Thorton, P.H., and K.H. Flynn. 2003. Entrepreneurship, networks, and geographies. In Z. J. Acs
& D. B. Audretsch (Eds.), Handbook of entrepreneurship research: 401–433. London: Kluwer
Law International.
Tsai, W.P. and S. Ghoshal. 1998. Social Capital and Value Creation: The Role of Intrafirm
Networks. Academy of Management Journal 41(4): 464–476.
Tversky, Amos. 1977. Features of Similarity. Psychological Review 84(4): 327-352.
White, D.R., W.W. Powell, and J. Owen-Smith. 2003. Embeddedness in Multiple Networks,
Organization Theory, and Structural Cohesion Theory. Computational and Mathematical
Organization Theory.
Uzzi, B. 1996. The Sources and Consequences of Embeddedness for the Economic Performance
of Organizations: The Network Effect. American Sociological Review 61:674-698.
______. 1997. Social Structure and Competition in Interfirm Networks: The Paradox of
Embeddedness. Administrative Science Quarterly 42:35-67.
Uzzi, B., S. Mukherjee, M. Stringer, and B. Jones. 2013. Atypical Combinations and Scientific
Impact. Science 342:468-472.
Uzzi, B. and J. Spiro. 2005. Collaboration and Creativity: The Small World Problem. American
Journal of Sociology 111:447-504.
Vilhena, D., J.G. Foster, M. Rosvall, J.D. West, and J.A. Evans. 2014. Finding Cultural Holes:
How Structure and Culture Diverge in Networks of Scholarly Communication. Sociological
Science 1:221–38.
Walker, G., B. Kogut, and W. Shan. 1997. Social Capital, Structural Holes and the Formation of
an Industry Network. Organization Science 8(2): 109–125.
Walsh, J.P. 1995. Managerial and Organizational Cognition: Notes from a Trip Down Memory
Lane. Organization Science 6(3): 280–321.

WORKING DRAFT—PLEASE DO NOT CIRCULATE
42
Wang, D. 2015. Activating Brokerage: Interorganizational Knowledge Transfer through Skilled
Return Migration. Administrative Science Quarterly 60(1): 133–176.
Wei, J. and X. Yongsheng. 2009. Cultural Embeddedness, Network Behavior and Cluster Firms’
Innovative Ability. Strategic Management Engineering¨1163–1168.
White, H.C. 1981. Where Do Markets Come From? American Journal of Sociology, 87: 517-
547.
_________. 2002. Markets from Networks: Socioeconomic Models of Production. Princeton,
N.J.: Princeton University Press.
Zaheer, A. and G.G. Bell. 2005. Benefiting from Network Position: Firm Capabilities, Structural
Holes, and Performance. Strategic Management Journal 26(9): 809–825.
Zukin, S. and P. DiMaggio. 1990. Structures of Capital: The Social Organization of the
Economy. New York: Cambridge University Press.
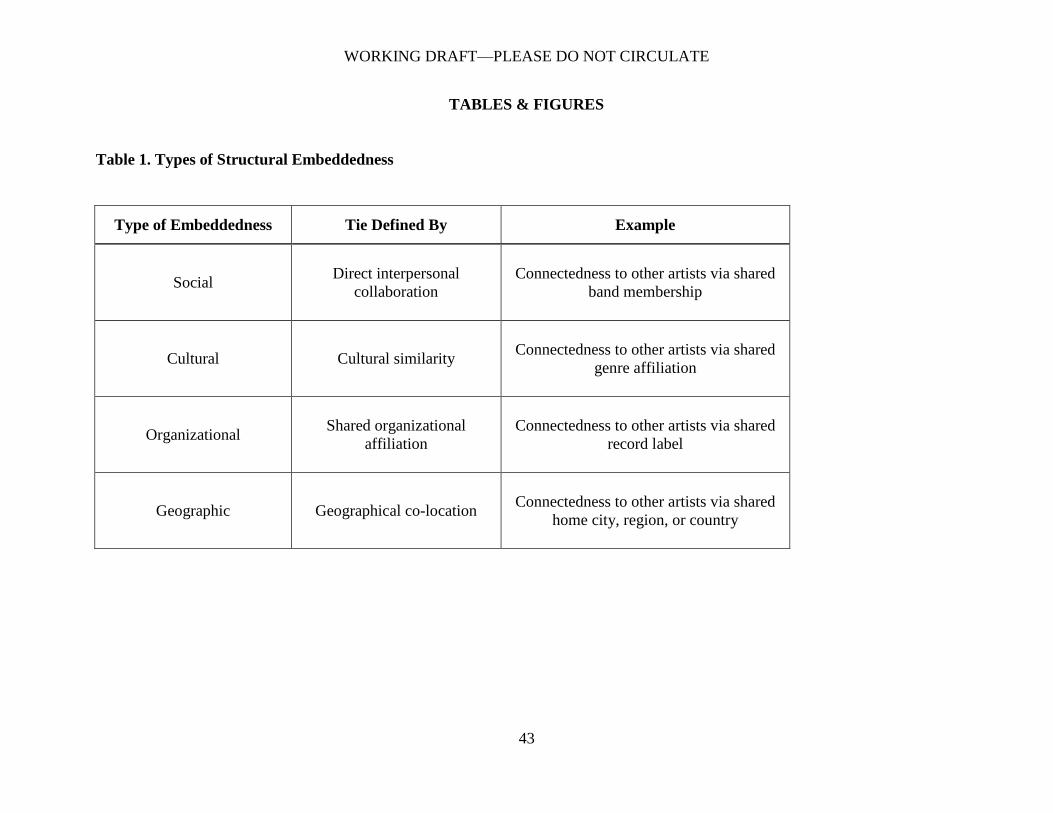
WORKING DRAFT—PLEASE DO NOT CIRCULATE
43
TABLES & FIGURES
Table 1. Types of Structural Embeddedness
Type of Embeddedness Tie Defined By Example
Social Direct interpersonal
collaboration
Connectedness to other artists via shared
band membership
Cultural Cultural similarity Connectedness to other artists via shared
genre affiliation
Organizational Shared organizational
affiliation
Connectedness to other artists via shared
record label
Geographic Geographical co-location Connectedness to other artists via shared
home city, region, or country

WORKING DRAFT—PLEASE DO NOT CIRCULATE
44
Table 2. Song-level Features
Features Scale Definition
Acousticness 0-1 Represents the likelihood that the song was recorded solely by
acoustic means (as opposed to more electronic / electric
means)
Danceability 0-1 Describes how suitable a track is for dancing. This measure
includes tempo, regularity of beat, and beat strength.
Energy 0-1 A perceptual measure of intensity throughout the track. Think
fast, loud, and noisy (i.e., hard rock) more than dance tracks.
Key 0-11 (integers only)
The estimated, overall key of the track, from C through B. We
enter key as a series of dummy variables
Liveness 0-1 Detects the presence of the live audience during the recording.
Heavily studio-produced tracks score low on this measure.
Mode 0 or 1 Whether the song is in a minor (0) or major (1) key
Speechiness 0-1 Detects the presence of spoken word throughout the track.
Sung vocals are not considered spoken word.
Tempo Beats per
minute (BPM) The overall average tempo of a track.
Time Signature Beats per bar /
measure Estimated, overall time signature of the track. 4/4 is the most
common time signature by far, and is entered as a dummy
variable in our analyses.
Valence 0-1 The musical positiveness of the track
Note: This list of attributes includes all but one of the attributes provided by the Echo Nest’s suite of algorithms:
loudness. This variable was cut from our final analysis at the suggestion of the company’s senior engineer, who
explained that loudness is primarily determined by the mastering technology used to make a particular recording, a
characteristic that is confounded through radio play and other forms of distribution.

WORKING DRAFT—PLEASE DO NOT CIRCULATE
45
Table 3. Descriptive Statistics and Pearson Correlations for Independent and Control Variables
Note: mean and standard deviation reflect normalized measures for variables 2–11.
Mean SD 1 2 3 4 5 6 7 8 9 10 11 12 13 14 15 16 17 18 19 20 21 22 23 24 25 26
1 Duration 237.84 113.34 1
2 Key 0.3765 0.289 -0.018 1
3 Energy 0.574 0.263 0.032 0.014 1
4 Liveness 0.234 0.215 0.037 -0.001 0.17 1
5 Tempo 0.462 0.113 0.007 -0.002 0.226 0.009 1
6 Speechiness 0.074 0.102 -0.057 -0.02 0.046 0.175 -0.017 1
7 Acousticness 0.347 0.344 -0.122 -0.005 -0.694 -0.029 -0.178 0.031 1
8 Mode 0.711 0.453 -0.076 .001 -0.032 0.005 0.014 -0.044 0.051 1
9 Time Signature 0.554 0.07 0.047 -0.002 0.163 -0.005 0.028 -0.029 -0.163 -0.011 1
10 Valence 0.531 0.263 -0.185 0.017 0.288 -0.047 0.125 0.012 -0.162 0.03 0.116 1
11 Danceability 0.521 0.175 -0.036 -0.015 0.04 -0.156 -0.08 0.113 -0.091 -0.03 0.139 0.554 1
12 Female 0.104 0.305 0.017 -0.016 -0.333 -0.031 -0.109 0.013 0.356 0.025 -0.05 0.002 0.079 1
13 Decade 2.47 0.863 0.122 -0.059 0.037 -0.037 0.053 0.067 -0.093 -0.039 0.023 -0.142 -0.014 -0.015 1
14 Group 0.49 0.554 0.019 0.002 0.338 0.057 0.116 0.003 -0.365 -0.024 0.056 -0.018 -0.102 -0.729 0.08 1
15 Popular 0.446 0.497 -0.059 0.038 -0.004 0.022 -0.063 -0.059 -0.007 0.029 0.024 0.176 0.185 0.073 -0.342 -0.097 1
16 US-based 0.412 0.486 -0.068 0.016 -0.089 -0.002 -0.048 0.008 0.114 0.032 -0.012 0.043 0.013 0.164 -0.037 -0.044 0.239 1
17 # of Genres 4.82 3.7 0.026 .001 0.017 0.046 .001 -0.036 -0.001 0.021 0.002 0.034 0.011 0.1 -0.071 0.066 0.273 0.265 1
18 Tenure 2076.05 3099.76 -0.013 -0.012 -0.111 0.022 -0.023 -0.072 0.15 0.031 -0.014 0.047 0.018 0.179 0.137 -0.101 0.404 0.17 0.282 1
19 Cumulative Production 0.0004 0.0016 -0.026 0.002 -0.013 0.016 .001 -0.023 0.027 0.016 -0.004 0.026 -0.003 0.013 -0.178 0.016 0.141 0.014 0.09 0.134 1
20 Cumulative Production (novel) 0.011 0.0385 -0.005 0.004 -.001 0.007 -0.003 -0.005 0.003 -.001 0.003 0.021 0.008 0.021 -0.062 -0.001 0.058 0.007 0.035 0.048 0.039 1
21 Recent Production 0.0004 0.0016 -0.017 .000 -0.012 0.013 0.002 -0.012 0.019 0.009 -0.003 0.006 -0.011 0.016 -0.096 0.013 0.079 0.007 0.072 0.088 0.771 0.04 1
22 Recent Production (novel) 0.0066 0.0479 0.01 -0.008 -0.137 -0.018 -0.047 -0.001 0.127 -0.021 -0.037 -0.108 -0.095 0.087 0.015 -0.074 -0.042 0.028 -0.038 0.018 0.068 0.02 0.08 1
23 Social Embeddedness 0.0204 0.1994 -0.003 .001 0.004 0.003 .000 -0.008 -0.008 .000 0.001 0.005 0.006 -0.013 0.009 0.008 -0.004 -0.026 -0.034 -0.003 -0.008 .000 -0.004 -0.003 1
24 Cultural Embeddedness 10.2008 15.6324 -0.029 .001 -0.09 0.005 -0.029 -0.019 0.096 0.016 -0.013 -.001 .000 0.134 -0.054 -0.04 0.134 0.084 0.11 0.235 0.112 0.076 0.143 0.132 -0.002 1
25 Organizational Embeddedness 4.5981 21.5429 -0.006 .001 -0.021 0.009 -0.01 0.002 0.018 0.009 -0.003 0.018 0.025 0.018 -0.054 0.002 0.142 0.041 0.073 0.091 0.034 0.023 0.005 .000 -0.012 0.079 1
26 Geographic Embeddedness 105.524 228.442 0.003 .000 -0.023 -0.005 -0.013 -0.004 0.002 0.003 0.005 -0.007 0.015 0.051 0.052 .000 0.117 0.355 0.149 0.048 0.024 0.065 0.069 0.066 -0.034 0.366 0.119 1
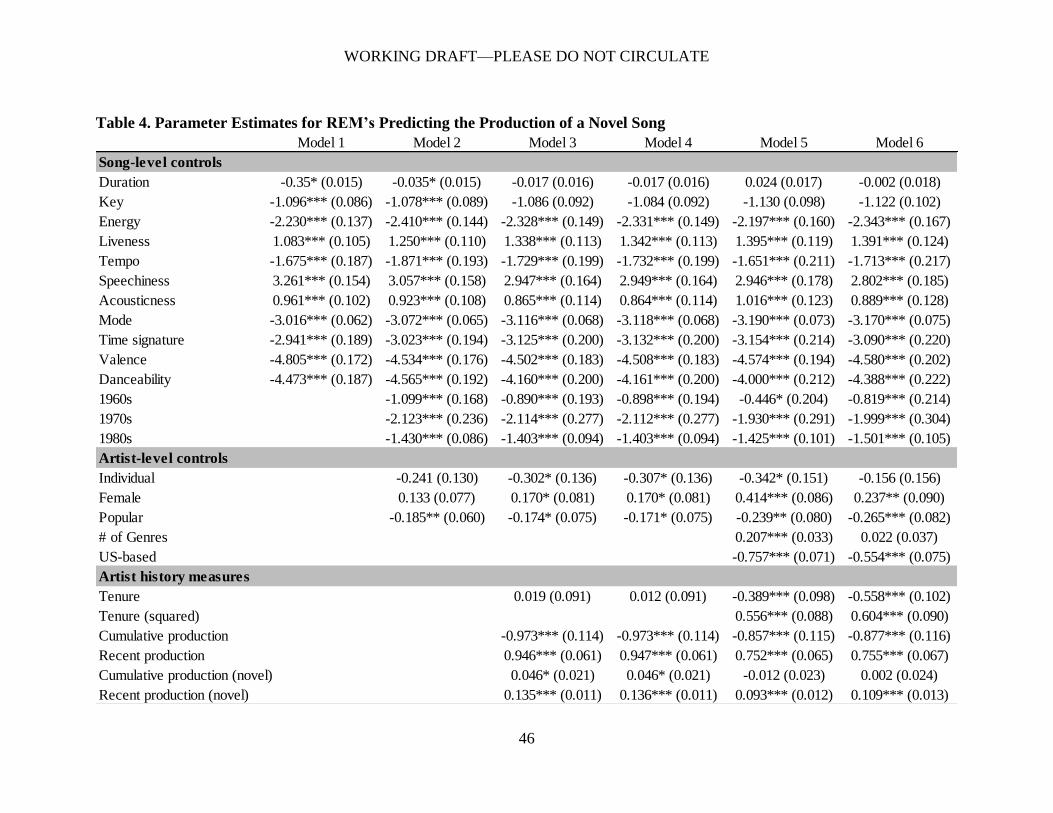
WORKING DRAFT—PLEASE DO NOT CIRCULATE
46
Table 4. Parameter Estimates for REM’s Predicting the Production of a Novel Song
Model 1 Model 2 Model 3 Model 4 Model 5 Model 6
Song-level controls
Duration -0.35* (0.015) -0.035* (0.015) -0.017 (0.016) -0.017 (0.016) 0.024 (0.017) -0.002 (0.018)
Key -1.096*** (0.086) -1.078*** (0.089) -1.086 (0.092) -1.084 (0.092) -1.130 (0.098) -1.122 (0.102)
Energy -2.230*** (0.137) -2.410*** (0.144) -2.328*** (0.149) -2.331*** (0.149) -2.197*** (0.160) -2.343*** (0.167)
Liveness 1.083*** (0.105) 1.250*** (0.110) 1.338*** (0.113) 1.342*** (0.113) 1.395*** (0.119) 1.391*** (0.124)
Tempo -1.675*** (0.187) -1.871*** (0.193) -1.729*** (0.199) -1.732*** (0.199) -1.651*** (0.211) -1.713*** (0.217)
Speechiness 3.261*** (0.154) 3.057*** (0.158) 2.947*** (0.164) 2.949*** (0.164) 2.946*** (0.178) 2.802*** (0.185)
Acousticness 0.961*** (0.102) 0.923*** (0.108) 0.865*** (0.114) 0.864*** (0.114) 1.016*** (0.123) 0.889*** (0.128)
Mode -3.016*** (0.062) -3.072*** (0.065) -3.116*** (0.068) -3.118*** (0.068) -3.190*** (0.073) -3.170*** (0.075)
Time signature -2.941*** (0.189) -3.023*** (0.194) -3.125*** (0.200) -3.132*** (0.200) -3.154*** (0.214) -3.090*** (0.220)
Valence -4.805*** (0.172) -4.534*** (0.176) -4.502*** (0.183) -4.508*** (0.183) -4.574*** (0.194) -4.580*** (0.202)
Danceability -4.473*** (0.187) -4.565*** (0.192) -4.160*** (0.200) -4.161*** (0.200) -4.000*** (0.212) -4.388*** (0.222)
1960s -1.099*** (0.168) -0.890*** (0.193) -0.898*** (0.194) -0.446* (0.204) -0.819*** (0.214)
1970s -2.123*** (0.236) -2.114*** (0.277) -2.112*** (0.277) -1.930*** (0.291) -1.999*** (0.304)
1980s -1.430*** (0.086) -1.403*** (0.094) -1.403*** (0.094) -1.425*** (0.101) -1.501*** (0.105)
Artist-level controls
Individual -0.241 (0.130) -0.302* (0.136) -0.307* (0.136) -0.342* (0.151) -0.156 (0.156)
Female 0.133 (0.077) 0.170* (0.081) 0.170* (0.081) 0.414*** (0.086) 0.237** (0.090)
Popular -0.185** (0.060) -0.174* (0.075) -0.171* (0.075) -0.239** (0.080) -0.265*** (0.082)
# of Genres 0.207*** (0.033) 0.022 (0.037)
US-based -0.757*** (0.071) -0.554*** (0.075)
Artist history measures
Tenure 0.019 (0.091) 0.012 (0.091) -0.389*** (0.098) -0.558*** (0.102)
Tenure (squared) 0.556*** (0.088) 0.604*** (0.090)
Cumulative production -0.973*** (0.114) -0.973*** (0.114) -0.857*** (0.115) -0.877*** (0.116)
Recent production 0.946*** (0.061) 0.947*** (0.061) 0.752*** (0.065) 0.755*** (0.067)
Cumulative production (novel) 0.046* (0.021) 0.046* (0.021) -0.012 (0.023) 0.002 (0.024)
Recent production (novel) 0.135*** (0.011) 0.136*** (0.011) 0.093*** (0.012) 0.109*** (0.013)

WORKING DRAFT—PLEASE DO NOT CIRCULATE
47
Standard errors in parentheses; * p < .05, ** p < .01, *** p <.001
Note: the number of observed events represents the number of novel songs predicted across the dataset, while the number of potential
events includes a risk set constructed by selecting random combinations of artists and songs over time that are then used to test the
robustness of our effects. The total number of observed events (novel and not-novel) in our dataset is 114,386.
Embeddedness measures
Social -0.052 (0.033) -0.052 (0.033) -0.007 (0.033)
Cultural 0.319*** (0.020) 1.422*** (0.060)
Cultural (squared) -0.874*** (0.044)
Organizational 0.017 (0.027) 0.003 (0.029)
Geographic 0.461*** (0.025) 0.354*** (0.026)
Goodness of Fit
-2 Log Likelihood 7,829.054 7,306.796 6,806.067 6,803.465 5,950.125 5,524.358
Observed (potential) events 2,500 (77,760)
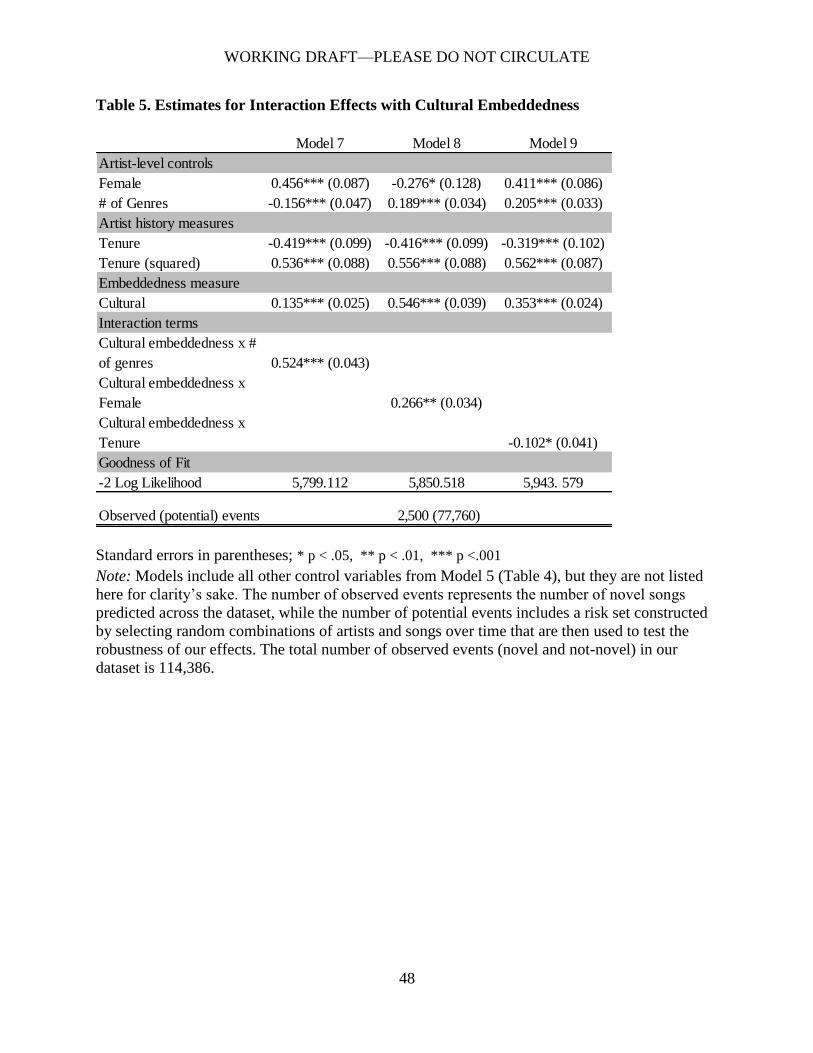
WORKING DRAFT—PLEASE DO NOT CIRCULATE
48
Table 5. Estimates for Interaction Effects with Cultural Embeddedness
Standard errors in parentheses; * p < .05, ** p < .01, *** p <.001
Note: Models include all other control variables from Model 5 (Table 4), but they are not listed
here for clarity’s sake. The number of observed events represents the number of novel songs
predicted across the dataset, while the number of potential events includes a risk set constructed
by selecting random combinations of artists and songs over time that are then used to test the
robustness of our effects. The total number of observed events (novel and not-novel) in our
dataset is 114,386.
Model 7 Model 8 Model 9
Artist-level controls
Female 0.456*** (0.087) -0.276* (0.128) 0.411*** (0.086)
# of Genres -0.156*** (0.047) 0.189*** (0.034) 0.205*** (0.033)
Artist history measures
Tenure -0.419*** (0.099) -0.416*** (0.099) -0.319*** (0.102)
Tenure (squared) 0.536*** (0.088) 0.556*** (0.088) 0.562*** (0.087)
Embeddedness measure
Cultural 0.135*** (0.025) 0.546*** (0.039) 0.353*** (0.024)
Interaction terms
Cultural embeddedness x #
of genres 0.524*** (0.043)
Cultural embeddedness x
Female 0.266** (0.034)
Cultural embeddedness x
Tenure -0.102* (0.041)
Goodness of Fit
-2 Log Likelihood 5,799.112 5,850.518 5,943. 579
Observed (potential) events 2,500 (77,760)
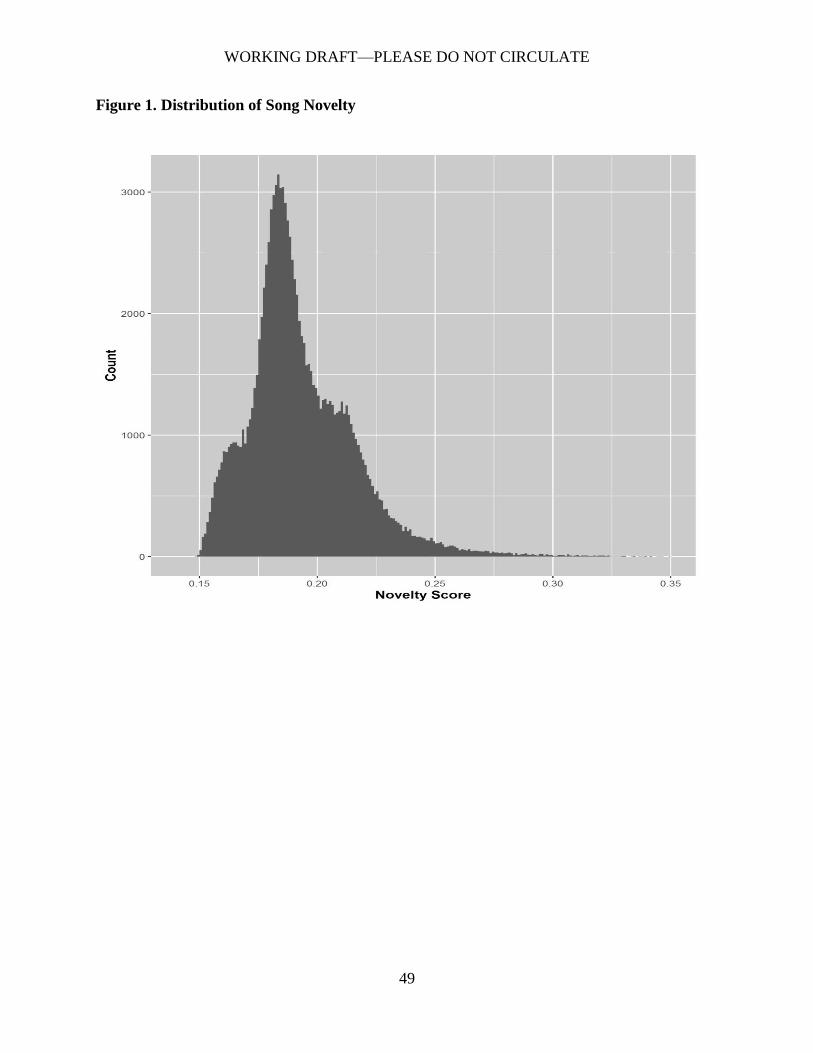
WORKING DRAFT—PLEASE DO NOT CIRCULATE
49
Figure 1. Distribution of Song Novelty
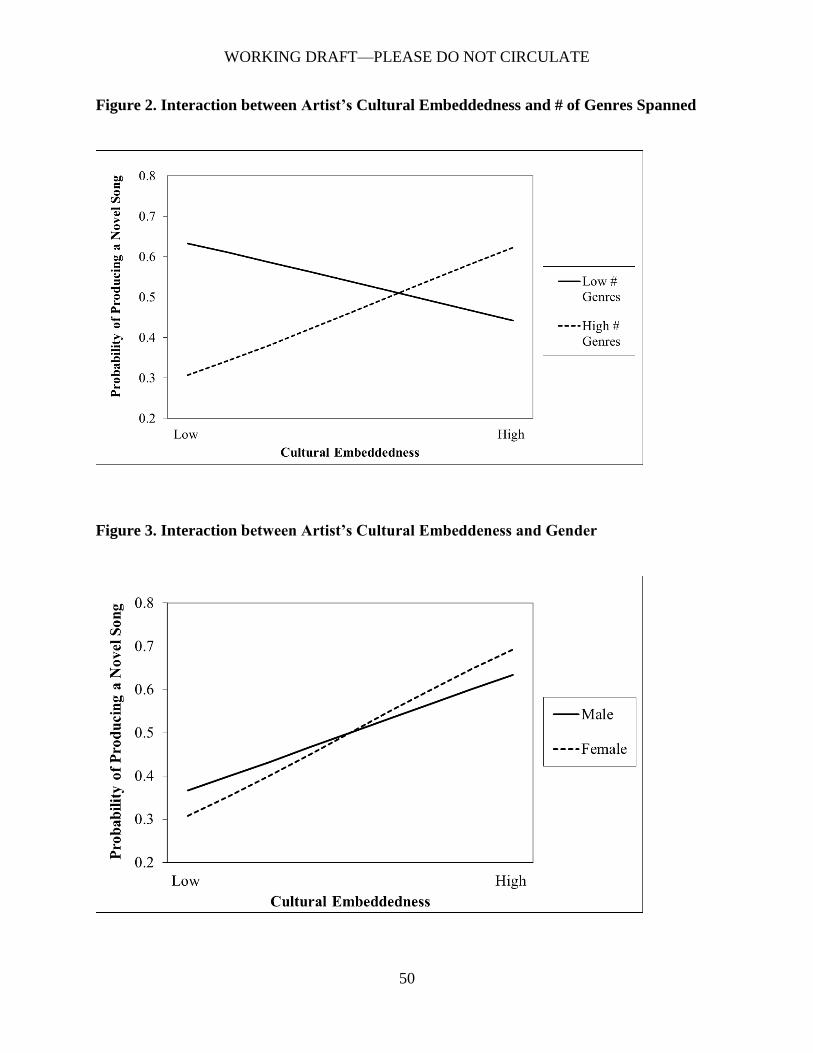
WORKING DRAFT—PLEASE DO NOT CIRCULATE
50
Figure 2. Interaction between Artist’s Cultural Embeddedness and # of Genres Spanned
Figure 3. Interaction between Artist’s Cultural Embeddeness and Gender

WORKING DRAFT—PLEASE DO NOT CIRCULATE
51
Figure 4. Interaction Artist’s Cultural Embeddeness and Tenure