the privatization of turk telekom: case study1 · turk telekom is the incumbent telecommunications...
TRANSCRIPT

Prof. Bülent Gültekin July 2010
Private Equity Workshop – Tenth Annual Private Equity Conference at the Federal Reserve Bank of Chicago
International Private Equity: Southeast Europe Region
The Privatization of Turk Telekom: Case Study1
1 This case was prepared for a workshop at The Tenth Annual Private Equity Merchant Banking Conference at the Federal Reserve Bank of Chicago on July 20, 2010. Daniel Menendez, Wharton ‘10, wrote the case under the supervision of Professor Bülent Gültekin using publicly available materials. This is the first draft of the case and is not intended for distribution beyond the conference participants. We thank Mimi Xue, Wharton ’11, for her editorial contributions.

2
The Privatization of Turk Telekom
The Telecommunications Private Equity Consortium (TPEC) is analyzing a proposal to acquire a
55% stake in Turk Telekom (TT), the primary provider of telecommunications services in Turkey
with 19.4 million fixed line subscribers and 3.2 million data and internet subscribers. The Turkish
Government owns 100% of TT and is conducting a partial privatization with an installment
payment plan that requires 20% down payment at closing in June 2005 with the remaining 80%
paid in 5 equal installments financed at LIBOR + 2.5%. Each year the buyer will be required to post
a “performance bond” in the amount of the following year’s installment (principal and interest).
More information about the privatization requirements are presented in page 11 and in the exhibits.
TPEC believes Turk Telekom is a profitable monopoly that is under-managed by the government
and could be repositioned by adjusting its strategy, redirecting the firm’s marketing efforts, and
improving its cost management. Furthermore, Turkey seems like an attractive market given its size,
recent macroeconomic achievements, and positive outlook. TT’s privatization is considered a
unique investment opportunity that has been accelerated under the Justice and Development Party
(AKP) leadership. The Cabinet has recently passed a decree stipulating that a 55% controlling stake
in the company would be initially sold to a qualified strategic investor in an open auction. The
Turkish treasury wants the acquirer to be a world-class partner with a view of increasing efficiency
and the service quality. To meet this requirement, TPEC is partnering with Prussia Telecom, a
major European telecommunications operator, to make a joint bid.
Turk Telekom Turk Telekom is the incumbent telecommunications operator in Turkey and was established in 1995
when the telecommunications business was split off from the General Directorate of Postal,
Telegraph and Telephone (PTT). TT has 56,022 employees and is the world’s 15th largest operator
in terms of subscriber base and the 13th largest in network capacity. TT’s net revenues for 2003
and 2004 were $4,314 and $4,630 million2 with EBITDAs of $1,863 and $1,968 million,
respectively. For the fiscal year ending December 2005, the firm is expected to generate $4,900 2 All figures in this document that carry a $ sign are expressed in U.S. dollars.

3
million in revenues and $2,100 million of EBITDA. The financial data and projections can be found
in Exhibits 1 and 2. The following table presents some key operational metrics for the company:
Turk Telekom provides the following services as an integrated operator: PSTN (telephone), mobile,
cable TV, cable internet, data & internet services. Below we present summaries of each service, and
it is important to note that Cable TV and Cable internet services are not part of this privatization.
PSTN (Telephone Services) – TT has a capacity of 21.4 million access lines and a
penetration of 27% if measured by population and 94% if measured by number of
households. The access lines are 93% digital, 78% urban and 76% residential.
The access lines are geographically distributed as follows: 38% in the top 3 cities (Istanbul,
Ankara, and Izmir) and 55% in the top 10 cities. About 50% of the lines are in the West,
40% in the central region, and 10% in the East.
Dec-00 Dec-01 Dec-02 Dec-03 Dec-04Access Lines in Service 18.4 18.9 18.9 18.9 18.9Access Line Capactiy (m) 20.8 21.3 21.1 21.2 21.4Fixed Line Penetration (as % of population) 27% 27% 27% 27% 27%Digitalization Switches 87% 89% 90% 91% 96%Digitalization Transmission 97% 98% 98% 100% 100%Number of Employees 71,965 69,545 63,598 61,219 56,022
PSTN Data for 2004
YearNumber of
PSTN Subscribers
Increase YoYTelephone
Penetration Values per Population
1995 13,227,704 8.46% 21.20%1996 14,286,460 8.00% 22.40%1997 15,579,458 9.05% 24.80%1998 16,806,982 7.88% 26.30%1999 17,911,722 6.57% 27.60%2000 18,395,171 2.70% 28.00%2001 18,904,486 2.77% 28.50%2002 18,890,000 -0.08% 27.10%2003 18,916,721 0.14% 26.70%2004 19,125,163 1.10% 27.00%
Source: Telecommunications Authority of Turkey

4
In 2004, Turk Telekom had a Principal/Exchange rate of 1.74 and a Local/Principal rate of
1.60, which indicates that the local network (copper wires used for access purposes in public
switched services) does not have a capacity problem. In August 2004, Turk Telekom
implemented a tariff rebalancing strategy and introduced different customer plans with price
reductions, especially for long distance and international calls. TT operates 80,000
payphones with either magnetic card payphones (70% of the total) or smart/credit card
payphones (30%) and is considering installing an additional 70,000 smart payphones. TT
offers other services within PSTN such as directory and operator assistance, convenience
services (wake-up calls, reminders, caller ID, call forwarding, call waiting, conference call,
etc), and toll-free and private service numbers.
Mobile Services (AVEA) – the mobile segment together with the broadband segment in
fixed services is TT’s expected growth engine, and Avea is TT’s mobile service provider.
Avea is a merged entity established between TT’s Aycell and Aria (jointly owned by
Telecom Italia and Isbank, a local Turkish bank). The history of this merger illustrates the
competitive dynamics and regulatory landscape of the mobile segment. Incumbents in the
Turkish mobile sector were “Turkcell” (the market leader) and “Telsim”. In 2000, Telecom
Italia entered the market with “Aria” by acquiring the third GSM license at $2.95 billion,
twice as high as the second highest offer. This was done to introduce a barrier to entry for a
4th player as the bid was to set the minimum benchmark for the next license. This strategy
worked until TT decided to enter the mobile market with “Aycell” and paid a $5.7 billion
fee for the license. In 2003, Aria and Aycell decided to merge, given the financial impact of
the strong 2001-devaluation of the Turkish Lira, the weak macro-environment, and both
companies’ inability to reach economies of scale and capture market share (they had only
7% and 4% MS, respectively). In February 2004, Avea was formed. TT currently owns
Dec-00 Dec-01 Dec-02 Dec-03 Dec-04Digital Access Lines 87% 89% 90% 91% 93%Analog Access Lines 13% 11% 10% 9% 7%Lines in Urban Areas 75% 76% 77% 78% 78%Lines in Rural Areas 25% 24% 23% 22% 22%Business Lines 24% 24% 24% 24% 24%Residential Lines 76% 76% 76% 76% 76%

5
40.6% of the company, which is now the third and smallest player in the Turkish GSM
sector.
Avea still holds the combined spectrum of Aria and Aycell, but it will soon have to divest
half in an open auction held by the regulator. This should attract new entrants to the mobile
sector.
Avea currently has 15% market share with 5.5 million subscribers (36% are postpaid) and
covers 25% of the country’s area and 62% of the population. Telsim was seized by the
government due to criminal charges against the owners. This has allowed Avea to capture
market share, at least temporarily since Telsim will probably be sold after the privatization
of Turk Telekom.
A key measure used in the mobile sector is the Average Revenue Per User (ARPU), which is
currently $10 per user for Avea. This is about 20% lower than its competitors. In
comparison, Turkcell’s blended ARPU is $12 per user. TPEC’s partner, Prussia Telecom,
believes that Avea can increase its ARPU through a more focused marketing strategy and
convergent services. In addition, Avea can benefit from Telsim’s current situation and
continue capturing market share and raising its ARPU.
Despite the recent positive momentum, Avea has incurred losses since its inception. By
December 2004, the company has already impaired $4.6 billion of the GSM license,
although only 40% impacted TT’s income statement. Avea needs an injection of $1.3 billion
to refinance $1 billion in defaulted debt and an additional $300 million to cover short term
cash-flow requirements. Initially, Telecom Italia arranged $1.5 billion in financing but did
not complete the transaction because this required a government pledge of TT’s Avea stake
and could have jeopardized the privatization process. Hence, the funding will have to be
addressed after TT is privatized.
Avea's Shareholder Structure
Company PercentageTurk Telekom 40.6%Telekom Italia Mobile 40.6%Isbank 18.8%Total 100.00%

6
Cable TV and Cable Internet Services - This business segment is not part of the current
privatization process. The Cable TV service was launched in 1991 and is offered in 20
provinces to 1.2 million subscribers and over 2.5 million homes. Cable internet is offered in
12 provinces. The company has partnerships with local players who invest in increasing
capacity, customer expansion, and maintenance.
Data and Internet Services – TT offers DSL, VoIP, WLAN and Leased Line services.
Transmission costs for these services are suboptimal because they do not share a common
backbone and have low interworking between networks, which include Turkey Digital Data
Network (TDM – TSDnet), Turkey Packet Switching Network (TURPAK), Turk Telekom
Network (TTnet), and the IP Backbone.
Business Optimization: Human Resources, Networks, Real Estate and Information Technology
TPEC is considering different alternatives to improve operating efficiency and reduce costs, which
require modifying the employee base, optimizing the multiple networks, expanding the real estate,
and upgrading TT’s information technology.
Human Resources: there is a need to rationalize the employee base, improve employee talent, and
raise productivity. Turk Telekom has 56,022 employees with a productivity ratio of 350 access lines
per employee. This is acceptable for international standards but not for TT since its ratio requires
important adjustments. TT’s productivity ratio is skewed upwards since the company has very few
customer service employees and relies heavily on subcontracting for daily operations. However, the
real productivity ratio is difficult to measure for an appropriate comparison. The government has
agreed to relocate up to 26,277 employees without union memberships (47% of the total TT
employees) to other public companies and at no cost for the buyer. The remaining employees have
signed a collective union agreement and any decision to continue reducing headcount beyond those
26,277 employees would be allowed by both the government and the union but at a cash severance
cost of approximately $15,000 per employee.

7
The employee base has to be rebalanced to reflect more sales and less technical personnel, which
requires re-training or substantial hiring. Massive layoffs will not be required since the total number
of employees needed by 2010 is forecasted to be 42,255 (gradual reduction or re-training can be
done). In order to achieve a commercially focused business operating in a more competitive
environment, TPEC needs to revamp its senior management team and recruit a new CEO, CFO,
CTO, CMO and HR director (among other executives). To retain talent, a retention policy needs to
be implemented together with a new high-quality HR management system.
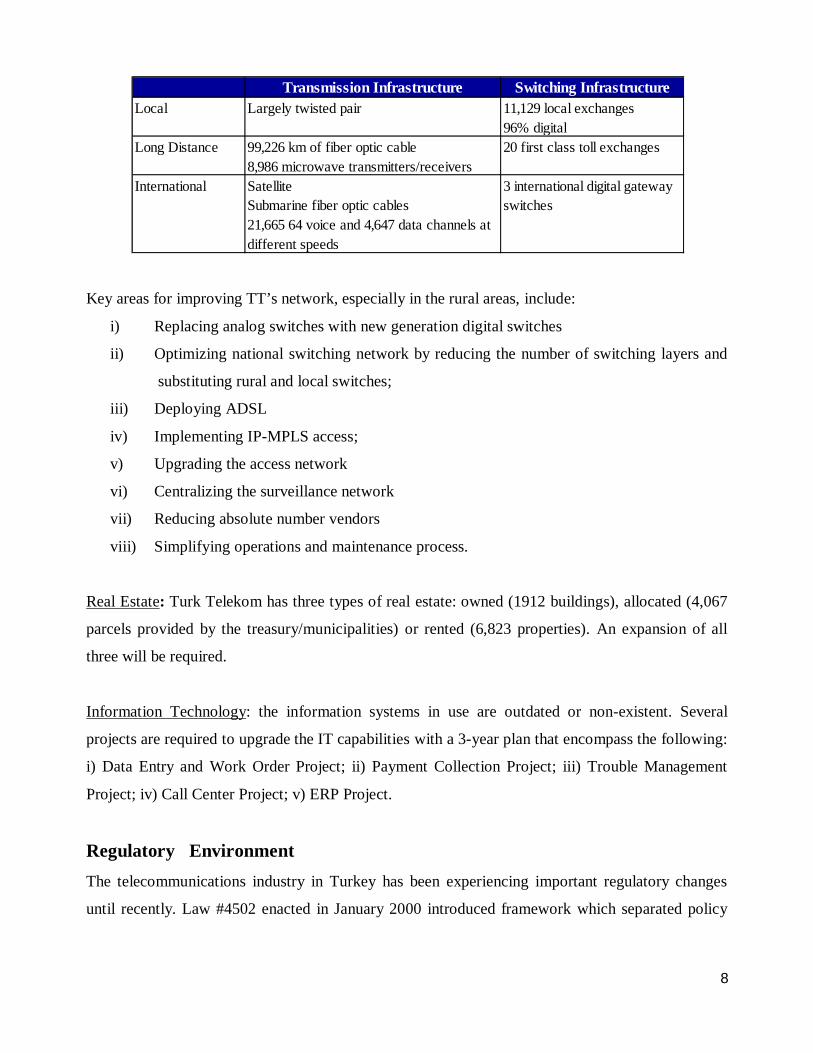
Network: its characteristics and evaluation of the current capabilities are presented in the table
below.
Other network characteristics include:
93% digitalization of the local exchange
100% digitalization of the transmission network
91% of the transmission media is fiber optic
Fiber optic transmission media constitutes 91% of the transmission infrastructure and uses DWDM,
SDH and PDH technologies
1,304,112 km of fiber optic cable has been installed along 99,226 km
Digital microwave systems are used to cover most of the major traffic destinations and to provide
back-up to the fiber optic routes
Digital microwave systems account for approximately 9% of the transmission capacity.
Service Existing Capabilities Evaluation20 m installed lines on digital exchange provided by 4 vendors
High level of maintenance expenses needed
~1 m lines on analog switches Complex mgmt of switches due to high # of vendorsSDHDWDMFiber optic cablesRadio relay systemsIP backboneTURPAK: packet switched data network
TTNet: frame relay/ATM data networkADSL ADSL coverage ~80% of linesMetro Ethernet ADSL technology up to dateWireless High copper quality to support ADSL growth
Access
PSTN
Transmission Transmission network in the urban areas seems to be technologically up to date
Data Multiple (2) data networks related to different data transmission protocols
8
Key areas for improving TT’s network, especially in the rural areas, include:
i) Replacing analog switches with new generation digital switches
ii) Optimizing national switching network by reducing the number of switching layers and
substituting rural and local switches;
iii) Deploying ADSL
iv) Implementing IP-MPLS access;
v) Upgrading the access network
vi) Centralizing the surveillance network
vii) Reducing absolute number vendors
viii) Simplifying operations and maintenance process.
Real Estate: Turk Telekom has three types of real estate: owned (1912 buildings), allocated (4,067
parcels provided by the treasury/municipalities) or rented (6,823 properties). An expansion of all
three will be required.
Information Technology: the information systems in use are outdated or non-existent. Several
projects are required to upgrade the IT capabilities with a 3-year plan that encompass the following:
i) Data Entry and Work Order Project; ii) Payment Collection Project; iii) Trouble Management
Project; iv) Call Center Project; v) ERP Project.
Regulatory Environment The telecommunications industry in Turkey has been experiencing important regulatory changes
until recently. Law #4502 enacted in January 2000 introduced framework which separated policy
Transmission Infrastructure Switching Infrastructure11,129 local exchanges96% digital
99,226 km of fiber optic cable8,986 microwave transmitters/receiversSatelliteSubmarine fiber optic cables21,665 64 voice and 4,647 data channels at different speeds
Local Largely twisted pair
Long Distance 20 first class toll exchanges
International 3 international digital gateway switches

9
making, regulatory and operational functions, established an independent regulator, and set
guidelines for pricing and interconnection.
Three entities are currently responsible for regulating the Turkish Telecommunications industry:
a) The Ministry of transportation – establishes the telecommunications policy and determines
the scope of universal service requirements.
b) The Telecom Authority (TA) – regulates tariffs, access, interconnections, and service
quality; issues authorization agreements, concession agreements, licenses, and permissions
for operators; resolves disputes, etc. In general, the TA regulates the fixed interconnection
and mobile termination rates in Turkey and has consistently reduced rates since 2003 on the
basis of international benchmarks. The TA may continue to revise these rates downwards.
c) The Competition Board – enforces the competition law and carries out investigations in the
telecommunications sector. It is the entity responsible for authorizing mergers and
acquisitions and grant exemptions or negative clearance certificates to agreements.
The market for telecommunications equipment in Turkey was liberalized in the 1980s. Mobile
services were provided by two competing firms, Turkcell and Telsim, which had revenue share
agreements with TT. In 1998, the two operators where then issued licenses to operate GSM 900
networks. Value-added services were liberalized earlier in 1994. The rest of the market (PSTN
services, CATV, fixed telecom infrastructure) was opened to competition in January 2004, ending
Turk Telekom’s legal monopoly over PSTN services.
Turkish Telecommunications Market Turkey is the largest telecommunications market in Central and Eastern Europe, Middle East and
Africa, resulting from its large and relatively wealthy population (70 million inhabitants with about
$8,500 of GDP per capita). The Turkish fixed line market is the largest in the region and has
achieved rapid growth in broadband and mobile penetration. Communications spending accounts
for 2.3% of GDP in Turkey. Given the high correlation between GDP and telecom spending per
capita, the forecasted real GDP growth rate of 5% for the Turkish economy should have important
wealth effects in the telecom market.

10
Currently, the Turkish telecom market totals $8.5 billion with 19.4 million fixed lines, 36 million
mobile subscribers and the following revenue breakdown:
In general, the number of subscribers of most segments has been growing at a high rate, especially
for mobile telephones. The following table shows the evolution of the total number of GSM
subscribers:
GSM Penetration by population in EU-25 countries is 83% while the same rate is only 49% for
Turkey. This depicts the growth potential of the GSM segment. For upcoming years, analysts also
expect strong growth in the broadband market and pressure on voice revenue.
Turk Telekom can expect changes in the competitive landscape resulting from:
1. GSM operators (mobile segment) – users of fixed lines switching to mobile lines and
competition for business customers via GSM boxes.
2. Alternative Operators – new operators as potential market entrants (such as Tele 2) in
2006/2007.
Segment Participation Revenues ($ millions)
Voice telephone 52.2% 4,437 Data 4.6% 391 Internet 2.5% 213 Mobile 37.5% 3,188 Cable TV 1.1% 94 Satellite TV 2.1% 179 Total Market 100.0% 8,500$
YearGSM
Subscribers
1996 692,779 1997 1,481,323 1998 3,360,000 1999 7,560,000 2000 14,970,000 2001 18,228,598 2002 23,323,113 2003 27,887,535 2004 34,707,549
-
5,000,000
10,000,000
15,000,000
20,000,000
25,000,000
30,000,000
35,000,000
40,000,000
1996 1997 1998 1999 2000 2001 2002 2003 2004

11
3. Cable TV – competition can result from the Cable TV business considering:
i) The two-way provision of all sound, data, image and radio/TV signals
over the Cable TV Network.
ii) Cable TV’s ability to offer video, voice, and internet services.
iii) Market that passes 2.5 million homes with 1.2 subscribers.
Nevertheless, in Turkey, Cable TV was combined with the loss-making
satellite business and analysts argue that the combined entity will lack the
resources and focus to formulate and execute a successful expansion strategy,
at least in the near term. In the long term, the consequences could be more
serious. Local loop unbundling (LLU) will not be licensed before 2005 (not
in the Telecom Authority’s 2005 work plan), but when it happens, LLU can
become a competitive product/tool considering that the population is
concentrated (60% of the population is categorized as “urban” and one third
of them are concentrated in the five largest cities).
Quick overview of Turkey Turkey is the second largest country by area in Europe after Russia. Turkey’s population is 70
million and is growing at more than 1% annually, making Turkey the most populous nation in
Europe by 2015. The country became a republic in 1923 with a multi-party parliamentary
democracy and has single-party rule since then, with new elections scheduled for 2007. The current
Turkish government has a majority in parliament and a strong focus on reform, pushing important
privatizations such as Turk Telekom.
Important data points for Turkey consider:
The monetary policy is governed by an independent Central Bank
The Turkish Lira has a fully floating exchange rate
Foreign exchange reserves amount to $35 billion.
It currently has BB-/BB foreign/local rating.
GDP is $300 billion and grew 9% in 2004 with an inflation rate of 8% (projected to be 5%
by the end of 2007).
The macroeconomic environment has improved rapidly with declining interest rates and
sustainable decreases in inflation.
12
The foreign exchange parity is expected to remain stable as the Turkish Lira is supported by
economic reforms and the flow of revenues streaming from tourism. During the first 6 months of
2005, the Turkish Lira appreciated against the dollar but depreciated severely in 2001 and 2002 of
115% and 13% respectively, severely affecting investments in the telecommunications sector. Since
then many reforms have been implemented, including the establishment of an independent central
bank, a floating currency regime, and a more disciplined monetary/fiscal policy.
Turkey has strong economic and cultural ties with Europe, Caucasus, the Middle East and Central
Asia and began accession negotiations with the European Union. The country is member of NATO
and OECD. The Istanbul Stock Exchange (ISE) has a market capitalization of approximately $100
billion with an annual turnover of $180 billion, and is the most likely venue for an eventual IPO for
Turk Telekom.
The Privatization Process
This is the Turkish government’s third attempt in seven years to privatize Turk Telekom. To
succeed this time, the government has improved the regulation, changed the ownership structure,
modified the repayment schedule and removed several constraints. The process timeline is as
follows:
Pre-qualification January 11th, 2005
Conduct due diligence February 7th to April 7th, 2005
Deadline for SPV Consortium formation June 17th, 2005
Final bids due June 24th, 2005
Closing November 2005
Transaction and Financing Structure
The tender specification for Turk Telekom’s privatization provides that:
The SPV for the privatization of the 55% stake must be established in Turkey. Turk
Telekom will become a joint-stock company under the ownership of the Undersecretariat of
the Treasury of the Turkish Republic.

13
An installment payment method is available whereby 20% of the purchase price is paid at
closing and the balance can be paid in 5 equal installments at one-month LIBOR+2.5% rate
(in US Dollars).
Purchase price needs to be secured by an annual performance bond, share pledge and a
guarantee of the 20% down payment, which terminates at closing.
The SPV will receive 55% of the dividends of Turk Telekom.
SPV investors will nominate 6 out of 10 directors with major decisions requiring 7 out of 10
votes.
TT will not provide any upstream guarantees for SPV obligations.
The Ministry of Transportation will exercise shareholders rights for the Government’s 45%
stake and all corresponding financial benefits will go to the Treasury.
Financing and Exit Strategy
The Consortium plans to inject $250 million of equity into the SPV at closing. In general, the
shareholders of the SPV will provide any additional funding as non-interest bearing subordinated
debt to the SPV. This makes the structure more efficient when considering the corporate taxation
costs on interest and the withholding taxes. The installment payment option makes the deal
attractive because it provides upfront leverage with the government that helps minimize the equity
commitment at closing. A revolving credit facility at the SPV level will fund a significant portion of
each installment paid to the government. The levels of leverage can be sustained because with every
installment paid, the government releases paid-up shares from the pledge. These shares can be re-
pledged to other lenders as security. Dividends will be used to cover some part or all of the
installments (although during the first two years there a mismatch is expected – so mostly debt has
been used in the financial projections).
The deal contemplates two different exit alternatives: The first one is to sell the shares of Turk
Telekom on the exchange outside Turkey. This can be done through a tax-free merger of the SPV
into TT. The SPV needs to remain in existence until it satisfies its obligations to the government (at
least three years), so this tax-free transaction can be done after repaying the loan, and it would
require clearance from the Capital Markets Board and the Privatization Agency. If the SPV repays
its debt before the merger, there is a higher probability of clearance given that Turk Telekom
wouldn’t be burdened with additional debt.

14
The second exit strategy is to sell the SPV shares in the public market or in a negotiated private sale
to a non-Turkish resident in a transaction effected outside Turkey. The sale of SPV shares to a
person outside the Turkish taxing jurisdiction would not be subject to Turkish Tax (tax on capital
gains and withholding tax add up to a combined rate of 37%). This also created a tax-efficient
structure: the dividends paid by TT to the SPV are not subject to tax while the dividends paid by the
SPV to TPEC would only be subject to a 10% withholding tax.
The diagram below shows the basic structure of the overall transaction, where TPEC and Prussia
Telecom own the “Acquisition SPV”. The breakdown of ownership for Turk Telekom and AVEA
are shown in percentages at the corresponding level.
The privatization seems attractive at different acquisition prices. Exhibit 1 presents the highlights of
the financial model considering a total equity value of $8 billion. Exhibit 2 presents the assumptions
behind the model. Under the base case projections of an Equity Value of $8 billion and an exit
multiple of 5.6x EBITDA, the IRRs at different exit years are estimated to be the following:
.
Foreign SPV Turkish SPV
Acquisition Co (Turkish SPV) Bank Credit Facility
TURK TELEKOM (OpCo) Telecom Italia IS Bank
AVEA (Mobile)
Turkish Government
45% 55%
18.8%40.6%40.6%
Exit year IRR(in millions of USD) 2005 2006 2007 2008 2009 2010 2011 2012Year 3 71% ($945) ($396) $0 $5,897Year 4 50% ($945) ($396) $0 $0 $6,149Year 5 38% ($945) ($396) $0 $0 $0 $6,109Year 6 31% ($945) ($396) $0 $0 $0 $0 $6,254Year 7 26% ($945) ($396) $0 $0 $0 $0 $0 $6,488
Cash flows to SPV (Equity)

15
The IRR is sensitive to several factors such as the valuation price paid, the exit year, the exit
multiple, margin expansion or contraction, changes to investment requirements and other factors
that may affect cash flows. The Telecommunications Private Equity Consortium is interested in this
privatization, but the investment committee is concerned about the multiple risks of entering this
transaction, among them the future of the industry in Turkey, the competitive landscape, the
regulatory environment, the reliability of the macroeconomic forecasts, the stability of the Turkish
Lira, the suitability of the valuation assumptions, and the region’s political volatility.

16
Exhibit 1: Financial Projections – Base Case Scenario Assumes $8.0 billion TT Equity Value
TURK TELEKOMBase Case Scenario - Operating Projections
(in millions of USD) Actual '05-10 2004 2005 2006 2007 2008 2009 2010 2011 2012 CAGR
Access Lines (mm) 19.1 19.4 19.6 19.9 20.2 20.4 20.7 20.9 21.2 1.3%% Growth 0.9% 1.5% 1.3% 1.3% 1.3% 1.3% 1.3% 1.3% 1.3%
ADSL Subs (mm) 0.5 1.2 1.9 2.6 3.1 3.7 4 4.3 4.5 27.2%% of Access Lines 2.4% 6.2% 9.7% 13.1% 15.6% 18.2% 19.4% 20.6% 21.6%
Exchange Rate 1.42 1.39 1.50 1.59 1.68 1.77 1.85 1.92 1.99
Total Revenue 4,630$ 4,890$ 5,050$ 5,268$ 5,470$ 5,510$ 5,443$ 5,389$ 5,362$ 2.2%% Growth 7.3% 5.6% 3.3% 4.3% 3.8% 0.7% -1.2% -1.0% -0.5%
EBITDA 1,968$ 2,064$ 2,009$ 2,219$ 2,412$ 2,417$ 2,319$ 2,276$ 2,252$ 2.4%% Margin 42.5% 42.2% 39.8% 42.1% 44.1% 43.9% 42.6% 42.2% 42.0%% Growth 5.6% 4.9% -2.7% 10.5% 8.7% 0.2% -4.1% -1.9% -1.1%
Net Income 1,056$ 1,020$ 1,234$ 1,416$ 1,436$ 1,408$ 1,438$ 1,414$ 5.9%% Margin 21.60% 20.20% 23.42% 25.89% 26.06% 25.87% 26.68% 26.37%% Growth - -3% 21% 15% 1% -2% 2% -2%
Dividend to be distributed Next Year * 0 1,345$ 1,175$ 1,070$ 1,230$ 1,247$ 1,223$ 1,249$ 1,226$ -1.9%
Capex 320 460 845 807 811 790 705 632 625 8.9%% of Revenue 6.9% 9.4% 16.7% 15.3% 14.8% 14.3% 13.0% 11.7% 11.7%
EBITDA - Capex 1,648$ 1,604$ 1,164$ 1,412$ 1,601$ 1,627$ 1,614$ 1,644$ 1,627$ 0.1%
Projected Years ending December 31st,
SPECIAL PURPOSE VEHICLE
(in millions of USD)
2005 2006 2007 2008 2009 2010 2011 2012Dividend received from previous year* -$ 646$ 589$ 677$ 686$ 673$ 687$ Net Interest (297) (292) (266) (234) (198) (157) (114) Other expenses (12) (12) (12) (12) (12) (12) (12) Cash flow available for debt paydown (309) 342 310 430 476 504 561 Mandatory repayments (704) (704) (704) (704) (704) - - Net Cash/Minimum cash required (5) - - - - - - Cash Available/(Funding Gap) (1,018) (362) (394) (274) (228) 504 561 Debt Issued/(Repaid) 622 362 394 274 228 (504) (561) Total Equity Injected 945 396 - - - - - - Cumulative Equity Injected 945 1,341 1,341 1,341 1,341 1,341 1,341 1,341 * Dividends to be distributed from 2005 and 2006 are based off statutory financials, whereas the financials shows are IFRS
SPV Credit Ratios2005 2006 2007 2008 2009 2010 2011 2012
Revolver 0 622 984 1,378 1,651 1,879 1,375 815 Term Loan 0 0 0 0 0 0 0 0PA Debt 3,520 2,816 2,112 1,408 704 - - - Senior Debt 3,520$ 3,438$ 3,096$ 2,786$ 2,355$ 1,879$ 1,375$ 815$ Junior Debt 0 0 0 0 0 0 0 0Total Debt 3,520$ 3,438$ 3,096$ 2,786$ 2,355$ 1,879$ 1,375$ 815$
Debt Amortization 82$ 342$ 310$ 430$ 476$ 504$ 561$ Cum. Total Debt Paydown 82$ 424$ 734$ 1,165$ 1,641$ 2,145$ 2,705$ % Total debt paydown 2% 12% 21% 33% 47% 61% 77%
Projected Years ending December 31st,
Projected Years ending December 31st,

17
Exhibit 2: Assumptions - Base Case
Transaction
Fees $65 millionSPV ownership in Türk Telekom 55%Installment payment plan: i) 20% at closing (all equity
financed)ii) 80% remaining paid linearly in 5 years (16% annually)
Revenue Assumptions (2005 – 2010)
Segment Revenue Range CAGRSubscription $1,059 mn - $1,133 mn 2.00%Traffic $2,488 mn - $1,632 mn -8.50%Interconnection $124 mn - $73 mn -10.20%GSM Operators $241 mn - $83 mn -19.20%Internet $374 mn - $1,097 mn 24.90%Data $346 mn - $502 mn 8.60%Other $258 mn - $842 mn 28.80%
Opex Assumptions (2005 – 2010)
Segment Expenditure Range CAGRHuman Resources $1,202 mn - $1,361 mn 2.50%Operating & Maintenance $358 mn - $462 mn 5.20%Marketing $11 mn - $107 mn 58.40%General & Administrative $295 mn - $286 mn -0.60%Other $986 mn - $895 mn -1.90%
Capex Assumptions (2005 – 2010)
Segment RangeCAPEX $460 mn - $845 mnCAPEX % of net revenues 9.4% - 16.7%Total CAPEX over 6 years $4,418 mn
Special Purpose Vehicle (SPV)Description AmountDividends for 2006 $0Dividends for 2007 $646 mnDividends for 2008 $589 mnDividends for 2009 $677 mnDividends for 2010 $686 mnCredit Facility Capacity $1.5 billion in initial years.
Capacity increases with time as government debt is repaid.

18
Exhibit 3: Sources & Uses, Acquisition Ratios, and Capitalization
Exhibit 4: Multiples
Source and Uses of Funds (assumes $8.0 billion TT Equity Value)
Sources : Uses : Stock 945$ Equity Purchase Price 4,400$ Preferred Stock -$ Existing Debt Rollover -$ New Debt Issued 3,520$ Financing Costs 30$ Excess Cash from Balance Sheet -$ Deal Transaction Expenses 35$
Total Sources 4,465$ Total Uses 4,465$
Turk Telekom Valuation Multiples
2005E Multiples w/out Fees w/feesFirm Value/Revenue 1.64 1.65Firm Value/EBITDA 3.88 3.91Firm Value/EBITDA - Capex 4.99 5.03Firm Value/Access lines $413 $416
Firm Value (TT ex. AVEA)/Revenue* 1.55 1.52Firm Value (TT ex. AVEA)/EBITDA* 3.68 3.71Firm Value (TT ex. AVEA)/EBITDA - Capex* 4.73 4.77Firm Value (TT ex. AVEA)/Access Lines* $392 $395* Strips out 40% stake in AVEA at assumed value of $407 million

19
Exhibit 5: European Wireline Public Market Comparison
Share
Price
Loca
lYie
ld (%
)
Comp
any
10-Ju
nEq
uity (
9)LM
V (2)
EV (3
)20
05E
2006
E20
07E
2008
E20
05E
2006
E20
07E
2008
E20
05E
2006
E20
07E
2008
E20
05E
2006
E20
07E
2008
E20
05E
2006
E20
07E
2008
E20
05E
Rev.
EBITD
AAdj. E
PS (8
)
Weste
rn Eu
rope
an
Belga
com
€ 27.1
980
.9%
9.810
.311
.55.0
x4.7
x4.4
x4.0
x6.8
x6.4
x5.8
x5.4
x41
.7%
41.9
%42
.2%
42.5
%9.0
%9.5
%10
.2%
10.6
%11
.4x
10.7
x10
.2x
9.8x
4.9%
(0.0)%
0.7%
5.0%
NM
BT G
roup
£ 2.20
99.0
27.2
38.8
38.2
4.64.5
4.44.2
10.1
9.68.8
7.829
.929
.629
.830
.17.9
8.69.1
10.4
12.4
12.1
11.7
11.2
4.9(0.
2)0.0
53.6
NM
Deuts
che T
eleko
m€ 1
4.94
88.7
65.0
111.1
111.2
5.55.1
4.64.3
9.08.2
7.46.9
35.1
35.7
36.6
36.4
11.1
9.710
.812
.211
.67.4
7.78.2
4.62.7
3.912
.21.1
Eirco
m€ 1
.8391
.61.4
3.43.4
5.45.5
5.55.6
8.28.4
8.38.5
39.2
38.6
37.4
35.9
12.7
13.0
14.5
13.9
10.2
10.3
10.6
10.9
6.0(1.
3)(4.
2)(2.
3)NM
Fran
ce Te
lecom
€ 22.8
091
.654
.610
7.110
8.25.9
5.45.0
4.78.4
7.67.1
6.638
.940
.140
.941
.59.4
11.0
11.3
12.0
12.0
9.68.6
7.93.7
2.24.5
14.8
1.3
KPN
€ 6.62
88.3
15.4
23.3
21.3
4.84.7
4.54.3
7.87.5
7.57.0
38.1
38.3
39.0
40.3
12.2
12.2
12.0
12.4
10.3
9.79.1
8.36.0
(1)0.9
7.6NM
OTE
€ 15.8
810
0.07.8
10.7
12.1
5.85.2
4.54.0
10.0
8.76.9
6.137
.338
.239
.939
.54.8
7.411
.412
.327
.914
.511
.09.9
0.03.1
5.141
.40.6
Portu
gal T
eleco
m (5)
€ 8.00
82.2
9.014
.715
.86.8
6.35.8
5.510
.69.5
8.58.0
37.1
37.6
38.6
39.3
3.18.8
10.4
10.9
17.1
12.0
10.1
9.35.0
3.35.3
22.3
1.8
Swiss
com
CHF
411.7
588
.016
.415
.717
.26.2
6.36.2
6.08.6
8.99.0
8.942
.842
.442
.943
.69.5
9.28.8
9.013
.814
.014
.113
.83.6
(2.7)
(2)(0.
2)NM
TDC
DKK
259.5
097
.26.9
8.77.7
4.23.7
3.43.0
7.66.5
6.05.5
28.2
29.0
29.6
29.8
10.6
14.1
14.2
14.7
12.1
9.88.8
8.45.0
2.24.2
13.0
0.9
Telec
om Ita
lia€ 2
.5881
.738
.971
.787
.66.2
5.75.3
5.09.6
8.37.5
7.045
.346
.747
.647
.710
.010
.511
.511
.715
.013
.011
.710
.94.4
1.93.6
11.3
3.0
Telef
onica
€ 13.6
093
.465
.892
.392
.06.4
5.85.2
4.59.5
8.57.3
6.240
.340
.341
.543
.99.9
10.8
11.3
13.0
14.1
13.0
11.3
9.04.4
3.76.7
16.1
0.8
Telek
om A
ustria
€ 16.2
499
.38.1
10.3
10.3
6.65.6
5.34.9
10.6
9.08.3
7.539
.941
.241
.040
.810
.410
.110
.912
.621
.318
.415
.314
.22.9
3.84.6
14.5
1.0
Telen
or (6)
NOK
51.25
84.4
11.2
13.6
13.2
4.74.4
3.93.5
12.5
8.76.5
5.533
.834
.234
.935
.03.9
8.311
.513
.113
.410
.89.5
8.63.9
4.35.5
16.0
0.9
Telia
Sone
raSE
K 35
.6082
.018
.118
.915
.15.4
5.14.8
4.58.8
8.17.3
6.635
.136
.637
.237
.49.2
9.410
.611
.511
.09.7
8.98.4
3.95.7
7.99.6
0.4
Mean
89.9
%5.6
x5.2
x4.8
x4.5
x9.2
x8.3
x7.5
x6.9
x37
.5%
38.0
%38
.6%
38.9
%8.9
%10
.2%
11.2
%12
.0%
14.2
x11
.7x
10.6
x9.9
x4.2
%1.9
%3.1
%12
.3%
1.2x
Media
n88
.75.5
5.24.8
4.59.0
8.47.4
6.938
.138
.339
.039
.59.5
9.711
.312
.212
.410
.810
.29.3
4.42.2
4.212
.20.9
Easte
rn Eu
rope
an
Cesk
y Tele
com
(9)CZ
K 46
4.00
99.9
%4.9
5.75.7
5.7x
5.4x
5.0x
NM7.8
x7.4
x7.0
xNM
45.5
%45
.0%
44.5
%NM
11.4
%11
.3%
11.0
%NM
24.1
x18
.0x
14.4
xNM
2.9%
NMNM
NMNM
Matav
(9)
HUF
835.0
085
.23.4
4.54.7
5.15.0
4.9NM
13.8
8.17.8
NM40
.640
.841
.15.0
3.0%
10.4
%10
.6%
NM12
.912
.411
.8NM
10.7
105.5
1.9NM
1.0
TPSA
(9)
PLN
19.25
83.0
6.59.0
9.24.4
4.25.0
NM7.0
6.58.0
NM44
.243
.841
.8NM
12.8
%14
.1%
13.9
%NM
11.5
10.8
9.1NM
6.5NM
NMNM
NM
Mean
90.2
%5.1
x4.8
x4.9
xNA
9.5x
7.3x
7.6x
NA43
.5x
43.2
x42
.4x
5.0x
9.1x
11.9
x11
.8x
NA16
.2x
13.7
x11
.7x
NA6.7
x10
5.5x
1.9x
NA1.0
x
Media
n88
.74.9
4.74.9
NA10
.17.3
7.8NA
42.8
42.6
41.8
5.08.3
12.1
12.1
NA13
.512
.310
.9NA
8.010
5.51.9
NA1.0
Sourc
e: GS
Res
earch
, all f
inanc
ials c
alend
arise
d to y
ear e
nd.
(1) Fu
lly di
luted
numb
er of
share
s outs
tandin
g are
used
whe
n calc
ulatin
g mark
et ca
pitali
satio
n.(2)
LMV
= Mark
et Ca
pitali
satio
n + 20
04 N
et De
bt; ca
lculat
ed us
ing fu
lly dil
uted n
umbe
r of s
hares
outst
andin
g and
2003
E Ne
t Deb
t.
(3) E
V = M
arket
Capit
alisa
tion +
Net
Debt
+ Mino
rities
- Ass
ociat
es; M
arket
value
for A
ssoc
iates
and M
inoriti
es if
quote
d, GS
Res
earch
if un
listed
.(4)
Mult
iple n
ot sh
own i
f abo
ve 50
. Pric
e defi
ned a
s equ
ity va
lue ad
justed
for m
inoriti
es an
d ass
ociat
es.
(5) Te
lesp C
elular
cons
olida
ted on
a pro
portio
nate
basis
.(6)
Brav
ida ac
coun
ted fo
r as a
n ass
ociat
e.(7)
Adju
sted E
PS is
defin
ed as
net in
come
exclu
ding e
xtrao
rdina
ry ite
ms, U
MTS
licen
ce an
d goo
dwill
amort
isatio
n, div
ided b
y dilu
ted nu
mber
of sh
ares o
utstan
ding
(8) C
ash E
PS is
defin
ed as
net in
come
exclu
ding e
xtrao
rdina
ry ite
ms, d
eprec
iation
and a
mortis
ation
, divi
ded b
y dilu
ted nu
mber
of sh
ares o
utstan
ding
(9) B
roker
estim
ates
FCF Y
ield (
%) (4
)P/A
dj. E
(x) (7
)%
of 52
We
ek
High
Marke
t Cap
(€bn
) (1)
EV/EB
ITDA
(x)EV
/(EBI
TDA-
Cape
x) (x)
EBITD
A Marg
in (%
)
2004
EV
/EBITD
A to
04-07
E EB
ITDA
Grow
th (x)
CAGR
05-08
E
Divid
end

20
Exhibit 6: European Wireless Public Market Comparison
Share Price % of Market Enterprise Dividend 2005
Local 52 Week Cap (1) Value (2) EV/EBITDA EV/(EBITDA-Capex) FCF Yield % P/Adj E (3) Yield EV/EBITDA
10-Jun High €bn €bn 2005E 2006E 2007E 2005E 2006E 2007E 2005E 2006E 2007E 2005E 2006E 2007E 2005E 05-08E CAGR
Mobile Operators
O2 £1.27 98.1 % 16.4 16.4 5.5 x 4.6 x 4.0 x 18.2 x 11.8 x 9.0 x 4.9 % 6.8 % 8.1 % 13.5 x 12.4 x 10.5 x 3.1 % 0.5 x
Cosmote € 14.94 94.3 5.0 5.1 8.3 7.1 6.4 13.5 10.7 9.1 4.8 7.4 8.7 14.3 13.0 11.6 4.4 1.0
Mobistar € 64.30 91.3 4.1 4.5 7.1 6.7 6.3 10.8 9.9 8.7 6.2 6.7 7.7 15.0 14.5 14.3 3.3 2.1
TIM Hellas $19.17 88.1 1.3 1.5 5.6 5.1 4.3 11.8 9.9 7.8 5.1 7.0 9.3 14.5 13.6 11.2 0.6 1.0
Tele2 SEK 225.00 68.2 10.1 10.5 18.7 16.4 14.2 39.1 25.8 21.6 1.4 2.5 3.0 51.2 41.9 32.7 1.1 1.5
TEM € 8.86 87.4 38.4 46.5 8.1 7.2 6.3 13.4 11.3 8.8 4.5 6.0 7.7 18.6 15.2 12.6 2.2 0.9
TIM € 4.47 79.9 38.3 38.6 6.2 6.0 5.6 9.6 8.7 7.7 5.4 6.1 7.5 15.4 14.4 13.4 6.3 1.5
Vodafone £1.36 92.3 132.0 103.8 5.2 4.7 4.2 8.7 7.5 6.0 9.5 11.3 13.9 11.8 10.7 9.5 3.2 0.8
Mean 87.5 % 8.1 x 7.2 x 6.4 x 15.6 x 12.0 x 9.8 x 5.2 % 6.7 % 8.2 % 19.3 x 17.0 x 14.5 x 3.0 % 1.2 x
Median 89.7 6.6 6.3 5.9 12.6 10.3 8.8 5.0 6.8 7.9 14.7 14.0 12.1 3.1 1.0
MVNO
Virgin Mobile £2.37 84.6 0.9 1.2 7.0 x 6.1 x 5.4 x 8.3 x 7.1 x 6.2 x 8.7 % 10.9 % 12.1 % 11.0 x 9.3 x 8.1 x 3.7 % 0.8 x
Eastern European
Mobile Telesystems $31.40 78.3 10.2 11.4 4.9 x 4.1 x 3.5 x 13.1 x 7.4 x 5.8 x 5.0 % 9.4 % 12.0 % 8.8 x 7.2 x 6.3 x 3.5 % 0.6 x
Vimpelcom $33.24 78.7 5.6 6.6 5.6 x 4.4 x 3.7 x (68.3)x 10.6 x 7.6 x NM 6.5 % 9.8 % 10.0 x 7.5 x 6.5 x 0.0 % 0.4 x
Source: GS Research(1) Fully diluted shares oustanding are used when calculating market capitalisation(2) Estimated net debt as of 31-Dec-2003 used when calculating enterprise value(3) Adj. Earnings exclude Exceptionals, UMTS licence and goodwill amortisation. P/CE: Earnings exclude Depreciation & Amortisation

21
Exhibit 7: Miscellaneous statistics
Mobile Penetration 2005E Country Credit Ratings1
15%
46%51%
60%72%
85%88%102%
112%
Cze
chR
epub
lic UK
Gre
ece
Hun
gary
Pola
nd
Mal
aysi
a
Turk
ey
Phi
lipin
es
Indo
nesi
a
Current 2002
Outlook Local
Currency Foreign
Currency Local
Currency UK – AAA/A-1+ AAA/ACzech Republic – A+/A-1 A-/A-2 A+/A-1 Malaysia – A+/A-1 A-/A-2 A+/A-1 Hungary – A/A-1 A-/A-2 A/A-1 Greece A-/A-1 A/A
Poland – A-/A-2 BBB+/A-2 A/A-1 Philippines BB+/B BB-/B BBB+/A-2
Turkey – BB/B BB-/B Indonesia – B+/B B/B B-/C
Fixed Line Penetration 2005E 10 Year - Government Bond Yields2
4%5%
18%27%
32%35%36%
57%61%
Gre
ece
UK
Cze
chR
epub
lic
Hun
gary
Pola
nd
Turk
ey
Mal
aysi
a
Indo
nesi
a
Philip
ines
4.1%4.7%4.8%4.8%
7.7%7.8%8.9%
Phili
pine
s
Indo
nesi
a
Turk
ey
Hun
gary
Pola
nd
Mal
aysi
a
Gre
ece
Source: Datastream, EMC database, S&P, Sofrecom
1 As of May-2005. 2 Data as of May 2005. Yield on US$ bonds.