the prevalence of specific learning disorder in
TRANSCRIPT

The prevalence of specific learning disorder in mathematics andcomorbidity with other developmental disorders in primary school agechildrenMorsanyi, K., van Bers, B. M. C. W., McCormack, T., & McGourty, J. (2018). The prevalence of specific learningdisorder in mathematics and comorbidity with other developmental disorders in primary school age children.British Journal of Psychology, 109(4), 917-940. https://doi.org/10.1111/bjop.12322
Published in:British Journal of Psychology
Document Version:Peer reviewed version
Queen's University Belfast - Research Portal:Link to publication record in Queen's University Belfast Research Portal
Publisher rights© 2018 The British Psychological Society. This work is made available online in accordance with the publisher’s policies. Please refer to anyapplicable terms of use of the publisher.
General rightsCopyright for the publications made accessible via the Queen's University Belfast Research Portal is retained by the author(s) and / or othercopyright owners and it is a condition of accessing these publications that users recognise and abide by the legal requirements associatedwith these rights.
Take down policyThe Research Portal is Queen's institutional repository that provides access to Queen's research output. Every effort has been made toensure that content in the Research Portal does not infringe any person's rights, or applicable UK laws. If you discover content in theResearch Portal that you believe breaches copyright or violates any law, please contact [email protected].
Download date:31. Dec. 2021

1
Title: The prevalence of specific learning disorder in mathematics and comorbidity with other
developmental disorders in primary school age children
Kinga Morsanyi, Bianca M.C.W. van Bers, Teresa McCormack & Jemma McGourty
School of Psychology, Queen’s University Belfast
Corresponding author: Kinga Morsanyi
School of Psychology, Queen’s University Belfast, Belfast, BT7 1NN, Northern Ireland, UK
Telephone: +44 (0)28 9097 4326; Fax: +44 (0) 28 9097 4524; email: [email protected]
Please cite paper as the following:
Morsanyi, K., van Bers, B. M. C. W., McCormack, T. and McGourty, J. (in press). The
prevalence of specific learning disorder in mathematics and comorbidity with other
developmental disorders in primary school age children. British Journal of Psychology. DOI: 10.1111/bjop.12322.
Acknowledgements
We thank John Eakin for his invaluable help with recruiting schools for this project, and
Martina Maggio for her contribution to data entry. This study was funded by a Nuffield
Foundation Research and Innovation grant (EDU/42027) to KM and TM. The Nuffield
Foundation is an endowed charitable trust that aims to improve social well-being in the widest
sense. It funds research and innovation in education and social policy and also works to build
capacity in education, science and social science research. The Nuffield Foundation has
funded this project, but the views expressed are those of the authors and not necessarily those
of the Foundation. More information is available at www.nuffieldfoundation.org
2
Abstract
Mathematics difficulties are common in both children and adults, and they can have a great
impact on people’s lives. A specific learning disorder in mathematics (SLDM or
developmental dyscalculia) is a special case of persistent mathematics difficulties, where the
problems with maths cannot be attributed to environmental factors, intellectual disability or
mental, neurological or physical disorders. The aim of the current study was to estimate the
prevalence rate of SLDM, any gender differences in SLDM, and the most common co-morbid
conditions. The DSM-5 provides details regarding these only for specific learning disorders in
general, but not specifically for SLDM. We also compared the prevalence rates obtained on
the basis of the DSM-IV and DSM-5 criteria. We investigated the performance of 2,421
primary school children on standardized tests of mathematics, English and IQ, and several
demographic factors over the primary school years. We applied the DSM-5 diagnostic criteria
to identify children with a potential diagnosis of SLDM. Six percent of our sample had
persistent, severe difficulties with mathematics, and, after applying the exclusion criteria,
5.7% were identified as having an SLDM profile. Both persistent maths difficulties, and
consistently exceptionally high performance in maths were equally common in males and
females. About half of the children with an SLDM profile had some form of language or
communication difficulty. Some of these children also had a diagnosis of autism, social,
emotional and behavioural difficulties or attention deficit and hyperactivity disorder. Our
findings have important implications for research and intervention purposes, which we
discuss in the paper.
Keywords: comorbidity; DSM-IV: DSM-5; dyscalculia; gender differences; prevalence;
specific learning disorder in mathematics
3
Introduction
Mathematics difficulties are common in both children and adults. It has been estimated
that up to 25% of economically active individuals lack basic numerical knowledge, skills and
understanding that would be essential for them to operate confidently and independently in
everyday life, educational settings and work (Bynner & Parsons, 1997; Gross, Hudson &
Price, 2009; Snyder & Dillow, 2012). Nevertheless, there can be various reasons why an
individual does not achieve appropriate levels of numeracy. In particular, researchers have
discriminated between innate factors (that can lead to cognitive and behavioural problems that
affect numeracy) and environmental factors (such as inadequate home or school learning
environments, and negative stereotypes about one’s group) that might contribute to the
development of mathematics difficulties (e.g., Butterworth, 2008; Kaufmann, Mazzocco,
Dowker, von Aster, Gobel et al., 2013; Price & Ansari, 2013).
The purpose of the current paper is to investigate the prevalence of SLDM (or
developmental dyscalculia) in primary school-age children, applying the DSM-5 criteria
(APA, 2013), and to examine the demographic and cognitive characteristics of the children
who meet the criteria. We will investigate whether there are gender differences in the
prevalence of SLDM, and the relation between mathematics difficulties and some common
developmental disorders. We will also explore the relation between maths ability and general
intelligence. This issue is relevant, because one of the DSM-IV diagnostic criteria for specific
learning disorders was a significant discrepancy between a person’s measured intelligence
and their academic functioning (see Table 1 for a summary of the key differences between the
DSM-IV and DSM-5 diagnostic criteria). This criterion has long been disputed, both on a
theoretical (e.g., Buttner & Hasselhorn, 2011; Siegel, 1989; Stanovich, 1991) and empirical
(e.g., Aaron, 1997; Johnson, Humphrey, Mellard, Woods & Swanson, 2010) basis. Given that
the discrepancy criterion is no longer included in the DSM, it is of interest how this affects
4
prevalence rates of SLDM. In addition, although our main focus is on mathematics learning
difficulties, we will also investigate the prevalence of consistently high maths performance,
and how it is related to other cognitive and environmental factors.
To the best of our knowledge, no prevalence studies on SLDM have been conducted
since the publication of the DSM-5, although two papers (Fortes, Paula, Oliveira, Bordin,
Mari & Rohde, 2016 and Moll, Kunze, Neuhoff, Bruder & Schulte-Korne, 2014) investigated
the prevalence of specific learning difficulties in arithmetic skills. Nevertheless, these studies
did not assess other types of mathematics skills that are relevant to a DSM diagnosis of
SLDM (e.g., number sense, number facts and mathematical reasoning). Additionally, there
are almost no prevalence studies that considered longitudinal data, although one of the new
DSM-5 diagnostic criteria is that the difficulties in learning and using academic skills should
be persistent. A notable exception is a study by Mazzocco and Myers (2003) where 209
children were tested multiple times during a 4-year period. Nevertheless, this was a relatively
small study (the sample included 22 children who displayed persistent difficulties with
mathematics). Although large cohort studies do exist, a common characteristic of these
studies is that they typically screen a larger sample initially, and then narrow down their focus
on a subset of children who were identified as potentially displaying mathematics difficulties
(e.g., Barbaresi et al., 2005; Devine, Soltész, Nobes, Goswami & Szűcs, 2013; Gross-Tsur et
al., 1996; Reigosa-Crespo, Valdes-Sosa, Butterworth, Estevez, Rodriguez et al., 2011). Thus,
these studies do not provide a detailed comparison of the cognitive and demographic
characteristics of the participants in the typical and learning difficulty groups. The current
study is unique in combining a large sample size with multiple measurements of maths
ability, which is essential in establishing the prevalence of persistent difficulties with maths.
Another special feature of our study is the range of measures that were considered.
Several studies have reported maths and reading performance or maths and IQ, but the three
5
measures are rarely investigated together. Although Badian (1999) considered maths and
reading performance together with children’s IQ, these measures were not collected at the
same time. In the current study, in addition to standardized tests of maths and reading ability,
and IQ, we also report data on children’s socio-economic status, school attendance, whether
they speak English as their first language, and if they have been diagnosed with any
developmental disorders. Although it is well-established that socio-economic status is linked
to mathematics achievement (e.g., Schiller, Khmelkov & Wang, 2002; Yang, 2003), this
factor is usually not considered in demographic studies of maths difficulties. Applying the
DSM criteria is also an important advantage of our study over previous studies that used
varying criteria in establishing the prevalence rate of maths learning difficulties (see next
section).
The prevalence of mathematics learning difficulties
We already described two important changes in the DSM-5 diagnostic criteria, as
compared to the DSM-IV definition of “mathematics disorder” above (i.e., the abandonment
of the academic achievement-IQ discrepancy criterion, and the requirement that the academic
difficulties should persist at least for 6 months, despite intervention efforts – Table 1 gives a
summary of the key changes). Another important change is the introduction of a single
category of “specific learning disorders”. Additionally, the updated diagnostic criteria state
that there must be substantial and quantifiable difficulties in learning and using mathematics
skills (e.g., number sense, number facts, calculation or mathematical reasoning). Mathematics
skills should be substantially and quantifiably below those expected for the individual’s
chronological age, and the deficits must cause significant interference with academic or
occupational performance, or with activities of daily life, as confirmed by individually
administered standardized achievement measures and comprehensive clinical assessment. A
standard score of 78 or less (i.e., 1.5 standard deviations below the population mean for age)
6
is considered strong evidence for SLDM. The learning difficulties should not be better
accounted for by intellectual disabilities (i.e., an IQ of at least 70 is expected), uncorrected
visual or auditory acuity, other mental or neurological disorders, psychosocial adversity, lack
of proficiency in the language of academic instruction, or inadequate educational instruction.
Finally, a clinical synthesis should take place, based on the individual’s history
(developmental, medical, family, educational), school reports, and psycho-educational
assessment. The DSM-5 criteria also allow for the possibility that severity levels might differ
between individuals. Based on these new criteria, the DSM-5 estimates the prevalence rate of
specific learning disorders (including all types) to fall between 5-15% among school-age
children.
Although several earlier papers have investigated the prevalence of mathematical
learning difficulties (see Devine et al., 2013 for a recent review), these studies used a wide
range of definitions of “developmental dyscalculia” or “mathematics learning difficulties”.
Thus, it is unsurprising that prevalence estimates varied widely (from as low as 1.3% to as
high as 13.8%). One important source of variation is whether the studies applied a
discrepancy criterion (i.e., between maths and IQ or maths and reading), and if so, what cut-
off points they used. For example, Lewis, Hitch and Walker (1994) reported a prevalence rate
of 1.3% for “specific arithmetic difficulties” among a large sample (n = 1,206) of 9-10-year-
old children in the UK, using the criterion of children having a standardized maths score
below 85 and standardised IQ and reading scores of 90 or above. An additional group of
children, 2.3% of the total sample, exhibited both maths and reading difficulties.
Mazzocco and Myers (2003) followed 209 children, who were between 5 and 6 years
of age at the start of the study, over a 4-year period. 10.5% of the children in this sample had
persistent difficulties with mathematics, and between 10-20% of children with maths
difficulties at each grade level had a discrepancy of at least 14 points between their
7
standardised mathematics and IQ scores. The number of children with persistent maths
difficulties who had a maths-IQ discrepancy of at least 14 points was between 1-2% at each
time point. Nevertheless, Mazzocco and Myers (2003) found that maths-IQ discrepancies
were not very stable over time, which questions the reliability of this criterion.
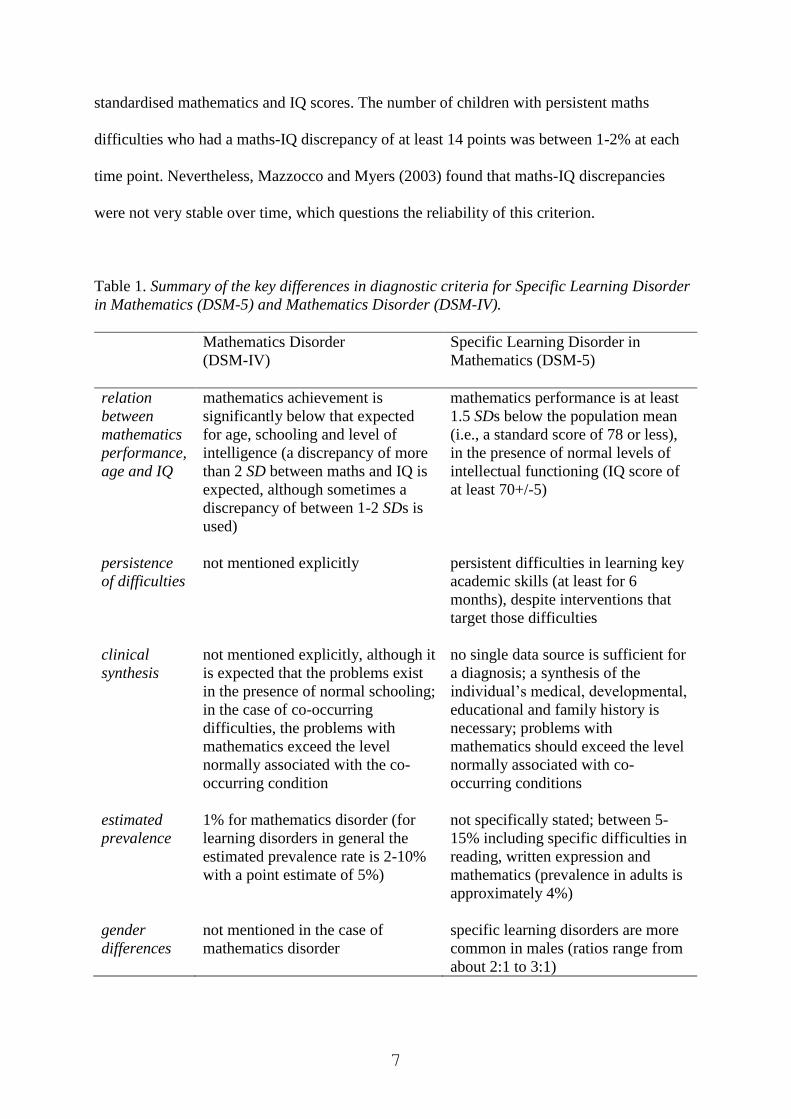
Table 1. Summary of the key differences in diagnostic criteria for Specific Learning Disorder
in Mathematics (DSM-5) and Mathematics Disorder (DSM-IV).
Mathematics Disorder
(DSM-IV)
Specific Learning Disorder in
Mathematics (DSM-5)
relation
between
mathematics
performance,
age and IQ
mathematics achievement is
significantly below that expected
for age, schooling and level of
intelligence (a discrepancy of more
than 2 SD between maths and IQ is
expected, although sometimes a
discrepancy of between 1-2 SDs is
used)
mathematics performance is at least
1.5 SDs below the population mean
(i.e., a standard score of 78 or less),
in the presence of normal levels of
intellectual functioning (IQ score of
at least 70+/-5)
persistence
of difficulties
not mentioned explicitly persistent difficulties in learning key
academic skills (at least for 6
months), despite interventions that
target those difficulties
clinical
synthesis
not mentioned explicitly, although it
is expected that the problems exist
in the presence of normal schooling;
in the case of co-occurring
difficulties, the problems with
mathematics exceed the level
normally associated with the co-
occurring condition
no single data source is sufficient for
a diagnosis; a synthesis of the
individual’s medical, developmental,
educational and family history is
necessary; problems with
mathematics should exceed the level
normally associated with co-
occurring conditions
estimated
prevalence
1% for mathematics disorder (for
learning disorders in general the
estimated prevalence rate is 2-10%
with a point estimate of 5%)
not specifically stated; between 5-
15% including specific difficulties in
reading, written expression and
mathematics (prevalence in adults is
approximately 4%)
gender
differences
not mentioned in the case of
mathematics disorder
specific learning disorders are more
common in males (ratios range from
about 2:1 to 3:1)
8
Gender differences in maths learning difficulties
Gender differences in the prevalence of certain developmental disabilities (e.g., autism,
dyslexia) are well-documented. The DSM-5 estimates that the gender ratio in specific
learning disorders is between 2:1 to 3:1, with a higher prevalence among males. Nevertheless,
the DSM-5 does not specify gender differences in SLDM. The most common finding reported
in the literature is that of no gender difference (e.g., Desoete et al., 2004; Devine et al., 2013;
Gross-Tsur, Manor & Shalev, 1996; Hein, Bzufka & Neumarker, 2000; Koumoula Tsiromi,
Stamouli, Bardani, Siapati, Graham et al., 2004; Lewis et al., 1994; Mazzocco & Myers,
2003). Nevertheless, some studies did report gender differences, although these studies were
inconsistent in whether they reported a higher prevalence of maths learning difficulties in
girls (Dirks, Spyer, van Lieshout & de Sonneville, 2008; Gross-Tsur, Manor, & Shalev, 1996;
Landerl & Moll, 2010; Moll, Kunze, Neuhoff, Bruder & Schulte-Korne, 2014) or boys
(Badian, 1999; Barbaresi, Katusic, Colligan, Weaver & Jacobsen, 2005; Ramaa &
Gowramma, 2002; Reigosa-Crespo et al., 2011). It should be noted that these studies used
varying criteria to identify maths difficulties, which could explain some of the differences in
the results1.
For example, Devine et al. (2013) reported that although there was no gender difference
in the prevalence of maths learning difficulties between boys and girls, when a discrepancy
criterion was applied (between maths and reading), it was much more common for girls than
for boys to underperform in maths compared to their reading performance.
Comorbidity with other developmental disorders
The DSM-5 definition of SLDM excludes children whose mathematics difficulties are
1 In addition to using various cut-off points for maths difficulties and inconsistencies in using a
maths-IQ discrepancy criterion, another source of differences is that some studies have focussed on
arithmetic difficulties only (e.g., Fortes et al., 2016; Landerl & Moll, 2010; Lewis et al., 1994; Moll et
al., 2014) instead of maths difficulties in general.
9
better explained by intellectual, developmental, neurological, sensory or motor disorders, or
by environmental factors. Given the single overarching category of specific learning disorder,
it is acknowledged that mathematics difficulties often co-occur with impairments in reading
and/or written expression. Comorbidity with other neurodevelopmental disorders (e.g.,
ADHD, communication disorders, developmental coordination disorder, autism), as well as
mental disorders (e.g., anxiety disorders, depressive and bipolar disorders) is also expected.
Nevertheless, it is not specified how common the comorbidity with each of these disorders is.
In past research, the most commonly reported co-occurring condition was dyslexia.
Nevertheless, comorbidity estimates varied widely, from 17% (Gross-Tsur, Manor, & Shalev,
1996) to as high as 64% (Lewis et al., 1994). It has been suggested that children who
displayed maths difficulties with/without reading difficulties showed differences in their
cognitive profiles (Rourke & Finlayson 1978; Szűcs, 2016). Other researchers (e.g., Landerl
& Moll, 2010; Moll et al., 2014) argued that there was a closer link between arithmetic and
spelling difficulties than arithmetic skills and reading.
Comorbidity with other developmental disorders has been much less investigated,
although several studies reported that maths difficulties might co-occur with attention deficit
hyperactivity disorder (ADHD). For example, Gross-Tsur, Manor and Shalev (1996) reported
that 26% of children with maths difficulties showed symptoms of ADHD, whereas Shalev,
Auerbach and Gross-Tsur (1995) reported a figure of 32%. A recent review paper (DuPaul,
Gormley & Leracy, 2013) stated that about 45% of children with ADHD have a learning
disability, although specific estimates for reading, writing and maths problems were not
provided. The link between attentional deficit and maths difficulties have been further
investigated and confirmed by other research groups (Currie & Stabile, 2002; Kauffmann &
Nuerk, 2008; Lindsay, Tomazic, Levine & Accardo, 2001; Marzocchi, Lucangeli, De Meo,
Fini & Cornoldi, 2002; Passolunghi, Marzocchi & Fiorillo, 2005; Rubinsten & Henik, 2009).

10
Associations between ADHD symptoms and learning disorders have also been found in
cohort studies (e.g., Czamara, Tiesler, Kohlböck, Berdel, Hoffmann Bauer et al. 2013), and a
twin study (Greven, Kovas, Willcutt, Petrill & Plomin, 2014) showed shared genetic risk
between ADHD and reduced maths ability.
The methods used in the current study
The results presented in the current paper were based on primary schools’ electronic
databases of children’s performance on standardized maths, English and IQ tests, as well as
several demographic variables. Nineteen schools from Northern Ireland were involved in the
study, representing a mix of urban schools and outlying rural schools. The catchment areas of
the schools ranged from areas with very low levels of deprivation to medium levels of
deprivation. Nevertheless, 33% of children were eligible to free school meals (FSM), which is
similar to the figure for Northern Ireland (30.6%) according to the 2015-2016 census. This
suggests that the sample might be broadly representative of the child population of Northern
Ireland.
The schools administer standardized tests of maths and reading ability every year,
starting from year 3 (children in year 3 in Northern Ireland are typically aged between 6-7
years). The schools also administer standardized IQ tests, although the timing and frequency
of testing varies between schools. Typically, the schools administered IQ tests twice during
the primary school years, although there were some schools that administered IQ tests every
year, starting from year 3, or only once. Given that the DSM-5 definition of SLDM requires
persistent difficulties with maths in the absence of an intellectual disability, data from a
particular child was only included in the study if the database included their standardised
maths scores from at least 2 academic years, and an IQ score from at least one academic year.
As year 3 is the first school year when standardized tests are administered, only the data from
children enrolled in years 4-7 were considered. Using these criteria, data from 2,421 children
11
were included in the study2.
Acknowledging the possibility of measurement error, rather than considering
standardized maths scores from each year separately, we used average maths scores of 78 or
below over the years for which scores were available as a criterion to identify children with
persistent maths difficulties. Regarding IQ scores, children with IQ scores of 70 or below
were considered to have an intellectual disability, and were not included in the SLDM group.
Similar to the maths scores, we relied on average IQ scores, where possible. IQ scores were
available from at least two years in the case of 71.8% of the sample.
Finally, because the DSM-5 states that for a diagnosis of SLDM, persistent difficulties
in mathematics should not be better explained by developmental, neurological, sensory or
motor disorders, once we selected the children with a likely diagnosis of SLDM, we also
considered whether they had any co-existing conditions that might explain their problems
with maths. We note that DSM-5 criteria also state that a clinical synthesis should take place,
based on the individual’s history, school reports, and psycho-educational assessment.
Although due to the size of the data set we were unable to carry out such syntheses, the
availability of information on whether children had been diagnosed with a developmental
disorder, information on whether they received free school meals, and information on whether
they had newcomer status could be used to help put any maths difficulties into context.
In summary, the purpose of this study was to provide an estimate of the prevalence of
SLDM in primary school children using a unique longitudinal dataset which contained data
from a large sample of children. We also investigated gender differences and comorbidity
with other developmental disorders. Gender differences and comorbidity rates are important
to establish, because the DSM-5 does not include specific details on these for SLDM, and the
2 Eligibility for inclusion was assessed by two independent coders, and a third coder compared the
results and resolved any inconsistency. Initial agreement between the coders was very high (they
agreed on the status of 99.8% of the children).
12
existing literature is inconsistent. We also compared prevalence estimates using the DSM-IV
and DSM-5 diagnostic criteria, to assess the impact of the changes, most importantly, the
elimination of the maths-IQ discrepancy criterion. In order to achieve higher reliability in our
prevalence estimates, we have used average scores from multiple school years, instead of
relying on separate measurements at each time point. Indeed, it could be expected that in the
latter case, children who are close to the cut-off point might have inconsistent classifications
(i.e., SLDM/typical) at different measurement points (e.g., Mazzocco & Myers, 2003).
Although our primary aim was to provide an estimate of the prevalence of SLDM (and
how it related to other variables) the nature of our data set also allowed us to look at some
further issues. First, we were also able to identify children who had high levels of maths
ability, and to examine the demographic and cognitive characteristics of such children.
Second, we were able to examine the contribution of some environmental factors (i.e., socio-
economic status, school attendance and being a non-native speaker of English) to
mathematics performance more generally, while also taking into account the effects of the
child’s gender and IQ.
Method
Measures of socio-economic status
Multiple Deprivation Measure (MDM; Northern Ireland Statistics and Research Agency,
2010): The MDM is based on postcodes, and it is a weighted combination of indicators of
seven domains of deprivation. The domains were combined by transforming the indicators to
an exponential distribution (ranging from 0 to 100) and then combining them with the
following weights: income deprivation (25%); employment deprivation (25%); health
deprivation and disability (15%); education skills and training deprivation (15%); proximity
to services (10%); living environment (5%); crime and disorder (5%). A higher score
indicates a higher level of deprivation for the area. The scores can be interpreted as
13
percentiles (e.g., a score of 15 means that the area is less deprived than 85% of all postcode-
based areas in Northern Ireland). We used the schools’ postcodes rather than the postcodes of
each individual child, although in the case of rural schools (which were the majority of our
sample) the deprivation scores based on either of these are likely to be the same.
Free school meals: Children in Northern Ireland are entitled for free school meals if their
parent/guardian experiences economic hardship. Nevertheless, FSM pupils are not the same
set of children with the lowest household incomes (Hobbs & Vignoles, 2009). Apart from
financial difficulties, reasons for FSM eligibility might include children having special dietary
needs or if their parent/guardian is an asylum seeker. However, in the Northern Irish context,
most children are eligible for FSM due to low household income. Eligibility for free school
meals can change over time.
Measures of academic achievement
The Progress in Math (PiM) test is a standardized, curriculum-based test that schools in
Northern Ireland administer to pupils at the end of each school year, starting from year 3. The
tests are administered in small groups and require children to demonstrate their understanding
of number and shape, and, in higher grades, data handling with algebra. In the tests for 6- to
8-year-olds, all questions are given orally and throughout the series the amount of reading is
kept to a minimum in order to assess mathematical skills independent of reading ability. The
test has been standardized on a large population of school children aged 5-11 years from
across the UK. To ensure representativeness of the standardization population, the sample of
schools used was proportionally stratified by UK region and level of school attainment on
government tests assessing performance on the national curriculum. Cronbach’s Alpha
reliability of the test varies by age but has been found to be high (ranging from .80-.93). The
standardized scores were used in our analyses. PiM scores were available for children from 2
school years for 44.7% of the children, and for 3, 4 and 5 years for 30.2%, 18% and 7.2% of
14
the children, respectively.
The Progress in English (PiE) test is a standardized, curriculum-based test that schools in
Northern Ireland administer to pupils at the end of each school year, starting from year 3. The
tests are administered in small groups, and they assess pupils’ attainment in the core technical
English skills (spelling, grammar and punctuation) and reading comprehension. The test has
been standardized in a similar manner to the PiM test. PiE scores were available from at least
two school years in the case of 90.8% of the children. For 9.2% of the sample, English scores
were only available from one school year. Additionally, there were two children for whom no
PiE test results were available. Both of these children were newcomers who were enrolled in
year 4. It is likely that they were not tested due to language difficulties. Nevertheless, as the
children’s maths and IQ scores were in the normal range, we did not exclude them from the
sample.
The Cognitive Abilities Test Fourth Edition (CAT4) is a standardized intelligence test that
measures verbal reasoning, non-verbal reasoning and quantitative reasoning, as well as spatial
ability. The test has been standardized on a large sample of children in the UK, including
Northern Ireland. Cronbach’s alpha for the overall score, as reported in the technical manual
of the test, is .96.
The Non-Reading Intelligence Test (NRIT) is also a standardized intelligence tests that
assesses aspects of language and thinking without disadvantaging pupils with low reading
ability. It is administered orally to groups of children and has been standardized on a sample
of children drawn from across the UK. Among the 19 schools in our sample, 7 administered
the CAT4 (total number of pupils = 1,032), 11 administered the NRIT (n = 1,278), and one
school (n = 111) administered the NRIT to lower grade pupils and the CAT4 to higher grade
pupils. In the case of 683 children (28.2% of the total sample) IQ scores were only available
from one year. For many children (48.6%), IQ scores were available from two school years,

15
and for the remaining children from 3 or 4 school years.
Other factors that might affect school performance
Special educational needs: Several children in the sample had diagnoses of intellectual or
physical disabilities. In addition to a diagnostic label, children’s special educational needs are
indicated on a scale of 0-5, which refer to the Stage of the Code of Practice
(https://www.education-ni.gov.uk/sites/default/files/publications/de/the-code-of-practice.pdf),
which the child is currently placed at. The Code of Practice is issued by the Department of
Education in Northern Ireland, and its stated aim is to ensure that children with special
educational needs are identified as early as possible in order to receive the individual support
that they require. The Stages in the Code are as follows: 0 - no identified difficulties at
present; 1 - record of concern noted by the school about potential difficulties to be reviewed
within normal school education; 2 – school-based additional support is put in place and
Individual Education Plans (IEPs) are written to work on specific targets within school. Other
external supports (e.g., speech therapy) may be sought at this stage. If children’s needs are not
sufficiently met at these school-based stages, then the child is moved to Stage 3 which is the
point at which educational psychologists (EP) become involved. 3 - EP assessment takes
place, advice from EP may be sufficient to allow the child’s needs to be met appropriately
with additional support (e.g., referral to support services); 4-request for a Statutory
Assessment; 5 - a full Statement of Special Educational Needs is written, a legal document
which may entitle the child to provisions such as attending a special school or having an
individual classroom assistant. About 2% of the school population reaches this stage.
Educational psychologists in Northern Ireland use DSM criteria in providing diagnostic
assessment of children.
Newcomer status: Newcomer children are pupils who do not have the necessary language
skills to participate fully in the school curriculum and do not have a language in common with

16
their teacher.
School attendance: The percentage of school days when the children attended schools during
the last academic year (attendance data were available for 90.7% of the sample).
Results
Description of the sample
There were 2,421 children in the sample, with slightly fewer boys (47.5%) than girls
(Table 2). The number of children from each year of primary school was similar, with the
exception of year 7, which was the smallest of all year groups. 27.7% of the children had been
identified as having special educational needs at some point in the past, but at the time when
the data were obtained 22.4% of the children required some level of educational support. The
proportion of boys who required support (29.5%) was significantly larger than the proportion
of girls (15.9%) who were identified as having special educational needs (χ2(1; n = 2421) =
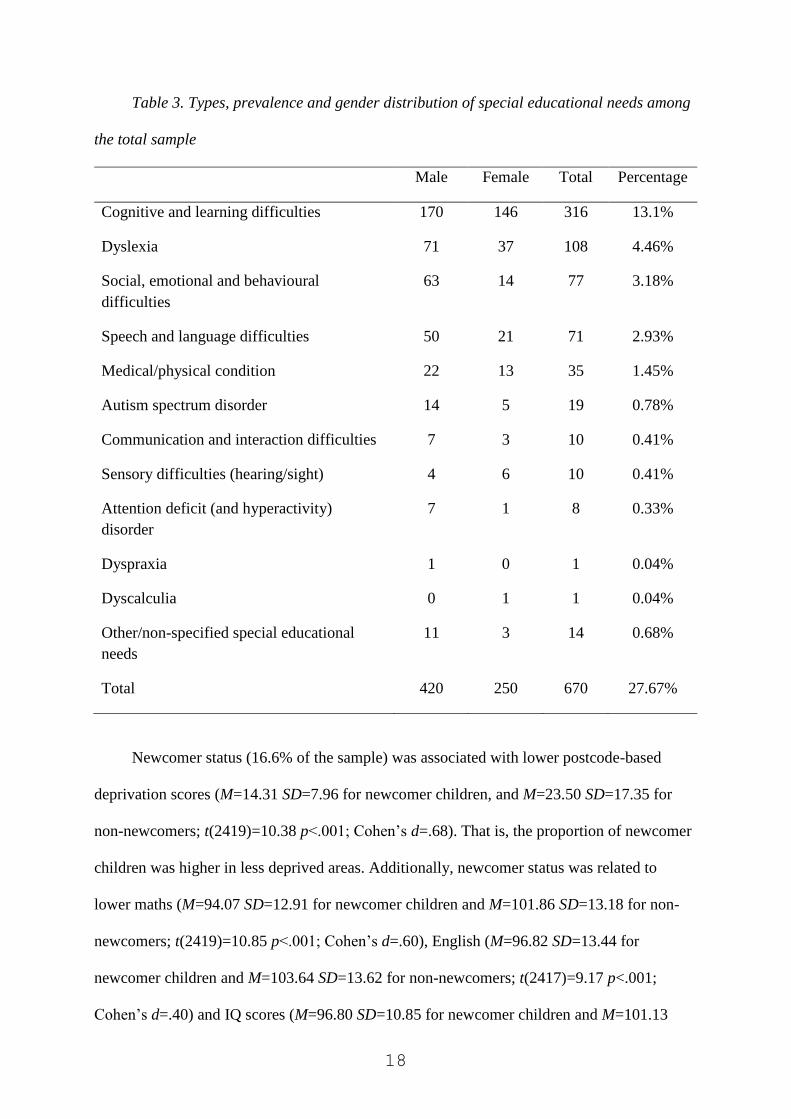
64.74 p < .001). The types, prevalence and gender distribution of various special educational
needs are displayed in Table 3. Based on the schools’ records, no child had multiple
diagnoses. It is notable that the proportion of children with AD(H)D was very low. We
suspect that in some cases, a diagnosis of social, emotional and behavioural difficulties was
applied instead of AD(H)D (see e.g., Cole & Visser, 2005).
Our first analyses were aimed at investigating the relationships between demographic
characteristics (gender, newcomer status, MDM scores, eligibility to FSM, SEN status), and
the children’s academic achievement in maths and English, as well as their IQ. There was a
significant difference between boys and girls in their SEN status (t(2419)=7.79 p<.001;
Cohen’s d=.32), with boys (M=.76 SD=1.34) on average requiring higher levels of
educational support than girls (M=.38 SD=1.00). There was also a gender difference in
children’s English scores (t(2417)=8.97 p<.001; Cohen’s d=.37), with girls (M=104.88
SD=13.65) scoring higher than boys (M=99.92 SD=13.54). Girls (M=101.54 SD=10.71) also

17
had a higher average IQ than boys (M=99.18 SD=11.31; t(2419)=5.27 p<.001; Cohen’s
d=.21). However, there was no difference in average maths scores between boys (M=100.46
SD=13.77) and girls (M=100.67 SD=13.15; p=.695).
Table 2. School year and gender distribution of the sample
Gender Total Percentage
Male Female
Year 4 321 304 625 25.8%
Year 5 336 400 736 30.4%
Year 6 295 321 616 25.4%
Year 7 203 241 444 18.3%
Total 1155 1266 2421
Percentage 47.5% 52.5%
Children who were eligible for free school meals (33% of the sample) had higher
postcode-based deprivation scores (M=29.96 SD=21.90) than children who were not eligible
for FSM (M=18.03 SD=11.17; t(2419)=14.50 p<.001; Cohen’s d=.69). These children also
had higher SEN ratings (M=.90 SD=1.39) than children who were not eligible for FSM
(M=.40 SD=1.04; t(2419)=9.00 p<.001; Cohen’s d=.41). Additionally, eligibility for FSM
was associated with lower mean maths scores (M=95.41 SD=13.22 for children who were
eligible and M=103.12 SD=12.82 for children who were not eligible; t(2419)=13.78 p<.001;
Cohen’s d=.59), lower English scores (M=96.88 SD=13.33 for children who were eligible and
M=105.30 SD=13.19 for children who were not eligible; t(2417)=14.73 p<.001; Cohen’s
d=.64), and lower IQ (M=96.51 SD=10.72 for children who were eligible and M=102.34
SD=10.71 for children who were not eligible; t(2419)=12.60 p<.001; Cohen’s d=.54).
18
Table 3. Types, prevalence and gender distribution of special educational needs among
the total sample
Male Female Total Percentage
Cognitive and learning difficulties 170 146 316 13.1%
Dyslexia 71 37 108 4.46%
Social, emotional and behavioural
difficulties
63 14 77 3.18%
Speech and language difficulties 50 21 71 2.93%
Medical/physical condition 22 13 35 1.45%
Autism spectrum disorder 14 5 19 0.78%
Communication and interaction difficulties 7 3 10 0.41%
Sensory difficulties (hearing/sight) 4 6 10 0.41%
Attention deficit (and hyperactivity)
disorder
7 1 8 0.33%
Dyspraxia 1 0 1 0.04%
Dyscalculia 0 1 1 0.04%
Other/non-specified special educational
needs
11 3 14 0.68%
Total 420 250 670 27.67%
Newcomer status (16.6% of the sample) was associated with lower postcode-based
deprivation scores (M=14.31 SD=7.96 for newcomer children, and M=23.50 SD=17.35 for
non-newcomers; t(2419)=10.38 p<.001; Cohen’s d=.68). That is, the proportion of newcomer
children was higher in less deprived areas. Additionally, newcomer status was related to
lower maths (M=94.07 SD=12.91 for newcomer children and M=101.86 SD=13.18 for non-
newcomers; t(2419)=10.85 p<.001; Cohen’s d=.60), English (M=96.82 SD=13.44 for
newcomer children and M=103.64 SD=13.62 for non-newcomers; t(2417)=9.17 p<.001;
Cohen’s d=.40) and IQ scores (M=96.80 SD=10.85 for newcomer children and M=101.13
19
SD=10.96 for non-newcomers; t(2419)=7.30 p<.001; Cohen’s d=.40).
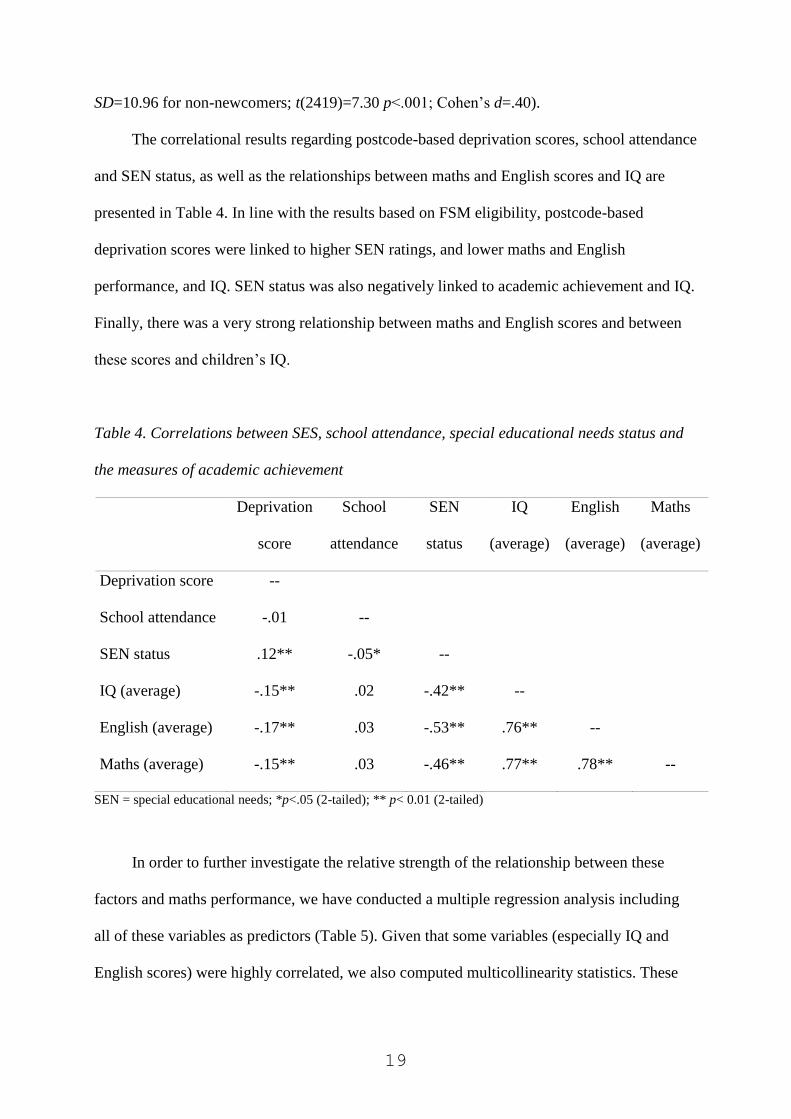
The correlational results regarding postcode-based deprivation scores, school attendance
and SEN status, as well as the relationships between maths and English scores and IQ are
presented in Table 4. In line with the results based on FSM eligibility, postcode-based
deprivation scores were linked to higher SEN ratings, and lower maths and English
performance, and IQ. SEN status was also negatively linked to academic achievement and IQ.
Finally, there was a very strong relationship between maths and English scores and between
these scores and children’s IQ.
Table 4. Correlations between SES, school attendance, special educational needs status and
the measures of academic achievement
Deprivation
score
School
attendance
SEN
status
IQ
(average)
English
(average)
Maths
(average)
Deprivation score --
School attendance -.01 --
SEN status .12** -.05* --
IQ (average) -.15** .02 -.42** --
English (average) -.17** .03 -.53** .76** --
Maths (average) -.15** .03 -.46** .77** .78** --
SEN = special educational needs; *p<.05 (2-tailed); ** p< 0.01 (2-tailed)
In order to further investigate the relative strength of the relationship between these
factors and maths performance, we have conducted a multiple regression analysis including
all of these variables as predictors (Table 5). Given that some variables (especially IQ and
English scores) were highly correlated, we also computed multicollinearity statistics. These
20
analyses showed that the VIF values for each predictor were at an acceptable level3.
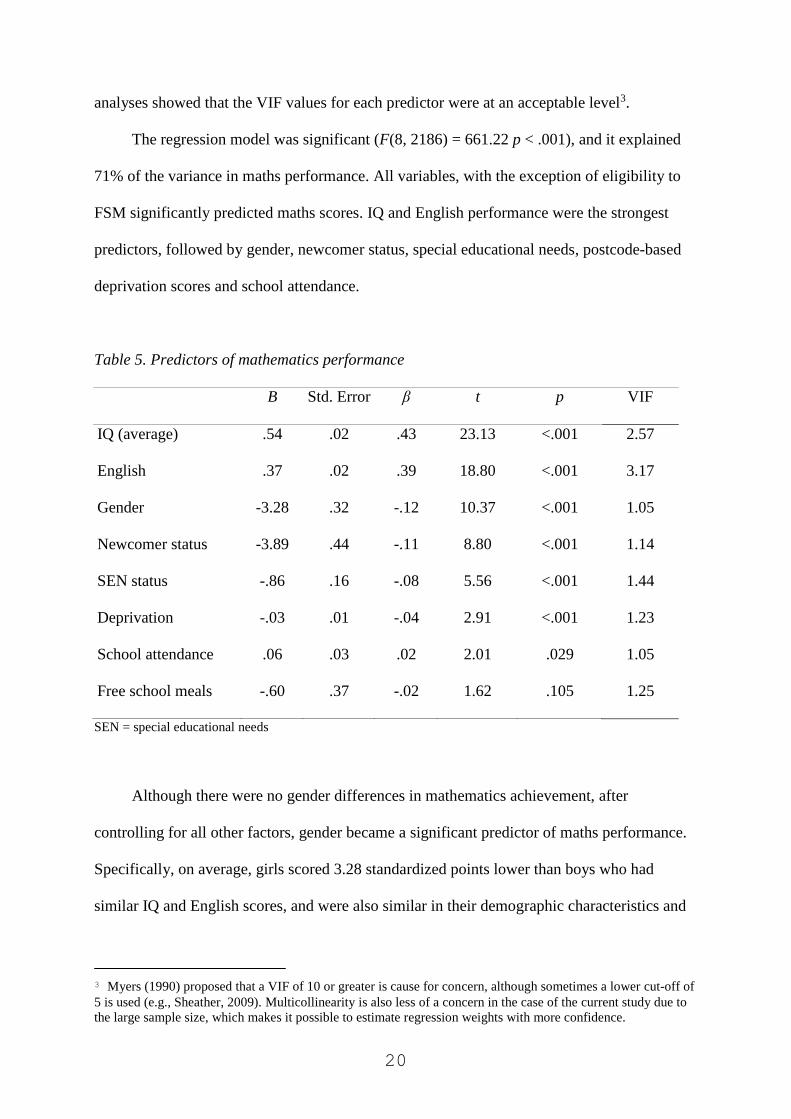
The regression model was significant (F(8, 2186) = 661.22 p < .001), and it explained
71% of the variance in maths performance. All variables, with the exception of eligibility to
FSM significantly predicted maths scores. IQ and English performance were the strongest
predictors, followed by gender, newcomer status, special educational needs, postcode-based
deprivation scores and school attendance.
Table 5. Predictors of mathematics performance
B Std. Error β t p VIF
IQ (average) .54 .02 .43 23.13 <.001 2.57
English .37 .02 .39 18.80 <.001 3.17
Gender -3.28 .32 -.12 10.37 <.001 1.05
Newcomer status -3.89 .44 -.11 8.80 <.001 1.14
SEN status -.86 .16 -.08 5.56 <.001 1.44
Deprivation -.03 .01 -.04 2.91 <.001 1.23
School attendance .06 .03 .02 2.01 .029 1.05
Free school meals -.60 .37 -.02 1.62 .105 1.25
SEN = special educational needs
Although there were no gender differences in mathematics achievement, after
controlling for all other factors, gender became a significant predictor of maths performance.
Specifically, on average, girls scored 3.28 standardized points lower than boys who had
similar IQ and English scores, and were also similar in their demographic characteristics and
3 Myers (1990) proposed that a VIF of 10 or greater is cause for concern, although sometimes a lower cut-off of
5 is used (e.g., Sheather, 2009). Multicollinearity is also less of a concern in the case of the current study due to
the large sample size, which makes it possible to estimate regression weights with more confidence.
21
SEN status. In order to investigate this finding regarding gender further, we ran a series of
regression analyses where we entered gender together with each significant predictor of maths
performance to check which combination of variables results in a significant effect of gender
on maths ability. These analyses showed that when IQ, English scores or SEN status were
controlled, gender became a significant predictor of maths performance. Specifically, gender
and IQ together explained 60% of the variance in maths performance (F(2, 2420) = 1794.71 p
< .001), and both gender (B = -2.01; β = -.075) and IQ (B = .95; β = .78) were significant
predictors (ps < .001). Gender and English scores together explained 62% of the variance in
maths performance (F(2, 2416) = 1967.30 p < .001), and both gender (B = -3.64; β = -.14) and
English scores (B = .78; β = .80) were significant predictors (ps < .001). Finally, gender and
SEN status together explained 21% of the variance in maths performance (F(2, 2420) =
327.23 p < .001), and both gender (B = -1.78; β = -.07) and SEN status (B = 5.27; β = -.47)
were significant predictors (ps < .001).
Step 1 of diagnostic procedure: Identifying children with persistent maths difficulties and with
consistently high maths performance
Children with an average maths score of 78 or less were considered to display persistent
difficulties with mathematics. We also report the proportion of children with consistently high
maths scores (i.e., average scores of 122 or higher).
Six percent of the sample had persistent maths problems, and 5% consistently
performed at a very high level. Regarding the gender distribution of children in each category,
a chi-square test indicated that the proportion of male and female students was not
significantly different (p = .814). Specifically, 6.3% of male students, and 5.8% of female
students showed consistently low performance, and 4.8% of male and 5.1% of female
students showed consistently high performance. The proportion of children who were
22
identified as having persistent maths difficulties/consistently high maths scores showed
significant changes between year groups, as indicated by a chi-square test (χ²(6, n = 2421) =
20.78, p = .002). Specifically, for maths difficulties, the proportions decreased steadily
between years 4-7 (with proportions of 7.4%, 6.4%, 5.8% and 3.8%, respectively). By
contrast, the proportion of children with exceptionally high maths scores increased between
years 4-7 (with proportions of 3.4%, 3.5%, 7% and 7%, respectively).
Next, we continued with the comparison of the demographic characteristics, IQ and
English performance of the children in each maths performance category (Table 6). A one-
way ANOVA with maths ability groups (persistent difficulty/average
performance/consistently high performance) as an independent factor and deprivation scores
as a dependent variable indicated a significant difference in the SES of the children in the
maths ability groups (F(2,2418) = 10.30 p < .001p2 = .008). A post-hoc Tukey b test
indicated that children in the maths difficulty group had significantly higher deprivation
scores than children in the other two groups, and children in the high maths performance
group had significantly lower deprivation scores than the children in the other two maths
ability groups. A similar result was obtained when the association between maths ability
groups and eligibility to FSM was considered (χ2(2; n = 2421) = 50.07 p < .001).
Regarding newcomer status, the proportion of newcomer children was the highest in the
low maths performance group, and lowest in the high maths performance group (χ2(2; n =
2421) = 37.25 p < .001). There was also a significant difference in school attendance between
the three groups (F(2,2192) = 14.58 p < .001p2 = .013). A post-hoc Tukey b test indicated
that attendance rates in the case of children in the maths difficulty group were significantly
lower than in children in the other two groups.
Considering the IQ and English performance of children in the three maths ability
groups, a one-way ANOVA with maths ability groups (persistent difficulty/average
23
performance/consistently high performance) as an independent factor, and IQ as a dependent
variable indicated a significant difference in IQ (F(2,2418) = 398.84 p < .001p2 = .25)
between maths ability groups. A similar result was obtained regarding English performance as
well (F(2,2416) = 388.14 p < .001p2 = .24). Post-hoc Tukey’s b tests indicated that the low
maths ability group had significantly lower IQ and English scores than the other two groups,
and the high maths ability group had significantly higher IQ and English scores than the other
two groups.
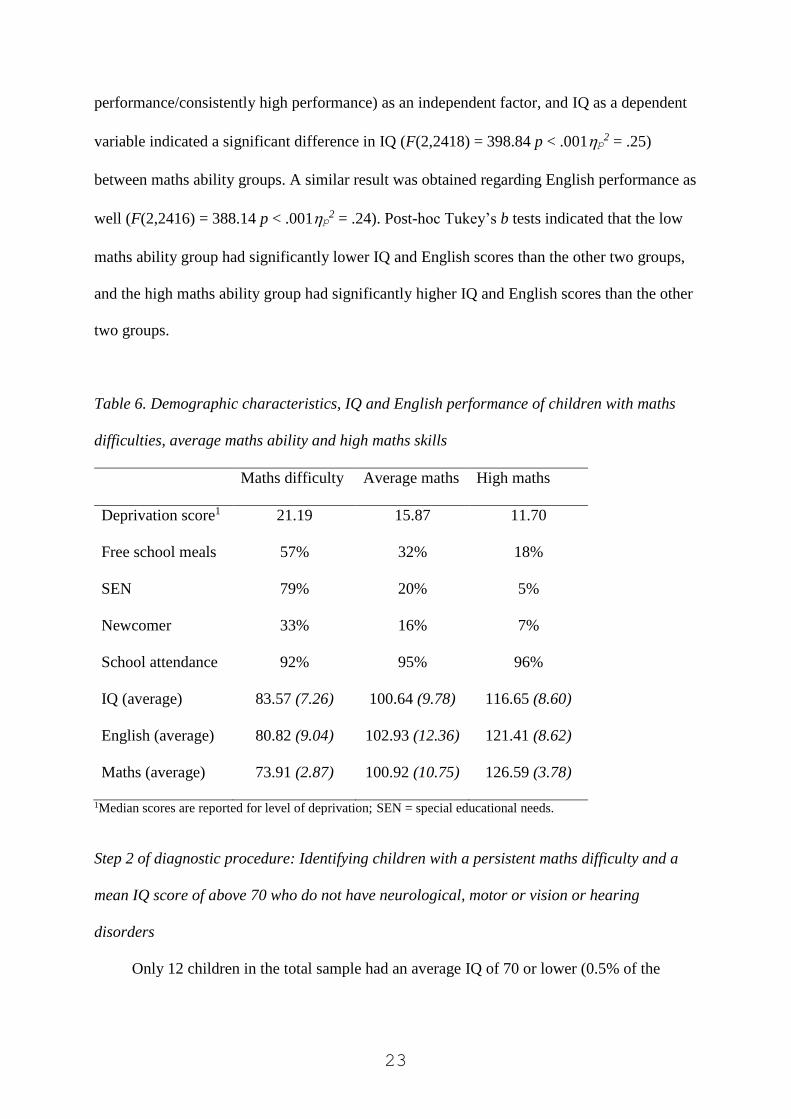
Table 6. Demographic characteristics, IQ and English performance of children with maths
difficulties, average maths ability and high maths skills
Maths difficulty Average maths High maths
Deprivation score1 21.19 15.87 11.70
Free school meals 57% 32% 18%
SEN 79% 20% 5%
Newcomer 33% 16% 7%
School attendance 92% 95% 96%
IQ (average) 83.57 (7.26) 100.64 (9.78) 116.65 (8.60)
English (average) 80.82 (9.04) 102.93 (12.36) 121.41 (8.62)
Maths (average) 73.91 (2.87) 100.92 (10.75) 126.59 (3.78)
1Median scores are reported for level of deprivation; SEN = special educational needs.
Step 2 of diagnostic procedure: Identifying children with a persistent maths difficulty and a
mean IQ score of above 70 who do not have neurological, motor or vision or hearing
disorders
Only 12 children in the total sample had an average IQ of 70 or lower (0.5% of the
24
sample)4. Half of these children had persistently low maths scores, whereas the other half of
the children had maths scores within the normal range. Thus, based on this exclusion
criterion, from the group of children with persistent maths difficulties (n = 146), we excluded
6 children. An additional child was excluded, because he had moderate hearing loss. Thus, in
summary, after excluding the children with intellectual disabilities and hearing disorders, 139
children (i.e., 5.7% of the total sample) were identified as displaying an SLDM profile. We
will refer to this group as the SLDM-profile group (in the absence of a proper clinical
synthesis, we cannot be certain of an SLDM diagnosis).
The DSM-IV specified a maths-IQ discrepancy of at least 1 SD (i.e., 15 standard scores)
in dyscalculia, although a larger discrepancy was typically expected. If this criterion was
applied in our sample, 77% of the children with persistent maths difficulties (n = 112) would
be excluded from the final SLDM-profile group. Thus, on the basis of DSM-IV, only 1.12%
of the children would meet the diagnostic criteria of mathematics disorder. Having said this,
there was a significant maths-IQ discrepancy in the SLDM-profile group (M = 10.21 SD =
7.12), which was in contrast with a lack of discrepancy in the case of children with average
maths ability (M = -.27 SD = 8.00). Nevertheless, a discrepancy was also observed in the case
of children with consistently high maths performance (M = -9.94 SD = 8.39), in the opposite
direction.
Gender distribution of SLDM profile and comorbidity with other developmental
disorders
The proportion of male and female pupils with an SLDM profile was not significantly
different (i.e., 6% of male pupils and 5.5% of female pupils had SLDM; p = .638). Eighty-one
percent of the children in the SLDM-profile group were identified by their schools as having
4 On a theoretical basis, the proportion of children with an IQ of 70 or lower should be around 2%. We have
checked the distribution of scores for each school year separately, and between 1.1-2.1% of the scores fell below
70. The most likely reason that very few children were identified as having an intellectual disability is that we
relied on average scores from multiple measurement points, which makes extreme scores less likely.
25
special educational needs, although it was not clear from the school’s records if the children
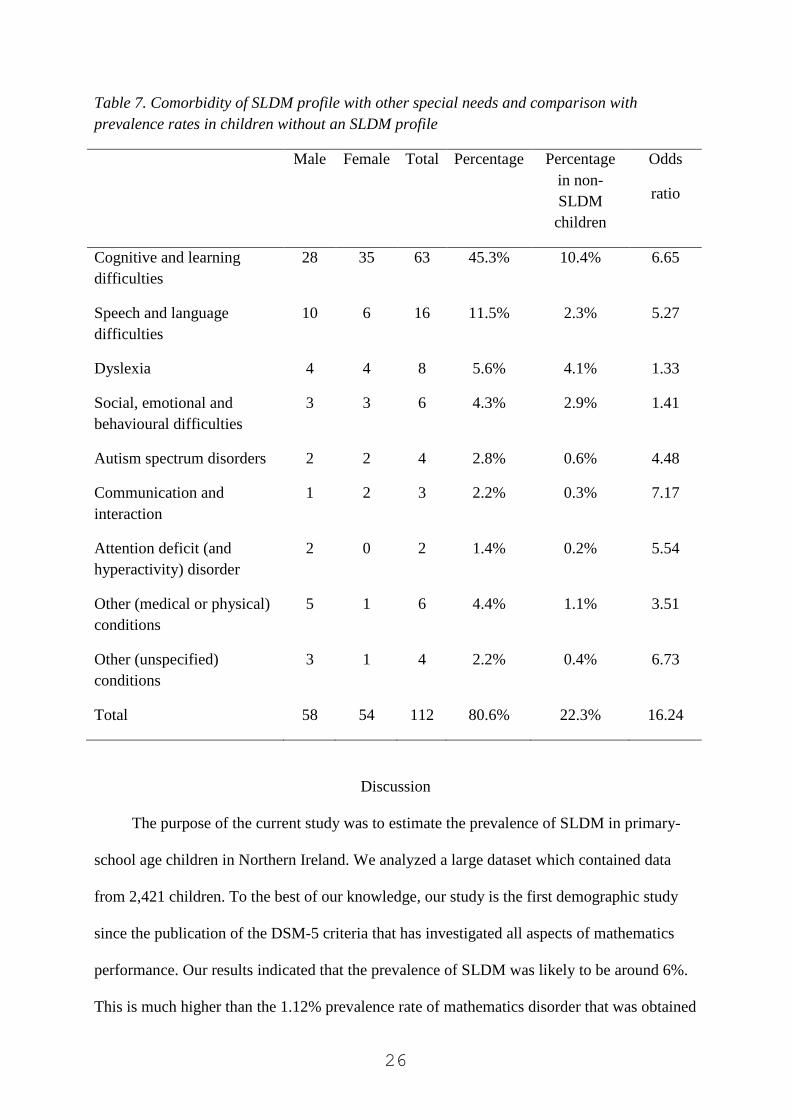
received specific support with maths. Details regarding comorbidity of SLDM profile with
other special needs are presented in Table 7, as well as a comparison of SEN between
children with and without SLDM. As we stated earlier, no child in the sample had multiple
diagnoses. All special educational needs were more common in the case of children with an
SLDM profile. Indeed, overall children with an SLDM profile were 16 times more likely to
have a diagnosis of another developmental condition than children without an SLDM profile,
with particularly high odds for certain conditions (including communication and interaction
difficulties, cognitive and learning difficulties, speech and language difficulties, AD(H)D and
autism).
Although these results suggest that a relatively low proportion of children with an
SLDM profile had reading, language or communication difficulties (i.e., twenty-seven
children, 19%), another way of establishing comorbidity rates between SLDM and difficulties
with reading and/or writing is to identify the children in the SLDM-profile group whose
average standardized English scores were 78 or lower. Sixty-four children (46% of the
children with an SLDM profile) were in this category. Unfortunately, we did not have
separate scores for the children for reading and spelling.
26
Table 7. Comorbidity of SLDM profile with other special needs and comparison with
prevalence rates in children without an SLDM profile
Male Female Total Percentage Percentage
in non-
SLDM
children
Odds
ratio
Cognitive and learning
difficulties
28 35 63 45.3% 10.4% 6.65
Speech and language
difficulties
10 6 16 11.5% 2.3% 5.27
Dyslexia 4 4 8 5.6% 4.1% 1.33
Social, emotional and
behavioural difficulties
3 3 6 4.3% 2.9% 1.41
Autism spectrum disorders 2 2 4 2.8% 0.6% 4.48
Communication and
interaction
1 2 3 2.2% 0.3% 7.17
Attention deficit (and
hyperactivity) disorder
2 0 2 1.4% 0.2% 5.54
Other (medical or physical)
conditions
5 1 6 4.4% 1.1% 3.51
Other (unspecified)
conditions
3 1 4 2.2% 0.4% 6.73
Total 58 54 112 80.6% 22.3% 16.24
Discussion
The purpose of the current study was to estimate the prevalence of SLDM in primary-
school age children in Northern Ireland. We analyzed a large dataset which contained data
from 2,421 children. To the best of our knowledge, our study is the first demographic study
since the publication of the DSM-5 criteria that has investigated all aspects of mathematics
performance. Our results indicated that the prevalence of SLDM was likely to be around 6%.
This is much higher than the 1.12% prevalence rate of mathematics disorder that was obtained
27
when we applied the DSM-IV criteria. About half of the children with an SLDM profile also
had persistent difficulties with English (with 20% of SLDM-profile children having an
official diagnosis of a language or communication disorder), and some of these children had
other comorbid disorders, such as SEBD, autism or ADHD.
Cognitive and demographic predictors of mathematics performance
In general, mathematics ability was related to both environmental factors (socio-
economic background and newcomer status), and the child’s individual characteristics (i.e.,
their IQ, their performance in English, and whether they had special educational needs).
Gender was not related to mathematics performance. However, when the effect of other
environmental and individual factors was controlled, gender became a significant predictor of
maths performance. Specifically, girls underperformed in maths when they were compared to
boys with similar IQ, English scores or similar SEN status. We will return to this issue later.
Another notable finding was the exceptionally strong correlation between children’s
maths and English scores and their IQ. On the one hand, this might be to some extent the
consequence of using average scores over multiple time points for each measure, which
makes our estimates of maths and English skills, and IQ more reliable. On the other hand, it is
interesting to consider whether this finding could be taken as evidence of a common
underlying cognitive/learning ability factor or whether a better explanation would be a
developmental model, where mutual interactions between cognitive factors lead to the
emergence of increasingly strong relationships between various cognitive skills over time (cf.,
van der Maas, Dolan, Grasman, Wicherts, Huizenga & Raijmakers, 2006). Unfortunately, we
cannot discriminate between these models on the basis of the current data (but see Davis,
Band, Pirinen, Haworth, Meaburn, Kovas et al., 2014).
The prevalence of SLDM
Previous demographic studies on maths learning difficulties/dyscalculia, reported
28
prevalence rates between 1.3-13.8%. The DSM-5 specifies a prevalence rate of 5-15% for
specific learning disorder across the academic domains of reading, writing and mathematics
among school-age children, and an estimated prevalence rate of around 4% among adults.
This suggests that prevalence rates should decrease with age, which might be the consequence
of successful interventions and the development of adaptive coping strategies. Indeed, we
have found a similar trend in the current sample.
When we considered children who exhibited persistent, severe difficulties with maths
(i.e., whose average maths performance was below a standardized score of 78), we found a
prevalence rate of 6%. Using a more lenient criterion of 1 SD below the population mean (i.e.,
an average standard score of 85 or below) would lead to a prevalence rate of 13.2%, which is
similar to the upper bound of prevalence rates reported in earlier studies. Children with
persistent maths difficulties came from relatively deprived backgrounds, and included high
proportions of children with special educational needs or a newcomer background. In general,
these children also had low IQ and low English scores. The opposite of these characterized
children with consistently high performance in maths. These findings, together with the fact
that the estimated prevalence of SLDM among school-age children decreased with age,
whereas the prevalence of consistently high achievement increased, suggests that
environmental factors play a strong role in maths difficulties/maths talent.
Discrepancy between maths and IQ
Whereas the DSM-IV required a large discrepancy between maths and IQ for a
diagnosis of dyscalculia, the DSM-5 only requires that the persistent difficulties in maths
should not be the consequence of intellectual disabilities (i.e., an IQ of 70 or lower). Whereas
the first criterion would exclude 77% of children with persistent difficulties in maths, the new
criteria only excluded 4% of these children. Although there was a significant discrepancy
between these children’s maths and IQ scores, this was typically much smaller than the
29
discrepancy of 1-2 SD that was specified in the DSM-IV. This change in the diagnostic
criteria can have huge consequences for children’s outcomes, as more children are eligible to
specialist support. This is particularly important, given the high proportion of functionally
innumerate adults (Bynner & Parsons, 1997; Gross et al., 2009).
Gender differences in SLDM
There was no gender difference in maths performance in the sample, and there was also
no difference in the proportion of male and female students with very high or very low
performance in maths (even when year groups were considered separately). This finding
aligns with the TIMSS outcomes in 2011 for Northern Ireland, in which there were also no
gender differences in maths; gender differences were also not found for 15-year-olds from
Northern Ireland in the OECD PISA study of maths in 2012. Nevertheless, we found
evidence that girls underperformed in maths relative to boys who had similar IQ, English
scores and SEN status. Specifically, although girls in general tended to have higher IQ and
English scores than boys, there was no gender difference in maths scores. This finding
replicates and extends the pattern reported by Devine et al. (2013) who found that girls were
more likely to have relatively lower maths than reading performance than boys. Nevertheless,
this result is still puzzling, considering that in the current sample, the correlations between
maths scores and IQ, as well as maths and English, were equally strong for boys and girls (the
correlation coefficients were exactly the same in the case of both genders: .77 between IQ and
maths, and .79 between maths and English).
Irrespective of the origins of the gender differences in maths, the current results
highlight a hidden gender difference in maths performance even amongst primary school
children. That is, although girls do not underperform in terms of their actual scores, they
underperform relative to their cognitive/learning potential, at least as operationalized by the
measures of IQ and the standardized English test. It has been reported that girls tend to lose
30
interest in subjects related to science, engineering, technology and mathematics (STEM)
around the age of 11 (e.g., Kerr & Robinson Kurpius, 2004). For this reason, it has been
recommended that intervention programs that aim to retain girls in STEM educational
pathways should start around this age (e.g., Stoeger, Duan, Schirner, Greindl & Ziegler,
2013). Our results indicate that these issues might emerge much earlier, and intervention
programs should be offered to girls from a much younger age.
DSM-5 diagnostic criteria: theoretical and practical implications
The two most significant changes in the DSM-5 criteria are the “merging” of learning
disorders into a single overarching category, and the abandonment of the IQ-achievement
discrepancy criterion. It has been suggested that one of the advantages of creating a larger
category of SLDs could be that the needs and rights of this group can be better represented in
the public domain (Al-Yagon, Cavendish, Cornoldi, Fawcett, Grunke et al., 2013). Another
advantage might be that instead of having to choose a main diagnosis, the level of difficulties
in each academic area has to be specified (cf., Scanlon, 2013). This might increase the
chances that children with SLDs receive support in each affected domain of learning.
Abandoning the discrepancy criterion is in line with the argument that learning disability
means achievement that is low for age or grade level, regardless of a child’s IQ (e.g., Siegel,
1989; Stanovich 1991). It might also increase the reliability of the SLDM diagnosis as maths-
IQ discrepancies might not be very stable over time (e.g., Aaron, 1997; Johnson et al., 2010;
Mazzocco & Myers, 2003).
Another reason why abandoning the discrepancy criterion is a very positive change, is
because it makes it possible for most children with persistent maths difficulties to receive an
official diagnosis and to access specialist support. Nevertheless, this can only happen if
clinicians pay equal attention to maths, reading and writing difficulties within the learning
disorder category. Indeed, whereas diagnoses of dyslexia, speech and language difficulties,

31
and communication and interaction difficulties were relatively common in our sample, only
one child (out of 2,421) had received a diagnosis of dyscalculia (and, in fact, this child did not
exhibit persistent maths difficulties). Given that the prevalence rate of dyscalculia and
dyslexia is expected to be similar, and that 108 children in the current sample had an official
diagnosis of dyslexia, we can say that a child with dyslexia was more than a hundred times
more likely to receive an official diagnosis of that disorder (which is necessary to obtain
specialist educational support) than a child with dyscalculia. Although several children in the
SLDM group received a diagnosis of cognitive and learning difficulties, in most cases this
occurred when a child showed difficulties with both maths and English, and it is unclear
whether these children received educational support specifically targeting maths.
A group of practicing educational psychologists that we consulted confirmed that they
found the DSM-IV criteria for dyscalculia confusing, and difficult to apply. Additionally, they
highlighted that even if a child had received a diagnosis of dyscalculia, there were no
generally accepted intervention methods that could be recommended. This is in contrast with
well-established intervention methods that are available in the case of language and
communication difficulties. A lack of guidance on appropriate intervention methods is also
problematic for establishing a diagnosis of SLDM, given that the DSM-5 includes the
criterion that maths difficulties should persist despite intervention efforts. Parents might also
be less aware of, and less concerned about their child’s difficulties with mathematics as
compared to problems with reading (e.g., Cannon & Ginsburg, 2008).
An additional issue that might prevent educational psychologists from implementing
any intervention methods is the common belief that one of the characteristics of SLDM is
resistance to interventions (e.g., Desoete et al., 2004; Price & Ansari, 2013). Our finding that
persistent difficulties in maths decreased in higher school grades suggests that intervention
efforts can be successful in the case of a significant proportion of children.
32
The changes in diagnostic criteria are also very important for research purposes. In the
past, researchers used varying criteria to identify children with maths difficulties/dyscalculia.
As we have seen, a combination of persistently low maths scores with relatively high IQ is
very rare, which made it very difficult for researchers to recruit samples that are sufficiently
large for empirical studies. Indeed, past studies often included very small groups of children
with DD (around 10 children or even fewer), which made it hard to generalize these findings,
and was a likely source of discrepancies between the results of different studies.
Whereas the abandonment of a discrepancy criterion makes it easier to find children
with SLDM, our results highlight another issue which is important for research purposes.
There was a very strong correlation between children’s maths, English and IQ scores, and
children with persistent maths difficulties also tended to have very low IQ and English scores.
Thus, when a matched research design is used, it might be difficult to identify children who
have similar IQ and reading scores to the SLDM group, to be included in the study as
controls. Moreover, if such a group can be recruited, they would not represent a control
sample of typical children.
Comorbidity between SLDM and other developmental difficulties
In line with several earlier studies (e.g., Gross-Tsur et al., 1996; Lewis et al., 1994;
Landerl & Moll, 2010; Moll et al., 2014; Rourke & Finlayson, 1978) we found that maths
difficulties very often co-occurred with language difficulties. We also found that about 3% of
the children with an SLDM profile had a diagnosis of autism, and another 4% had a diagnosis
of SEBD. Interestingly, although previous studies (e.g., Gross-Tsur et al., 1996; Shalev et al.,
1995) indicated that SLDM often co-occurs with ADHD, we found no evidence of this in the
current study, as only 2 children in the SLDM-profile sample had a diagnosis of
ADD/ADHD, although this proportion is somewhat higher if we consider SEBD and ADHD
as overlapping conditions. It is possible that, although AD(H)D symptoms present a risk for

33
reduced maths ability (e.g., Greven et al., 2014), these maths problems are not necessarily so
serious as to warrant a diagnosis of SLDM.
It is possible that children with different co-morbid conditions have different cognitive
profiles (e.g., Lewis et al., 1994; Rourke & Finlayson, 1978; Szűcs, 2016). Discriminating
between subtypes of SLDM could be an important future direction for research and
intervention (for similar suggestions regarding subtypes within learning disability groups see
Dombrowski, Kamphaus, Barry, Brueggeman et al., 2006).
Limitations of the current study
The DSM-5 specifies that for a diagnosis of SLDM, curriculum-based tests of
mathematics ability should be administered to children individually. Additionally, a clinical
synthesis should take place that considers the individual’s developmental, medical, family,
and educational history. Although we did not have the chance to test the children individually
(the tests were administered by the schools in a small group setting), we used the results of
multiple tests, which made our results more reliable. Regarding a clinical synthesis, we
considered several important demographic and educational factors, together with the clinical
records of the children. The DSM-5 also specifies that the difficulties should persist, despite
intervention efforts. However, in the current sample we believe that very few children
received specialist support in mathematics. Due to these limitations, we were not able to
establish the diagnostic status of the children with certainty. Unfortunately, based on the
schools’ records, we were also unable to establish specific comorbidity rates between reading
and spelling, and mathematics disorders, which would have been very relevant for a better
understanding of comorbidity between SLDs.
The DSM-5 also indicates that specific learning disorders often co-occur with anxiety
disorders, depressive and bipolar disorders. Fortes et al. (2016) recently investigated the
comorbidity between specific learning disorders and various mental disorders in children and
34
adolescents in Brazil. These authors have found that 13.8% of children with arithmetic
disorders suffered from an anxiety disorder, which was significantly higher than in the case of
participants without arithmetic disorders (6.1%) or with specific writing (8.1%) or reading
problems (7%). An important future direction could be to investigate further the links between
SLDM and anxiety disorders, including mathematics anxiety.
Conclusions and future directions
Dombrowski et al. (2006) recommended that diagnostic criteria of learning disabilities
should be unambiguous, they must be universally accepted across professions, researchers,
and governmental entities, must incorporate clearly defined subtypes of learning disabilities,
must be empirically supported, and must point to valid, reliable, and cost–effective
procedures for the identification of children with and without learning disabilities.
Regarding clarity, the new DSM guidelines seem much less ambiguous than the earlier
guidelines. Whereas the DSM-IV included two cut-off points (one for maths ability and
another one for maths-IQ discrepancy), the new guidelines are mostly focussed on maths
performance. Although IQ is still considered for diagnostic purposes, only children with very
low IQ are excluded from the SLDM category (which only affects very few of them). The
requirement of persistent difficulties also makes the diagnoses more reliable. Nevertheless, a
new source of ambiguity is that a clinical synthesis is needed for a definite diagnosis of
SLDM.
It is well-acknowledged that difficulties with mathematics can arise due to a variety of
reasons, including both environmental and individual factors (e.g., Butterworth, 2008; Price &
Ansari, 2013), and that the group of individuals with maths difficulties is very heterogeneous
(Kaufmann et al., 2013; Rubinsten & Henik, 2009). In this respect, it might seem useful to
exclude individuals whose maths problems are rooted in environmental factors or intellectual
disabilities. Nevertheless, our results showed that children with persistent maths difficulties

35
tended to come from more deprived backgrounds, and were also more likely to be
newcomers. Arguably, children with maths difficulties that arose from environmental factors
are just as likely (or even more likely) to benefit from interventions than children who
struggle with maths due to cognitive deficits. Nevertheless, it is possible that these children
might benefit more from different types of interventions.
In terms of intervention methods, a persistent claim in the literature on SLDM is that
“real” cases of SLDM are resistant to intervention (e.g., Price & Ansari, 2013). This is also
echoed by the DSM requirement that maths difficulties in SLDM should persist for at least 6
months, despite the provision of interventions that target those difficulties. Although the
current results can say little about the effectiveness of interventions, we can make
recommendations regarding some future directions related to this issue. First, it can be
recommended that all students with persistently low maths scores should receive support with
maths, regardless of any co-occurring conditions or environmental reasons. Indeed,
interventions to tackle, for example, emotional or behaviour problems alone, cannot be
expected to boost maths performance. The fact that the proportion of children with maths
difficulties slightly decreased during the primary school years suggested that scores are
malleable, and that environmental factors might play a significant role in the development and
persistence of maths difficulties. Another recommendation is that efforts should be made to
help girls to reach their full potential in maths, and these efforts should start from the earliest
school grades.
Even though we recommend that all children with maths difficulties receive
interventions, it is possible that children with different cognitive profiles would benefit from
different types of interventions (e.g., Landerl & Moll, 2010; Lewis et al., 1994; Moll et al.,
2014; Rourke & Finlayson, 1978; Szűcs, 2016). This issue deserves more research attention in
the future.
36
A final practical implication of the current results is related to the design of research
studies that compare children with mathematical difficulties and matched controls. Our
findings highlight the large variety of environmental and cognitive factors that can affect
mathematical performance. Based on our findings, it can be recommended that children in the
two groups are not only matched on age, gender, IQ and reading ability, but also on SES,
newcomer status, and special educational needs (unless the SEN needs are only maths-
related). Indeed, all of these factors significantly predict maths performance, and some of the
effect sizes (especially for newcomer status and SEN status) are considerable, even when
English and IQ scores are already taken into consideration. It is worth contrasting this
recommendation with a recent overview by Szűcs (2016) of a large number of highly cited
studies on maths difficulties. Szűcs (2016) highlighted that the majority of studies included in
his review did not match the maths difficulty and control groups on IQ or reading ability, or
either of these.
In summary, the current findings can inform both theoretical and practical approaches to
maths learning disabilities. They also highlight the lack of official acknowledgement of
mathematics difficulties, not only by parents and teachers, but also by educational
psychologists. Indeed, based on the current results, it seems likely that children with
persistent, serious difficulties with mathematics, unlike children with dyslexia, do not receive
specialist support. Thus, an important first step would be to raise awareness of SLDM among
both teachers and educational psychologists as part of their work training. Achieving this on a
large scale might also necessitate changes in educational policy. Nevertheless, even if more
children had an official diagnosis of SLDM, more research would be needed into effective
intervention methods. Regarding the application of a clinical synthesis, it is important to
consider that very low maths performance can be debilitating, and probably even more so, if it
is accompanied by socio-economic disadvantage, and/or physical or mental disabilities. For

37
this reason, not providing children with interventions into maths if they do not meet SLDM
diagnostic criteria might be very counterproductive.
38
References
Aaron, P. G. (1997). The impending demise of the discrepancy formula. Review of
Educational Research, 67, 461-502.
Al-Yagon, M., Cavendish, W., Cornoldi, C., Fawcett, A. J., Grünke, M., Hung, L. Y., ... &
Margalit, M. (2013). The proposed changes for DSM-5 for SLD and ADHD:
International perspectives—Australia, Germany, Greece, India, Israel, Italy, Spain,
Taiwan, United Kingdom, and United States. Journal of Learning Disabilities, 46, 58-
72.
American Psychiatric Association (2013). Diagnostic and Statistical Manual of Mental
Disorders (5th Edition), Washington, DC.
Badian, N. (1999). Persistent arithmetic, reading, or arithmetic and reading disability. Annals
of Dyslexia, 49, 43-70.
Barbaresi, W., Katusic, S., Colligan, R., Weaver, A., & Jacobsen, S. (2005). Learning
disorder: incidence in a population-based birth cohort, 1976-82, Rochester, Minn.
Ambulatory Pediatrics, 5, 281-289.
Butterworth, B. (2008). Developmental dyscalculia. Child Neuropsychology: Concepts,
theory, and practice, 357-374.
Büttner, G., & Hasselhorn, M. (2011). Learning disabilities: Debates on definitions, causes,
subtypes, and responses. International Journal of Disability, Development and
Education, 58, 75-87.
Bynner, J., & Parsons, S. (1997). Does numeracy matter? London: The Basic Skills Agency.
Cannon, J., & Ginsburg, H. P. (2008). “Doing the math”: Maternal beliefs about early
mathematics versus language learning. Early Education and Development, 19, 238-
260.
Currie, J., & Stabile, M. (2002). Socioeconomic status and health: why is the relationship
stronger for older children? (No. w9098). National Bureau of Economic Research.
39
Czamara, D., Tiesler, C. M., Kohlböck, G., Berdel, D., Hoffmann, B., Bauer, C. P., ... & von
Berg, A. (2013). Children with ADHD symptoms have a higher risk for reading,
spelling and math difficulties in the GINIplus and LISAplus cohort studies. PLoS One,
8(5), e63859.
Davis, O. S., Band, G., Pirinen, M., Haworth, C. M., Meaburn, E. L., Kovas, Y., ... & Curtis,
C. J. (2014). The correlation between reading and mathematics ability at age twelve
has a substantial genetic component. Nature Communications, 5: 4204.
Desoete, A., Roeyers, H., & De Clercq, A. (2004). Children with mathematics learning
disabilities in Belgium. Journal of Learning Disabilities, 37, 50-61.
Devine, A., Soltész, F., Nobes, A., Goswami, U., & Szűcs, D. (2013). Gender differences in
developmental dyscalculia depend on diagnostic criteria. Learning and Instruction, 27,
31-39.
Dirks, E., Spyer, G., van Lieshout, E. C. D. M., & de Sonneville, L. (2008). Prevalence of
combined reading and arithmetic disabilities. Journal of Learning Disabilities, 41,
460-473.
Dombrowski, S. C., Kamphaus, R. W., Barry, M., Brueggeman, A., Cavanagh, S., Devine, K.,
... & Vess, S. (2006). The Solomon effect in learning disabilities diagnosis: Can we
learn from history? School Psychology Quarterly, 21, 359-374.
DuPaul, G. J., Gormley, M. J., & Laracy, S. D. (2013). Comorbidity of LD and ADHD:
Implications of DSM-5 for assessment and treatment. Journal of Learning
Disabilities, 46, 43-51.
Eurydice at NFER – National Foundation for Educational Research: Compulsory age of
starting school in European countries (2013). Retrieved 8th December 2017 from
https://www.nfer.ac.uk/eurydice/compulsory-age-of-starting-school
Fortes, I. S., Paula, C. S., Oliveira, M. C., Bordin, I. A., de Jesus Mari, J., & Rohde, L. A.
40
(2016). A cross-sectional study to assess the prevalence of DSM-5 specific learning
disorders in representative school samples from the second to sixth grade in Brazil.
European Child & Adolescent Psychiatry, 25, 195-207.
Geary, D. C., Hoard, M. K., Byrd‐Craven, J., Nugent, L., & Numtee, C. (2007). Cognitive
mechanisms underlying achievement deficits in children with mathematical learning
disability. Child Development, 78, 1343-1359.
Greven, C. U., Kovas, Y., Willcutt, E. G., Petrill, S. A., & Plomin, R. (2014). Evidence for
shared genetic risk between ADHD symptoms and reduced mathematics ability: a twin
study. Journal of Child Psychology and Psychiatry, 55, 39-48.
Gross, J., Hudson, C., & Price, D. (2009). The long term costs of numeracy difficulties. Every
Child a Chance Trust and KPMG, London.
Gross-Tsur, V., Manor, O., & Shalev, R. S. (1993). Developmental dyscalculia, gender and
the brain. Archives of Disease in Childhood, 68, 510-512.
Gross-Tsur, V., Manor, O., & Shalev, R. S. (1996). Developmental dyscalculia: prevalence
and demographic features. Developmental Medicine & Child Neurology, 38, 25-33.
Hein, J., Bzufka, M., & Neumärker, K. (2000). The specific disorder of arithmetic skills.
Prevalence studies in a rural and an urban population sample and their clinico-
neuropsychological validation. European Child & Adolescent Psychiatry, 9, S87-
S101.
Hobbs, G., & Vignoles, A. (2010). Is children’s free school meal ‘eligibility’a good proxy for
family income? British Educational Research Journal, 36, 673-690.
Johnson, E. S., Humphrey, M., Mellard, D. F., Woods, K., & Swanson, H. L. (2010).
Cognitive processing deficits and students with specific learning disabilities: A
selective meta-analysis of the literature. Learning Disability Quarterly, 33, 3-18.
Kaufmann, L., Mazzocco, M.M., Dowker, A., von Aster, M., Gobel, S.M., et al. (2013).
41
Dyscalculia from a developmental and differential perspective. Frontiers in
Psychology, 4, 516.
Kaufmann, L., & Nuerk, H. C. (2008). Basic number processing deficits in ADHD: a broad
examination of elementary and complex number processing skills in 9‐to 12‐year‐old
children with ADHD‐C. Developmental Science, 11, 692-699.
Kerr, B., & Robinson Kurpius, S. E. (2004). Encouraging talented girls in math and science:
Effects of a guidance intervention. High Ability Studies, 15, 85-102.
Koumoula, A., Tsiromi, V., Stamouli, V., Bardani, I., Siapati, S., Graham, A., et al. (2004).
An epidemiological study of number processing and mental calculation in Greek
school children. Journal of Learning Disabilities, 37, 377e388.
Landerl, K., & Moll, K. (2010). Comorbidity of learning disorders: prevalence and familial
transmission. Journal of Child Psychology and Psychiatry, 51(3), 287-294.
Lewis, C., Hitch, G. J., & Walker, P. (1994). The prevalence of specific arithmetic difficulties
and specific reading difficulties in 9- to 10-year old boys and girls. Journal of Child
Psychology and Psychiatry, 35, 283-292.
Lindsay, R. L., Tomazic, T., Levine, M. D., & Accardo, P. J. (2001). Attentional function as
measured by a continuous performance task in children with dyscalculia. Journal of
Developmental & Behavioral Pediatrics, 22, 287-292.
Marzocchi, G. M., Lucangeli, D., De Meo, T., Fini, F., & Cornoldi, C. (2002). The disturbing
effect of irrelevant information on arithmetic problem solving in inattentive children.
Developmental Neuropsychology, 21, 73-92.
Mazzocco, M. M. M. & Myers, G. F. (2003). Complexities in identifying and defining
mathematics learning disability in the primary school-age years. Annals of Dyslexia,
53, 218–253.
Moll, K., Kunze, S., Neuhoff, N., Bruder, J., & Schulte-Körne, G. (2014). Specific learning
42
disorder: prevalence and gender differences. PLoS one, 9(7), e103537.
Murphy, M. M., Mazzocco, M. M., Hanich, L. B., & Early, M. C. (2007). Cognitive
characteristics of children with mathematics learning disability (MLD) vary as a
function of the cutoff criterion used to define MLD. Journal of Learning Disabilities,
40, 458-478.
Passolunghi, M. C., Marzocchi, G. M., & Fiorillo, F. (2005). Selective effect of inhibition of
literal or numerical irrelevant information in children with attention deficit
hyperactivity disorder (ADHD) or arithmetic learning disorder (ALD). Developmental
Neuropsychology, 28, 731-753.
Price, G. R., & Ansari, D. (2013). Dyscalculia: Characteristics, causes, and treatments.
Numeracy, 6, 2.
Ramaa, S., & Gowramma, I. P. (2002). A systematic procedure for identifying and classifying
children with dyscalculia among primary school children in India. Dyslexia, 8, 67-85.
Reigosa-Crespo, V., Valdés-Sosa, M., Butterworth, B., Estévez, N., Santos, E., Torres, P., et
al. (2011). Basic numerical capacities and prevalence of developmental dyscalculia:
the Havana survey. Developmental Psychology, 48, 123-135.
Rourke, B. P. & Finlayson, M. A. J. (1978). Neuropsychological significance of variations in
patterns of academic performance: Verbal and visual-spatial abilities. Journal of
Abnormal Child Psychology, 6, 121-33.
Rubinsten, O., & Henik, A. (2009). Developmental dyscalculia: heterogeneity might not mean
different mechanisms. Trends in Cognitive Sciences, 13, 92-99.
Scanlon, D. (2013). Specific learning disability and its newest definition: which is
comprehensive? And which is insufficient?. Journal of Learning Disabilities, 46, 26-
33.
Shalev, R. S., Auerbach, J., & Gross‐Tsur, V. (1995). Developmental dyscalculia behavioral
43
and attentional aspects: A research note. Journal of Child Psychology and Psychiatry,
36, 1261-1268.
Sheather, S. (2009). A modern approach to regression with R. New York, NY: Springer.
Siegel, L. S. (1989). IQ is irrelevant to the definition of learning disabilities. Journal of
Learning Disabilities, 22, 469-78, 486.
Snyder, T. D. & Dillow, S. A. (2012). Digest of Education Statistics 2011. Washington, DC:
U.S. Department of Education, National Center for Education Statistics
Stanovich, K. E. (1986). Matthew Effects in reading: Some consequences of individual
differences in the acquisition of literacy. Reading Research Quarterly, 21, 360–407.
Stanovich, K. E. (1991). Discrepancy definitions of reading ability: Has intelligence lead us
astray? Reading Research Quarterly, 26, 7-29.
Stoeger, H., Duan, X., Schirner, S., Greindl, T., & Ziegler, A. (2013). The effectiveness of a
one-year online mentoring program for girls in STEM. Computers & Education, 69,
408-418.
Strang, J. D. & Rourke, B. P. (1983). Concept-formation/nonverbal reasoning abilities of
children who exhibit specific academic problems with arithmetic. Journal of Clinical
Child Psychology, 12, 33-39.
Szűcs, D. (2016). Subtypes and co-morbidity in mathematical learning disabilities: Multi-
dimensional study of verbal and visual memory processes is key to understanding.
Progress in Brain Research, 227, 277-304.
OECD (2015). The ABC of Gender Equality in Education: Aptitude, Behaviour, Confidence,
PISA, OECD Publishing. http://dx.doi.org/10.1787/9789264229945-en
Reigosa-Crespo, V., Valdés-Sosa, M., Butterworth, B., Estévez, N., Santos, E., Torres, P. et
al. (2011). Basic numerical capacities and prevalence of developmental dyscalculia:
the Havana survey. Developmental Psychology, 48, 123-135.

44
van der Maas, H. L., Dolan, C. V., Grasman, R. P., Wicherts, J. M., Huizenga, H. M., &
Raijmakers, M. E. (2006). A dynamical model of general intelligence: the positive
manifold of intelligence by mutualism. Psychological Review, 113, 842-861.