the pressure ’ s on cookbook medicine? or a recipe for success
DESCRIPTION
The Pressure ’ s On Cookbook Medicine? Or a Recipe for Success. CajunCodeFest April 24, 2014. Kenny J. Cole, MD Associate CMO and VP of Care Delivery Blue Cross Blue Shield of Louisiana. The Art and Science of Cooking. Two Approaches Application of skill and knowledge - PowerPoint PPT PresentationTRANSCRIPT

The Pressure’s OnCookbook Medicine?
Or a Recipe for Success
Kenny J. Cole, MDAssociate CMO and VP of Care Delivery
Blue Cross Blue Shield of Louisiana
CajunCodeFestApril 24, 2014

The Art and Science of Cooking• Two Approaches
– Application of skill and knowledge • Highly trained chef• Customized• Tacit knowledge• Iterative process
– Following a recipe• Requires less skill and training• Programmatic• Explicit knowledge• Sequential process

Good Cooking vs. Bad Cooking
• What determines good vs. bad?– Taste– Finished Product– Outcome
• Depends on the skill and knowledge of the chef OR adherence to the recipe

The Art and Science of Medicine• Two Approaches
– Application of skill and knowledge• Highly trained clinician• Customized• Tacit knowledge• Iterative process
– Following a “recipe” or protocol• Requires less skill and training• Programmatic• Explicit knowledge• Sequential process

Good vs. Bad Medicine
• Depends on the Outcome• For sequential care processes consistent
application of a standardized protocol may lead to more reliable outcomes– Success depends upon rigid adherence to the
protocol• For iterative care processes success is
usually dependent upon the skill and knowledge of the provider
Potential Problems or Challenges
• Sequential Process reluctance among chefs and clinicians that following a recipe or protocol may lead to a more reliable outcome– Entrenched provider mindsets– Change Management Strategies– Leadership Challenges
• Iterative Process Variation– Outcome depends on skill and knowledge

Sequential vs. Iterative
• What determines which process to use?– State of evolution of knowledge
• Knowledge that Knowledge how Knowledge why
– Knowledge form – tacit explicit – As the state of knowledge evolves, the location of
knowledge may change• From skilled artisan• To codifying it in an explicit algorithm or piece of
technology

The Knowledge FunnelMartin, Roger. Design of Business: Why Design Thinking is the Next Competitive Advantage; 2009

Our Current Healthcare System
The most expensive in the world• Per capita healthcare costs almost 50% higher than the next highest nation•Failure to yield consistently high-value care•~30 to 50% of healthcare spending in the US is “pure waste”•Only 55% of effective care actually delivered
Key quality and system performance indicators showing the US actually lagging behind other developed nations

A Perfect Storm
• Patient safety and quality concerns
• Demographic changes• Rapidly changing technologies
and treatment • Digital transition• Workforce issues• Reimbursement changes• Rising consumerism

Future Health Care System
• Transformation of Delivery System– From Volume-driven, Transaction-based
– To Value-driven, Outcomes-based
Value = Quality of Outcomes achieved per unit of Cost expended

Healthcare System Transformation
• First delivery system transformation
• Then evolve reimbursement mechanisms that emphasize value over volume• FFS Performance-based
contracts (QBPC)• Risk-based contracts (e.g.,
shared savings, bundled payments, capitation)
• Requires Health Plan-Provider Collaboration

Transformation JourneyHow do we get there?
Lean/Six Sigma first used in health care over a decade ago Operational Processes
Applying DMAIC methodology of Six Sigma or process improvement science Clinical Processes 1.Improved outcomes2.Reward providers who demonstrate improved outcomes3.Help drive market share to these providers4.Enable value-based competition as providers then begin to compete on value rather than volume

Six Sigma Basics

What does Six Sigma mean?
•The term “Sigma” is a measurement of how far a given process deviates from perfection – a measure of the number of “defects”. Six Sigma correlates to just 3.4 defects per million opportunities.
•A quality improvement methodology that applies statistics to measure and reduce variation in processes.•A management system that is comprehensive and flexible for achieving, sustaining, and maximizing success.
2
3
4
56
308,537
66,807
6,210
233
3.4
BB DPMODPMO

Key Concepts Applied to Healthcare
•Critical to Quality (CTQ)Critical to Quality (CTQ):: Attributes most important to the
patient
•DefectDefect:: Failing to deliver what the patient needs
•Process CapabilityProcess Capability:: What our process can deliver
•Stable OperationsStable Operations:: Ensuring consistent, predictable processes
to improve what the patient needs


Goals of Three-Year Campaign
Measurable improvements in high blood pressure prevention, detection, and control
80% of patients at goal according to JNC7 75% of AMGA membership adopt (at least one)
campaign planks.
Engage and empower patients to actively manage their health.
18

80% of Patients at Goal Blood Pressure
Processes to Achieve Goal
Registry usedto identify and track
hypertension patients
All specialties intervene with patients not in
control
All team members trained in importance of
BP goals
19
BP addressed for every hypertension
patient, every primary care visit

Blood Pressure Goals in US
Organization/Guideline BP Goal
JNC VII (2003) Uncomplicated <140/90Diabetes/CKD <130/80
JNC VIII (2014) Age < 60 <140/90Age > 60 <150/90
ADA (2013) Most diabetics <140/80Younger/healthier <130/80
AHA (2011) Age >80 <145/90
NKF (2004) CKD <130/80

FUP4_Baton Rouge Clinic
Perc
ent
(%)
www.cosehc.org
Key:
Average of all ATGOAL practicesIndividual ATGOAL practices
Your practice National Hypertension Control Rate = 50.1%
Control Rate: < 140/90 mm Hg non-diabetic; < 140/80 mm Hg diabetic

The Pressure’s OnBaton Rouge Clinic
Six Sigma Hypertension Project
Initiative Goal:Increase the number of patients achieving adequate blood pressure control, defined as <140/90 in non-diabetics and <140/80 in patients with diabetes, from its current rate of 60% in the Baton Rouge Clinic internal medicine department to > 80%
Initiative Goal:Increase the number of patients achieving adequate blood pressure control, defined as <140/90 in non-diabetics and <140/80 in patients with diabetes, from its current rate of 60% in the Baton Rouge Clinic internal medicine department to > 80%
Place picture of initiative, team, or
some type of illustration here
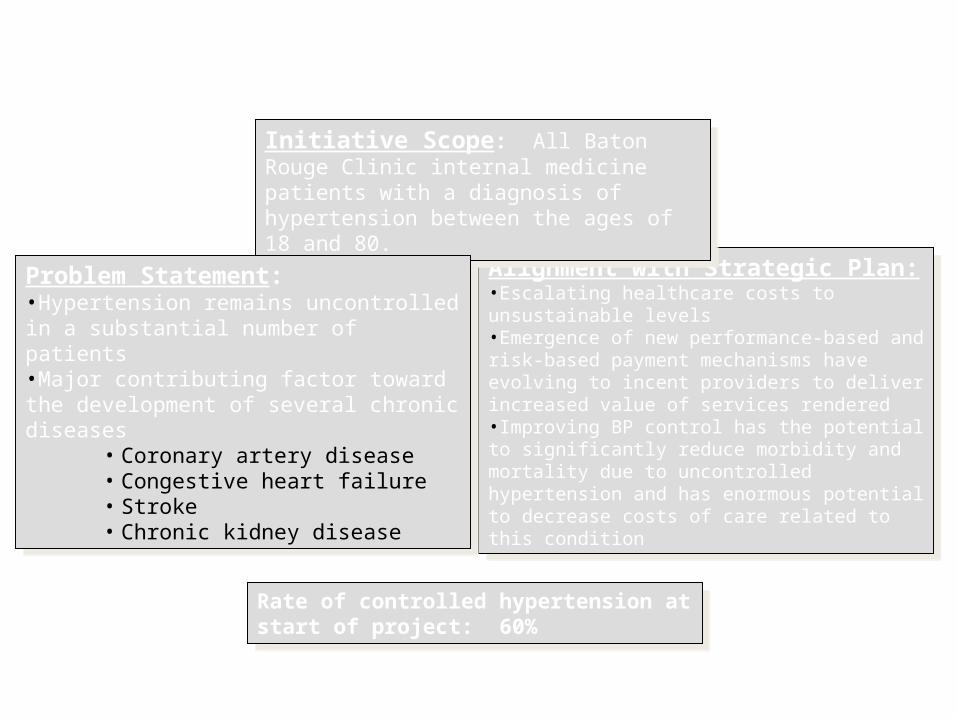
Alignment with Strategic Plan:•Escalating healthcare costs to unsustainable levels•Emergence of new performance-based and risk-based payment mechanisms have evolving to incent providers to deliver increased value of services rendered •Improving BP control has the potential to significantly reduce morbidity and mortality due to uncontrolled hypertension and has enormous potential to decrease costs of care related to this condition
Alignment with Strategic Plan:•Escalating healthcare costs to unsustainable levels•Emergence of new performance-based and risk-based payment mechanisms have evolving to incent providers to deliver increased value of services rendered •Improving BP control has the potential to significantly reduce morbidity and mortality due to uncontrolled hypertension and has enormous potential to decrease costs of care related to this condition
Initiative Scope: All Baton Rouge Clinic internal medicine patients with a diagnosis of hypertension between the ages of 18 and 80.
Initiative Scope: All Baton Rouge Clinic internal medicine patients with a diagnosis of hypertension between the ages of 18 and 80.
Problem Statement: •Hypertension remains uncontrolled in a substantial number of patients•Major contributing factor toward the development of several chronic diseases
• Coronary artery disease• Congestive heart failure• Stroke• Chronic kidney disease
Problem Statement: •Hypertension remains uncontrolled in a substantial number of patients•Major contributing factor toward the development of several chronic diseases
• Coronary artery disease• Congestive heart failure• Stroke• Chronic kidney disease
Define Phase
Rate of controlled hypertension at start of project: 60%
Rate of controlled hypertension at start of project: 60%

Mobilizing commitmentTechnical-Political-Cultural analysis
Data mining
Implementation difficulty 30%Medication expenseGeneric vs. brand name medicationsBP measurement accuracy
Loss of physician autonomy/loss of control Professional resentment/unwillingness to embrace change
Professional disagreement regarding evidence-based guidelines 40%Failure to recognize the need for change
Increased work for physician’s nurses or for physicians
Patient noncompliance Patient denial of a problem 30% Louisiana cuisine and culture (due to silent nature of disease)
High sodium intake Priorities – where to spend money?High rates of obesity Patient ignorance regarding
importance of adequate BP control
Sources of
Resistance Causes/Reasons for Resistance Rating
(0-100%)
Technical
Political
Cultural

These are our patients, friends, and families

These are our patients, friends, and families

Total Medicare Reimbursements per Enrollee
FUP3: Baton Rouge Clinic

How is our process performing current state?Baseline Process Capability
Define Measure
Anal
yze
Improve
Cont
rol
Y=# patients BP<=target
Total # BRC IM hypertensive patients (defined as BP >140/90 with diagnosis of HTN in any encounter)
Baseline (Per ADA Targets)
Target Diabetic 140/80
Target Non-Diabetic 140/90
Visit Time Frame 2/1/13 – 3/29/13
Defects 2,471
Opportunities 6,214
DPMO 397,650
Sigma 1.7

What is contributing to our DPMO?Critical Xs
Define Measure
Anal
yze
Improve
Cont
rol

Non-DiabeticDiabetic
4000
3000
2000
1000
0
Patient
Count
YN
(Per JNC VII)BP Controlled
Diabetic Status vs BP Controlled Per JNC VII
Non-DiabeticDiabetic
4000
3000
2000
1000
0
Patient
Count
YN
(Per ADA)BP Controlled
Diabetic Status vs BP Controlled Per ADA
What is contributing to our DPMO?All Patients: Diabetic Status
Define Measure
Anal
yze
Improve
Cont
rol
P-Value = 0.000 P-Value = 0.000
Diabetic Status is statistically significant because there is a higher proportion of diabetics who are not in control compared to non-diabetics

What is contributing to our DPMO?All Patients: Age (65 or over)
Define Measure
Anal
yze
Improve
Cont
rol
Under 6565 and older
3500
3000
2500
2000
1500
1000
500
0
Patient
Count
YN
(Per ADA)BP Controlled
Patient Age Group vs BP Controlled Per ADA
Under 6565 and older
100
80
60
40
20
0
Perc
enta
ge o
f Patients
YN
(Per ADA)BP Controlled
41.305
38.0267
BP Controlled Per ADA as Percentage of Age Group
P-Value = 0.008
Age is statistically significant because there is a smaller proportion of patients 65 and older who are out of control compared to patients who are under 65

What is contributing to our DPMO?All Patients with measured BMI*:BMI Grouping
Define Measure
Anal
yze
Improve
Cont
rol
Extremely ObeseNormalOverweightObese
2500
2000
1500
1000
500
0
Patient
Count
YN
(Per ADA)BP Controlled
BMI Grouping vs BP Controlled Per ADA
Extremely ObeseNormalOverweightObese
100
80
60
40
20
0Perc
enta
ge o
f Patients
YN
(Per ADA)BP Controlled
46.9477
34.9576
35.8163
42.1501
BP Controlled per ADA as a Percentage of BMI Grouping
P-Value = 0.000
BMI grouping is statistically significant because there is a larger proportion of extremely obese patients whose BP is out of control compared to other BMI groupings
*157 patients were removed because there was no BMI reading at the date of service bringing the total sample size to 6,057

What is contributing to our DPMO?All Patients: Providers in BRC Internal Medicine
P-Value = 0.000
Define Measure
Anal
yze
Improve
Cont
rol

What is contributing to our DPMO?Patients Not In Control at Prior Visit*: Time Frame For Follow Up
Prior Visit defined as most recent date of service from the sample visit. If a patient has more than one prior visit, the most recent is taken. Dates for prior visit range 8/7/12 to 3/26/123
Define Measure
Anal
yze
Improve
Cont
rol

• Vitals Station• Specially trained nurses checking blood pressure to eliminate
variance, minimize errors, and maximize accuracy of readings• Use of automated blood pressure cuffs?
•Standardized evidence-based hypertension treatment protocol•Target to achieve evidence-based treatment goals in patients < age 80
• < 140/90 for uncomplicated hypertension• <140/80 for most diabetics
•Add recall appointment feature in Epic • Specify 2-week follow-up period for all patients > 20 mmHg away from
treatment goal• Specify 4-week follow-up period for all patients whose readings are <
20 mmHg away from treatment goal•Utilize “Remind me” feature in EMR to populate a registry of uncontrolled hypertensives to facilitate outreach and ensure timely follow-up•Create brochure for patients to educate about the risks of hypertension, importance of compliance with medications and appropriate follow-up
Improve PhaseDefine Measure
Anal
yze
Improve
Cont
rol


Define Measure
Anal
yze
Improve
Cont
rol What is the impact of our project to date?
9 out of 10 Pilot physicians improved BP control in first month

• Baseline Process Capability ~60%•Diabetic Status, BMI, Age are statistically significant variables, but Provider is the most significant variable associated with failure to achieve hypertension control•Adherence to a standardized protocol improves hypertension control to 90%, establishing a NEW IMPROVED process capability•Achieving scalability will present a leadership challenge involving change management strategies aimed at overcoming entrenched provider mindsets•The process can be codified in such a way as to allow clinical personnel with lesser skill and training to achieved much better process capability•Has implications for the design of care delivery and which will involve NEW PAYMENT METHODOLOGIES to support delivery system transformation
• Baseline Process Capability ~60%•Diabetic Status, BMI, Age are statistically significant variables, but Provider is the most significant variable associated with failure to achieve hypertension control•Adherence to a standardized protocol improves hypertension control to 90%, establishing a NEW IMPROVED process capability•Achieving scalability will present a leadership challenge involving change management strategies aimed at overcoming entrenched provider mindsets•The process can be codified in such a way as to allow clinical personnel with lesser skill and training to achieved much better process capability•Has implications for the design of care delivery and which will involve NEW PAYMENT METHODOLOGIES to support delivery system transformation
Summary/Conclusions

The Future: From Worst to First
• Diabetes• Hyperlipidemia• Congestive Heart Failure• HIV• Asthma/COPD
• Respiratory Tract Infections
• Depression• Many types of Cancer• Chest Pain• Back Pain

The Pressure’s OnCookbook Medicine? Or a Recipe for Success
QUESTIONS?DISCUSSION
QUESTIONS?DISCUSSION