the power of the portfolio, 10/15 revision
TRANSCRIPT

POWEROF THE PORTFOLIO
THE

One aspect of how Northwestern Mutual delivers value for our policyowners is “the power of the portfolio.” It’s our well-diversified, long-term approach to investing the company’s general account assets.
This is done with a careful eye on risk but with enough tolerance for more rewarding investments.
PROTECTION AND PERFORMANCE
THE POWER OF THE PORTFOLIO
CONTENTS
Long-term Disciplined Investment Strategy 4
Northwestern Mutual’s Advantage 5
Balance and Diversification 6
Bond Portfolio Quality and Duration 7
Investment Portfolio Breakdown 8
Diversified Investing with a Long-term View 10
Investment Portfolio Performance 12
Efficient Frontier 13
Dividends and the Power of the Portfolio 14
2

THE POWER OF THE PORTFOLIO
Read on for more about Northwestern Mutual’s investment strategies, why we can invest in a greater percentage of equity and other risk assets on average than do other insurers, and how investment results support the promises we make.
An essential ingredient that contributes to our financial strength and capacity to pay dividends on participating insurance and annuity products is investment earnings from the general account investment portfolio.
Investment experts manage or administer more than $200 billion in assets backing most of the company’s life, disability income and Portfolio Income Annuity liabilities.1
The way company assets are invested can help produce interest income, equity dividends and capital gains. Those investment earnings help us fund the premium, benefit, cash value and annuity income promises we make to policyowners. They can also help fund policy dividends we may pay. (Keep in mind, dividends are not guaranteed. See page 15 for details.)
Insurance dividends involve more than the company’s investment earnings. In fact, favorable expense management and claims experience currently contribute nearly two-thirds of our dividend-paying capacity.
All of these factors — investment, expense and claims experience — come together to help produce Northwestern Mutual’s overall financial results. Those results allow us to pay an expected $5.5 billion in total dividends to participating policyowners in 2015.
1 The vast majority of the company’s managed assets back most of its life, disability income and Portfolio Income Annuity liabilities. The investment strategies described in this booklet apply to the investment of those assets. A portion of managed assets back the remaining liabilities (primarily fixed deferred annuities, income plans and long-term care insurance), which have different investment exposures than described in the pages that follow. When purchasing the company’s life insurance and annuity products, clients are not investing in the company’s general account portfolio but purchasing products backed by the financial strength of Northwestern Mutual. Long-term care insurance is issued by Northwestern Long Term Care Insurance Company, Milwaukee, WI, a subsidiary of Northwestern Mutual.
PROTECTION AND PERFORMANCE
3

Consistent with this policy, we invest a significant portion of assets in high-quality fixed income instruments and the remainder in high-yield bonds and equity investments. Allocations among these asset classes will change as the portfolio is adjusted in response to market conditions and opportunities, as well as investment risk management considerations.
Fixed income investments represent the core of our general account, providing a stable foundation while generating current income. Our portfolio of fixed income investments is largely highly rated and is well diversified within and among fixed income sectors to minimize risk. Fixed income investments allow us to match the cash flow of our assets versus expected liabilities without taking significant interest rate risks.
THE POWER OF THE PORTFOLIO
LONG-TERM DISCIPLINED INVESTMENT STRATEGYNorthwestern Mutual’s general account investment objective is to generate superior returns while maintaining a well-balanced and diversified investment portfolio to preserve our exceptional financial strength. This time-tested strategy fundamentally supports our ability to help deliver lifelong financial security to clients.
Allocation of Managed Assets(Percentage of 2014 Year-End Total Managed Assets)
Our equity investments include investments in private common stock, real estate equities and public common stock. Typically, such diversification across different types of equities enables the portfolio to offset weakness in any one area with attractive performance in another. Furthermore, similar to fixed income, equity investments are highly diversified by issue and across countries, industries and other parameters.
Our greater allocation to equities and high-yield bonds relative to fellow insurers is a distinguishing feature of our general account portfolio.2 Over the long term, the added diversification of investments with a higher risk level and corresponding higher return potential makes an important contribution to the overall performance of the portfolio.
Ultimately, the combination of asset diversification, active portfolio management and a long-term perspective supports outstanding product value and enhances our financial strength. Our prudent investment strategy and unique business model have contributed to nearly 160 years of strength and stability.
Public Equities
Real Estate Equities
Real Estate Mortgages
Private Equities
Private Fixed Income
Public High Yield
Private Mezzanine
Public Fixed Income
84% Investment-Grade Fixed Income
8% Below-Investment-Grade (High Yield) Fixed Income
3% Private Common Stock
3% Real Estate Equities
2% Public Common Stock
< 1% Strategic Affiliates
2 Based on analysis of 2014 year-end financial statement data available through SNL Financial, Northwestern Mutual invested about 16 percent of general account assets in risk assets and high-yield bonds as compared to an industry average of 11 percent. Risk assets include below investment grade (high-yield) fixed income, public and private common stock, real estate equities and strategic affiliates.
4

THE POWER OF THE PORTFOLIO
NORTHWESTERN MUTUAL’S ADVANTAGEOur core strategic attributes allow us to invest in a steady and consistent manner. They provide the confidence to endure the ups and downs of the investment markets that often produce favorable returns. These attributes include our significant capitalization, mutual company structure and excellent persistency and mortality rates.
Surplus Ratio (Past 40 years)Surplus and asset valuation reserve (AVR) as a percentage of general account insurance reserves (consolidated statutory basis)
AVR
Surplus
0%
3%
6%
9%
12%
15%
20142009200419991994YEAR
1989198419791975
CAPITAL LEVELSOne measure of financial strength is a company’s total surplus level, which provides a cushion against the volatility of higher-risk assets (which come with the potential for higher rewards) while maintaining the overall strength of the company. Our total surplus, composed of surplus and asset valuation reserve (AVR), remains sound compared to its historical levels (see the chart to the right).
Surplus provides protection against the unexpected, while AVR supports a long-term investment strategy by cushioning surplus against market volatility. It’s our higher level of capital that allows us to take additional risk in the investment portfolio. Policyowners have the opportunity to benefit from the higher expected returns, which increase our dividend-paying capacity, and they avoid the risks because their policy values are guaranteed.
MUTUAL STRUCTURE
Northwestern Mutual’s mutual company structure allows us to take a long-term view of investing. Because we are not subject to quarter-by-quarter financial pressures faced by public companies, we can invest with patience, ride out downturns in the market and develop opportunities that may not realize their full potential for years.
PERSISTENCY AND MORTALITY
Our policyowners stay with us for many years once they buy a policy and, as a group, tend to live longer lives.3 That means we can count on a consistent stream of premium payments coming in the door. In fact, strong, positive cash flow from premiums and investment income allow us to make, on average, more than $1.2 billion per month in new investments. That lets us seek investments that may be less liquid and provides the potential for additional return.
5
3 The Society of Actuaries Intercompany Mortality Study, 2008-09 Individual Life Experience Report.

Northwestern Mutual’s general account portfolio consists largely of investment-grade fixed income assets, with the balance made up of high-yield bonds and equities. This balanced strategy provides above-average returns through a variety of business cycles and economic conditions.
Investment-grade fixed income assets include money market investments, bonds and preferred stock (both public and private) and commercial mortgage loans. The risk portfolio includes high-yield bonds, private mezzanine, commercial real estate equities and private and public common stock.
We achieve even greater diversification by selecting a large number of investments within each asset class.
Our investment managers also participate in all major asset classes and market sectors because history has proven that no single asset class is always the highest performing. The size of the portfolio, among other factors, allows the company to invest in asset classes that are difficult for individual investors to participate in (for example, commercial real estate, private fixed income and private equity).
BALANCE AND DIVERSIFICATION
THE POWER OF THE PORTFOLIO
Northwestern Mutual General Account Asset Class Performance RankOne-year total returns
Highest-Performing
Class
Lowest-Performing
Class
2005 2006 2007 2008 2009 2010 2011 2012 2013 2014
Private Equities
Private Equities
Private Equities
Public Fixed Income
Private Mezzanine
Private Equities
Real Estate Equities
Private Mezzanine
Public Equities
Private Equities
Real Estate Equities
Private Mezzanine
Private Mezzanine
Private Fixed Income
Public High Yield
Public Equities
Real Estate Mortgages
Private Equities
Private Equities
Public Equities
Private Mezzanine
Real Estate Equities
Public Equities
Real Estate Equities
Public Equities
Real Estate Mortgages
Public Fixed Income
Public High Yield
Private Mezzanine
Private Mezzanine
Public Equities
Public Equities
Real Estate Equities
Private Equities
Private Fixed Income
Public High Yield
Private Equities
Public Equities
Real Estate Equities
Real Estate Equities
Public High Yield
Public High Yield
Public Fixed Income
Real Estate Mortgages
Real Estate Mortgages
Private Mezzanine
Private Fixed Income
Real Estate Equities
Public High Yield
Real Estate Mortgages
Private Fixed Income
Real Estate Mortgages
Private Fixed Income
Public High Yield
Public Fixed Income
Real Estate Equities
Public High Yield
Private Fixed Income
Real Estate Mortgages
Public Fixed Income
Public Fixed Income
Private Fixed Income
Real Estate Mortgages
Private Mezzanine
Private Equities
Private Fixed Income
Private Mezzanine
Real Estate Mortgages
Private Fixed Income
Private Fixed Income
Real Estate Mortgages
Public Fixed Income
Public High Yield
Public Equities
Real Estate Equities
Public Fixed Income
Public Equities
Public Fixed Income
Public Fixed Income
Public High Yield
6

THE POWER OF THE PORTFOLIO
BOND PORTFOLIO QUALITY AND DURATION
Bond Portfolio QualityCredit quality is defined as the ability of the issuer to pay interest and principal on a timely basis.
Bond Portfolio Quality: The general account portfolio of public and private bonds and preferred stock was rated 89 percent investment grade (BBB or greater), and 30 percent held the highest quality rating of AAA at year-end 2014.
Bond Portfolio Duration: We maintain a relatively short bond portfolio average duration of five to six years. As a result, the value of our bond holdings is not overly sensitive to changes in the interest rate environment.
Duration is a measure of the sensitivity of the price of a fixed income investment to a change in interest rates. For example, a five-year duration means a bond is expected to increase in value by about 5 percent if interest rates fall 1 percent and decrease in value by about 5 percent if interest rates rise 1 percent.
2005 2006 2007 2008 2009 2010 2011 2012 2013 2014
Private Equities
Private Equities
Private Equities
Public Fixed Income
Private Mezzanine
Private Equities
Real Estate Equities
Private Mezzanine
Public Equities
Private Equities
Real Estate Equities
Private Mezzanine
Private Mezzanine
Private Fixed Income
Public High Yield
Public Equities
Real Estate Mortgages
Private Equities
Private Equities
Public Equities
Private Mezzanine
Real Estate Equities
Public Equities
Real Estate Equities
Public Equities
Real Estate Mortgages
Public Fixed Income
Public High Yield
Private Mezzanine
Private Mezzanine
Public Equities
Public Equities
Real Estate Equities
Private Equities
Private Fixed Income
Public High Yield
Private Equities
Public Equities
Real Estate Equities
Real Estate Equities
Public High Yield
Public High Yield
Public Fixed Income
Real Estate Mortgages
Real Estate Mortgages
Private Mezzanine
Private Fixed Income
Real Estate Equities
Public High Yield
Real Estate Mortgages
Private Fixed Income
Real Estate Mortgages
Private Fixed Income
Public High Yield
Public Fixed Income
Real Estate Equities
Public High Yield
Private Fixed Income
Real Estate Mortgages
Public Fixed Income
Public Fixed Income
Private Fixed Income
Real Estate Mortgages
Private Mezzanine
Private Equities
Private Fixed Income
Private Mezzanine
Real Estate Mortgages
Private Fixed Income
Private Fixed Income
Real Estate Mortgages
Public Fixed Income
Public High Yield
Public Equities
Real Estate Equities
Public Fixed Income
Public Equities
Public Fixed Income
Public Fixed Income
Public High Yield
These ratings are based on the lower of the credit ratings from Standard & Poor’s, Moody’s Investors Service or Fitch Ratings when available or internal rating evaluations when third-party ratings are not available.
30% AAA5% AA21% A33% BBB
5% BB4% B2% CCC & Lower
Investment Grade
Below Investment Grade
7
THE POWER OF THE PORTFOLIO
FIXED INCOME
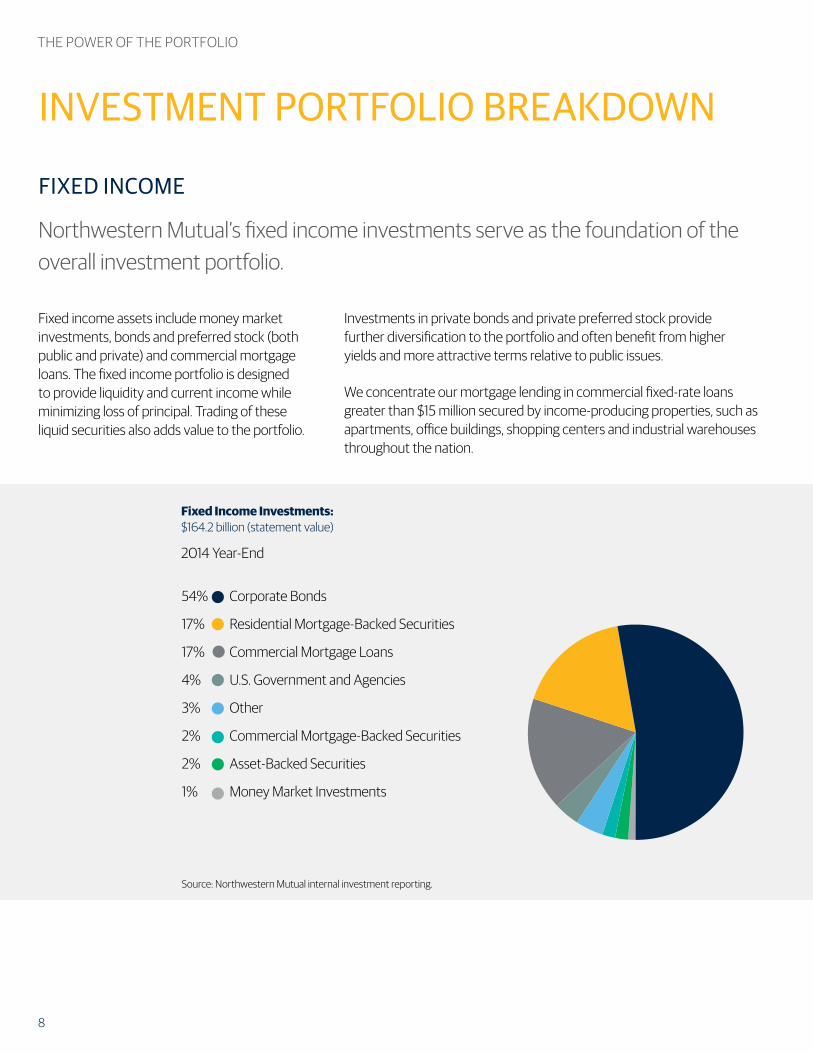
Northwestern Mutual’s fixed income investments serve as the foundation of the overall investment portfolio.
INVESTMENT PORTFOLIO BREAKDOWN
Fixed Income Investments: $164.2 billion (statement value)
2014 Year-End
Fixed income assets include money market investments, bonds and preferred stock (both public and private) and commercial mortgage loans. The fixed income portfolio is designed to provide liquidity and current income while minimizing loss of principal. Trading of these liquid securities also adds value to the portfolio.
53% Corporate Bonds 17% Residential Mortgage-
Backed Securities
17% Commercial Mortgage Loans
4% US Government and Agencies
4% Other 2% Commercial Mortgage-
Backed Securities 2% Asset-Backed Securities 1% Money Market
Investments
54% Corporate Bonds
17% Residential Mortgage-Backed Securities
17% Commercial Mortgage Loans
4% U.S. Government and Agencies
3% Other
2% Commercial Mortgage-Backed Securities
2% Asset-Backed Securities
1% Money Market Investments
Source: Northwestern Mutual internal investment reporting.
Investments in private bonds and private preferred stock provide further diversification to the portfolio and often benefit from higher yields and more attractive terms relative to public issues.
We concentrate our mortgage lending in commercial fixed-rate loans greater than $15 million secured by income-producing properties, such as apartments, office buildings, shopping centers and industrial warehouses throughout the nation.
8

THE POWER OF THE PORTFOLIO
Real Estate Equities
Commercial real estate equity investments consist primarily of apartment, warehouse and office properties held through both direct and joint venture ownership. Through partnerships with developers nationwide, we develop apartment communities and warehouse properties and also purchase properties directly. Asset managers operating out of our real estate field offices monitor local markets and actively manage the investment properties, creating additional long-term value.
Private Equities
The private equity portfolio includes direct equity investments in companies and private equity fund investments. Private equity fund investments also generate new opportunities to invest directly with companies in those fund portfolios.
Public Common Stock
The public common stock portfolio invests domestically and internationally across sectors to create a liquid, diversified portfolio. This asset class offers the potential of attractive total returns and a hedge against inflation. Having a long-term perspective is a competitive advantage in the public equity markets, allowing for contrary thinking and a focus on the principal drivers of value creation.
The equity portfolio is broadly diversified across private equities, real estate equities and public common stock. At year-end 2014, this portfolio represented 8 percent of total managed assets.
Over the long term, we expect equities to contribute higher returns and provide incremental diversification to the portfolio. Our allocation to equities has enhanced our dividend-paying capacity and financial strength.
EQUITIES
Northwestern Mutual’s higher-than-average allocation to equity investments as compared to peers is a distinguishing feature of our investment portfolio.4
Equity Investments: $15 billion (statement value)
2014 Year-End
42% Private Equities 42% Real Estate 16% Public Common Stock
40% Real Estate Equities
35% Private Equities
25% Public Common Stock
Source: Northwestern Mutual internal investment reporting.
4 Based on analysis of 2014 year-end financial statement data available through SNL Financial.
9

THE POWER OF THE PORTFOLIO
Northwestern Mutual in 2014 completed construction on Terrena, a $100 million equity development in the Los Angeles neighborhood of Northridge. The wholly owned, mixed-use development consists of 14,400 square feet of retail space and 416 luxury apartments. Leasing has been encouraging at this neighborhood-changing project.
Northwestern Mutual joined with two other investment partners in 2011 to provide funding to complete construction of Kensington Boston, a 27-story, 381-unit luxury apartment development. Construction was complete in 2014, and the building was awarded Silver certification by Leadership in Energy and Environmental Design (LEED), the nation’s premier green-building rating system. Leasing has been strong to date.
In 2007 and 2008, Northwestern Mutual made a minority equity investment together with the lead private equity sponsor in Encompass, a provider of Medicare home nursing services. During the years Northwestern Mutual was an investor in Encompass, the company more than doubled profits, expanded its presence from three to 13 states and completed 33 acquisitions. When the company was sold in 2014, Northwestern Mutual realized approximately a $100 million gain.
Kensington BostonBoston, Massachusetts
Encompass Home Health & Hospice
TerrenaNorthridge, California
DIVERSIFIED INVESTING WITH A LONG-TERM VIEWWhile bond investments represent the core of the general account portfolio, Northwestern Mutual invests in diversified assets. Here are just a few examples of real estate and private equity investments to help show the diversity of the portfolio.5
5 These are examples of some of the thousands of investments made by Northwestern Mutual each year. Not all investments made by Northwestern Mutual experience similar results. Some investments may result in losses. In addition, past investment performance by Northwestern Mutual is not necessarily indicative of future investment results. No investment or investment strategy can assure a profit or protect against a loss in a declining market. For more information about Northwestern Mutual investments, see page 15.
10

THE POWER OF THE PORTFOLIO
Northwestern Mutual in 2014 provided mortgage refinancing on an 11-story, 509,000-square-foot office building located within the central business district of Washington, D.C. The building is 99 percent leased to the U.S. General Services Administration on behalf of the Federal Energy Regulatory Commission.
In 2012, Northwestern Mutual partnered with NorthPoint Holdings LLC to develop a 155,000-square-foot industrial warehouse northwest of Kansas City, Missouri. Since then, the partnership has developed three additional buildings totaling 706,000 square feet in the 260-acre business park. Leasing has been so successful to date that the partnership has agreed to begin the development of a fifth building.
In 2010 and 2011, Northwestern Mutual made a minority equity investment together with the lead private equity sponsor in ViaWest, a North American provider of data center infrastructure, cloud technology and managed IT solutions. During Northwestern Mutual’s investment period, ViaWest expanded its facilities and brought in new customers, growing the company’s profits at more than 15 percent annually. When the company was sold in 2014, Northwestern Mutual realized approximately a $25 million gain.
Capitol HillWashington, D.C.
ViaWest BellettiniBellevue, Washington
Horizons IndustrialRiverside, Missouri
Northwestern Mutual in 2014 funded a $45 million loan on Bellettini, a five-story, 145-unit independent living facility for seniors. Community amenities include fully equipped kitchens, central heat and air, fully accessible showers with grab bars, and in-unit washers and dryers. Bellettini represents one of the new property types Northwestern Mutual is exploring for future investments.
11

THE POWER OF THE PORTFOLIO
The general account yield is not the same as the various dividend scale interest rates credited to participating insurance policies or annuity contracts, nor is it a measure of a policy’s internal rate of return. Please see page 15 for additional information.
Net capital gains are realized and unrealized before taxes and deferrals of interest-related gains or losses. Not all products benefit directly in the form of dividends from capital gains or other earnings from equities and real estate.
Net Investment Income and Net Capital Gains in millions Net Net Investment Capital Income Gains
2014 $ 9,104 $ 1,674
2013 $ 8,693 $ 1,255
2012 $ 8,625 $ 1,457
2011 $ 8,439 $ 476
2010 $ 8,306 $ 1,871
2009 $ 7,772 $ 797
2008 $ 7,835 $ (6,310)
2007 $ 7,568 $ 1,009
2006 $ 7,073 $ 1,355
2005 $ 6,543 $ 1 ,117
INVESTMENT EARNINGS The portfolio’s year-by-year earnings show how our investments contribute to our overall financial strength. What matters to you is how those results help us honor our product guarantees and add to our capacity to pay dividends.
Actual dividend performance varies based on the product a policyowner owns, but our life insurance dividend payout for 2015 is expected to be more than triple what our nearest competitor will pay.6
INVESTMENT PORTFOLIO PERFORMANCEThe performance of the general account helps us deliver guaranteed product value and create the financial capacity to pay dividends.
Northwestern Mutual General Account Yield (As of December 31, 2014)
2012 2013 2014201120100%
3%
2%
1%
4%
5%
6%5.52% 5.60% 5.51% 5.02% 4.77%
PORTFOLIO YIELD Our general account yield reflects the impact of investment income and realized capital gains and losses for the period. It excludes income from policy loans and is net of investment expenses.
Over the long term, the added diversification of investments in equities and high-yield bonds makes an important contribution to the overall performance of the portfolio.
6 Northwestern Mutual analysis of total policyowner dividends based on 2014 SNL Financial data.
12

THE POWER OF THE PORTFOLIO
EFFICIENT FRONTIER
* Average annual dividend scale interest rate (DSIR) for unborrowed funds for most permanent life insurance policies with direct recognition for the years 1995-2014. The primary function of permanent life insurance is to provide a death benefit. The volatility of the DSIR does not reflect that of the underlying assets of the general account portfolio in part because determination of the DSIR in any year considers investment performance over a period of years. The DSIR is not the rate of return on a policy and is only one factor for determining the permanent life insurance dividend. The majority of our life insurance dividend payout is a result of our industry-leading persistency, favorable mortality costs and diligent expense management. Policy value is best measured by annual studies of long-term performance and not by one component of the dividend scale, such as the DSIR. For more information regarding the DSIR and our dividends, see pages 14 and 15.
Source: The market investments performance data above is based on the following investment indices: BarCap US Agg Bond TR USD, S&P 500 TR, NCREIF Property and Ibbotson US 30-Day T-Bill TR. All those points in the graph assume no taxes or transaction costs.
Northwestern Mutual’s greater allocation to real estate, private and public equities and high-yield bonds relative to other insurers is a distinguishing component of the company’s investment portfolio. (Source: SNL Financial, 2014) These investments have a higher risk level and potential for higher returns.
It may sound counterintuitive that this strategy has proven to reduce overall portfolio volatility while increasing returns over time. The reason it works can be explained by modern portfolio theory, which includes a concept known as the efficient frontier. If a portfolio consisted of 100 percent stocks, one would expect high returns but with high risk or high volatility of return. This portfolio would be far too risky for Northwestern Mutual policyowners and, probably, for most other people.
At the other end of the spectrum is a portfolio composed of 100 percent bonds. Obviously, the risk in this portfolio would be much less than that of an all-stock portfolio but could not
be expected to generate the same returns over the long term. Given the characteristics of different types of investments and how they perform relative to one another (covariance), modern portfolio theory says public, private and real estate equities can be mixed with a bond portfolio and, in the process, reduce risk while adding return.
This concept is demonstrated in the “Portfolio Performance Perspective” graph below, in which a diversified hypothetical portfolio produced a greater total return with less volatility than a portfolio 100 percent invested in bonds during the 20-year period ending in 2014.
During the same period, Northwestern Mutual’s well-diversified investment portfolio supported a dividend scale interest rate (DSIR) that was greater and less volatile than the total return on a portfolio invested in high-quality fixed income instruments only.
Portfolio Performance Perspective1995-2014
Market Investments
Northwestern Mutual’s dividend scale interest rate on its permanent life insurance products*
Inflation
0% 2% 4% 6% 8% 10% 12% 14% 16% 18% 20%0%
2%
4%
6%
8%
10%
12%
Risk/Volatility (Standard Deviation)
Aver
age
Annu
al R
etur
n/Ra
te
100%Stocks
100% Real Estate
Hypothetical
T-Bills
100% Bonds
“THE EFFICIENT FRONTIER”
80%12%8%
BondsStocksReal Estate
13

THE POWER OF THE PORTFOLIO
DIVIDENDS ANDTHE POWER OF THE PORTFOLIO
The investment earnings generated by our general account portfolio contribute to our financial success in a number of ways, including our ability to pay dividends on products.
When determining the dividends on our flagship, traditional permanent life insurance products, we consider the financial experience of the product, including the level of claims paid (mortality), expenses and the performance of the general account assets that back the product.
When actual performance in those areas is better than was assumed in pricing the products, we may choose to pay dividends.
When it comes to traditional permanent life insurance, the investment component of the dividend payout is determined by the interest rate we declare (the dividend scale interest rate, or DSIR.)
While the DSIR tracks the general account yield, it is not the same. The DSIR rate is declared by us and considers the general account portfolio performance over a period of years in order to reduce volatility in the rate. The DSIR tends to follow new money rates but lags and is less volatile. In other words, it is lower and increases less rapidly than new money rates when new money rates are rising. It is greater and declines more slowly than new money rates when new money rates are falling.
For years prior to 1982, this is the highest applicable dividend scale interest rate across all traditional permanent life insurance policies. For 1982 and later, this is the dividend scale interest rate for unborrowed funds for most traditional permanent life insurance policies with direct recognition.
14
Northwestern Mutual’s Dividend Scale Interest Rate (Past 100 Years)
0%
2%
4%
6%
8%
10%
12%
1916 1925 1935 1945 1955 1965 1975 1985 1995 2005 2015
YEAR

Scan the QR code to link to more investment information, including the 2014 Investment Report and a detailed list of investment holdings.
www.northwesternmutual.com> About Us > Financial Information > Our Investments
LOOKING FOR ADDITIONAL INFORMATION?
The company’s dividend scale interest rate for unborrowed funds for most traditional permanent life insurance policies reflects the investment performance of the applicable managed assets net of taxes and any contribution to surplus. This rate is used for the determination of the interest component of a policy’s dividend. The rate is applied to unborrowed funds for most traditional permanent life insurance policies after mortality and expense charges have been deducted from policy values. Depending on the terms of a particular policy, a different rate may be applied. For example, either a different rate is credited on borrowed funds to reflect individual policy loan activity, or all funds, both borrowed and unborrowed, are credited with a single rate that reflects the average level of borrowing for all similar policies.
Because of the mortality and expense charges, the dividend scale interest rate should not be used as a measure of the policy’s internal rate of return. The dividend scale and the underlying interest rates are reviewed annually and are subject to change. Future dividends are not guaranteed.
Decisions with respect to the determination and allocation of divisible surplus are left to the discretion and sound business judgment of the company’s Board of Trustees. There is no guaranteed specific method or formula for the determination and allocation of divisible surplus. Accordingly, the company’s approach is subject to change. Neither the existence nor the amount of a dividend is guaranteed on any policy in any given policy year. Some policies may not receive any dividends in a particular year or years even while other policies receive dividends. In its 2015 dividend scale resolution, the Board of Trustees has exercised its discretion to guarantee a minimum amount of dividends to be paid in 2015 to the policyholders as a group. If this guaranteed amount exceeds the aggregate amount of dividends actually paid to individual policyholders in 2015, that excess will be paid out in 2016 pursuant to the 2015 dividend scale resolution. The presence of a guaranteed minimum amount in the 2015 dividend scale resolution does not obligate Northwestern Mutual to declare a dividend in future years or to guarantee any portion of dividends that may be declared in future years.
The Northwestern Mutual Life Insurance Company’s operational results, investment holdings and financial position for year-end 2014 are reported in the company’s Consolidated Financial Statements (CFS). Certain types of investments have been grouped differently for this report than in the CFS. PricewaterhouseCoopers LLP is the company’s independent auditor. A copy of Northwestern Mutual’s CFS is available online at www.northwesternmutual.com or by written request to: Northwestern Mutual, Communications Department, 720 E. Wisconsin Ave., Milwaukee, WI 53202–4797.
15

One aspect of how Northwestern Mutual delivers value for our policyowners is “the power of the portfolio.” It’s our well-diversified, long-term approach to investing the company’s general account assets.
This is done with a careful eye on risk but with enough tolerance for more rewarding investments.
Look inside for more about our investment strategies and how investment results support the promises Northwestern Mutual makes.
Northwestern Mutual is the marketing name for The Northwestern Mutual Life Insurance Company, Milwaukee, WI (life and disability insurance, annuities and life insurance with long-term care benefits) and its subsidiaries.
29-4692 (0502) (REV 1015)
PROTECTION AND PERFORMANCE