the power of outdoor recreation spending in pennsylvania · table 2. total economic ... of anglers...
TRANSCRIPT

The Power of Outdoor Recreation Spending
in Pennsylvania: How hunting, fishing, and outdoor activities help support a
healthy state economy November, 2018
Prepared for the Theodore Roosevelt Conservation Partnership
by Southwick Associates
PO Box 6435 ■ Fernandina Beach, FL 32035 ■ Office (904) 277-9765

i
Table of Contents Executive Summary ......................................................................................................................... 1
Introduction .................................................................................................................................... 3
Methods .......................................................................................................................................... 4
Region of Study ....................................................................................................................... 4
Definitions ............................................................................................................................... 4
Data Overview ................................................................................................................................. 6
Fishing and Hunting Activities ................................................................................................. 6
Spending profiles ................................................................................................................ 6
Participation estimates ....................................................................................................... 6
All Other Outdoor Recreation Activities ................................................................................. 7
Secondary Data Source – Outdoor Recreation Survey ....................................................... 7
Economic Impact of Outdoor Recreation in the Delaware River Watershed ........................ 7
Results ............................................................................................................................................. 8
Total Economic Contributions of Outdoor Recreation ........................................................... 8
Statewide Results ................................................................................................................ 8
Economic Contributions to the Delaware River Watershed Region .................................. 8
The Impact of Hunting and Fishing: An In-Depth Look at Fishing and Hunting Activities 10
Other Outdoor Recreation Activities ................................................................................ 11
Appendix 1: Activities by Category ............................................................................................... 13
List of Tables Table 1. Economic Contributions of All Outdoor Recreation and Hunting & Fishing ..................... 1
Table 2. Total Economic Contribution of All Outdoor Recreation Activities .................................. 7
Table 3. Economic Contributions of All Outdoor Recreation by Residents of the Delaware River Watershed Region .................................................................................................................... 8
Table 4. 2016 Fishing and Hunting Expenditures and Participation ............................................... 9
Table 5. Total Economic Contributions of Fishing and Hunting Activities ...................................... 9
Table 6. 2016 Outdoor Recreation Participation and Expenditures ............................................. 10
Table 7. 2016 Total Economic Contributions of Other Outdoor Recreation Activities ................ 11

Page 1 | Executive Summary
Executive Summary Across Pennsylvania, millions of residents and nonresidents participated in outdoor recreation
activities, generating substantial contributions to the state’s economy. During 2016, there were
more than 390,000 jobs supported by outdoor recreation activities in Pennsylvania (Table 1).
More Pennsylvania jobs were supported by outdoor recreation than the production of durable
goods (about 356,000 jobs).1 Collectively, the economic contributions generated by outdoor
recreation in Pennsylvania accounted for almost $17 billion in salaries and wages paid to
employees and over $300 million in federal, state, and local tax revenue.
Table 1. Economic Contributions of All Outdoor Recreation and Hunting & Fishing
Economic Measure All Outdoor Recreation Hunting & Fishing
Jobs 391,813 20,470
Salaries and Wages $16,849,129 $783,377
GDP $28,144,966 $1,238,158
Total Output $46,151,950 $2,259,540
State and Local Taxes $4,084,058 $123,396
Federal Taxes $3,156,715 $182,657 *All dollar figures are reported in the thousands of dollars ($000s).
Each outdoor recreation activity affects Pennsylvania’s economy in a significant manner,
fostering jobs and wages, generating tax revenue, and contributing to the state’s GDP. These
economic contributions are all fueled by the ability of participants to find ample natural settings
within Pennsylvania where they can participate in their chosen form of recreation. For these
outdoor recreation activities to continue to be a part of Pennsylvania’s economy, adequate
conservation of natural resources is imperative.
While greater economic activity may be generated throughout Pennsylvania by other outdoor
recreation activities, conservation efforts by the state’s fish and wildlife agencies and their
partners are largely supported by hunting and fishing activities. In 2016, Pennsylvania hunters
and anglers contributed $33.5 million to fish and wildlife conservation and restoration efforts
through excise taxes on hunting and fishing equipment. Additional revenue for conservation is
generated by the sale of Pennsylvania hunting and fishing licenses, permits, and tags. These
revenues provide the foundational funding for the Pennsylvania Fish and Boat Commission and
Pennsylvania Game Commission to operate, maintain public lands, and provide public
programs, thereby opening a channel for economic contributions to flow from other types of
1 Bureau of Labor Statistics. 2016.

Page 2 | Executive Summary
recreation activities. In order for Pennsylvania’s rich tradition of outdoor recreation to
continue, hunting and fishing activities must be understood as cornerstone activities on which
many conservation efforts rest.
Introduction Hunting, fishing, and other outdoor recreation activities have played a large part in
Pennsylvania’s history. Access to lands and waterways in Pennsylvania to support these
activities is an important topic as many rural communities rely on the economic contributions
generated by these activities. Many residents and nonresidents engage in fishing, hunting, and
other outdoor recreation activities in Pennsylvania and spend significant amounts of money on
travel, equipment, and supplies to support these pursuits. Collectively, these expenditures
create positive contributions to the communities where the spending takes place. Sound
economic analyses are needed in order to understand the contributions of these outdoor
recreation activities.
This study quantifies the 2016 economic contributions associated with fishing, hunting, and
other forms of outdoor recreation within Pennsylvania by providing several key economic
measures: participant expenditures, job totals, total economic output, salaries and wages, and
contributions to the state’s gross domestic product (GDP). Furthermore, the economic
contributions made by Pennsylvania residents living within the Delaware River watershed are
highlighted in order to approximate the overall effect of outdoor recreation in the watershed.

Page 2 | Results
Methods Region of Study The economic contributions of the outdoor recreational activities analyzed here are limited to
the state of Pennsylvania. Only activities that took place in 2016 are considered in this report,
including activity and spending by residents and nonresidents. While Pennsylvania residents
likely ventured out of the state to participate in fishing, hunting, and other outdoor recreation
activities, their activity and spending are not estimated in this analysis.
Definitions In the following paragraphs we define a number of terms and concepts key to this analysis.
Participation includes the estimated number of individuals who participated in a given type of
outdoor recreation activity in Pennsylvania during 2016. These figures were estimated using
data from the National Survey of Fishing, Hunting, and Wildlife Associated Recreation (FHWAR)
made available by the U.S. Fish & Wildlife Service (USFWS). To provide greater context, we will
define the concept in more depth in the ‘Data Overview’ section.
Expenditures can be broken up into two different categories: trip expenses and durable goods
expenditures. Trip expenses include the retail spending made by participants to directly support
a trip to engage in a given type of outdoor recreation (e.g., fuel, food, lodging). Durable goods
expenditures include activity-specific equipment and accessories (e.g., firearms, decoys, fishing
rods, tackle) purchased by hunters and anglers. It also includes multi-purpose equipment that
has been allocated to specific types of activity based on the distribution of the reported days
that hunters or anglers participate in each activity (e.g., boats, tents, ATVs).
Input-output economic modelling describe how spending in one industry affects other
industries within an economy. For example, once a consumer makes a purchase, the retailer
buys more merchandise from wholesalers, who buy more from manufacturers, who, in turn,
purchase new inputs and supplies. In addition, the salaries and wages paid by these businesses
stimulate more economic activity as workers spend their incomes. Simply, the first purchase
creates numerous rounds of purchasing. Input-output analysis tracks the flow of dollars from
the consumer through all of the businesses that are affected, either directly or indirectly.
Specific to this research, dollars spent by anglers and hunters, referred to as their direct
spending, cycles through the economy generating additional spending by businesses who
provide supporting services and goods. This is known as the multiplier effect and includes
indirect contributions arising from spending by businesses supporting those who serve anglers

Page 3 | Results
and hunters as well as induced contributions generated by household spending of wages
earned by employees of directly or indirectly affected businesses. The total economic
contribution from fishing and hunting as provided in this report is the sum of the direct effects
of anglers’ and hunters’ retail spending plus the measurable effects of indirect and induced
spending.
All economic contributions in this study were estimated using a 2015 model of the Pennsylvania
economy available from IMPLAN© with inflation adjustments to reflect 2016 spending.2 Five
types of economic activity are measured and reported:
Jobs: The number of full and part-time jobs created or supported as a result of hunting, fishing,
and other outdoor recreation activities within the state;
Salaries and wages: Total payroll, including salaries, wages, and benefits paid to employees
and proprietors;
GDP: The contribution to the state or regional economy from hunting, fishing, and other
outdoor recreation activities net of spending on intermediate inputs;
Total output: The total value of all sales, including both the final purchase as well as the sale of
intermediate inputs, by businesses throughout the economy that are associated with hunting,
fishing, and other forms of outdoor recreation ; and
Tax Revenue: All local, state, and federal taxes generated as a result of the economic activity
associated with hunting, fishing, and other outdoor recreation activities within the state.
To apply direct spending for each recreational activity to the IMPLAN© model, each specific
expenditure was matched to the appropriate industry sector that received the initial purchase.
For each set of estimates, the results report economic contributions that occurred within the
state. The results do not include any economic activity or indirect contributions that flow out of
the state; because of this, it is possible that the overall effect of these activities is greater than
the state-level estimates reported.
The IMPLAN© model estimates local, state, and federal tax revenues based on the economic
activity within Pennsylvania. The summary estimates provided in this report represent the total
2 IMPLAN© is a platform that combines a set of extensive databases, economic factors, and demographic statistics with a customizable modeling system to measure economic contributions within a given area. This platform allows for an understanding of how participants’ expenditures contribute to the local, regional, and state economies.

Page 4 | Results
taxes estimated by the IMPLAN model including all income, sales, property, and other taxes and
fees that accrue to the various local, state, and federal taxing authorities.
Data Overview This report makes use of two different data sources. The economic contributions of fishing and
hunting activities were estimated for the purpose of this report from the FHWAR dataset.
Economic contributions from “other outdoor recreation activities” were taken from a 2016
report produced by Southwick Associates for the Outdoor Industry Association (OIA).3
Fishing and Hunting Activities
The economic contributions of fishing and hunting activities were calculated using estimates of
expenditures and participation derived from multiple sources, including the 2016 FHWAR, 2011
FHWAR, USFWS Historical Fishing License Data, and USFWS Historical Hunting License Data.
Spending profiles
Unlike past surveys, the 2016 FHWAR survey did not contain adequate detailed data at the
state level to provide reliable estimates.4 Instead, state-level estimates were produced by
adjusting the national and regional estimates based on how the state’s expenditures related to
the national or regional average in the 2011 FHWAR.5 This approach assumes that these
proportions have remained constant since 2011. Using this assumption, we estimated the
average trip expenditures and durable good expenditures for each type of recreation within the
state of Pennsylvania.
For example, in 2011, spending per trip to participate in fishing in Pennsylvania was
approximately 36% of the regional (Northeast Region) average according to the 2011 FHWAR.
This proportion (36%) was then used to scale the 2016 regional average to estimate state-level
expenditures for fishing in Pennsylvania in 2016.
3 This report can be accessed here: https://outdoorindustry.org/wp-content/uploads/2017/04/OIA_ RecEconomy_FINAL_Single.pdf 4 The 2016 National Survey of Hunting, Fishing, and Wildlife-Associated Recreation contained insufficient sample size to generate state-level estimates of hunting and angling expenditures and participation for many states, including Pennsylvania. 5 Due to insufficient sample size in the New England and Middle-Atlantic census divisions used to calculate the Northeast Region average, the national average expenditures were utilized for hunting. Expenditures for fishing made use of the average expenditures at the regional level.

Page 5 | Results
Participation estimates
The 2011 estimates of the number of participants in Pennsylvania were adjusted based on the
observed patterns of certified fishing and hunting license sales from the U.S. Fish and Wildlife
Service (USFWS). The proportional change in license sales from 2011 to 2016 is applied to the
2011 estimates of participation reported in the 2011 FHWAR. For example, USFWS reported an
increase in Pennsylvania’s certified fishing license sales of 14.36% from 2011 to 2016. This
scalar is applied to the 2011 estimate of total PA anglers (1,101,173) to arrive at the estimated
2016 PA anglers (1,259,274).
All Other Outdoor Recreation Activities
Secondary Data Source – Outdoor Recreation Survey
Estimates of the economic contributions of trail sports, biking, camping, snow sports, water
sports, wildlife watching, motorcycle riding, and off roading were gathered from a 2016 report
for the Outdoor Industry Association (OIA) by Southwick Associates.
Economic Impact of Outdoor Recreation in the Delaware River Watershed
This study is also interested in showing the economic impact of outdoor recreation on the
Delaware River watershed. The limited data availability at this smaller geographic scale
required Southwick Associates to define the scope of study differently for these estimates. The
existing OIA data do not indicate the places in Pennsylvania where people participated in
outdoor recreation and a survey to elicit that information was beyond the scope of this study.
The OIA Congressional District level results include only statewide spending on outdoor
recreation by residents of Pennsylvania based on where participants live and not on where the
activity takes place. The CD-level estimates do not include participation or spending by non-
residents of Pennsylvania.6 Because of this, the effort of outdoor recreation activities are higher
than the CD-level estimates show.
6 Because of this, the total estimate of economic contributions to all congressional districts will equal an amount less than the total economic contributions to the state of Pennsylvania. The difference between the two sums equals the economic contributions made by nonresidents.

Page 6 | Results
Results Total Economic Contributions of Outdoor Recreation
All of the results presented in this sub-section include results from OIA which account for hunting, fishing, and other outdoor recreation activities.7
Statewide Results In 2016, outdoor recreation activities attracted millions of participants to Pennsylvania whose expenditures collectively supported over 390,000 jobs providing almost $17 billion in salaries and wages. More jobs within Pennsylvania were supported by outdoor recreation than the production of all durable goods (381,103 jobs).8 Altogether, outdoor recreation accounted for 4.3% of Pennsylvania’s GDP during 2016.9 The table below (Table 2) describes the 2016 economic contributions to Pennsylvania’s economy made by residents and nonresidents participating in fishing, hunting, and other outdoor recreation activities, including trail sports, biking, camping, snow sports, water sports, wildlife watching, motorcycle riding, and off-roading.10
Table 2. Total Economic Contribution of All Outdoor Recreation Activities
Economic Measure Economic Contribution
Jobs 391,813 Salaries and Wages $16,849,129
GDP $28,144,966 Total Output $46,151,950 State and Local Taxes $4,084,058 Federal Taxes $3,156,715 *All dollar figures are reported in the thousands of dollars ($000s).
Economic Contributions to the Delaware River Watershed Region Forms of outdoor recreation such as fishing, hunting, boating, and camping are immensely
popular among residents of the Delaware River Watershed, and the economic contributions of
outdoor recreation by residents of the Delaware River Watershed are greater than those who
live elsewhere in the state. Outdoor recreation by residents of the Delaware River Watershed
7 While the OIA report used updated fishing and hunting data from the 2011 FHWAR to account for 2016 participation and expenditures, those results are slightly different from the results of this analysis. All fishing and hunting results in the Statewide Results sub-section are taken directly from OIA results, while the Detailed Activity Results section presents the results of the analysis carried out specifically for the purpose of this report. 8 Includes wood product manufacturing, primary metal manufacturing, fabricated metal product manufacturing, and more. Bureau of Economic Analysis. 2016. 9 Bureau of Economic Analysis. 2016. 10 A full list of other outdoor recreation activities by category can be found in Appendix 1.
Page 7 | Results
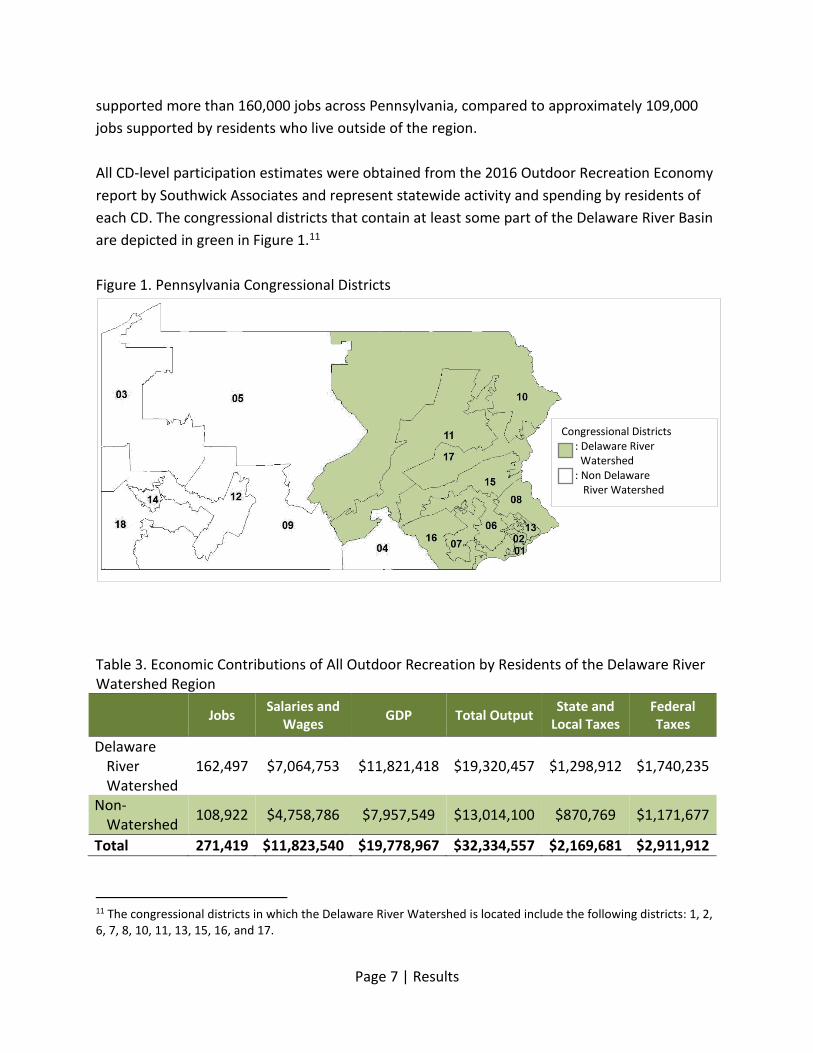
supported more than 160,000 jobs across Pennsylvania, compared to approximately 109,000
jobs supported by residents who live outside of the region.
All CD-level participation estimates were obtained from the 2016 Outdoor Recreation Economy
report by Southwick Associates and represent statewide activity and spending by residents of
each CD. The congressional districts that contain at least some part of the Delaware River Basin
are depicted in green in Figure 1.11
Figure 1. Pennsylvania Congressional Districts
Table 3. Economic Contributions of All Outdoor Recreation by Residents of the Delaware River Watershed Region
Jobs
Salaries and Wages
GDP Total Output State and
Local Taxes Federal Taxes
Delaware River Watershed
162,497 $7,064,753 $11,821,418 $19,320,457 $1,298,912 $1,740,235
Non-Watershed
108,922 $4,758,786 $7,957,549 $13,014,100 $870,769 $1,171,677
Total 271,419 $11,823,540 $19,778,967 $32,334,557 $2,169,681 $2,911,912
11 The congressional districts in which the Delaware River Watershed is located include the following districts: 1, 2, 6, 7, 8, 10, 11, 13, 15, 16, and 17.
Congressional Districts : Delaware River Watershed : Non Delaware River Watershed
Page 8 | Results
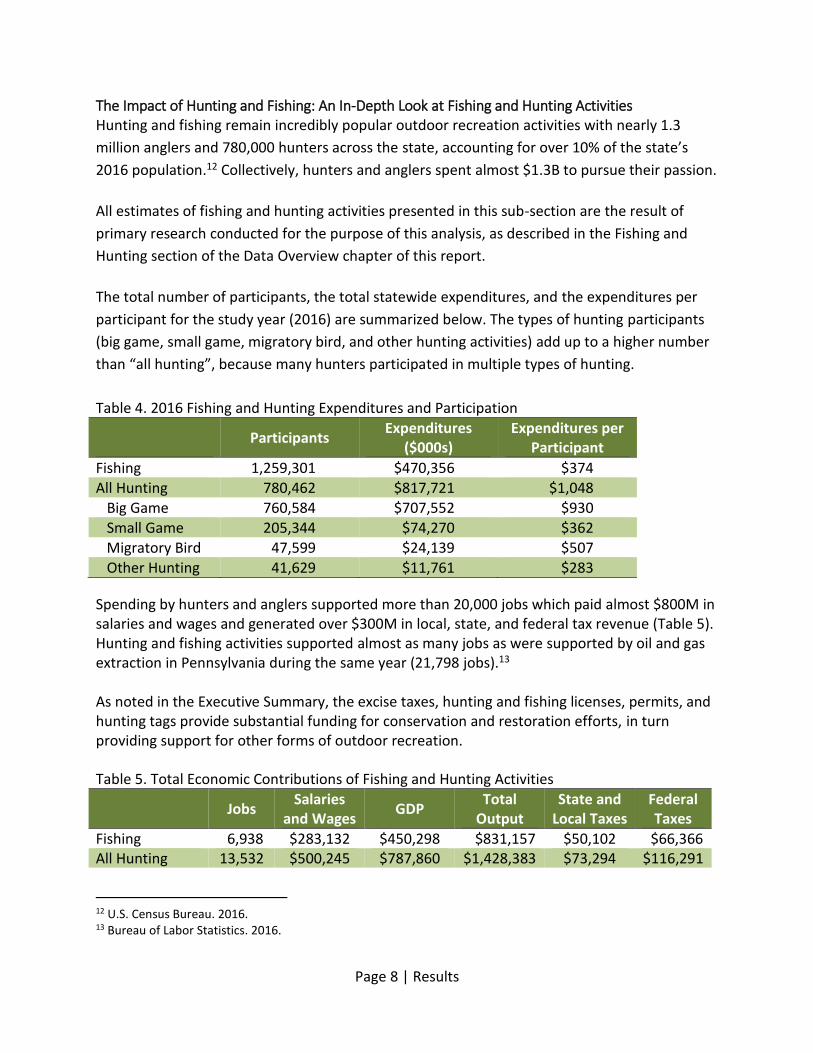
The Impact of Hunting and Fishing: An In-Depth Look at Fishing and Hunting Activities Hunting and fishing remain incredibly popular outdoor recreation activities with nearly 1.3
million anglers and 780,000 hunters across the state, accounting for over 10% of the state’s
2016 population.12 Collectively, hunters and anglers spent almost $1.3B to pursue their passion.
All estimates of fishing and hunting activities presented in this sub-section are the result of
primary research conducted for the purpose of this analysis, as described in the Fishing and
Hunting section of the Data Overview chapter of this report.
The total number of participants, the total statewide expenditures, and the expenditures per
participant for the study year (2016) are summarized below. The types of hunting participants
(big game, small game, migratory bird, and other hunting activities) add up to a higher number
than “all hunting”, because many hunters participated in multiple types of hunting.
Table 4. 2016 Fishing and Hunting Expenditures and Participation
Participants
Expenditures ($000s)
Expenditures per Participant
Fishing 1,259,301 $470,356 $374 All Hunting 780,462 $817,721 $1,048 Big Game 760,584 $707,552 $930 Small Game 205,344 $74,270 $362 Migratory Bird 47,599 $24,139 $507
Other Hunting 41,629 $11,761 $283
Spending by hunters and anglers supported more than 20,000 jobs which paid almost $800M in salaries and wages and generated over $300M in local, state, and federal tax revenue (Table 5). Hunting and fishing activities supported almost as many jobs as were supported by oil and gas extraction in Pennsylvania during the same year (21,798 jobs).13 As noted in the Executive Summary, the excise taxes, hunting and fishing licenses, permits, and hunting tags provide substantial funding for conservation and restoration efforts, in turn providing support for other forms of outdoor recreation.
Table 5. Total Economic Contributions of Fishing and Hunting Activities
Jobs Salaries
and Wages GDP
Total Output
State and Local Taxes
Federal Taxes
Fishing 6,938 $283,132 $450,298 $831,157 $50,102 $66,366 All Hunting 13,532 $500,245 $787,860 $1,428,383 $73,294 $116,291
12 U.S. Census Bureau. 2016. 13 Bureau of Labor Statistics. 2016.

Page 9 | Results
Big Game 11,667 $434,249 $678,677 $1,239,574 $62,948 $100,504 Small Game 1,140 $41,821 $72,623 $125,436 $6,834 $10,262 Migratory Bird 411 $15,289 $23,600 $42,592 $2,399 $3,522 Other Hunting 314 $8,886 $12,960 $20,781 $1,113 $2,003
Total 20,470 $783,377 $1,238,158 $2,259,540 $123,396 $182,657 *All dollar figures are reported in the thousands of dollars ($000s).
Other Outdoor Recreation Activities Millions of individuals participated in outdoor recreation in Pennsylvania during 2016, with
camping (3.1 million), trail sports (2.5 million) and water sports (2.4 million) being some of the
most popular activities (Table 6). While fewer participants engaged in snow sports than any
other type of activity, the average expenditures per participant were greatest for this activity
($3,854 per participant).
Estimates of the economic contributions of other outdoor recreation activities were generated
by Southwick Associates as a part of a 2016 study for the Outdoor Industry Association. The
following activity categories represent 2016 participation and expenditures.
Table 6. 2016 Outdoor Recreation Participation and Expenditures
Participants Expenditures
($000s) Expenditures per
Participant
Biking 1,846,403 $2,835,265 $1,536
Camping 3,109,934 $6,541,305 $2,103
Motorcycle Riding 1,393,068 $2,548,985 $1,830
Off Roading 1,482,920 $1,621,989 $1,094
Snow sports 796,928 $3,071,326 $3,854
Trail sports 2,530,120 $6,513,627 $2,574
Water sports 2,369,249 $3,881,957 $1,638
Wildlife Watching 1,179,645 $655,016 $555
In 2016, there were more than 370,000 jobs in Pennsylvania supported by resident and
nonresident outdoor recreation activities, not including hunting and fishing. These jobs paid
more than $16 billion in salaries and wages and generated almost $7 billion in tax revenue at
the local, state, or federal level. The total value of economic contributions to the state’s GDP
made by these outdoor recreation activities ($26.9 billion) is greater than the value of GDP
contributed by all construction activities14 in the state during the same year ($24.7 billion).15
14 Includes the construction of buildings, heavy and civil engineering construction, and specialty trade contractors. 15 Bureau of Labor Statistics. 2016.

Page 10 | Results
Table 7. 2016 Total Economic Contributions of Other Outdoor Recreation Activities
Jobs Salaries and
Wages GDP
Total Output
State and Local Taxes
Federal Taxes
Biking 38,320 $1,610,439 $2,715,825 $4,493,593 $398,211 $296,254
Camping 89,547 $3,819,926 $6,399,199 $10,447,556 $941,941 $709,274
Motorcycle Riding
30,939 $1,444,238 $2,420,609 $4,021,665 $356,105 $247,035
Off Roading 19,778 $955,489 $1,582,262 $2,581,398 $234,041 $164,442
Snow sports 44,706 $1,886,863 $3,149,335 $5,009,472 $465,236 $368,429
Trail sports 87,868 $3,729,601 $6,283,387 $10,273,479 $922,068 $704,831
Water sports
52,218 $2,283,364 $3,808,953 $6,177,019 $561,468 $424,831
Wildlife Watching
8,020 $336,910 $548,624 $889,369 $81,779 $59,174
Total 371,396 $16,066,830 $26,908,194 $43,893,551 $3,960,849 $2,974,270 *All dollar figures are reported in the thousands of dollars ($000s).

Page 11 | Appendix
Appendix 1: Activities by Category The following activities are included in the activity categories detailed in the OIA report.
Camping: RV-ing, camping in a tent/lodge
Fishing: fishing
Hunting: hunting
Motorcycle Riding: motorcycle riding off-road, motorcycle riding on a road
Off Roading: driving off-road trucks/jeeps, riding ATVs, riding dune/swamp buggies, riding ROVs
Snow Sports: snowmobiling, downhill skiing, snowboarding, Telemark skiing, cross-
country/Nordic skiing, snowshoeing
Trail Sports: day hiking, horseback riding, backpacking, mountaineering, rock or ice climbing,
trail/road running
Water Sports: cruising/sightseeing in a power boat, knee boarding, tubing, wakeboarding,
waterskiing, canoeing, kayaking, rafting, stand-up paddle boarding, surfing, sailing, scuba
Wheel Sports: bicycling off road, bicycling on a paved road, skateboarding
Wildlife Watching: wildlife viewing