the power of moving averages in financial markets by: michael viscuso
TRANSCRIPT

The Power of Moving Averages in Financial Markets
By: Michael Viscuso
Recall… A Moving Average is the average of the
past n days prices. A buy point is signaled when today’s
price is above its moving average and yesterday’s price is below its moving average.
A sell point is signaled when today’s price is below its moving average and yesterday’s price was above its moving average
Recall…. (cont.)
We are looking for the best n – the look-back period of the moving average
Small n’s are more responsive to daily changes
Large n’s are less responsive to daily changes
Pros and cons to both

Example of Moving Average for small n. (n=6)
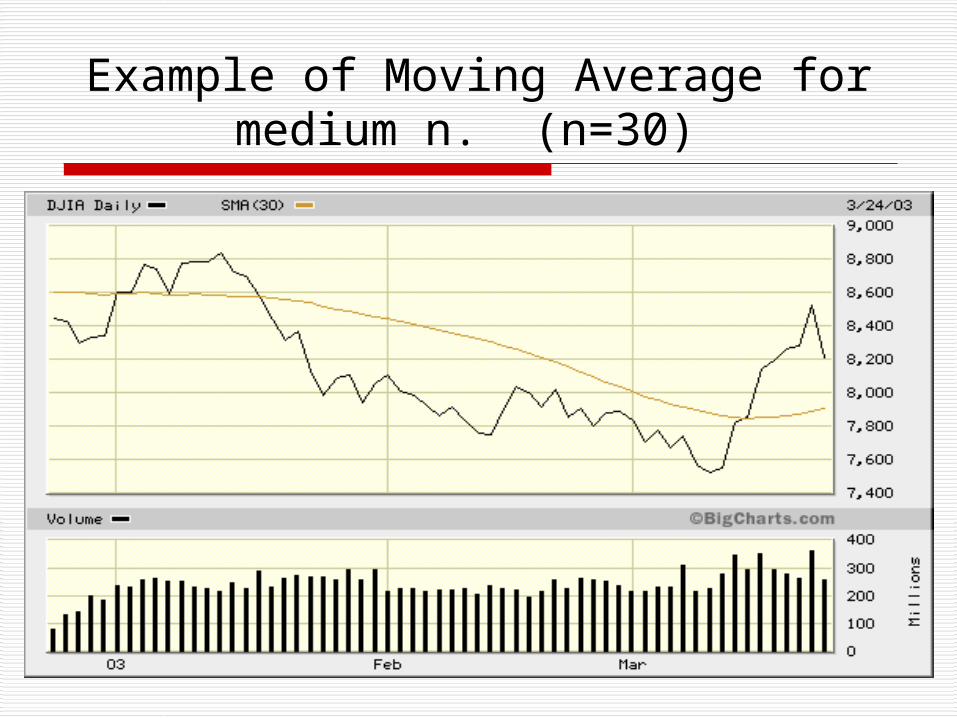
Example of Moving Average for medium n. (n=30)

Choosing the best n Choose which n’s you are going to
test Start with the first 12 months and see
which n did best over that time period; record it
Calculate best n for month 13 record the pair
Continue for all months in the data set
Interpreting results
Chi-squared test Null Hypothesis: No correlation
between best n for past year and best n for next month
Alternative Hypothesis: There is a correlation between best n for past year and best n for next month

Observed Results
Year
5 10 15 20 Totals
5 85 30 11 32 158
Month 10 59 21 12 14 106
15 27 10 4 10 51
20 27 16 0 14 57
Totals 198 77 27 70 372

Interpretation
Using the Chi-Squared formula we obtain a test statistic of 11.838
Given 9 degrees of freedom this test statistic returns a p-value > alpha = .05 so we do not have enough evidence to reject the Null Hypothesis. Therefore, no correlation.

Where to go from here??
Suggestions? Look back

Example of Moving Average for small n. (n=6)

Introduction to Stops
Set a price x percent away from the buy/sell price and if at some future date the price exceeds this stop then sell/buy back
Regular Stops Trailing Stops Full Stops Partial Stops

Picking your stop
One problem has now become two Pick best n Pick best stops
Also, different method of solving Chi-squared cannot be used because
expected counts would be too low

Best Attempt Find best combination since (inception
minus a few years) and then test that combination on the years you left out
No worries of expected counts so use as many MAs and %s as you want
List of MAs: 3, 4, 5, 6, 7, 8, 9, 10, 12, 14, 16, 18, 20, 25, 30, 40, 50
List of %s (top and bottom): 0.0, 0.5, 1.0, 1.5, 2.0, 2.5, 3.0, 3.5, 4.0, 4.5, 5.0

Results of Long Side Trading
Best MA: 3 Bottom Percent: 0.5% Top Percent: 1.0% Percent Correct: 50.157% MA %APR from 1970-1998: 9.26% DJIA %APR from 1970-1998: 8.48%

Results of Short Side Trading Best MA: 3 Bottom Percent: 0.0% Top Percent: 0.0% Percent Correct: 56.326% MA %APR from 1970-1998: 4.95% DJIA %APR from 1970-1998: 8.48% Both Long and Short Side trading together
%APR from 1970-1998: 7.66%

Now use these parameters…
Long Side MA %APR from 1998-2003: 5.22%
Short Side MA %APR from 1998-2003: 6.82%
Long and Short Side MA %APR from 1998-2003: 6.03%
DJIA %APR from 1998-2003: 1.07%
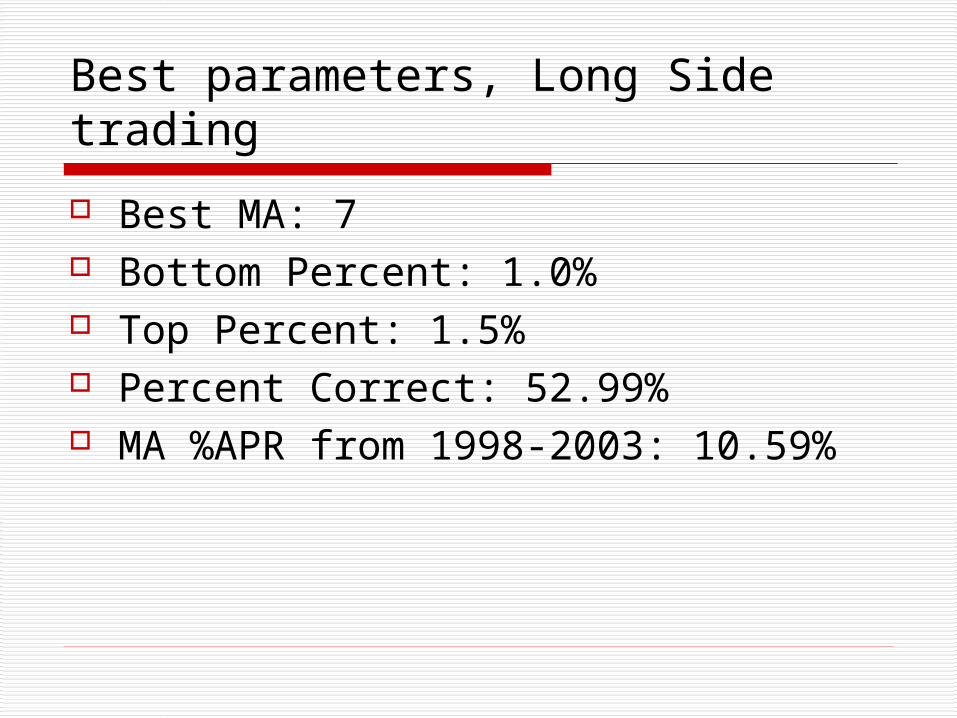
Best parameters, Long Side trading
Best MA: 7 Bottom Percent: 1.0% Top Percent: 1.5% Percent Correct: 52.99% MA %APR from 1998-2003: 10.59%
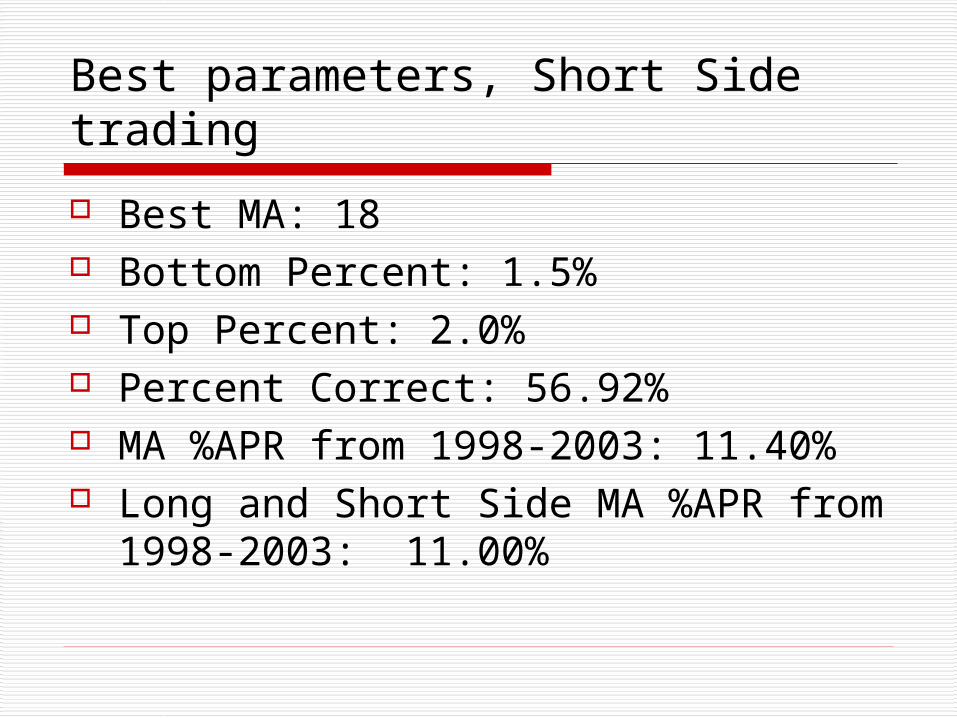
Best parameters, Short Side trading
Best MA: 18 Bottom Percent: 1.5% Top Percent: 2.0% Percent Correct: 56.92% MA %APR from 1998-2003: 11.40% Long and Short Side MA %APR from
1998-2003: 11.00%

Leveraging
Using indicators means you are picking and choosing when to be in or out of the market
Therefore, when you are in you have to make it account for all the times you’re out.
Options are one type of leveraging

Options
Option pricing is difficult because it is dependent upon six factors, only one of which is price
No source of test data Approximate the amount of
leveraging by buying/selling four times as much as your money allows.

The Option Effect
Long Side MA %APR from 1998-2003: 14.14%
Short Side MA %APR from 1998-2003: 24.57%
Long and Short Side MA %APR from 1998-2003: 19.81%
DJIA %APR from 1998-2003: 1.07%

Greedy Perhaps?
19.81% using the best of the past 28 years vs. 43.06% if you had used the best parameters of the current five years
How do we refine the system to capture more recent advances in other parameters?

First Attempt
Use the best parameters of last year for current year
Result: 20.06% vs. 19.81% Occurred by Chance?....maybe Also, the percent correct dropped
drastically from 50% to 20% … not good

Second Attempt
Use the best parameters from the past 3 years, 5 years, and 10 years
Results: 3 years: 13.05% 5 years: 7.90% 10 years: 12.74% Random … not random?

Summary of Results
Back Data: As much as possible: 19.81% 10 years: 12.74% 5 years: 7.90% 3 years: 13.05% 1 year: 20.06% 1 month: 0.49%
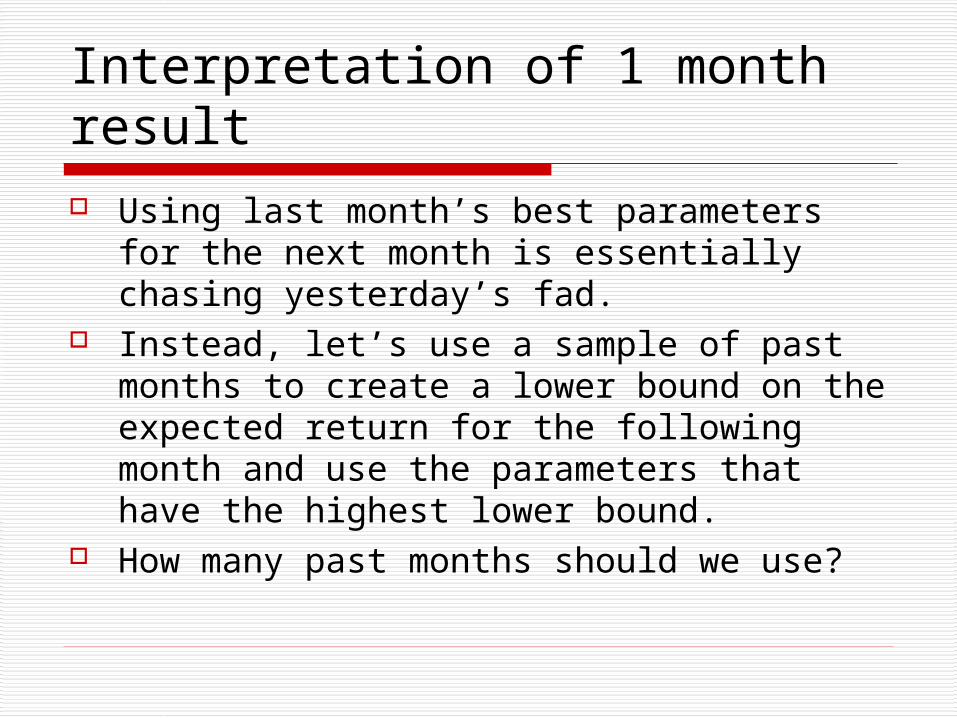
Interpretation of 1 month result Using last month’s best parameters for the
next month is essentially chasing yesterday’s fad.
Instead, let’s use a sample of past months to create a lower bound on the expected return for the following month and use the parameters that have the highest lower bound.
How many past months should we use?
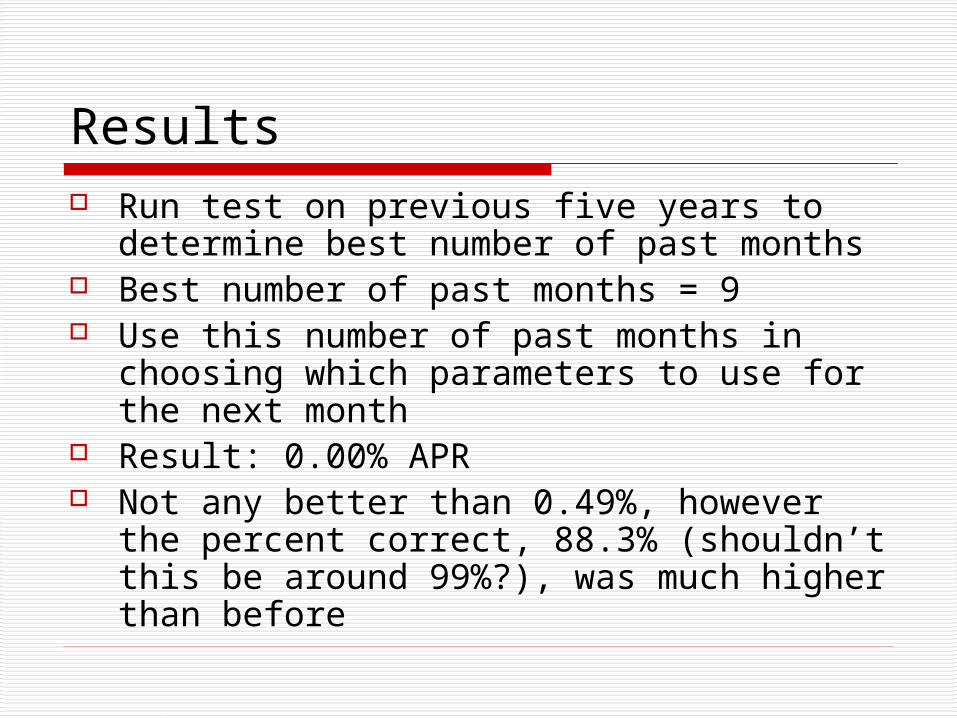
Results Run test on previous five years to
determine best number of past months Best number of past months = 9 Use this number of past months in choosing
which parameters to use for the next month Result: 0.00% APR Not any better than 0.49%, however the
percent correct, 88.3% (shouldn’t this be around 99%?), was much higher than before
Conclusions Can we conclude anything? How well was the moving average able to
predict buy/sell points? By itself… Using stops
Where was chaotic behavior exhibited? Moving Average predictions? Market? System? All or none of the above?

Conclusions (cont.)
What amount of Back Data would you use? ... Why?
How much of the results are dependent not upon how much Back Data but the characteristics of that Back Data
How likely is a programming error?

Questions??