the potential of fair-trade and organic labels for ... · the potential of fair-trade and organic...
TRANSCRIPT

1
The Potential of Fair-trade and Organic Labels for Chocolate:
Good News and Bad News
Sandra Rousseau
HUBrussel & KU Leuven
Abstract
To reach the maximal potential of labels as an environmental and social policy instrument a number of assumptions need to be met. Firstly, consumers need to identify and recognize the environmental and social labels, and secondly, they also need to find the environmental quality information reliable and trustworthy. Thirdly, goods with a higher environmental quality should be more desirable than goods with a lower environmental quality. Fourthly, consumers need to have a positive marginal willingness to pay for environment-friendly goods. In order to test these conditions in practice, we performed a survey including a choice experiment of consumer decisions concerning the purchase of chocolate in Flanders (Belgium), focusing on fair-trade labels and organic labels. Overall, we find that the conditions are much better fulfilled for fair-trade labels than for organic labels in the market of chocolate in Flanders. On average, respondents even have a negative willingness to pay for labeled organic chocolate. Thus the market potential for fair-trade chocolate seems to be higher than for organic chocolate.
Keywords: Labeling, chocolate, fair-trade, organic farming, stated choice experiment JEL codes: D12 - Consumer Economics: Empirical Analysis; Q18 - Agricultural Policy; Food Policy; Q13 - Agricultural Markets and Marketing; Cooperatives; Agribusiness; Q5 - Environmental Economics
2
I. Introduction
Consumers are increasingly interested in environmental and social criteria when choosing products such as food (e.g. Hughner et al., 2007, Tagbata & Sirieix, 2008; Rousseau & Vranken, 2013). Labeling programs can then act as a mechanism for the private provision of public goods (Aldanondo-Ochoa & Almansa-Saez, 2009). The labels indicate environment-friendly and socially beneficial production methods to consumers and thus create a market for a public good such as environmental quality, sustainability or fair trade, or, more exactly, a market for goods with both public and private characteristics (Cornes & Sandler, 1984). The increasing popularity of labels presumably follows from the benefits perceived by both producers and consumers. On the one hand, producers use labels to legitimate their business practices, to protect them from (additional) public regulation or to help them to gain competitive advantages (see, e.g., Kollman & Prakash, 2001; Schumacher, 2010). On the other hand, labeling should help consumers by reducing uncertainty about the environmental, sustainable and social performance of products. Labeling should thus enable consumers to choose products and services that are socially desirable (see, e.g., Pedersen & Neergaard, 2006; Schumacher, 2010).
However, in order to reach the maximal potential of labels as an environmental policy instrument a number of quite stringent conditions need to be met (see, for instance, Amacher et al., 2004). Consumers should be able to perfectly identify the environmental and social labels associated with a particular good or service. Moreover, consumers should find the environmental quality information trustworthy. Also, goods with a higher environmental quality need to more desirable than goods with a lower environmental quality for at least a subset of consumers. Finally, consumers should have a positive marginal willingness to pay for environment-friendly and socially desirable goods.
Past studies have casts doubts on the plausibility of one or more of these assumptions. It is often observed that general environmental awareness does not necessarily lead to a specific behavior (see, e.g., Young et al, 2010). Evidence of this attitude-behavior gap is given by Hughner et al. (2007), who show that, despite the generally favorable attitudes that consumers hold for organic food (between 46 and 67% of the population), actual purchase behavior forms only 4 to 10% of different product ranges. Some consumers are only green when it comes to certain products (see, e.g., Peattie, 1992, 2001). For instance, some consumers only buy green when they buy things for their children (Peattie, 1992). Moreover consumers often regard environmentally friendly products as expensive and technically inferior (see, e.g., Bhate, 2002; Peattie, 2001). Also, some consumers might have a thorough knowledge of and preference towards some labels but not towards others, e.g. they intentionally buy paper products with an FSC label, but they do not recognize organic labels on food products. Some consumers are green without knowing it. For instance, Pedersen and Neergaard (2006) concluded that more than half of the consumers buy labeled textiles the products without recognizing the labels. Green consumers might also be manipulated into buying products that are not green, because they are unaware of the actual

3
content of a label and its verification. For instance, Cason and Gangadharan (2002) found that one-third of all green advertising claims are vague and/or misleading. Finally, green consumers tend to be green only when they trust the manufacturer and/or the label. According to Peattie (2001), 90% of UK consumers had a skeptical attitude towards green promotional campaigns.
In order to test the conditions needed to have successful labeling schemes in practice, we performed a survey of consumers’ decision making including a stated choice experiment concerning the purchase of chocolate in Flanders (Belgium). For the empirical analysis, we selected chocolate since it is a product that is well-known and frequently bought by consumers in Flanders, and the novelty bias when making choices in hypothetical markets should therefore for be minimal (List & Shogren, 1999). The environmental impact of chocolate is related to different stages in the production process including cocoa production, industrial processing of cocoa beans, the chocolate production process and transportation. Furthermore, several different labeling schemes with differing objectives are available for chocolate and its main ingredient, i.e. cocoa. This allows us investigate attitudes towards two different types of labels: namely, fair-trade labels and organic labels.
Previously, consumers’ willingness to pay a price premium for organic and fair-trade dark chocolate compared to unlabeled dark chocolate has been measured using an lab experiment combined with tasting by Tagbata and Sirieix (2008). This study found that consumers are willing to pay an almost identical price for organic chocolate as for fair-trade chocolate (1.25 euro versus 1.31 euro), while consumers were willing to pay 0.7 euro for a standard chocolate bar on average. Moreover, Tagbata and Sirieix (2008) found that consumers’ willingness to pay (WTP) for organic and fair-trade chocolate was less than the sum of the WTP for organic and the WTP for fair-trade chocolate separately. Finally, they observed that some consumers even preferred organic chocolate to organic and fair-trade chocolate. Thus to some consumers a single message seemed to be preferable to a multiple message (Poelman et al., 2008).
In our study, we found that the price premium respondents are willing to pay for a chocolate tablet with a fair-trade label is 2.04 euro on average, while the price premium for a chocolate tablet with an organic label is -0.37 euro on average. The result that respondents require a discount for an environment-friendly good is surprising. Overall, we find that the conditions are much better fulfilled for fair-trade labels than for organic labels in the market of chocolate in Flanders and that the market potential for fair-trade chocolate seems to be higher than for organic chocolate. The consumption of chocolate seems to be dominated taste and price, with aspects such as fair trade or environmental impact play only a minor role.
In the next section we provide some background on labeling schemes for cocoa (and chocolate). In section 3 we discuss a simple theoretical model predicting the demand for labeled products and we describe the technique of choice experiments used to estimate the importance of different chocolate characteristics in consumers’ purchasing decisions. Next, in section 4, we discuss the

4
dataset we collected. In section 5 we present the results and confront them with the conditions needed to reach the full potential of labels. These results and their implications are discussed in section 6 and some conclusions are formulated in section 7.
II. Background
One of the main ingredients of chocolate is cocoa. The world cocoa production was estimated at 4.3 million tons in 2010, of which approximately 275000 tons (6%) were certified (KPMG, 2012). The four main labeling schemes for cocoa are Fairtrade, UTZ Certified, Rainforest Alliance, and the Organic label. The focus of those schemes and their relative importance are described in Table 1. In this paper we concentrate on two of those labeling schemes, namely those dealing with fair trade and those dealing with organic agriculture. Obviously, certification leads to additional costs for producers. Besides certification fees paid by the producer, inputs might also be more expensive. For instance, the Fairtrade foundation states on its website “If a chocolate bar uses 500 tonnes of cocoa, then they must purchase 500 tonnes of cocoa on Fairtrade terms, including the payment of an additional $200 Fairtrade premium per tonne.”
Focus of labeling scheme Volume of certified cocoa in 2010
2010 share of certified cocoa
Fairtrade Promote better trading conditions and
empower producers
106 400 tons 39%
UTZ
Certified
Professionalize agricultural practices
and operational management
70 000 tons 25%
Rainforest
Alliance
Biodiversity conservation and
sustainable livelihoods of farmers
56 000 tons 20%
Organic
label
Focus on production in a sustainable
way, without the use of chemical inputs
42 500 tons 15%
Table 1: Certification schemes for cocoa (KPMG, 2012)
Looking at the environmental impact of chocolate, we can distinguish several stages including cocoa production, industrial processing of cocoa beans, the chocolate production process and transportation. Based on a life cycle analysis of cocoa production and processing in Ghana (Ntiamoah & Afrane, 2008), we observe that a significant environmental impact results from the use of fertilizers and pesticides during cocoa production. Moreover, cocoa production contributes to a substantial loss of biodiversity since the expansion of cocoa production has occurred at the expense of forestland (Rice & Greenberg, 2000). However, the impact of cacao cultivation on biodiversity can be minimized by improved shade management as was shown by Rice and Greenberg (2000). Furthermore, in the cocoa processing stage the use of fossil fuels in boilers and roasters are the main cause of environmental impacts (Ntiamoah & Afrance, 2008). Finally,

5
environmental concerns during the chocolate production stage arise from energy use, water use, packaging waste and transportation.
III. Methodology
First we present a simple model to derive the demand for labeled products. Next we describe the technique of stated choice experiments and discuss the questionnaire design.
3.1 Labeling as a policy instrument
Following Amacher et al. (2000), we assume that consumers have the following utility function:
� = ��� − ��
with sk the environmental quality, pk the price of a good of quality k and the term θ representing the consumer’s taste parameter. There are two qualities of goods, k=G (green good, i.e. high environmental quality) and k=B (brown good, i.e. low environmental quality). The variable θ can then be interpreted as each consumer’s marginal willingness to pay for environmental quality. Assuming that θ is uniformly distributed on the interval �� , ���, that each consumer purchases one unit of the goods and that the market is fully covered1, allows us to define the demands for green and brown goods by � = �� − �� and by � = �� − � respectively. The threshold parameter �� ≡
�����
����� represents the taste parameter of the consumer indifferent between the
green and the brown good.
This simple demand model is based on a number of stringent assumptions. It is assumed that consumers can perfectly observe the environmental quality of the good; i.e. sk is perfectly observable by all consumers. This implies, firstly, that consumers can perfectly identify and recognize the environmental and social labels and also, secondly, that consumers find the environmental quality information reliable and trustworthy. Thirdly, goods with a higher environmental quality are more desirable than goods with a lower environmental quality. Fourthly, consumers should know their taste preferences, i.e. the marginal willingness to pay for environmental quality should be known and positive. In conclusion, the role of labels is to help product differentiation, to give reliable information and to reduce informational asymmetries.
3.2 Stated choice experiments
In this section we describe the technique of choice experiments used to estimate the importance of different chocolate characteristics in consumers’ purchasing decisions. Next we discuss the design of the questionnaire.
1 Under full market coverage, production does not change while quality might change.

6
3.2.1 Choice experiments
A discrete choice experiment is a quantitative technique used for eliciting individual preferences. It is a stated preference technique that is especially suited to deal with multidimensional choices such as the one we study here, namely chocolate purchasing decisions. It allows researchers to uncover how individuals value selected attributes of a product or service by asking them to state their choice over different hypothetical alternatives (Mangham et al., 2009). It can be implemented by using surveys in which respondents state their preferences or by using actual experiments in which respondents have to buy actual products.
The choice experiment method was initially developed by Louviere and Hensher (1982) and Louviere and Woodworth (1983). This method models preferences for goods, where goods are described in terms of their attributes and the levels that these take (Hanley et al., 2001). Respondents are presented with alternative varieties of a particular good, differentiated by their attributes and levels, and asked to select their most preferred variety. A baseline alternative, corresponding to the status quo or opt-out situation is included in each choice set in order to be able to interpret the results in standard welfare economic terms. Typically, choice experiments are used to recover the willingness to pay for each attribute from peoples’ choices by including price or cost as one of the attributes of the good. However, in a recent study (Rousseau & Rousseau, 2012), the waiting period before a final decision is received after a manuscript was submitted to a journal was used as one of the attributes to describe a journal and thus the willingness to wait for journal attributes from researchers’ choices could be estimated.
The analysis of respondents’ choices is based on random utility theory. Thus the overall utility generated by an individual’s choice is assumed to depend on the utilities associated with its composing attributes and attribute levels. It states that a respondent’s utility function consists of a deterministic, observable component and a random, unobservable component εi (Christie et al., 2004). Further, the usual starting point is to assume that the utility Ui derived by an individual of choosing alternative i can be approximated by a linear utility function of the form (Amaya-Amaya et al., 2008; Day et al., 2012):
'i i i iU ASC Xβ ε= + +
where �� represents an M-dimensional vector of attribute levels for alternative i, where β is an M-dimensional vector of coefficients capturing generic marginal (dis)utilities of attributes and where ASCi captures the main effect of the unobserved factors in the error terms for each of the alternatives. The assumption of a utility function that is linear in its parameters is, by the way, not very restrictive since it allows for any non-linear transformation of the variables xi.
In our study we use a survey-based approach and the choice set C comprises three chocolate varieties: variety A, variety B and the opt-out option. Choosing one alternative over the others implies that the utility of the chosen alternative exceeds the utility associated with the other

7
alternatives. Thus the probability of a respondent choosing chocolate variety i from a particular choice set C can be expressed as:
' '
Pr Pr ,
Pr
i j
i i i j j j
i C U U j i C
ASC X ASC Xβ ε β ε
= > ∀ ≠ ∈
= + + > + +
In the setting of choice experiments with three alternatives in a choice set and using that random terms are independently and identically distributed with an extreme value distribution, the choice probabilities have a convenient closed-form solution. Then the marginal willingness to pay (WTP) for a particular change in one specific attribute can be estimated as a ratio of coefficients:
attribute
M
WTPβ
β= −
For more information on the mathematical and statistical details of this method, we refer the reader to Alberini et al. (2006) and Amaya-Amaya et al. (2008).
Data obtained from a choice experiment are often estimated by conditional logit (CL) models. The CL model assumes a linear relationship between utility and attribute parameters, and requires the error term to be identically and independently distributed according to a Weibull distribution (Mariel et al., 2011). However, conditional logit models assume preference homogeneity across respondents and suffer from the independence of irrelevant alternatives. This implies that only one fixed vector of parameters is estimated for the choice attributes, and hence all respondents are assumed to have the same taste for the attributes (Hensher et al. 1999; Louviere, 2001; Train, 2003). Conditional logit models can tackle heterogeneity by including socio-economic variables as interactions with attributes and alternative-specific constants, or by estimating different models for different subsets of data. An alternative approach to allow for heterogeneous preferences is to estimate a mixed logit (MXL) model (Hensher & Greene, 2003; Train, 2003). The main difference between the CL and MXL model lies in the deterministic component. In the MXL model, the utility function is extended with a vector of parameters that allow individual preferences to deviate from the mean. So, the mixed logit model allows for variations in preferences across individuals and adjusts for error correlation across alternatives (Hensher & Greene, 2003). The specification of a MXL models has the additional advantage of being able to capture all types of preference heterogeneity, i.e. unobserved or random (indicated by a coefficient’s statistically significant standard deviation) and observed or conditional (indicated by a statistically significant interaction effect) heterogeneity (Ward et al., 2011). Since parameter estimates are not fixed but random and follow a continuous distribution in the case of a MXL model, the WTP point estimates are then typically calculated at the mean parameter values. Hole (2007) discusses several approaches to estimating confidence intervals for willingness-to-pay measures when the WTP is calculated as a ratio of two random parameters.

8
In our empirical analysis, besides estimating a standard conditional logit model, preference heterogeneity is tackled by (1) estimating a mixed logit model and (2) including socio-demographic variables as interaction terms in the conditional logit model.
3.2.2 Survey design
In our study, respondents were confronted with a questionnaire that consisted of four parts. The first part dealt with socio-demographic questions such as nationality, age, gender, and current employment. The second part involved questions relating to the respondents’ current purchasing and consumption behavior such as the responsibility for food purchases, the criteria used when buying chocolate and the frequency of chocolate consumption. The third part was the actual choice experiment which consisted of a series of choices between two chocolate varieties and the option not to buy any chocolate at all. The fourth part dealt with the knowledge and option of respondents concerning fair-trade and organic labels as well as environmental attitudes.
In order to implement a choice experiment, we need to progress through seven different steps: - determine the good or service of interest: in this instance, chocolate tablets, - identify the main attributes of a chocolate tablet, - determine the relevant levels of the different attributes, - select and specify the chocolate varieties to be included in the experiment, - match the selected chocolate varieties into choice sets and determine the opt-out option, - execute the survey (sample selection, survey method…), and - analyze the data.
Attributes Attribute levels (variable names)
Taste (% cocoa) White chocolate: less than 10% cocoa solids (reference) Milk chocolate: between 20 and 30% cocoa solids (tastemilk) Dark chocolate: more than 45% cocoa solids (tastedark)
Fair-trade label Yes (withfairtrade) No (reference)
Country of production
Belgium (belgium) Switzerland (swiss) The Netherlands (reference)
Organic label Yes (withorganic) No (reference)
Price per tablet
1 euro 2 euro 3 euro 5 euro
Table 2: Attributes and attribute levels

9
After determining that we are interested in the choice process of consumers when they buy a chocolate tablet, we need to describe a chocolate tablet in terms of its relevant characteristics, i.e. its attributes. Based on pre-tests with students, we selected the following attributes:
- the taste of the chocolate, - the presence of a fair-trade label, - the country of production, - the presence of an organic label, and - the price of the chocolate tablet.
For each attribute we then select the relevant levels. The different attribute levels as well as the dummy, i.e. 0-1, variable names used later in the estimations are shown in Table 2.
Complete enumeration of all possible chocolate varieties based on the different combinations of attribute levels leads to 3.2.3.2.4 = 144 different chocolate varieties. This is the full factorial design of the experiment. However, in order to keep the number of choices made by each respondent feasible, we limit the number of varieties included in our questionnaire. The strategy to select a limited number of chocolate varieties is based on an orthogonal main effects plan (OMEP) since this allows the uncorrelated estimation of all main effects under the assumption that all interactions between attributes are negligible (Street et al., 2005). Thus, using SPSS, we determined an OMEP which included 18 different chocolate varieties. These 18 chocolate varieties were randomly paired to construct 9 different choice sets. Each choice set consists of two different chocolate varieties and the opt-out option to select neither of the two presented varieties. An example of such a choice set is presented in Table 3. Chocolate tablet A Chocolate tablet B
Taste Dark (>45% cocoa solids) Milk (20-30% cocoa solids)
Fair-trade label With fair-trade label Without fair-trade label
Country of production The Netherlands Belgium
Organic label Without organic label Without organic label
Price 2 euro/tablet 3 euro/tablet
Which 100g tablet do you prefer?
o Tablet A. o Tablet B. o Neither of the two tablets.
Table 3: Example of a choice card
IV. Description of the dataset
In this section we present the implementation of the survey and discuss the sample selection procedure. Next we describe the respondents using several characteristics such as age, gender and frequency of chocolate consumption.

10
4.1 Survey characteristics
The survey was implemented online and respondents were invited by email to participate to the study. On November 15, 2012 some 130 students ‘Environmental Economics’ were asked to distribute the survey invitation to at least four other individuals with the Belgian nationality and who were at least 18 years old. A reminder was sent on November 22, 2012. In order to check the influence of question ordering, two different questionnaires were used with the same questions but they were asked in a different order:
- Reference questionnaire: 1) socio-demographic questions, 2) consumer behavior, 3) choice experiment and 4) knowledge and beliefs about fair-trade and organic labels.
- Treatment questionnaire: 1) consumer behavior, 2) knowledge and beliefs about fair-trade and organic labels, 3) choice experiment and 4) socio-demographic questions.
The reference questionnaire was assigned to the students whose name started with a A to N and the second questionnaire was assigned to the students whose name started with a O to Z. This made the size of both groups almost identical. In total we received 666 responses of which 601 were fully completed and 65 were partially completed. For the reference questionnaire we obtained 351 responses of which 324 complete (92%) and for the treatment questionnaire we obtained 315 responses of which 277 complete (88%).
4.2 Respondents characteristics
A description of the socio-economic characteristics of the respondents for both the reference and the treatment group is given in Table 4. While our sample is not representative for consumers in Flanders, both groups of respondents exhibit similar characteristics. Some 60% are female and 60-70% are younger than 30. Moreover, as was to be expected, a majority were university students. A minor fraction of respondents had a vegetarian lifestyle, while some 10% was member of nature protection organization such as WWF, Natuurpunt or Greenpeace. Characteristic Reference group Treatment group
Male
Female
40%
60%
42%
58%
Percentage students 64% 56%
Younger than 21
Between 21 and 30
Between 31 and 40
Between 41 and 50
Between 51 and 60
Older than 60
37.6%
35.3%
3.1%
11.7%
6.6%
2.9%
28.9%
30.2%
6.4%
10.5%
7.9%
4.1%
Percentage vegetarians 3% 2%

11
Percentage member of nature protection organization 10% 12%
Frequency of eating chocolate (bar, paste, pralines…) - Every day - More than once per week, but not every day - Once per week - More than once per month, but not every week - Once per month - More than once per year, but not every month - Once per year - Never
15% 38% 19% 14% 6% 7% 1% 1%
20% 31% 18% 18% 5% 5% 0% 1%
Table 4: Respondents’ characteristics
Finally, we also observe that approximately half of our sample eats chocolate several times a week, if not daily, in the form of bars, paste, pralines or chocolate sprinkles. Only some 15% of the respondents said to eat chocolate at most once per month. This illustrates that chocolate is indeed a commonly consumed and purchased food product in Flanders and that consumers should have a clear view of their preferences regarding chocolate.
V. Results
In this section we start with some descriptive results regarding respondents’ chocolate purchasing behavior. Next, we investigate the evidence regarding the different conditions that need to be fulfilled in order to obtain the highest effect of labeling schemes.
5.1 Some descriptive results
In order to gain some more insight into the respondents’ purchasing behavior, we asked them what aspects determine their choice when buying chocolate (see Figure 1). Respondents could select at most three aspects. Type of chocolate (white, milk, dark) is the single most important factor (96% in both groups), second come filling or flavoring (52% in reference group and 44% in the treatment group) and price (48% in both groups) and next comes the brand of chocolate (36% in the reference group and 38% in the treatment group). Clearly, chocolate consumption is all about taste since four of the five highest ranked aspects are related to sensory experiences: chocolate type, filling, flavoring, brand and percentage of cocoa solids. Besides taste, price also matters. However, aspects such as fair trade (8%) or environmental impact (2% versus 4%) do not seem to be important for most respondents when buying chocolate.
Further, we learned that as a rule chocolate is bought in the supermarket. Nevertheless, some 57% of the respondents answered that they occasionally bought chocolate at a quality chocolate confectioner. Moreover, 76% of the respondents claim that they have never purchased chocolate in a fair trade shop or in an organic food shop.

12
Figure 1: Aspects taken into account when buying chocolate (number of responses)
5.2 Model assumptions in practice
In order to maximize the potential role of labels in stimulating the development of environmental and social product markets, a number of quite stringent assumptions need to be met, as was mentioned in section 3.1. Firstly, it is assumed that consumers are able to perfectly identify quality labels. Secondly, consumers should find the environmental and social quality information reliable and trustworthy. Thirdly, goods with a higher environmental or social quality should be preferred by consumers to goods with a lower environmental or social quality. Fourthly, consumers and producers need to know the marginal willingness to pay for socially beneficial or environment-friendly goods. Each of these four conditions is subsequently confronted with reality for the case of labeled chocolate in Flanders.
5.2.1 Identification of labels
A first requirement for labels to have an effect on consumer behavior is that consumers can identify and recognize environmental and social labels. In order to test this requirement, we asked respondents to identify three commonly used labels: the EU organic label, the EU ecolabel and the fair-trade label (see Figure 2). Respondents were first asked whether they recognized the label (yes/no) and, if they claimed to recognize the label, they were asked to specify which label it was. Hence we could distinguish three groups: respondents that did not recognize the label, respondents that thought they recognized the label but were in fact wrong, and respondents that correctly recognized the label. Since the results for both groups of respondents are almost identical, we only discuss the overall findings. From Figure 2, it is clear that respondents’ knowledge varies greatly over the three labels. The fair-trade label is by far the best known label: some 60% of respondents were able to correctly identify this label. However, only 7.8% of respondents correctly recognized the EU ecolabel, even though this label was introduced 20

13
years ago. The much more recent EU organic label, that was introduced in 2010, was correctly identified by 6% of respondents. Thus, in line with existing literature (see, e.g., Pedersen and Neergaard, 2006), we can conclude that labels are often not well-known by consumers in Flanders. This is especially problematic for the environment-friendly labels.
Figure 2: Respondents’ knowledge of labels
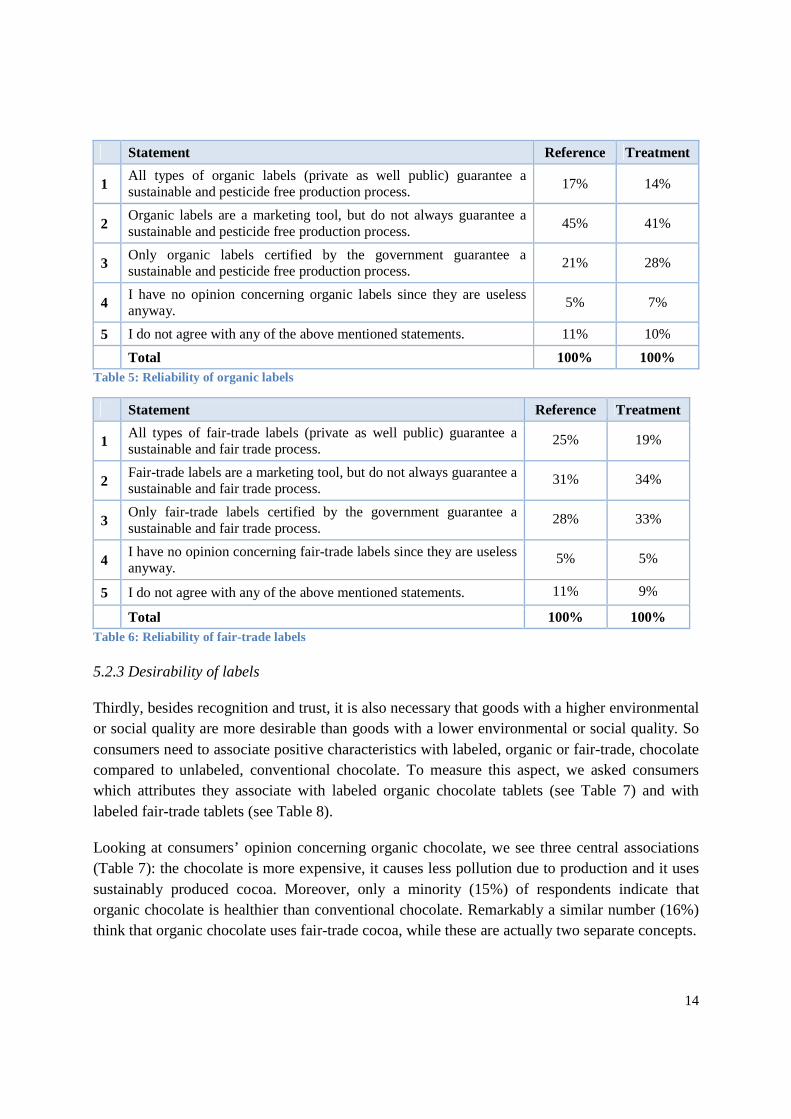
5.2.2 Reliability of labels
Besides the need to recognize organic and fair-trade labels on products, a second requirement implies that consumers should find the environmental and social quality information signaled by the labels reliable and trustworthy. In order to measure these aspects, we asked respondents to select the one statement out of five statements (see Table 5 and Table 6) that most closely represented their opinion concerning organic or fair-trade labels. We find that a majority of sampled consumers have some doubt on the reliability of labels and some 30% (fair-trade labels) to 40% (organic labels) classify labels as marketing tools without guarantees of socially desirable outcomes. Only, some 16% of respondents indicated that, according to them, all types of organic labels guarantee a sustainable and pesticide free production process, while some 22% indicated that all types of fair-trade labels guarantee a sustainable and fair trade process. In total, some 40% seem to trust organic labels certified by governmental organizations, while some 50% seem to trust fair-trade labels certified by the government.
14
Statement Reference Treatment
1 All types of organic labels (private as well public) guarantee a sustainable and pesticide free production process.
17% 14%
2 Organic labels are a marketing tool, but do not always guarantee a sustainable and pesticide free production process.
45% 41%
3 Only organic labels certified by the government guarantee a sustainable and pesticide free production process.
21% 28%
4 I have no opinion concerning organic labels since they are useless anyway.
5% 7%
5 I do not agree with any of the above mentioned statements. 11% 10%
Total 100% 100% Table 5: Reliability of organic labels
Statement Reference Treatment
1 All types of fair-trade labels (private as well public) guarantee a sustainable and fair trade process.
25% 19%
2 Fair-trade labels are a marketing tool, but do not always guarantee a sustainable and fair trade process.
31% 34%
3 Only fair-trade labels certified by the government guarantee a sustainable and fair trade process.
28% 33%
4 I have no opinion concerning fair-trade labels since they are useless anyway.
5% 5%
5 I do not agree with any of the above mentioned statements. 11% 9%
Total 100% 100% Table 6: Reliability of fair-trade labels
5.2.3 Desirability of labels
Thirdly, besides recognition and trust, it is also necessary that goods with a higher environmental or social quality are more desirable than goods with a lower environmental or social quality. So consumers need to associate positive characteristics with labeled, organic or fair-trade, chocolate compared to unlabeled, conventional chocolate. To measure this aspect, we asked consumers which attributes they associate with labeled organic chocolate tablets (see Table 7) and with labeled fair-trade tablets (see Table 8).
Looking at consumers’ opinion concerning organic chocolate, we see three central associations (Table 7): the chocolate is more expensive, it causes less pollution due to production and it uses sustainably produced cocoa. Moreover, only a minority (15%) of respondents indicate that organic chocolate is healthier than conventional chocolate. Remarkably a similar number (16%) think that organic chocolate uses fair-trade cocoa, while these are actually two separate concepts.

15
Statement Reference Treatment
1 The chocolate tablet is healthier. 15% 16%
2 The chocolate tablet is more expensive. 57% 66%
3 The chocolate tablet causes less pollution due to production. 58% 50%
4 The chocolate tablet tastes better. 2% 1%
5 The chocolate tablet uses fair-trade cocoa. 17% 15%
6 The chocolate tablet uses sustainably produced cocoa. 40% 42%
7 I do not attach special characteristics to organic chocolate tablets. 10% 8%
8 Other: The chocolate tablet tastes worse. 1% 2% Table 7: Perceived characteristics of labeled, organic chocolate
Next, we look at consumers’ opinion concerning fair-trade chocolate tablets. Again we see three dominant associations (Table 8): the chocolate uses fair-trade cocoa, it helps farmers in developing countries and the chocolate is more expensive. Remarkably a fair number of consumers seem to associate fair-trade chocolate with sustainable and environment-friendly production methods. Some 11% actually indicated that they thought that fair-trade chocolate causes less pollution due to production and some 20% indicated that fair-trade chocolate uses sustainably produced cocoa. Thus, some respondents seem to confuse the concepts of fair trade processes and organic agriculture. Unfortunately, this casts some more doubts on the usefulness of labeling in providing credible information to consumers in order to stimulate them to make more socially desirable consumption choices. Statement Reference Treatment
1 The chocolate tablet is healthier. 3% 3%
2 The chocolate tablet causes less pollution due to production. 11% 11%
3 The chocolate tablet helps farmers in developing countries. 65% 60%
4 The chocolate tablet is more expensive. 51% 59%
5 The chocolate tablet tastes better. 3% 1%
6 The chocolate tablet uses fair-trade cocoa. 73% 69%
7 The chocolate tablet uses sustainably produced cocoa. 21% 20%
8 I do not attach special characteristics to fair-trade chocolate tablets. 6% 8%
9 Other: The chocolate tablet tastes worse. 2% 2%
Table 8: Perceived characteristics of labeled, fair-trade chocolate
Additionally, in order to test whether labeled chocolate actually tastes different from conventional chocolate, we executed a blind taste experiment. In February 2013, we asked 81 students to taste 6 samples of chocolate: 2 white, 2 milk and 2 dark flavored. For each of those flavors, we offered a sample of conventional chocolate and a sample of organic and fair-trade

16
chocolate. We did not mention this difference to our respondents nor was the packaging visible. We then asked the respondents to evaluate the taste of the 6 samples on a scale from 1 (‘I do not like the taste of this chocolate at all’) to 10 (‘I like the taste of this chocolate very much’). The results show that – unsurprisingly – taste appreciation differs over consumers (see Table 9). A majority of the respondents preferred the taste of conventional chocolate over that of labeled chocolate. Still there was a sizeable group of respondents who were indifferent between both types of chocolate or who even preferred the taste of labeled chocolate. Using a linear regression to explain the taste evaluation (see appendix B for the estimation results), we found that the sample of chocolate was evaluate worse when the respondent tasted fair-trade and organic chocolate, when the respondent tasted dark chocolate, by women, by respondents who eat chocolate less frequently and by respondents who recognized the EU ecolabel. These results confirm that consumers do not always associated labeled chocolate with desirable characteristics as is indicated by their subjective beliefs as well as by the more objective blind tasting experiment.
Prefer conventional over
labeled chocolate Indifferent Prefer labeled over
conventional chocolate White 72.84% 17.28% 9.88% Milk 55.56% 8.64% 35.80% Dark 70.37% 13.58% 16.05%
Table 9: Taste experiment
5.2.4 Willingness to pay for labels
Fourthly, once consumers identify reliable and desirable characteristics with labeled products, they also should be willing to pay a premium for those products in order to increase the likelihood of an effective labeling system. Thus, the marginal willingness to pay for environmental quality or fair trade should be positive. First we discuss the results based on a conditional logit (CL) model and next we discuss the results of a mixed logit (MXL) model.
To start, we have estimated the willingness to pay (WTP) for different attributes of chocolate tablets using a conditional logit model in order to explain the probability that a certain chocolate tablet (of 100g) was chosen by consumers (see Table 10). The estimation results show that the respondents like milk chocolate best, dark chocolate second best and white chocolate least, ceteris paribus. Also they prefer Belgian chocolate best, Swiss chocolate second best and Dutch chocolate least, ceteris paribus. Furthermore, as expected, they prefer cheaper chocolate over more expensive chocolate. Respondents are also willing to pay a positive premium for chocolate with a fair-trade label over conventional chocolate. Surprisingly, we find that the presence of an organic label has no significant effect on the probability a particular chocolate tablet is chosen for the reference group, while this effect is even negative for the treatment group.

17
Reference group Treatment group Complete group
choice
Coef. Robust Std. Err.
P>z Coef. Robust Std. Err.
P>z Coef. Robust Std. Err.
P>z
tastemilk 1.1124 0.1249 0.000 1.0966 0.1272 0.000 1.1057 0.0895 0.000 tastedark 0.6376 0.1088 0.000 0.6072 0.1220 0.000 0.6234 0.0811 0.000 withfairtrade 0.5026 0.0732 0.000 0.6828 0.0808 0.000 0.5841 0.0543 0.000 belgium 0.5370 0.0871 0.000 0.4848 0.0887 0.000 0.5109 0.0623 0.000 swiss 0.4443 0.1115 0.000 0.2332 0.1171 0.046 0.3448 0.0810 0.000 withorganic -0.0721 0.0557 0.196 -0.1408 0.0591 0.017 -0.1049 0.0406 0.010 Price -0.2450 0.0211 0.000 -0.3328 0.0229 0.000 -0.2857 0.0157 0.000 ASC1 1.2657 0.1954 0.000 1.4879 0.2009 0.000 1.3700 0.1406 0.000 ASC2 1.1913 0.1783 0.000 1.5442 0.1861 0.000 1.3558 0.1291 0.000 Number of observations Pseudo R²
7917
0.2250
6690
0.2265
14607
0.2248
Table 10: Conditional logit results (main effects)
The Chow test based on the estimation results for the complete sample (see appendix A) does not allow us to reject the hypothesis that all interaction effects are zero (prob. >chi² = 0.3862). Hence, the order of the questions did not influence the estimated willingness to pay calculated in both groups. Thus in the remainder of the text, we will treat the reference group and the treatment group as one group. Moreover, all individual interaction terms correcting for respondents belonging to the treatment group are not significant at 5% level. Only the interaction term of fair-trade label is significant at the 10% level suggesting that respondents in the treatment group might have a slightly higher willingness to pay for fair-trade labels than respondents in the reference group (2.41 euro versus 1.73 euro per tablet). (euro per tablet of 100g) WTP reference group WTP treatment group WTP complete group tastemilk 4.54 3.30 3.87 tastedark 2.60 1.82 2.18 withfairtrade 2.05 2.05 2.04 belgium 2.19 1.46 1.79 swiss 1.81 0.70 1.21 withorganic (-0.29) -0.42 -0.37
Table 11: Willingness-to-pay estimates for main attributes (CL estimates)
Thus, based on the conditional logit estimation (see Table 11), the price premium respondents are willing to pay for a chocolate tablet with a fair-trade label is 2.04 euro on average, while the price premium they are willing to pay for a chocolate tablet with an organic label is -0.37 euro on average.

18
We now turn to the mixed logit estimation results for the complete sample (see Table 12). We included the variables withorganic and withfairtrade as random variables and calculated the willingness-to-pay (and its lower and upper limits) for the different attribute levels based on the Krinsky-Robb method (Hole, 2007). The results are very similar to those obtained from the conditional logit model.
choice
Mean Standard deviation Willingness-to-pay (€) Coef. Robust
Std. Err. P>z Coef. Robust
Std. Err. P>z wtp lower
limit upper limit
ASC1 1,4487 0,1634 0,0000 ASC2 1,4163 0,1500 0,0000 prijs -0,3180 0,0190 0,0000 belgium 0,5807 0,0860 0,0000
1,8261 1,2797 2,4283 swiss 0,6212 0,1083 0,0000
1,9536 1,2744 2,6880
tastemilk 1,2217 0,1126 0,0000
3,8420 3,1510 4,6137 tastedark 0,6546 0,1053 0,0000
2,0584 1,3990 2,8008
withorganic 0,0256 0,0579 0,6590 1,6953 0,1386 0,0000 0,0804 -0,2628 0,4161 withfairtrade 0,5942 0,0665 0,0000 -0,4870 0,3616 0,1780 1,8686 1,4561 2,3188
Table 12: Mixed logit results (main effects)
VI. Discussion
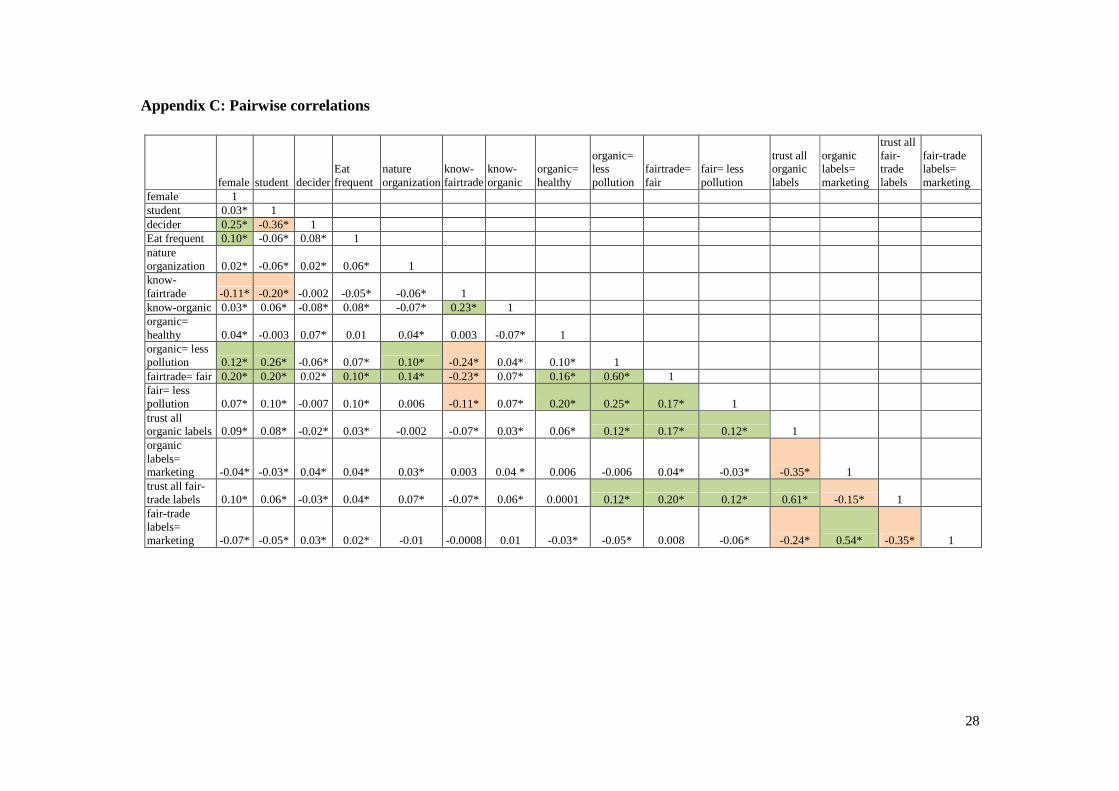
The result that at least some consumers might have a negative willingness to pay is surprising and contradicts results from previous studies. For this reason, we have a closer look at the results and we identify the characteristics of respondents with a negative WTP for labeled organic chocolate so as to gain insight into the reason underlying the result. In order to identify the groups of respondents that are heterogeneous with respect to their willingness to pay for labeled organic chocolate as well as labeled fair-trade chocolate, we include several interaction effects one by one in the CL estimation. We make a distinction between socio-demographic characteristics, consumer characteristics and stated attitudes towards organic and fair-trade labels. A summary of the results can be found in Table 13. Moreover, the table with pairwise correlations between the different respondent characteristics can be found in appendix C.
Firstly, we look at the influence of socio-demographic characteristics on the WTP for labeled chocolate. Female respondents have a higher (less negative) WTP than male respondents for labeled organic chocolate: -0.09 euro versus -0.76 euro per tablet. Further, students as well as members of nature protection organizations (NPOs) are willing to pay a significantly higher premium for labeled fair-trade chocolate compared to conventional chocolate. Remarkably, members of NPOs are willing to pay a price premium for fair-trade chocolate that is twice the

19
premium that non-members are willing to pay, while the premiums for organic chocolate are not significantly different between both groups.
Secondly, we look at some consumer characteristics. We find that respondents who frequently eat chocolate (more than once a week) have a significantly higher WTP for organic chocolate and also have a significantly higher WTP for fair-trade chocolate than infrequent chocolate eaters. This seems to be consistent with the observation that the impact of environmental attributes is more noticeable for frequently bought products (Bjorner et al., 2004). Next, we see that respondents who are responsible for food purchases - which is positively correlated with being female - have a lower WTP for fair-trade chocolate than responsible who are not responsible for grocery shopping. Although this variable does not lead to differences in the WTP for organic chocolate.
Fair-trade label Organic label Socio-demographic characteristics Gender / Female respondents have higher
WTP compared to male respondents (-0.09 vs. -0.76)**
Student Students have higher WTP than non-students (2.27 vs. 1.71)*
/
Membership of nature protection organization (NPO)
Members NPO have higher WTP than non-members (3.68 vs. 1.85)***
/
Consumer characteristics Frequency of eating chocolate Frequent chocolate eaters (more
than once a week) have higher WTP than infrequent chocolate eaters (2.33 vs. 1.74)**
Frequent chocolate eaters have higher WTP than infrequent eaters (0.12 vs. -0.63)**
Deciding on food purchases Deciders have lower WTP than non-deciders (1.73 vs. 2.28)*
/
Attitudes towards organic and fair-trade labels Recognize EU organic label / / Recognize fair-trade (FT) label Respondents who recognize FT
label have lower WTP than those who did not recognize FT label (1.59 vs. 2.36)**
Respondents who recognize FT label have lower WTP than those who did not recognize FT label (-0.89 vs. -0.008)***
Organic is healthy Respondents who think organic is healthy have higher WTP than others (2.85 vs. 1.90)***
/
Fair-trade leads to less pollution / Respondents who think fair trade leads to less pollution have higher WTP than others (0.21 vs. -0.56)***
Fair-trade implies fair trade (good for farmers and fair trade
Respondents who think FT label imply fair trade have higher WTP
Respondents who think FT label imply fair trade have higher WTP

20
cocoa) than others (2.39 vs. 0.45)*** than others (-0.16 vs. -1.32)*** Organic label is marketing tool / Respondents who think organic
labels are marketing tools have lower WTP than others (-0.63 vs. -0.17)*
Fair-trade label is marketing tool Respondents who think FT labels are marketing tools have lower WTP than others (1.57 vs. 2.27)**
Respondents who think FT labels are marketing tools have lower WTP than others (-0.96 vs. -0.08)***
Trust in all types of organic labels
Respondents who trust all organic labels have higher WTP than others (2.65 vs. 1.94)*
/
Trust in all types of fair-trade labels
Respondents who trust all FT labels have higher WTP than others (2.67 vs. 1.78)***
/
* = significant at 10% level, **= significant at 5% level, ***= significant at 1% level, / = no significant effect Table 13: Interaction effects
Thirdly, we investigate the influence of reported attitudes towards organic and fair-trade labels on the willingness to pay more for labeled chocolate. The (dis)ability to recognize the EU organic label (see Figure 2) does not lead to differences in WTP, however the ability to recognize the fair-trade label does. Respondents who were able to correctly identify the fair-trade label have a lower WTP for both fair-trade chocolate and organic chocolate. At first sight this finding is counter-intuitive. However, it is supported by the previous mentioned result that respondents who are responsible for food purchases have a lower WTP for fair-trade chocolate. While it seems that more knowledgeable consumers have lower a WTP, these estimates might actually be more reliable and estimates from less knowledgeable consumers might be biased by warm glow considerations (see, e.g., Brécard et al., 2008).
Next, we observe some puzzling results. It turns out that consumers who belief that organic chocolate is more healthy than conventional chocolate are not willing to pay significantly more for organic chocolate than other consumers. However, they are willing to pay significantly more for fair-trade chocolate: 2.85 versus 1.90 euro per tablet. Moreover, respondents who belief that fair-trade chocolate leads to less pollution have a higher WTP for organic chocolate than others.
Some other results seem more logical. On the one hand, respondents who belief that labeled fair-trade chocolate actually leads to better lives for farmers in developing countries are willing to pay a positive premium for fair-trade chocolate as well as organic chocolate. On the other hand, respondents who view labels as marketing tools are willing to pay significantly less for labeled fair-trade or labeled organic chocolate. Finally, consumers who trust all types of fair-trade or organic labels to bring socially desirable results are willing to pay more for fair-trade chocolate, but not for organic chocolate.

21
So, the results described above allow us to paint a much more favourable picture for the use of fair-trade labels in the chocolate market than for organic labels. The fair-trade label is recognized by some 60% of respondents. Moreover, some 50% of respondents indicate trust in fair-trade labels, particularly those controlled by the government. Some 60% of respondents belief that fair-trade chocolate is beneficial for farmers in developing countries and guarantees fair trade processes. Concerning the final condition, respondents were willing to pay a price premium of 2.04 euro on average for a labelled fair-trade chocolate tablet. Overall, these results provide us with an optimistic view of the market potential of labelled fair-trade chocolate.
The EU organic label, on the other hand, is recognized by less than 10% of respondents. Nonetheless, some 40% of respondents indicate to trust organic labels, particularly those controlled by the government and some 50% of respondents belief that organic chocolate implies less pollution during the production process of chocolate. However, concerning the final condition, we calculated that respondents would desire a negative price premium, or a discount, of -0.37 euro on average for labelled organic chocolate. Thus, these results provide us with a pessimistic view of the market potential of labelled organic chocolate.
Although more extreme, our results are comparable to the results found by Loureiro and Lotade (2005) for coffee. Using a contingent valuation study, these authors found that consumers are willing to pay higher premiums for fair-trade coffee or shade grown coffee than for organic coffee. According to their results, the additional WTP for fair-trade coffee was 22 dollar cents per pound, for shade grown coffee 20 cents per pound and for organic coffee 16 cents per pound. However, our results to not correspond to those found by Tagbata and Sirieix (2008) in a lab experiment. They found that consumers are willing to pay an almost identical price for organic chocolate as for fair-trade chocolate (1.25 euro versus 1.31 euro).
Finally, the result that some respondents require a discount for organic chocolate is quite unique. A more detailed analysis showed that this result varies depending on respondents’ characteristics and that the following groups have the most noticeable negative WTP: male respondents, respondents who infrequently eat chocolate, respondents who are responsible for making purchasing decisions, respondents who consider labels to be a marketing tool and do not trust that labels imply socially desirable production methods, and, surprisingly, people who recognized the picture of a fair-trade label.
VII. Conclusion
In order to investigate consumer preferences for labeled products, we executed an online survey of Flemish consumers focusing on chocolate. The results allow us to comment on the likelihood that labels for fair-trade chocolate and for organic chocolate can be effective in stimulating consumer demand for those products. A number of conditions need to be fulfilled in order to

22
reach the full potential of labels as an environmental and social policy instrument. Firstly, consumers need to identify and recognize the environmental and social labels. We have shown that this condition is much better met for fair-trade labels than for organic labels. A majority of respondents was able to recognize the fair-trade labels, but only a fraction could recognize the EU ecolabel or the EU organic label. Secondly, consumers need to find the environmental quality information reliable and trustworthy. This condition is met for approximately half our sample for both fair-trade and organic labels. Thirdly, goods with a higher environmental quality should be more desirable than goods with a lower environmental quality. Again this condition is met by half of our respondents for both types of labels based on their stated beliefs. Based on the blind tasting experiment some 50 to 70% of respondents ranked the taste of labeled chocolate below that of conventional chocolate. Fourthly, consumers have to have a positive marginal willingness to pay for environment-friendly goods. Here, we found that the price premium respondents are willing to pay for a chocolate tablet with a fair-trade label is approximately 2 euro on average, while the price premium for a chocolate tablet with an organic label is slightly negative (-0.37 euro) or slightly positive (0.08) on average depending on the estimation method. Overall, we find that the conditions are much better fulfilled for fair-trade labels than for organic labels in the market of chocolate in Flanders. Thus the market potential for fair-trade chocolate seems to be higher than for organic chocolate, at least for part of the respondents. To conclude, the consumption of chocolate is dominated taste and price, with aspects such as fair trade or environmental impact having only a minor impact.
Our findings are useful to organizations involved in the trade and commercialization of products grown in developing countries as well as organization involved in stimulating demand for green or socially desirable products. The ethical benefits associated with fair-trade chocolate were more highly regarded by our respondents than the environmental benefits associated with organic chocolate. Moreover, respondents in general do not notice nor recognize organic labels. This information is important for governments to evaluate new policy proposals or for firms to evaluation new business opportunities.

23
Bibliography
Alberini, A., A. Longo, and M. Veronesi (2006). Basic statistical models for stated choice studies. In: B.J. Kanninen (ed.), Valuing Environmental Amenities Using Stated Choice Studies. New York: Springer-Verlag. pp. 203-227.
Aldanondo-Ochoa, A.M. and C. Almansa-Saez (2009). The private provision of public environment: Consumer preferences for organic production systems. Land Use Policy, 26, 669-682.
Amacher, G.S., Koskela, E. and M. Ollikainen (2004). Environmental quality competition and eco-labeling. Journal of Environmental Economics and Management, 47, 284-306
Amaya-Amaya, M., Gerard, K. and M. Ryan (2008). Discrete choice experiments in a nutshell. In: M. Ryan, K. Gerard and M. Amaya-Amaya (eds.), Using Discrete Choice Experiments to Value Health and Health Care, 13–46. Springer.
Bhate, S. (2002). One world, one environment, one vision: Are we close to achieving this? An exploratory study of consumer environmental behaviour across three countries. Journal of Consumer Behaviour, 2(2), 169–184.
Bjorner, T.B., Hansen, L.G. and C.S. Russell (2004). Environmental labeling and consumers’ choice – an empirical analysis of the effect of the Nordic Swan. Journal of Environmental Economics and Management, 47, 411-434
Brécard, D., Hlaimi, B., Lucas, S., Perraudeau, Y. and F. Salladaré (2008). Determinants of the demand for green products: An application to eco-label demand for fish in Europe. Ecological Economics, 69(1), 115-125
Cason, T.N. and L. Gangadharan. (2002). Environmental labeling and incomplete consumer information in laboratory markets. Journal of Environmental Economics and Management, 43(1), 113–134.
Christie, M., Warren, J., Hanley, N., Murphy, K., Wright, R., Hyde, T. and N. Lyons (2004). Developing measures for valuing changes in biodiversity: Final report. Report to DEFRA London.
Cornes, R. and T. Sandler (1984). Easy riders, joint production, and public goods. Economic Journal, 94, 580-598
Day, B., Bateman, I.J., Carson, R.T., Dupont, D., Louviere, J.J., Morimoto, S., Scarpa, R. and P. Wang (2012). Ordering effects and choice set awareness in repeat-response stated preference studies. Journal of Environmental Economics and Management, 63(1), 73-91.
Hanley, N., Mourato, S. and R.E. Wright (2001). Choice modeling approaches: A superior alternative for environmental valuation? Journal of Economic Surveys, 15(3), 435-462

24
Hensher, D., Louviere, J. and J. Swait (1999). Combining sources of preference data. Journal of Econometrics, 89, 197-222
Hensher, D.A. and W.H. Greene (2003). The Mixed Logit model: The state of practice. Transportation, 30 (2), 133–176
Hole, A.R. (2007). A comparison of approaches to estimating confidence intervals for willingness to pay measures. Health Economics, 16, 827-840
Hughner, R.S., McDonagh, P., Prothero, A., Shultz, C.J. II and J. Stanton (2007). Who are organic food consumers? A compilation and review of why people purchase organic food. Journal of Consumer Behaviour, 6, 94–110.
Kollman, K. and A. Prakash (2001). Green by choice? – cross-national variations in firms’ responses to EMS-based environmental regimes. World Politics, 53, 399–430.
KPMG (2012). Cocoa Certification: Study on the costs, advantages and disadvantages of cocoa certification. Commissioned by The International Cocoa Organization (ICCO). p.98
List, J.A. and J.F. Shogren (1999). Price information and bidding behavior in repeated second – price auctions. American Journal of Agricultural Economics, 81, 942-949
Loureiro, M.L. and J. Lotade (2005). Do fair trade and eco-labels in coffee wake up the consumer conscience? Ecological Economics, 53, 129-138
Louviere, J.J. (2001). Choice Experiments: An Overview of Concepts and Issues. In Bennett, J.; Blamey, R. (eds): The Choice Modelling approach to Environment Valuation, Edward Elgar Publishing, Cheltenham, UK, 13-36
Louviere, J.J. and D.A. Hensher (1982). On the design and analysis of simulated choice or allocation experiments in travel choice modelling. Transportation Research Record, 890, 11-17.
Louviere, J.J. and G. Woodworth (1983). Design and analysis of stimulated choice experiments or allocation experiments: An approach based on aggregate data. Journal of Marketing Research, 20, 350-367.
Louviere, J.J., Hensher, D.A. and J.D. Swait (2000). Stated choice methods: analysis and application. Cambridge University Press.
Mangham, L.J., Hanson, K. and B. McPake (2009). How to do (or not to do) . . . Designing a discrete choice experiment for application in a low-income country. Health Policy and Planning, 24, 151-158
Mariel, P., De Ayala, A., Hoyos, D. and S. Abdullah, S. (2011). Selecting random parameters in discrete choice experiment for environmental valuation: a simulation experiment. International Choice Modelling Conference 2011, Oulton Hall, UK. http://www.icmconference.org.uk/index.php/icmc/ICMC2011/paper/view/242/150.

25
Ntiamoah, A. and G. Afrane (2008). Environmental impacts of cocoa production and processing in Ghana: life cycle assessment approach. Journal of Cleaner Production, 16, 1735-1740
Peattie, K. (1992). Green Marketing. Pitman: London.
Peattie, K. (2001). Golden goose or wild goose? The hunt for the green consumer. Business Strategy and the Environment, 10, 187–199.
Pedersen, E.R. and P. Neergaard (2006). Caveat emptor – Let the buyer beware! Environmental labelling and the limitations of ‘green’ consumerism. Business Strategy and the Environment, 15, 15-29
Poelman, A., Mojet, J., Lyon, D. and S. Sefa-Dedeh (2008). The influence of information about organic production and Fair Trade on preferences for and perception of pineapple. Food Quality and Preference, 15, 114-121.
Rice, R.A. and R. Greenberg (2000). Cacao cultivation and the conservation of biological diversity. AMBIO: A Journal of the Human Environment, 29(3), 167-173
Rousseau, S. and L. Vranken (2013). Green market expansion by reducing information asymmetries: Evidence for labeled organic food products. Food Policy, 40, 31-43
Rousseau, S. and R. Rousseau (2012). Interactions between journal attributes and authors’ willingness to wait for editorial decisions. Journal of the American Society for Information Science and Technology, 63(6), 1213-1225.
Schumacher, I. (2010). Ecolabeling, consumers' preferences and taxation. Ecological Economics, 69, 2202-2212
Street, D.J., Burgess, L. and J.J. Louviere (2005). Quick and easy choice sets: Constructing optimal and nearly optimal stated choice experiments. International Journal of Research in Marketing, 22, 459-470.
Tagbata, D. and L. Sirieix (2008). Measuring consumers’ willingness to pay for organic and Fair Trade products. International Journal of Consumer Studies, 32, 479-490.
Train, K.E. (2003). Discrete Choice Methods with Simulations (1 ed.). Cambridge: Cambridge University Press
Ward, D., Clark, C., Jensen, K. and S. Yen, (2011). Consumer willingness to pay for appliances produced by Green Power Partners. Energy Economics, 33, 1095–1102.
Young, W., Hwang, K., McDonald, S. and C.J. Oates (2010). Sustainable consumption: green consumer behaviour when purchasing products. Sustainable Development, 18, 20–31

26
Appendix A
Conditional logit estimation using the complete dataset with interaction effects for treatment group (green).
choice Coef. Std. Err. z P>z [95% Conf. Interval] tastemilk 1.168238 .1239461 9.43 0.000 .925308 1.411168 inttastemilkgreen -.133151 .1700227 -0.78 0.434 -.4663894 .2000875 Tastedark .656672 .1094069 6.00 0.000 .4422385 .8711055 Inttastedarkgreen -.0721527 .1621527 -0.44 0.656 -.3899662 .2456608 withfairtrade .4946699 .0730412 6.77 0.000 .3515118 .637828 intfairtradegreen .1930654 .1093241 1.77 0.077 -.0212058 .4073366 Belgium .4735426 .0858461 5.52 0.000 .3052873 .6417979 intbelgiumgreen .0796875 .1193647 0.67 0.504 -.1542631 .313638 Swiss .3248391 .1079962 3.01 0.003 .1131704 .5365078 intswissgreenn .0409193 .1455192 0.28 0.779 -.244293 .3261317 withorganic -.0881199 .0567536 -1.55 0.121 -.1993549 .0231151 intorganicgreen -.0364345 .0800218 -0.46 0.649 -.1932743 .1204053 Price -.2858883 .0157112 -18.20 0.000 -.3166818 -.2550948 ASC1 1.454874 .1903364 7.64 0.000 1.081822 1.827926 intasc1green -.179579 .2285276 -0.79 0.432 -.6274849 .2683268 ASC2 1.387018 .1694787 8.18 0.000 1.054846 1.719191 intasc2green -.0649822 .2008065 -0.32 0.746 -.4585556 .3285913

27
Appendix B: Estimation results for taste experiment
____ccccoooonnnnssss 7777....999988880000777766667777 ....4444444433339999666611111111 11117777....99998888 0000....000000000000 7777....11110000888811114444 8888....888855553333333399994444 kkkknnnnoooowwwwEEEEUUUUeeeeccccoooo ----....5555333366668888444411114444 ....2222222277777777222255559999 ----2222....33336666 0000....000011119999 ----....9999888844444444444477777777 ----....0000888899992222333355552222ffffrrrreeeeqqqquuuueeeennnntttteeeeaaaa~~~~kkkk ....4444888899994444333388881111 ....2222000011113333111122223333 2222....44443333 0000....000011115555 ....0000999933337777444499991111 ....8888888855551111222277772222 ffffeeeemmmmaaaalllleeee ----....6666444433332222333366664444 ....1111999988886666777733337777 ----3333....22224444 0000....000000001111 ----1111....000033333333777733339999 ----....2222555522227777333333336666 ddddaaaarrrrkkkk ----....4444555544448888666611111111 ....2222000099991111555511116666 ----2222....11117777 0000....000033330000 ----....8888666655559999555588886666 ----....0000444433337777666633336666 ffffaaaaiiiirrrrttttrrrraaaaddddeeee ----1111....444411112222000033337777 ....11119999777711119999 ----7777....11116666 0000....000000000000 ----1111....777799999999666622223333 ----1111....000022224444444455551111 ttttaaaasssstttteeee CCCCooooeeeeffff.... SSSSttttdddd.... EEEErrrrrrrr.... tttt PPPP>>>>||||tttt|||| [[[[99995555%%%% CCCCoooonnnnffff.... IIIInnnntttteeeerrrrvvvvaaaallll]]]]
TTTToooottttaaaallll 2222111111119999....1111000088888888 444433331111 4444....99991111666677772222555577775555 RRRRooooooootttt MMMMSSSSEEEE ==== 2222....0000444499993333 AAAAddddjjjj RRRR----ssssqqqquuuuaaaarrrreeeedddd ==== 0000....1111444455559999 RRRReeeessssiiiidddduuuuaaaallll 1111777788888888....99997777000000004444 444422226666 4444....11119999999944446666000011118888 RRRR----ssssqqqquuuuaaaarrrreeeedddd ==== 0000....1111555555558888 MMMMooooddddeeeellll 333333330000....111133338888777755558888 5555 66666666....0000222277777777555511117777 PPPPrrrroooobbbb >>>> FFFF ==== 0000....0000000000000000 FFFF(((( 5555,,,, 444422226666)))) ==== 11115555....77772222 SSSSoooouuuurrrrcccceeee SSSSSSSS ddddffff MMMMSSSS NNNNuuuummmmbbbbeeeerrrr ooooffff oooobbbbssss ==== 444433332222
28
Appendix C: Pairwise correlations
female student decider Eat frequent
nature organization
know-fairtrade
know-organic
organic= healthy
organic= less pollution
fairtrade= fair
fair= less pollution
trust all organic labels
organic labels= marketing
trust all fair-trade labels
fair-trade labels= marketing
female 1 student 0.03* 1 decider 0.25* -0.36* 1 Eat frequent 0.10* -0.06* 0.08* 1 nature organization 0.02* -0.06* 0.02* 0.06* 1 know-fairtrade -0.11* -0.20* -0.002 -0.05* -0.06* 1 know-organic 0.03* 0.06* -0.08* 0.08* -0.07* 0.23* 1 organic= healthy 0.04* -0.003 0.07* 0.01 0.04* 0.003 -0.07* 1 organic= less pollution 0.12* 0.26* -0.06* 0.07* 0.10* -0.24* 0.04* 0.10* 1 fairtrade= fair 0.20* 0.20* 0.02* 0.10* 0.14* -0.23* 0.07* 0.16* 0.60* 1 fair= less pollution 0.07* 0.10* -0.007 0.10* 0.006 -0.11* 0.07* 0.20* 0.25* 0.17* 1 trust all organic labels 0.09* 0.08* -0.02* 0.03* -0.002 -0.07* 0.03* 0.06* 0.12* 0.17* 0.12* 1 organic labels= marketing -0.04* -0.03* 0.04* 0.04* 0.03* 0.003 0.04 * 0.006 -0.006 0.04* -0.03* -0.35* 1 trust all fair-trade labels 0.10* 0.06* -0.03* 0.04* 0.07* -0.07* 0.06* 0.0001 0.12* 0.20* 0.12* 0.61* -0.15* 1 fair-trade labels= marketing -0.07* -0.05* 0.03* 0.02* -0.01 -0.0008 0.01 -0.03* -0.05* 0.008 -0.06* -0.24* 0.54* -0.35* 1