the potential impact of externalities considerations on the market
TRANSCRIPT

February 1994 • NREL/TP-462-5789
The Potential Impact of Externalities Considerations on the Market for Biomass Power Technologies
Blair G. Swezey, Kevin L. Porter, and J.Sherman Feher
National Renewable Energy Laboratory 1617 Cole Boulevard Golden, Colorado 80401-3393 A national laboratory of the U.S. Department of Energy Managed by Midwest Research Institute for the U.S. Department of Energy under contract No. DE-AC36-83CH10093 February 1994

NREL/TP-462-5789 • UC Categories 233, 247 • DE94000247
The Potential Impact of Externalities Considerations on the Market for Biomass Power Technologies
Blair G. Swezey, Kevin L. Porter, and J.Sherman Feher
National Renewable Energy Laboratory 1617 Cole Boulevard Golden, Colorado 80401-3393 A national laboratory of the U.S. Department of Energy Managed by Midwest Research Institute for the U.S. Department of Energy under contract No. DE-AC36-83CH10093
Prepared under Task Nos. BF165155 and BF261011
February 1994

NOTICE
This report was prepared as an account of work sponsored by an agency of the United States government. Neither the United States government nor any agency thereof, nor any of their employees, makes any warranty, express or implied, or assumes any legal liability or responsibility for the accuracy, completeness, or usefulness of any information, apparatus, product, or process disclosed, or represents that its use would not infringe privately owned rights. Reference herein to any specific commercial product, process, or service by trade name, trademark, manufacturer, or otherwise does not necessarily constitute or imply its endorsement, recommendation, or favoring by the United States government or any agency thereof. The views and opinions of authors expressed herein do not necessarily state or reflect those of the United States government or any agency thereof.

TP-5789
Preface
One intended result of federal investments in renewable energy research and development (R&D)programs is the adoption and use of renewable energy technologies in the energy marketplace.Insights into the nature of energy markets can help to assure that the technologies beingdeveloped are compatible with these markets. This document reports on the findings of a studyto assess the potential impact of externalities considerations on the market prospects for differentbiomass resources and technologies, particularly wood and agricultural wastes, waste-to-energy,and landfill gas.
States are increasingly contemplating inclusion of the non-market costs and benefits of generationoptions in electricity resource planning and procurement decisions. These market externalitiesrepresent impacts that are not wholly reflected in the market price of electricity from differentgeneration resources. These impacts, which can be either positive or negative, may encompassenvironmental, economic, and other social factors. The explicit consideration of externalitiescould measurably impact the competitive standing of various energy resources and technologiesin future utility resource acquisitions.
This report begins with an overview of the current status of biomass-based power developmentin the United States and the prospects for future development in today's more competitive marketenvironment, followed by a general description of biomass power technologies and theirexternalities. We then review the degree to which externalities are being considered in stateresource planning decisions, including the extent to which biomass technologies have been orcould be impacted by these considerations. Finally, a number of electric utility and biomassindustry representatives were contacted to assess industry perceptions of the externalities relatedto biomass energy resources and technologies and the degree to which these externalities mayhelp or hinder biomass development.
The Analytic Studies Division (ASD) of the National Renewable Energy Laboratory (NREL)supports the long-range planning of the overall federal renewable energy R&D program, both atNREL and the U.S. Department of Energy (DOE), by conducting analyses on aspects of energymarket competition that are relevant to the present and future deployment of renewable energytechnologies. The ASD reports on these efforts to DOE and NREL managers to enhance theirawareness of competitive and institutional factors that may impact on the successful deploymentof renewable energy technologies in the marketplace.
This study was conducted for the DOE Office of National Programs in the Office of Technicaland Financial Assistance in the Office of Energy Efficiency and Renewable Energy. The authorswish to thank Carl Wallace of NREL for his general support of this work. The authors also wishto thank the many biomass and utility industry representatives who provided the industryperspectives that are summarized in Chapter 4.
The text of the report was improved greatly from information and comments received from manypeople including Tony Alvarez, Jim Easterly, and Janine Finnell, Meridian Corp.; Phillip C.Badger, Tennessee Valley Authority; Steve Bernow, Tellus Institute; Shahid Chandhry, California
iii

TP-5789
Energy Commission; Julie Hashem, Barakat & Chamberlin, Inc.; Paul Hibbard, MassachusettsDepartment of Public Utilities; David lliff, Wisconsin Public Service Commission; Jonathan V.L. Kiser, Integrated Waste Services Association; Phil Lusk, Consultant; Russ O'Connell,Coalition of Northeastern Governors; Ralph Overend, National Renewable Energy Laboratory;Nancy Pitblado, Connecticut Department of Policy and Management; Dave Swanson, WesternArea Power Administration; Jane Turnbull, Electric Power Research Institute; and Carl Vansant,Solid Waste & Power magazine. However, the interpretation of this information, as presentedin this report, remains the sole responsibility of the authors.
Approved for theNATIONAL RENEWABLE ENERGY LABORATORY
Thomas D. Bath, DirectorAnalytic Studies Division
IV
Walter D. Short, ManagerMarket Analysis Branch

TP-5789
Executive Summary
Of all the renewable energy sources used for power generation, biomass energy has experiencedthe greatest growth over the last decade. Spurred by requirements established in the PublicUtility Regulatory Policies Act of 1978 (PURPA), as well as various tax incentives, biomassbased power generation now provides more than 50 billion kWh of electric energy from 10,000MW of installed capacity. The overwhelming majority of this capacity, primarily wood-based,has been developed by the nonutility sector. However, the biomass industry is currently facingmore difficult market conditions due to a reduction in federal incentives and changes in thegeneration market, such as lower utility avoided costs, slower demand growth, and greatercompetition among fuel sources.
States are increasingly contemplating the inclusion of market externalities costs and benefitsassociated with different generation options in electricity resource planning and procurementdecisions. Market externalities, as they relate to generation resources and technologies, representimpacts that are not wholly reflected in the market price of electricity derived from these sources.These impacts, which can be either positive or negative, can encompass environmental, economic,and other social factors, but state considerations have focused predominately on environmentalexternalities costs, especially air emissions. The explicit quantification of externalities couldmeasurably affect the competitive standing of various energy resources and technologies in futureutility resource acquisitions.
The objective of this study was to assess the current status of externalities considerations in stateand utility electricity resource planning processes and to determine how externalitiesconsiderations might help or hinder future development of biomass power plants. In thefollowing chapters, we provide an overview of biomass resources and technologies, includingtheir market status and environmental impacts; review the current treatment of externalities in thestates; and document the perspectives of key utility, regulatory, and industry representatives onexternalities considerations. However, this report is not intended to be a definitive study ofenvironmental externalities. Nor do we intend to suggest the extent to which externalities shouldbe considered in state or utility resource planning deliberations nor to suggest how externalitiescould be used to promote greater adoption of biomass power technologies.
Although states are increasingly considering environmental and other socioeconomic externalitiesas a component of electricity resource planning and acquisition processes, both the methodsutilized and the scope of these considerations differ widely. Through 1992, 29 states had existingrequirements for electric utilities to consider externalities in resource planning and/or acquisition,and an additional 7 states were considering adopting externalities requirements. Air emissionshave received the most attention in externalities deliberations. While some states have attemptedto consider economic and fuel risk externalities as well, these considerations are not welldeveloped at present.
The majority of states considering externalities do so qualitatively. This type of considerationcan range from a fairly superficial treatment in planning to explicit weighting in resourceprocurement decisions. Only five states (California, Massachusetts, Nevada, New York, and
v

TP-5789
Wisconsin) have established monetized values for environmental externalities based on residualair emissions. Table ES-l presents NREL-calculated externalities costs by generation technologybased on the emissions values adopted in each of these five states.
Table ES-1. Representative Environmental Adders for States with Monetized Externalities(cents/kWh, $1992)
IFuel - Technology California Massachusetts Nevada New York Wisconsin ICoal - Pulverized (NSPS) 2.2 4.0 4.0 0.6 1.7
Coal - AFB 1.7 3.7 3.6 0.3 1.8
Coal- IGCC 1.0 2.5 2.5 0.2 1.4Natural Gas - Combined Cycle 0.7 1.5 1.4 0.1 0.7
Natural Gas - Combustion Turbine 1.1 2.4 2.4 0.2 1.2
Wood - Steam 1.9 5.2/0.9 4.8/0.7 0.3/0.1 2.7/0.1
Biomass - Advanced Gasification 1.2 3.0/0.3 3.0/0.3 0.2/0.1 1.7/0.1
Municipal Solid Waste 1.8 4.9 4.7 0.3 2.2
Landfill Methane 1.7 3.2/-2.8 3.0/-2.9 0.4 1.0/-2.7
Geothermal - Flashed Steam <0.1 NA <0.1 NA NASolar - Trough with Gas Backup 0.7 NA 1.8 NA NA
NA =not applicable
Note: For wood and advanced biomass, the first value represents total externalities without CO2 offsets credit and the second valuewith CO2 offsets for those state commissions that have explicitly considered offsets or in which commission staff have expressedsupport for CO2 offsets. For landfill methane, the second value represents a credit for methane emissions reductions for those statesthat have monetized methane emissions; however, none of these states currently allow negative values to be applied. See Chapter3 for other table assumptions.
Among fossil fuel combustion technologies, natural-gas-based plants have the lowest totalexternalities costs, while coal-fired plants have the highest. The magnitude of the adders forbiomass-based technologies depends greatly on whether biomass projects are judged to be neutralwith regard to greenhouse gas emissions because of carbon dioxide (C02) sequestration.
Some of these states are now considering the use of carbon-fixing offsets for wood andagricultural waste if it can be shown that the fuel supply is sustainably managed. InMassachusetts, the only state that has specifically approved this approach, CO2 emissions offsetswould lower the total externalities adder for a representative wood project from 5.2¢/kWh toO.9¢/kWh, which is less than the adder for a natural gas combined cycle plant, generally regardedas the "cleanest" fossil-fuel-based generation option.
Another emerging trend in these states is to allow offsets to some or all externalities adders. Tothe extent that offsets can be obtained at relatively low cost, any advantages that biomass andother renewables would receive under externalities considerations would be eroded.
It is still too early to ascertain to what extent externalities considerations will impact resourceplanning and acquisition decisions. There is currently little, if any, evidence indicating that the
VI

TP-5789
qualitative consideration of externalities is having an impact on resource choices. The impactof externalities monetization is also unclear, partly because in some states, e.g., California,resource choices have not yet been finalized utilizing these values, and partly because thesluggish economy has delayed the need for new resources in Massachusetts and New York. Thelittle experience that is available to date suggests that externalities considerations favor theselection of natural gas projects over coal, with renewables receiving little or no advantage vis-avis natural gas.
Externalities rulemakings have generated significant controversy, and, in some cases, lawsuits orlegislative efforts have been pursued to overturn these actions. These controversies havegenerally made it difficult to implement externalities considerations in any meaningful way. Forthis reason, several states and utilities are pursuing other avenues to promote "cleaner" energysources. These activities include the use of "green RFPs" (request for proposals), capacity setasides, and regulatory incentives or mandates for the development of renewable energy sources.
Discussions with representatives of the biomass industry, the electric utility industry, and stateregulatory agencies confirmed many of the foregoing observations regarding the current utilitymarket environment for biomass generation and biomass externalities. It was noted that thepublic perception of biomass development varies widely. The environmental characteristics ofbiomass projects can be viewed as both potential positives and negatives but, generally, biomassexternalities are considered to be more favorable than those associated with coal but lessfavorable than those of natural gas or other renewables-based resource options. Severalrespondents also noted, as we have here, that the treatment of greenhouse gas offsets will be animportant factor in the relative externalities valuation of biomass projects.
Finally, it was noted that only a handful of electric utilities have direct experience with biomasspower development because the majority of this development has been carried out by nonutilitydevelopers. State utility regulators also appear to have paid less attention to the relative benefitsof biomass development compared to traditional fossil-fuel-based generation. Most stateregulators focus on traditional project economics.
Recommendations
Based on our analysis of externalities considerations In the states, we make the followingrecommendations to the biomass industry:
• Because the valuation of CO2 emissions can represent a large fraction of the totalemissions-related externalities adder, the wood and agricultural waste industries shouldactively work toward achieving recognition among all states and utilities that theseresources are greenhouse gas neutral because of carbon sequestration during growth. Todate, only one state has formally adopted this policy even though it has been consideredin several other states. Greenhouse gas neutrality considerations should also be extendedto landfill methane and municipal solid waste resources because of their potential toreduce formation or seepage of methane, a potent greenhouse gas, in landfills.
VB

TP-5789
• Given that, to date, the valuation and application of environmental externalities haveproved difficult in many states, the biomass industry should also emphasizenonenvironmental benefits, such as economic development and job creation, thataccompany biomass development. Although some states have rejected attempts atquantifying economic externalities, this approach may succeed if it can be shown that theeconomic benefits represent real gains over other options, such as the use of indigenousrather that imported (out-of-state) fuels. This would require broadening the externalitiesdebate in many states.
• In addition to explicit externalities valuation, the biomass industry should pursue andsupport efforts to establish renewable energy set-asides or green RFPs. Because biomasstechnologies are well established in the marketplace, biomass projects are well positionedto compete against other renewables in these types of solicitations.
Vlll

TP-5789
Table of Contents
1. Current Assessment of Biomass Power Generation 1
2. Biomass Combustion and Externalities 13
3. Trends in State Externalities Consideration 30
4. Perceptions of Biomass Power Technologies 43
5. References . . . . . . . . . . . . . . . . . . . . . . . . . . . . . . . . . . . . . . . . . . . . . . . . . . . .. 51
List of Figures
Figure 1-1. Nonutility-developed, wood-fired capacity by region - 1992 3
Figure 1-2. Nonutility-developed, agricultural-waste-fired capacity by region - 1992 . . .. 3
Figure 1-3. Location of waste-to-energy plants by state . . . . . . . . . . . . . . . . . . . . . . . .. 7
Figure 1-4. Location of landfill methane power plants by state . . . . . . . . . . . . . . . . . .. 11
List of Tables
Table 1-1. Biomass Capacity and Generation (1992) . . . . . . . . . . . . . . . . . . . . . . . . .. 2
Table 2-1. Chemical Analysis Comparison of Specific Biomass and Coal Fuels. . . . . .. 14
Table 3-1. Values for Environmental Factors Applied to a Coal Plant in New York. . .. 31
Table 3-2. Comparative Externality Values Adopted for CO2 Emissions 32
Table 3-3. Representative Environmental Adders for States with MonetizedExternalities .. . . . . . . . . . . . . . . . . . . . . . . . . . . . . . . . . . . . . . . . . .. 33
Table 3-A. Status of Externalities Consideration in the States 39
Table 3-B. Representative Emissions Factors and Heat Rates for New Plants Utilized inTable 3-3 .. . . . . . . . . . . . . . . . . . . . . . . . . . . . . . . . . . . . . . . . . . . .. 41
IX

TP-5789
1. Current Assessment of Biomass Power Generation
Introduction
Of all the renewable energy sources, biomass energy has seen the greatest growth over the lastdecade. Spurred by the Public Utility Regulatory Policies Act of 1978 (PURPA) and taxincentives for nonutility generators (NUGs), biomass-based power generation now provides morethan 50 billion kWh of electric energy from 10,000 MW of installed capacity. Theoverwhelming majority of this capacity, primarily wood-based, has been developed by the nonutility sector (Table 1-1).
This section reviews the recent development history and the prospects for future development ofthe major biomass resource types: wood and agricultural (ag) waste, municipal solid waste(waste-to-energy), and landfill gas.
Wood and Agricultural Waste
Wood is the leading biomass energy resource primarily due to its use as a boiler fuel in the pulpand paper and forest products industries. The lumber industry satisfies close to 750/0 of its energyneeds through direct wood combustion and the pulp and paper industry has achieved a 55%aggregate fuel contribution from wood (Williams and Porter 1989). Electricity is also generatedfrom wood, using cogeneration technology. It is estimated that more than 6000 MW of nonutility-owned, wood-fired generating capacity was in place at the end of 1992, up from 200 MWof grid-connected capacity in 1980.1 Agricultural waste plants, utilizing such diverse feedstocksas bagasse, rice hulls, rice straw, nut shells, crop residues, and prunings from orchards andvineyards, account for more than 500 MW.
Electric utilities were early leaders in dedicated power generation from wood (Williams andPorter 1989). In 1983, Washington Water Power Company constructed the nation's first utilitygrade wood plant, a 46-MW plant in Kettle Falls, Washington. This plant was followed in 1984by a 50-MW project in Burlington, Vermont, operated by the Burlington Electric Department.Prior to these two plants, Northern States Power, in 1979 and 1980, had converted two fossilplants in Wisconsin to bum wood and refuse-derived fuels (Musso 1991). However, direct utilitydevelopment of wood-fired power plants has not progressed beyond a few isolated projects.Although most utilities have not been directly involved in wood and ag waste projectdevelopment, utility subsidiaries have participated in the financing and development of manyprojects.
Nonutility producers have been responsible for the bulk of activity in biomass power plantdevelopment. The driving forces behind this development were PURPA and favorable federaltax treatment, such as the business energy tax credit for biomass projects that was in effectbetween 1980 and 1988 and rapid depreciation schedules (Williams and Porter 1989). Along with
IThe 1991 estimate is from (EEl 1993) and the 1980 estimate is from (Rinebolt 1990).

TP-5789
Table 1-1. Biomass Capacity and Generation (1992)(Nonutility except where noted)
Energy Source Capacity Generation(MW) (billion kWh)
Wood/Wood Waste 6,381.8 32.2
Agricultural Waste 568.2 3.1
Municipal Solid Waste 2,228.9 12.0
Landfill Gas 418.3 2.3
Utility Biomass 464.0 2.1
I Total Biomass I 10,061.2 I 51.7 ISources: (EEl 1993) and (USDOE 1993b)
other nonutility developers, many wood and ag waste developers took advantage of favorablypriced utility contracts that were made available in California, Maine, and other states to bothimplement PURPA and displace oil-fired generation. The Pacific Gas and Electric Company(PG&E) has reported that more than 900 MW of biomass capacity (more than 700 MW basedon wood and ag waste) were developed within its service territory during the 1980s (Turnbullet al. 1991).
Development of wood and ag waste plants has been most prevalent in those regions withestablished biomass production industries (Figures 1-1 and 1-2). PURPA has encouraged manyforest products companies to sell excess power to utilities in addition to meeting their own energyneeds. Some states such as Alabama, California, Georgia, and North Carolina have promotedthe use of wood waste for energy production. For example, using oil overcharge funds,Alabama's state energy office subsidizes the interest on bank loans to small secondary forestproduct industries that purchase wood boilers. And California has conducted a wood wastedemonstration program (Rader et al. 1990).
In addition, the development of wood and ag waste power plants has often helped address localenvironmental problems. For example, the Kettle Falls plant has helped reduce localized airpollution resulting from the burning of waste wood in sawmill wigwam burners withoutemissions controls (NREL 1993). Ag waste plants built in the Central Valley in California havehelped cut down on the traditional open field burning of agricultural residues (Turnbull et al.1991).
Fuel preparation and transportation are often the major expense items for wood and ag wasteplant operation. To minimize fuel transportation expenses, plants must generally be sited withina 50-mile radius of the fuel source. This same criterion also tends to limit plant size to 50 MWor less (Williams and Porter 1989). Because fuel handling requirements can be extensive,biomass-fueled plants are typically more labor intensive than fossil-fueled plants (Turnbull et al.1991).
2

TP-5789
MW
2000
1500
1000
500
oSouth E. South New Pacific W. South Middle E. North Mountain W. North Alaska!
Atlantic Central England Central Atlantic Central Central Hawaii
Figure 1-1. Nonutility-developed, wood-fired capacity by region - 1992
MW
250
200
150
100
50
o1.3 0.3 0.3
Pacific Alaska! South W. South W. North E. South Middle E. North New MountainHawaii Atlantic Central Central Central Atlantic Central England
Figure 1-2. Nonutility-developed, agricultural-waste-fired capacity by region - 1992
Source for both figures: (EEl 1993)
3

TP-5789
Urban wood wastes are emerging as an important fuel source. Municipal landfills and transferstations are the primary sources of urban wood waste along with building demolition sites.Urban waste wood has an important cost advantage because suppliers may often pay a tippingfee for disposal. However, this waste wood can contain as much as 20% to 30% non-woodmaterials, such as paints, metals, preservatives, binders, and resins. State or local air qualityregulations may require these materials to be removed before the waste wood is combusted(Peterson 1991). In California, plant operating permits clearly specify the types of fuels that canbe burned. Operators of current facilities may be hesitant to apply for special permits for fearof reopening the original plant operating permits to public scrutiny (Morris 1991).
The expiration of the federal renewable energy tax credits, plummeting avoided cost rates, andintensifying competition from fossil fuels have posed obstacles for the continued developmentof wood-fired plants. Avoided costs have fallen from as high as lO¢/kWh in the early 1980s tobetween 3¢ and 5¢/kWh today (Swezey 1993). As a result of these conditions, wood-firedcapacity additions fell from 614 MW in 1989 to between 250 and 300 MW in 1990 (USDOE1993a).
In addition, regional or local slowdowns in economic acnvity have caused perturbations inagricultural and wood waste supplies and prices. The closing of a Weyerhauser plant inWisconsin resulted in Northern States Power losing 15% of the wood supply for the FrenchIsland wood-fired power plant (Musso 1991). Conversely, the closing of a Wisconsin particleboard plant created a financial loss for two sawmill operations that provided biomass boiler fuelto the plant (Sweet 1991; Talbot 1991).
Wood and agricultural waste fuel shortages and disruptions have been especially severe innorthern California. Waste fuel prices soared in 1989 and 1990 when more than 200 MW ofwood and agricultural waste plants came on-line in the Pacific Gas and Electric Company(PG&E) service territory, straining local fuel supplies and prompting some developers to truckin waste fuel from hundreds of miles away to assure power generation during PG&E's lucrativepeak hours (Turnbull, et al. 1991). Fuel prices climbed again in 1991 when the state recessioncaused a downturn in logging operations, reducing fuel supplies and raising prices. These fuelprice movements have threatened the financial viability of several biomass plants in California,especially those plants without a captive fuel source (EUW 1992). Furthermore, federal loggingrestrictions in the Northwest imposed to protect spotted owl habitat may further reduce futuretimber harvests and strain fuel supplies. As a result of the waste fuel market turmoil, a wastefuel brokering industry is developing in California and the Pacific Northwest to broker wastefrom sawmills, logging operations, and municipal waste landfills. These brokers may play animportant future role in providing more stability in the waste fuel market (Turnbull, et al. 1991).
Wood waste plants have been the target of some public opposition because of concerns that thedemand for wood resources may eventually lead to clear-cutting. Communities have alsoobjected to power plants because of noise and traffic disruption resulting from the trucking ofwood supplies. Other environmental impacts include dust, noise, and smoke from plantoperations and odor from fermenting fuel piles (Williams and Porter 1989). Although woodwaste plants emit considerably less sulfur and nitrous oxides (SOx and NOx, respectively) thanfossil fuel plants, emissions of particulates, trace volatile organic compounds (VOCs), and carbon
4

TP-5789
monoxide are higher (CTOPM 1990). A number of proposed plants have been abandonedbecause of public opposition.
However, wood and ag waste plants also offer certain environmental advantages, in addition tolower SOx and NOxemissions. Plants can provide a market for biomass wastes, encourage betterforest management practices through thinning of dense or older stands, and avoid open burningof wastes (CTOPM 1990). For example, California allows air emissions offsets to facilitiesburning agricultural and forestry wastes that otherwise would have been burned in open fields(Morris 1991). And although the combustion of biomass wastes releases carbon dioxide (C02),a greenhouse gas, wood and ag waste plants release no net CO2 emissions (in a sustainablymanaged system) because the plants and trees absorb CO2 during growth. Wood and ag wastecombustion might also displace methane emissions that would have resulted from thedecomposition of these materials (Chupka et al. 1992).
Despite many obstacles, wood and agricultural waste projects continue to move forward, althoughat a slower pace than in the past. One possible reason is that these projects have attractiveeconomics due to their utilization of traditional combustion technologies and low-cost wastefeedstocks. Compared to other renewable technologies, biomass projects have fared relativelywell in utility competitive bidding solicitations. Through 1992, more than 640 MW of woodprojects had been selected through bidding, more than any other renewable energy resource,although these figures are dwarfed by natural gas and coal projects (Swezey 1993).
Further growth could be achieved through repowering existing plants with higher efficiencyconversion technologies, utilizing larger plant sizes and co-firing with other fuels (Turnbull etal. 1991). Wood may provide an attractive co-firing option (with coal) for utilities facingrequirements for significant reductions of sulfur dioxide (S02) emissions under the 1990 CleanAir Act Amendments (CAAA). The Tennessee Valley Authority (TVA) is conducting casestudies at three of its coal plants to determine the feasibility of co-firing wood-derived fuel andcoal. Besides the value of reducing S02 and NOxemissions, TVA is investigating wood co-firingas a CO 2 mitigation option in anticipation of future legislative or regulatory requirements (Goldand Tillman 1993). TVA estimates that enough unused milling and logging residues exist in itsservice territory to supply fuel for 200 to 400 MW of wood co-firing capacity at a retrofit costof about $50/kW (or about $410/kW for whole tree combustion) (McGowin and Gold 1992; Goldand Tillman 1993).
Additional market growth could be realized by the use of fast-growing, biomass-based energycrops, such as hybrid poplar or switchgrass. Energy crops could be grown on crop set-asidelands as a means of protecting against soil erosion and crop overproduction, as well as being aneconomic stimulus to rural areas. The Energy Policy Act of 1992 (EPACT) includes a 10-year,1.5¢/kWh production tax incentive for new biomass power systems that utilize such "closed loop"biomass resources. However, several programs, administered by the U.S. Department ofAgriculture (USDA), create disincentives for the production of biomass-based energy crops. Forexample, federal crop support payment programs discourage planting of new types of crops. Andacreage reduction programs pay farmers not to plant a portion of their farm land if it isdetermined that there will not be a market for the commodity crop that would have been planted(USDOE 1993a). Both of these programs come up for Congressional reauthorization in 1995.
5

TP-5789
Additional market opportunities might be realized by the introduction of biomass integratedgasifier turbines. Gasifier systems could achieve higher conversion efficiencies of 40% or more,compared to 25% for conventional wood systems, and have projected capital costs of $1,000 to$1,250/kW, lower than the $1,500 to $2,500/kW for new steam-fired, wood plants. States withlarge forest resources and little biomass electric capacity may offer market growth opportunities(Anderson 1991). Still, improved market conditions, such as higher avoided cost rates, may beneeded if the wood and agricultural waste industries are to match the growth of the 1980s.
Waste-to-Energy
Waste-to-energy (WTE) represented one of the fastest growing renewable energy industries ofthe 1980s. As of early 1993, there were 171 WTE steam and electric plants operating or underconstruction in the United States, with a net electric generating capacity of 2962 MW, up from78 plants and 538 MW in 1986. Another 21 plants, totaling 797 MW, are in either advanceddevelopment or under construction (Berenyi and Gould 1993).
Several factors contributed to the industry's growth over this period. Landfills have becomeincreasingly difficult to site because of public opposition, lack of sites, and increasing costs tocomply with environmental standards. Furthermore, many existing landfills were nearing theirrated capacity. In 1987, it was estimated that two-thirds of all municipalities would exhaust theirexisting landfill capacity by the tum of the century (Williams and Porter 1989). WTE plantsquickly became the waste disposal option of choice.
Like many other renewables, WTE plants were also eligible for a number of federal financialincentives such as the 10% investment tax credit (through 1985) and rapid depreciation schedules.The enactment of PURPA in 1978 gave developers a market for electricity generated from wastecombustion. Until. PURPA, process steam represented the sole energy-related market productfrom waste combustion. Today, revenues from electricity sales can offset from 35% to 70% ofthe annual cost of a WTE plant (Williams 1991).
Waste-to-energy plants are operating or are planned in 37 states (Figure 1-3). The Northeast hasthe greatest concentration of plants, followed by the South, the North Central region, and theWest. High tipping fees and a shortage of landfill capacity have led to the greater developmentin the Northeast. Through the 1980s, the WTE industry expanded at a rapid rate; 65 plants cameon line between 1988 and 1990 alone (Berenyi and Gould 1993). Despite this activity, many ofthe factors that drove WTE development in the past have changed, and growth in the WTEindustry has slowed dramatically (Kiser 1992b). For example, the number of projects inconceptual planning has dropped from 139 in 1988 to 27 in 1992, and 77 planned projects havebeen canceled since 1991 (Berenyi and Gould 1993).
The Tax Reform Act of 1986 eliminated the federal investment tax credit, accelerateddepreciation, and interest deduction provisions for WTE projects and also scaled back the abilityof states to finance projects with tax-exempt municipal bonds. As a result, there were two surgesin WTE development, one at the end of 1985 to take advantage of the expiring federal taxincentives and another through the end of 1987 to utilize the higher state cap on private activity,tax-exempt municipal bonds (Williams 1991).
6
TP-5789
.-
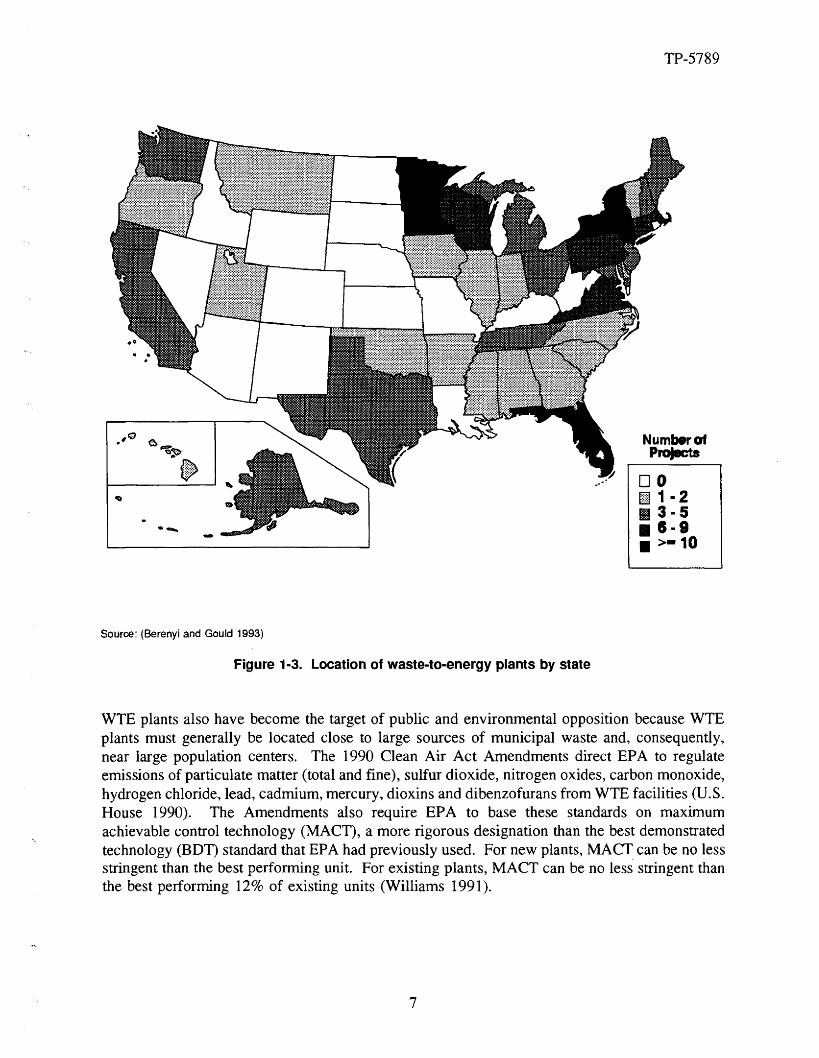
Source: (Berenyi and Gould 1993)
Figure 1-3. Location of waste-to-energy plants by state
Number ofProJects
00EI 1 • 2111 3 - 5• 8-8• >-10
WTE plants also have become the target of public and environmental opposition because WTEplants must generally be located close to large sources of municipal waste and, consequently,near large population centers. The 1990 Clean Air Act Amendments direct EPA to regulateemissions of particulate matter (total and fine), sulfur dioxide, nitrogen oxides, carbon monoxide,hydrogen chloride, lead, cadmium, mercury, dioxins and dibenzofurans from WTE facilities (U.S.House 1990). The Amendments also require EPA to base these standards on maximumachievable control technology (MACT), a more rigorous designation than the best demonstratedtechnology (BDT) standard that EPA had previously used. For new plants, MACT can be no lessstringent than the best performing unit. For existing plants, MACT can be no less stringent thanthe best performing 12% of existing units (Williams 1991).
7

TP-5789
In 1991, EPA issued New Source Performance Standards (NSPS) for WTE plants with individualunits exceeding 250 tons-per-day capacity (225 metric-tons-per-day)? (Broom et al. 1993). Forplants that began construction after 1989, the new regulations require emissions control of heavymetals and organic carcinogens by more than 99%, of sulfur dioxide and hydrogen chloride by90% to 95%, and of nitrogen oxide by about 40%. For operating plants, the regulations requirethe control of heavy metal emissions by 97%, of organic emissions by 95%, and of acid gasesby about 75%. EPA must also still issue regulations to reduce mercury, lead, and cadmiumemissions from WTE plants (Williams 1991). Draft regulations are expected to be publishedduring 1994.
Besides air emissions, concerns have been expressed about the ash produced by WTE facilities.Although the waste combustion reduces MSW volume by 90%, the resulting ash must still bedisposed of. Fly ash, which is the ash captured from stack gases, typically has higher heavymetal concentrations than bottom ash, which is the ash that falls to the bottom of the grate orfurnace. Bottom ash makes up about 90% of the total plant ash. Many WTE operators mix thefly and bottom ash before landfill disposal (Williams 1991). A growing quantity of ash fromWTE facilities is being managed in ash-only facilities called ash monofills, which incorporateimpermeable liners, leachate management systems, and groundwater monitoring, in separate areasof landfills known as ash monocells that are dedicated to ash disposal and equipped with linerand leachate management systems (Berenyi and Gould 1993).
In the past, environmental groups have advocated that WTE incinerator ash be tested for toxicity.If incinerator ash were classified as toxic or hazardous, WTE plant operators could be requiredto send the ash to a hazardous waste facility, which could raise ash disposal costs sharply. Inthe 1990 Clean Air Act Amendments, Congress exempted ash from hazardous waste designationfor two years, assuming that this issue would be addressed in the reauthorization of the ResourceConservation and Recovery Act (RCRA) in 1992 (Williams 1991). However, Congress did notachieve RCRA reauthorization within this time frame. The U.S. Supreme Court is separatelyconsidering the issue.'
2A facility with two units of 170 tons per day (150 metric tons per day) each, for example, would not be affectedby these regulations. The EPA regulations classify WTE facilities into two categories: large (unit sizes from 250 to 1100tons-per-day [225 to 1000 metric tons per day]) and very large (unit sizes over 1100 tons per day [1000 metric tons perday)).
3The case before the Supreme Court originated in the mid-1980s when the Environmental Defense Fund (EDF) filedlawsuits against Wheelabrator Technologies in New York and the City of Chicago in Illinois. In both cases, EDFrequested that toxicity tests be conducted on WTE ash and the waste be managed according to the test results. EDF lostboth cases at the district court level and appealed unsuccessfully in New York. In Illinois, however, the U.S. SeventhCircuit Court of Appeals ruled that WTE ash must be managed as a hazardous waste material if it fails a toxicity test.The City of Chicago appealed the ruling to the U.S. Supreme Court. In May 1992, the Supreme Court asked for an issuesbrief from the Solicitor General of the U.S. Department of Justice, which sought assistance from EPA. EPA ruled thattwo of RCRA's statutory goals - protecting the environment and promoting resource recovery from non-hazardous waste- are supported by the hazardous waste exemption for WTE ash (Kiser 1992). The Supreme Court declined to hear thecase and directed the Court of Appeals to reconsider its decision given the EPA ruling (SW&P 1993a). In January 1993,the appeals court reaffirmed its original ruling, and in June 1993, the Supreme Court agreed to hear the case (IPR 1993).
8

TP-5789
With national WTE ash management policy uncertain, some states have set their own standards.A 1989 National Solid Wastes Management Association survey found that 900/0 of all states havesome type of ash management guideline: 80% required ash testing before disposal and 74% hadash-specific landfill design criteria. Nevertheless, there was no consensus among states on howash should be managed (Kiser 1992b).
Many WTE critics argue that not enough attention is being focused on alternative methods ofwaste reduction, such as recycling, and that WTE plants encourage growth in garbage to ensurethe profitability of these plants. In response, many WTE companies are developing materialsrecovery services either separately or in conjunction with WTE plants (Charles 1992). Recyclingprograms will be a component of more than 90% of WTE plants now planned compared to justover 70% of existing plants (Berenyi and Gould 1993). Finally, some states have consideredmoratoriums on WTE projects in favor of emphasizing recycling and regional solid wastemanagement plans."
Because of the increasing difficulties in developing and siting WTE plants, the recent industrytrend has been to build larger plants to serve a region rather than a single county or municipality.This trend suggests that these plants will receive waste from a wider geographic area, eithercountywide or a combination of counties and/or cities, towns, and townships. The gain in designcapacity is also attributable to the move toward large, mass-burn incinerators away from smaller,modular units (Berenyi and Gould 1993). However, some industry observers predict that modularunits will make a comeback as incremental units for major metropolitan areas that alreadypossess large WTE plants. In addition, increasing emphasis on recycling may decrease the solidwaste available for WTE plants, forcing a downsizing in future plants and opening a market nichefor smaller, modular plants. Working against modular plants is the high relative cost ofcomplying with more stringent air quality regulations (Williams 1991).
Although several factors point to an industry slowdown, the WTE industry remains optimisticabout its future. The industry predicts that recycling will not by itself solve disposal needs andWTE will again appear attractive relative to landfilling (Williams 1991). Even so, marketconditions may be rocky given the loss of financial incentives, increasing environmental andregulatory requirements, and the sometimes substantial local opposition to WTE plantdevelopment (Berenyi and Gould 1993). Newer plants are incorporating a total system conceptthat integrates materials recovery with waste combustion, and landfilling of any remainingnoncombustible and nonrecyclable materials (Kiser 1993).
Landfill Methane
Through 1992, 127 plants that recover landfill gas for sale to an end-user or utility were in placein the United States. Another 60 plants are in some stage of planning or development. Of theoperating plants, 89 generate electricity and have a total installed capacity of 377 MW. Availabledata suggest that another 192 MW of capacity will be realized from plants under development(HCI 1993).
4Massachusetts and New Jersey placed temporary moratoriums on WTE plants that have since expired (SW&P
1991a: SW&P 1992b). Moratoriums were proposed, but not adopted. in Florida, Michigan. and Wisconsin (Charles 1992).
9

TP-5789
Like many renewable energy industries, the landfill methane industry owes its current scale tothe passage of PURPA in 1978. Until then, methane gas was largely vented or burned off toavoid explosions at landfills. A few projects producing pipeline-quality gas were in place beforePURPA, but project development occurred only slowly. With the advent of PURPA, landfill gasexploitation became more economical for developers. The development of the landfill gasresource for power generation is less costly because lower quality, medium-Btu gas can beutilized. By contrast, projects dedicated to gas sales must clean the gas to pipeline quality (highBtu), which typically involves removing carbon dioxide (Williams and Porter 1989).
The landfill methane industry expanded rapidly through the 1980s, from 32 projects on line in1984 to 117 projects in 1991 (Berenyi and Gould 1991). Recent activity has been spurred in partby the unconventional fuels tax credit, which is the primary remaining federal tax incentive forthe industry.' The credit is tied to the price of oil and equals $5.53 per barrel of oil(95.3¢/MBtu) equivalent for 1992 (TB&A 1993; PFM 1993). Under EPACT, the credit wasextended for new facilities placed in service by December 1996. High utility avoided cost rateshave also been an industry driver. These rates and a plentiful supply of large landfills have madeCalifornia and New York the leading states for landfill methane development (Figure 1-4). Otherleading states include illinois, Pennsylvania, New Jersey, Michigan and Wisconsin (Berenyi andGould 1991).
Avoided cost payments to landfill gas developers under PURPA have declined in conjunctionwith falling fossil fuel prices. Existing landfill methane plants receive an average buyback rateof 6.18¢/kWh but planned facilities will only receive 4.58¢/kWh.6 Perhaps because of thesefactors, an increasing number of landfill methane developers are bypassing utilities and sellingelectricity and/or gas directly to industrial or institutional customers to obtain higher prices.More than a quarter of existing and planned landfill methane facilities are (or will be) sellingelectricity and/or gas directly to institutional or industrial customers. This trend is particularlyapparent in southern and north central states, which have relatively low avoided cost rates, wheremore than 40% of projects sell (or will sell) directly to end-use clients (Berenyi and Gould 1991).In other cases, some landfill methane plants are simply closing down because of poor economics(Thorneloe 1992).
New environmental regulations for landfills may surface as a future industry driver. In October1991, the EPA issued final regulations governing the location, design, and operation of landfillsthat became effective for most landfills in 1993. The new EPA standards include requirementsfor xomposite liners, leachate collection systems, and groundwater monitoring (SW&P 1991c).Landfills that cannot meet the new standards must close by October 1996 (SW&P 1992a). Thehigh cost of complying with the EPA regulations (an estimated $330 million annually for 6,000landfills) will likely force some landfills to close and lead to the development of larger landfills
SUsers of the credit must meet several restrictions. The credit must be used in the year in which the fuel is sold andthe credit is decreased in direct proportion to any grants, tax-exempt bonds, or other subsidized financing used to developthe project. The developer must also sell the fuel to an unrelated party. The availability of the credit is generallyregarded as critical to the development of landfill methane projects (Williams and Porter 1989).
6Based on limited data in (Berenyi and Gould 1991).
10

TP-5789
Number ofPf'OIects
DO001-2rI 3· 5.8·8• >= 10
Source: (Hel 1993)
Figure 1-4. Location of landfill methane power plants by state
to serve regions rather than individual cities or counties (Levin and Smith 1991). This outcomemay provide new prospects for landfill methane plants.
Draft EPA regulations have also been issued on emissions of nonmethane organic compounds(NMOCs). NMOCs include benzene and vinyl chloride and contribute to urban smog. It isestimated that solid waste landfills emit about 1% of the NMOCs released by stationary sourcesnationwide (SW&P 1991b). The proposed regulations would require any landfill, existing ornew, with a design capacity that exceeds 111,000 tons (l0 1,000 metric tons) and emits 167 tons(150 metric tons) per year of NMOCs, to install gas collection equipment that would remove 98%of the NMOCs by weight (Levin and Smith 1991). Under the proposed regulations, annualmethane emissions from landfills also would be reduced by about 60% or 10.5 million metrictons per year.
EPA originally estimated that the regulations would affect about 620 existing landfills and 87new landfills (Levin and Smith 1991). More recently, this estimate has been scaled down toabout 200 existing and 15 planned landfills (SW&P 1993b). Although the regulations might
11

TP-5789
result in CO2 and other emissions, such as NOx' if methane combustion is increased, EPA hasnoted that net environmental gains would result because of the methane and NMOC emissionsreductions that would occur (methane is a more potent greenhouse gas than CO2) (USEPA 1991).Although the draft regulations would only require landfill owners to install gas collectionequipment, some have speculated that developers might be stimulated to install energy recoverysystems to help offset the costs of the collection system (SW&P 1992c). Final regulations areexpected to be issued in 1994 (SW&P 1993b).
The recently released federal Climate Change Action Plan directs the EPA to formulate a toughrule to reduce methane emissions from landfills in order to increase the amount of organiccompounds that must be recovered by landfills and promote additional recovery of methane gas.The plan also directs EPA to launch outreach and technical assistance programs for methanerecovery at landfills and coal mines (Clinton and Gore 1993).
Despite the overall environmental benefits, some landfill methane plants have been closedbecause of state concerns about NOx and carbon monoxide emissions (Thorneloe 1992).Developers may face difficulty locating new plants in areas that are in noncompliance withfederal standards for one or more of these criteria pollutants (Berenyi and Gould 1991). In mostcases, however, public opposition to landfill methane projects is generally minimal and plants areeasily sited, especially when the plant will mitigate safety concerns or odor releases from thelandfill.
Conclusions
Of all the renewable energy sources, biomass energy has seen the greatest growth over the lastdecade. Spurred by PURPA and tax incentives for nonutility generators, biomass-based powergeneration now provides more than 50 billion kWh of electric energy from 10,000 MW ofinstalled capacity. The overwhelming majority of this capacity, primarily wood based, has beendeveloped by the nonutility sector.
Biomass power development has not been free from public concerns. The majority of theseconcerns relate to siting. Several projects that have not succeeded in allaying public concernshave been terminated. Nevertheless, biomass generation is a viable power option. Economic andfinancial issues presented by slower growth, the reduction of federal incentives, and lower fossilfuel prices present the greatest near-term obstacles to further growth in biomass powerdevelopment.
12

TP-5789
2. Biomass Combustion and Externalities
Introduction
Many of the environmental externalities associated with fuel combustion are a function of thechemical properties of the fuel and the characteristics of the combustion process itself. In thissection, we briefly describe and delineate the properties and characteristics of biomass fuels andcombustion technologies. We then present information on the types of externalities commonlyidentified and considered in utility resource planning deliberations and their relationship tobiomass-specific characteristic s.
Biomass Combustion
Fuel combustion characteristics vary depending on the specific chemical and physical propertiesof the fuel as well as the nature of the combustion process. The chemical composition of a solidfuel can be characterized in two different ways. An ultimate analysis refers to the majorchemical elements of a fuel based on molecular weights while a proximate analysis describes therelative shares of four constituents: fixed carbon, volatile matter, moisture, and ash. The sumof the fixed carbon and volatile matter represent the combustible fraction of the fuel (Hougan,et al. 1943) Table 2- I provides comparative chemical analyses of wood, municipal refuse, andcoal fuels.
Several general observations can be made from Table 2-1. First, biomass fuels have higher levelsof volatile matter and lower levels of fixed carbon. The greater the fixed carbon content, andthus the lower the degree of oxygenation, the higher the heating value of the fuel (Klass 1983).The higher level of volatiles makes biomass more reactive than coal and more amenable togasification at lower temperatures: 1472° to 1832°F (800° to 1000°C) compared with 2400° to2600°F (1315° to 1427°C)(Bain and Overend 1992). Second, the ash content of a typical woodyfuel is significantly less than for coal, although the ash content of municipal refuse is higher.Third, the higher moisture content of biomass fuels increases fuel combustion residence time anddiverts combustion energy to fuel drying, thus reducing the overall efficiency of fuel combustion(Hollenbacher 1992). Finally, solid biomass fuels are typically low in sulphur content, whichresults in relatively minor S02 emissions upon combustion (Bain and Overend 1992).
While the chemical content of a fuel is an important determinant of its environmental emissionscharacteristics, the efficiency of the combustion process, i.e., the percentage of combustiblecomponents converted to energy, is also important. A number of factors influence biomasscombustion efficiency such as the amount of air present in combustion, the amount of turbulenceto promote fuel mixing, fuel distribution rates and patterns, and fuel moisture content. High ashlevels can lead to slagging and fouling in boilers increasing draft losses and impeding heattransfer (Hollenbacher 1992). In the sections that follow, we summarize the key characteristicsof biomass combustion technologies and their impact on environmental emissions.
13

TP-5789
Table 2-1" Chemical Analysis Comparison of Specific Biomass and Coal Fuels
Analysis Jack Pine Waste Municipal Refuse Bituminous Coal
Proximate (%)
Fixed Carbon 23.6 9.1 55.8
Volatile Matter 74.2 65.9 33.9
Ash 2.2 25.0 10.3
Moisture 40.0 18.4" 7.3"
Ultimate (%)
Carbon 53.4 47.6 75.5
Hydrogen 5.9 6.0 5.0
Oxygen 38.6 32.9 4.9
Nitrogen 0.1 1.2 1.2
Sulfur 0.0 0.3 3.1
'(Klass 1983)
Sources: Except where otherwise noted: Jack Pine Waste (Hollenbacher 1992): Municipal Refuse/Bituminous Coal (OTA 1980).
Wood and Agricultural Wastes
As noted in Chapter 2, the majority of biomass power plants are fueled by wood wastes. Utilitiesoperate wood-fired power plants in Vermont, Michigan, Wisconsin, Washington, and Oregon.These plants range in size from 10 to 50 MW. A number of nonutility power producers alsooperate dedicated wood-fired power plants in many states. However, the majority of woodburners encompass some 2000 commercial and industrial facilities that utilize various types ofwood wastes for power generation and/or process heat needs. The lumber, wood products,pulpwood, and paper industry are the largest such users of wood for fuel (RT! 1991).Agricultural waste-fueled (ag waste) power plants have had only limited application in the U.S.Ag waste combustion technologies are similar to wood and wood waste energy technologies,though there are significant differences in fuel handling and combustion characteristics.
In the following subsections, we present an overview of the main technologies for generatingpower from the combustion of wood and agricultural wastes. The basic differences in approachrelate primarily to the design of the combustion chambers, the operating temperature, and the heattransfer mechanism (Klass 1983).
Direct-Fired Steam Turbine Technologies
Biomass-fired steam turbine power generation technology is very similar to the technologyutilized in conventional fossil-fuel power plants. The biomass fuel is combusted in a boiler to
14

TP-5789
produce steam that drives a turbine and generator. Both the low density and low heating valueof biomass, relative to coal, require that the combustion area be oversized relative to a coal firebox for a given power output. Most biomass-fired steam cycle plants utilize single-pass steamturbines. However, improved design features, such as reheat and regenerative steam cycles andsupercritical steam turbines, have been transferred from larger scale steam turbine generators(USDOE 1992). Direct-fired steam technologies include pile burners, stationary or traveling gratecombustors (spreader-stoker firing), and atmospheric fluidized-bed combustors (bubbling andcirculating beds).
Pile Burners. Pile burners were very common fifty years ago for burning wood waste. Thetypical pile burning combustor had multiple refractory-lined cells. Each cell had a lowercombustion chamber, like a dutch oven with a grate floor, and an upper combustion chamber.Most of the fuel was burned on the grates. while the volatiles were burned in the secondarycombustion zone. Ash was removed manually from the furnace by shutting down a cell, allowingit to cool, and removing the ash by breaking it up and taking it from the furnace.
The primary advantages of pile burners were simple design, low construction costs, and thecapability of handling high moisture content wood mixed with dirt. Disadvantages includedlower efficiencies relative to other biomass combustion technologies, the need to periodically shutdown cells for cleaning, and a combustion process that was very difficult to control. Pile burnersare available today that have improved combustion processes and control and automatic de-ashingsystems. However, the degree of environmental emissions control is less than that available inother biomass direct combustion technologies (Hollenbacher 1992).
Grate Combustors. Grate combustors have fuel feeders that evenly distribute the biomass overa traveling or stationary grate where the fuel burns. An air chamber is located beneath the grate,which supplies the air through the grates to the fueL With a stationary grate, ashes are dumpedinto a pit, while a traveling grate rotates so that the ashes are conveyed and discharged into anash hopper (USDOE 1992).
The traveling grate stoker is relatively insensitive to load swings, thus providing greater loadcontrol than the stationary grate. Different furnace wall configurations have been developed forthe traveling grate stoker to be used in conjunction with various overfire air schemes to promotemore complete combustion. In order to meet NOx emission standards in the 1980s, manufacturersdesigned a staged combustion process. This process increased overfire air levels fromapproximately 20% to 50%. Modern traveling grate boilers can be designed to handle variousfuels; however, they have limited fuel switching capability because of their design. Travelinggrate boilers have exhibited few slagging problems with biomass fuels. An example of atraveling grate boiler system is the Honey Lake Power Co. plant in Wendel, California(Hollenbacher 1992).
A third type of spreader stoker that has gained popularity since the 1950s is the slopedreciprocating water-cooled grate or Kablitz grate. Design advantages include simplicity, inherentlow fly ash carryover characteristics, and low maintenance because of fewer moving parts(Hollenbacher 1992).
15

TP-5789
Suspension-Fired Boilers. Suspension-fired boilers are a very recent development for biomasscombustion and are somewhat comparable to pulverized coal-fired boilers. In these boilers,combustion occurs while fuel particles are pneumatically suspended in an air stream. To datethese boilers have had only limited application for biomass because of the additional cost of fuelpreparation; suspension firing requires an elaborate fuel preparation and feeding system for propercombustion.
Several different fuel burners have been developed for suspension-fired boilers, including thescroll-type, register fuel/air mixture, cyclonic burners, and vertical cylindrical burners. In asuspension-fired boiler, air and fuel are mixed in a turbulent environment to promote completecombustion. Because of the potential explosion hazard created by dry, fine fuel particles,suspension-fired fuel handling systems require more careful design than conventional biomassfuel handling systems (Hollenbacher 1992). An example of current suspension-fired boiler designis Oxford Energy's 28.7-MW facility in Williams, California, which is fueled by rice residues.
Co-Firing. In addition to dedicated combustion, wood waste can be co-fired with fossil fuels.Co-firing can provide benefits in terms of emissions reductions and local economic development.However, because of differing fuel characteristics, extensive wood fuel preparation or boilermodifications may be necessary at higher wood fuel input levels to avoid boiler efficiencydegradation, depending on the type of boiler; cyclone boilers are more tolerant of fuel differencesthan pulverized coal boilers (Tillman et al. 1993). Co-firing of wood in pulverized coal boilers(the most common boiler type) generally requires some drying of the wood and pulverizing withthe coal, or addition of a dump grate to facilitate combustion of the larger wood feedstock sizes(Wiltsee et al. 1993). Cyclone boilers can accept larger size fuel particles and higher moisturecontents (up to 50%) because the cyclone slagging process enhances fuel residence time and thusmore complete combustion (Tillman et al. 1993).
The Tennessee Valley Authority has recently conducted case study analyses of wood co-firing,at up to 15% heat input, in several of its coal-fired boilers and concluded that conditions atnumerous plants may be favorable for wood co-firing (Tillman et al. 1993).
Fluidized-Bed Combustors
In fluidized-bed combustion, wood is injected into the combustion chamber through ports andburned in suspension. Air fluidizes a bed of hot, granular material, such as sand, which mixeswith the wood. Fuel particles are dispersed throughout the bed, where they are quickly heatedto ignition temperature. Because of the turbulence, the combination of air, sand, and woodresembles a boiling liquid that has excellent heat transfer properties. Since operatingtemperatures are typically below 1700°F (927°C), thermally induced nitrogen oxides areminimized. The staged combustion also minimizes fuel-bound nitrogen oxide formation.Fluidized-bed combustors can handle many different types of fuels such as high-ash wood waste,agricultural residues and slow burning char, although with some performance degradation(USDOE 1992).
There are two types of fluidized-bed combustors: bubbling (BBC) and circulating (CFBC). Thedistinguishing feature is the velocity of air through the unit. In bubbling beds the velocity is 5
16

TP-5789
to 12 ft/s (1.5 to 4 m/s), while in CFBC it is up to 30 ft/s (9 mls). The CFBC technology hasthe following advantages over bubbling bed: increased combustion efficiency, improvedabsorption of acid gases, less prepared fuel and sorbent, and elimination of feeding problems bythe use of underbed or overbed feeding systems. Disadvantages of CFBCs are the need forgreater fan horsepower to maintain higher velocity through the bed and higher capital costs insmall sizes (15 to 30 MW) (Wiltsee et al. 1993).
Three CFBC companies have operating U.S. projects. Gotaverken Energy Systems has two 25MW plants in California that burn wood and agricultural waste. The design moisturespecification is very dry (20% to 45%) when compared to conventional wood burning plants(40% to 55%). A 25-MW, CE-Lurgi CFBC is operating in Fresno, California, which is fueledby urban wood waste, in-forest residues, and agricultural waste. This design can handle fuelswith moisture contents ranging from 8% to 60%, very low to high fuel densities, and heatcontents from 6500 to 9500 Btu/lb (15 to 22 MJ/kg). The third design, B&W-Studsvik CFBes,utilizes primarily wood chips. Three units are in operation, one in California and two in Maine.Several CFBCs experienced fuel fouling problems in the first year of operation. High sodiumand potassium levels, such as those found in almond and pistachio shells, can defluidize the bed,so that when the boiler is cooled down, the agglomerations freeze into a solid, slag-like mass thatmust be manually removed (Hollenbacher 1992).
Several bubbling bed combustors were built in the United States in the early 1980s to fill amarket niche for low air emissions and a low cost, smaller sized power plant. Several bubblingbed manufacturers later modified their designs to fit between the traditional bubbling bed designand the CFBe. The fluidization velocities were increased, thus increasing the combustion recyclerate and providing for higher fluid bed combustion loadings.
JWP (formerly EPI) has been the major proponent of the bubbling bed design. The first suchproject was a utility boiler retrofit (15 MW) in Wisconsin in 1981. As of 1991, JWP also hadfive biomass-fueled BBC power plants in California ranging in size from 12 to 32 MW. Theseplants burn a variety of fuels including urban wood waste, agricultural wastes, and wood residues.Yanke Energy Inc. designed and built two 9-MW BBC power plants in California using modifiedand reconditioned boilers and steam turbine-generators. These plants utilize mill wastes, forestslash, and hogged urban wood waste. Both of the plants use ammonia injection to controlnitrogen oxides to meet strict California emission requirements (Hollenbacher 1992).
Advanced Technologies
Whole Tree Burning. Whole tree burning is a relatively new concept, currently underdevelopment, designed primarily to reduce wood harvesting and handling costs. Feedstock sizelimitations are determined by the dimensions of the furnace wall opening where whole logs arefed into the furnace. Other than a saw located at the furnace wall opening, no fuel processingequipment is utilized. Waste heat is used to dry the trees before combustion, reducing averagemoisture content from about 50% to under 250/0. Whole tree combustion occurs in three phases:combustion of tree piles at 1093°C in which the wood is volatilized into hot gases with unburnedchar falling into grates; high temperature combustion of the volatile gases at 1482°C above thelogs; and low temperature combustion of the char below the bed. Flue gases from the
17

TP-5789
combustion process are used to reduce the feedstock moisture content. With the waste heatutilization, overall power plant efficiency is projected to range from 33% to 36%, compared to20% to 30% for conventional wood power plants. The heat rate for the entire system isestimated to be about 10,000 Btu/kWh (10.5 MJ/kWh), as compared to 12,000 to 16,000Btu/kWh (12.5 to 17 MJ/kWh) for conventional wood power plants (Chupka et al. 1992).
Direct-Fired Gas Turbine. A direct-fired gas turbine bums shredded biomass fuel withcompressed air. Particulates are removed from the gas stream and the clean gases are thenexpanded through the turbine portion of the gas turbine. One design produces both electricityand thermal energy with efficiencies around 70%. This technology has been tested at the pilotscale in both the U.S. and Canada. However, a number of technical issues still need to beresolved, including pressurized fuel feeding and ash removal, gas stream cleanup and turbineblade fouling (USDOE 1992). A 3-year demonstration project has been initiated by the WesternResearch Institute with cofunding from DOE and Power Generating, Inc. (McCarroll and Partanen1993).
Biomass Gasification/Gas Turbine. Thermal gasification is a two-step, endothermic process inwhich biomass is thermochernically converted into a low or medium Btu gas. The first reactionis pyrolysis where volatile components of the fuel are vaporized at temperatures below 600°C.Char and ash remains as the non-vaporized by-products of pyrolysis. The second process, charconversion, gasifies and/or bums the carbon that remains after pyrolysis. In this reaction, somechar is burned to provide heat for pyrolysis and the remaining char is gasified. Much of thetechnology for biomass gasification is adapted from coal gasification (USDOE 1992).
Converting biomass into a gas provides the opportunity to integrate biomass gasifiers with simplecycle, combined cycle, or steam-injected gas turbines. Overall conversion efficiency is increasedthrough the use of both the thermal and chemical energy of hot product gases in the power cycle.Air-blown fixed-bed and fluidized-bed gasifiers are the preferred options for biomass gasification.Oxygen-blown gasifiers produce higher-Btu gas and faster reaction rates than air-blown systems,but they also have higher capital costs because of the oxygen requirements (USDOE 1992). Anumber of small-scale, biomass gasifier systems are being operated in the United States today,designed to produce low-Btu gas as a substitute fuel or for steam cycle electricity production(Bain and Overend 1992). Additional biomass gasifier systems are currently being developedunder DOE sponsorship.
Fixed-Bed Gasifiers. When compared to other air-blown gasifier designs (fluidized-bed,entrained flow) the fixed bed provides the largest fraction of gas energy in chemical form. Inone type of fixed-bed design, the updraft gasifier, biomass is fed from the top of the gasifier, thenundergoes drying, pyrolysis, char gasification, and char combustion as it settles to the gasifierbottom. The product gas is removed from the top of the gasifier and ash is removed from thebottom. Blast air and steam are injected into the gasifier to keep the ash above meltingtemperatures and to facilitate char conversion.
The product gas from this process has a low velocity and temperature and a high heating value.However, the low operating temperature creates a large amount of condensable oils and tars inthe product gas, which may pose difficulties with hazardous waste disposal. The filtering effect
18

TP-5789
of the bed and low stream velocities create a product gas with low particulate concentrations.The volatility of biomass combined with the excellent heat transfer design and high peaktemperatures in the fixed-bed design provide for a carbon conversion efficiency of around 99%and a hot gas efficiency that ranges from 90% to 950/0. Fixed-bed gasifier design and operationare relatively simple but require large, dense, uniformly sized fuels (USDOE 1992). There islittle practical operating experience with the fixed-bed design.
Fluidized-Bed Gasifiers. Like the fluidized-bed combustor, a fluidized-bed gasifier uses acontinuous feed of biomass and an inert heat-distributing material, such as sand, which is"fluidized" by an oxidant and/or steam. Pyrolysis and char conversion take place throughout thebed and are not localized. The superior mixing in the fluidized-bed provides excellent heat andmass transfer, which yield uniform temperatures, better fuel-moisture utilization, and fasterreactions. These benefits allow higher throughput capabilities that can reduce the size and capitalcost of the gasifier relative to other types of gasifiers. Because the average temperature in afluidized bed is greater than in a fixed bed, more tars and oils are converted into permanentgases. Product gas composition, carbon, and hot gas efficiency for the fluidized-bed process aresimilar to fixed-bed designs. Fluidized-bed designs can handle smaller, less dense, and lessuniform feedstocks. The major difficulty with the fluidized-bed design is the high particulatelevel in the raw gas, which is nearly 100 times greater than in the fixed-bed design (USDOE1992).
Gasifier/Gas Turbine Power Cycles. High-efficiency gas turbines have been developed utilizingsuperior clearance control and advanced compressor and turbine blade design. These simplecycle gas turbines have reached power generation efficiencies of around 36%. A fluidized-bedgasifier coupled with a high-efficiency gas turbine may be an attractive future option for simplecycle operation (USDOE 1992).
Combined cycle plants with power efficiencies approaching 50% could be a viable option forintermediate or base load operation. The steam-injected gas turbine (STIG) is an adaptation ofthe combined cycle in which the turbine exhaust gases are used to generate steam in a heatrecovery steam generator. Steam is injected into the combustor and/or turbine sections of the gasturbine. The steam injected into the turbine provides additional mass to help drive the turbine,yet does not consume power from the turbine's compressor. Also, more power can be takenfrom the turbine section because the specific heat of the steam-air mixture is twice that of air.Adding steam in the combustion zone lowers flame and gas temperatures and prevents up to 800/0of uncontrolled NOx formation (USDOE 1992).
The addition of compressor intercooling to the STIG cycle (intercooled STIG or ISTIG) can raisethermal efficiency and shaft power output. The ISTIG can double the output of a simple gasturbine, raising the overall power efficiency to more than 50%. One shortcoming of STIG cyclesis the cost of the large quantity of demineralized water, which is consumed by the system andreleased to the atmosphere. Complete recovery of the water could be accomplished for a modestcapital investment and incremental penalty on heat rate (USDOE 1992).
Biomass Pyrolysis. Biomass pyrolysis produces an oil that can be used in gas turbines or for cofiring in existing pulverized coal- or oil-fired boilers. An important advantage of pyrolysis oils
19

TP-5789
for power production is that they could be transported to power plant sites more cost effectivelythan the biomass feedstocks.
Pyrolysis is performed by applying heat to prepared biomass feedstocks that are usually less than2-mm thick and have less than 8% moisture content. The biomass particles are thermochemicallyconverted to a mixture of non-condensable gases, char particles, pyrolysis oil vapors, and watervapor. The particle residence time must be kept under two seconds so the pyrolysis oil vaporswill not chemically transform into permanent gases or more viscous polymers. After leaving thereaction chamber, the various constituents flow through a cyclone separator where particulatesare removed. The pyrolysis oil vapors are then condensed to form a black, viscous, medium Btumixture of organic compounds. Sixty to eighty percent of the feedstock is converted to biomassfuel oil. The residual noncondensable gases can be collected downstream from the condenser andburned to provide process heat to dry the feedstock o~ heat the reactor (USDOE 1992).
There are three primary types of pyrolysis reactor designs: vortex, tubular transport, and fluidizedbed. In the vortex reactor design, a carrier gas (steam or nitrogen depending on the fuel oilapplication) and a dry feed (1% to 2% moisture content) are injected into a cylindrical reactionchamber. The fuel enters the reactor in a spiral pattern over the inside surface of the cylinderwhere it is heated. Partially pyrolyzed particles and char exit the reactor tangentially, while thegaseous product is separated and flows to' cyclones. Particles that are removed tangentially arerecycled to the carrier gas stream and enter the reactor for a second time. Recycling of theparticulates provides the following advantages: reduced char levels, ability to pyrolyze largerfeedstocks (up to 3 mm), and a different residence time for solid particles and vapors. The endproduct consists of 67% pyrolysis oil, 13% char, and 14% net pyrolysis gases. The char andnon-condensable gases are burned to provide process heat for drying and the pyrolysis.
The tubular transport reactor design uses a thermal mixer and a tubular transport reactor toconvert biomass to a liquid fuel oil. A solid heat carrier, externally heated by residual char, noncondensable pyrolysis gases, or another source, is fed into a thermal mixer with processedbiomass. The biomass undergoes an extremely rapid temperature increase in the thermal mixer.Total residence time for the biomass particle is below one second. The heat transfer mediumand biomass are then fed into the tubular transport reactor where the biomass is decomposed.Typical yields from this design are 75% pyrolysis oil and equal amounts of char and noncombustible gases (10% to 15%).
In the fluidized-bed design, an inert material and the biomass are supported by steam, flue gas,or non-condensable vapors. Biomass is fed from the top or side of the fluidized-bed reactor, withthe product gas taken from the top. Reactor temperature ranges from 450° to 500°C andfeedstock residence time is from 2 to 8 seconds. Liquid yields are from 65% to 80% of thefeedstock.
Biomass pyrolysis R&D has been conducted on a small scale, involving four primaryorganizations: the National Renewable Energy Laboratory (NREL) and Georgia Tech Universityin the United States and the University of Waterloo and ENSYN Engineering in Canada.Remaining technical issues include (1) potassium and other trace metals from the oil can formcompounds during combustion which can plate hot gas-path components; (2) pyrolysis oil can
20

TP-5789
polymerize when heated; and (3) because pyrolysis oil is acidic, special materials must be utilizedfor the product storage tanks (USDOE 1992).
Waste-ta-Energy
Because of land and environmental concerns, landfill disposal of municipal solid waste (MSW)has become increasingly problematic. As a result, many communities have encouraged thedevelopment of waste-to-energy projects. There are four primary pathways for converting wasteinto energy: (1) mass burning, (2) production of refuse-derived fuel, (3) biological digestion, and(4) pyrolysis (MRI 1988).
The average composition of MSW by weight in the United States is approximately 70% organicmatter and 30% inorganic matter. Paper, at 37%, represents the largest fraction of MSW,followed by yard waste (180/0), metal and glass (15%), plastic (80/0), food wastes (7%), wood(60/0), miscellaneous materials, which include leather, rubber and textiles (50/0), and inert materials(40/0) (Brower et al. 1993). MSW composition can vary widely due to the season, thesocioeconomic characteristics of the local population, and the amount and type of commercialand industrial waste. The average moisture content of MSW is around 25%, but this can varyconsiderably with the weather. A waste-to-energy plant must be designed for the full range ofMSW delivered to the plant, not just the average composition (Richards et al. 1990). Theaverage Btu content for MSW can vary from 4450 gross Btu/lb (l0 Ml/kg) for MSW to 7660gross Btu/lb (18 Ml/kg) for RDF.
Mass Burn
Mass burn systems combust solid waste as received. In newer facilities, the waste generally goesthrough a pre-combustion processing step to remove recyclable materials. There are two generalsize classifications of mass burn systems: (1) field-erected systems, which are usually mediumto large scale (200 to 3000 tpd [180 to 2700 metric tons per day]), and (2) factory fabricated(modular) systems, which are smaller scale (up to 300 tpd [270 metric tons per day]) (Richardset al. 1990). The trend has been away from modular systems because of the high cost per unitsize of environmental controls. Both refractory-lined and water wall furnaces have been used inmass bum systems. Refractory-lined furnaces recover heat downstream of the furnace using awaste heat boiler. A variation of the refractory-lined furnace uses modular starved-aircombustors, which consist of a refractory-lined furnace with a deficient supply of combustion air,followed by a second-stage chamber to finish the burning, and a heat recovery boiler to generatesteam. Water wall furnaces use both water walls in the combustion chamber and convection backpass tubes for heat recovery and steam generation. The combustion of MSW takes place onmoving grates (MRI 1988).
Refuse-Derived Fuel
Refuse-derived fuel (RDF) systems improve the fuel properties of MSW by pre-processing thefuel to reduce particle size, remove noncombustibles, and homogenize the fuel. Strictly speaking,however, RDF is any fuel product that results from the processing of municipal solid wastes.Besides solid fuel, RDF can also include liquid and gaseous fuels that are derived from thechemical or biological conversion of processed waste materials.
21

TP-5789
Most of the commercial experience with RDF in the United States has been with "coarse" and"fluff' solid RDF materials. Coarse RDF is a shredded MSW material while fluff RDFundergoes additional processing to produce a low ash, fluffy material that has a heating valueclose to western lignite. It is usually less than 2.5 inches (6 centimeters) in size, with most ofthe noncombustibles removed (MRI 1988).
RDF combustion can be accomplished in dedicated boilers or by co-firing with fossil fuels inexisting utility boilers. Between 1972 and 1988, nine U.S. utilities co-fired almost 1 million tons(900,000 metric tons) of RDF with the RDF accounting for, on average, 10% of the total fuelrequirements, by thermal input. Only four of the nine utilities continue to co-fire RDF with coal:Ames (Iowa) Municipal Electric Co.; Madison (Wisconsin) Gas & Electric; the Lakeland(Florida) Department of Electric and Water Utilities; and Baltimore (Maryland) Gas & Electric.The other five utilities discontinued the RDF co-firing for various reasons, mostly economic (SRI1992). Since this time, two additional utilities, Otter Tail Power (South Dakota) and NorthernStates Power (Minnesota), have initiated RDF co-firing.
Because RDF is a lower quality fuel than the fossil fuels usually burned in utility boilers, RDFco-firing can negatively affect power plant performance and operation. The higher ash contentof RDF increases slagging and fouling of the boiler as well as the amount of boiler ash that mustbe treated and disposed of. The slagging reduces heat transfer and thus plant efficiency andincreases operation and maintenance costs for the boiler. For a new plant specifically designedfor coal and RDF, co-firing RDF at 15% heat input can reduce boiler efficiency by 1.5% to 2.5%,compared to dedicated coal combustion; in a retrofitted unit, efficiencies can drop by up to 3.5%(SRI 1992).
The primary issue involved in RDF co-firing is whether the potential operational disadvantagescan be offset by fuel cost savings and emissions reductions (e.g., S02) compared to the use ofconventional fossil fuels. While the performance record for RDF co-firing has been spotty, manyof the operational problems have been surmounted through evolutionary improvements in RDFfuel quality and plant design improvements such as bottom ash dump gratesand the avoidanceof high heat-release boilers that are prone to slagging (SRI 1992).
By far, the greatest use of RDF, representing more than 650 MW of gross generating capacity,is in dedicated boilers using spreader-stoker technology.' In a spreader stoker, the RDF isburned partially in suspension, with the non-combustibles dropping to the traveling grate orstoker. The long residence times of this process allows for more complete combustion of theRDF fuel. A recent survey of 16 operating RDF production facilities using semi-suspensionfiring found that these plants operate at an average 92% of design capacity (SRI 1992).
Biological Digestion
Refuse landfills produce various gaseous by-products. Anaerobic bacteria, which thrive in anoxygen-free environment such as a covered landfill, promote organic decomposition. This
7Although dedicated to RDF combustion, these boilers may also employ alternate fuels such as coal, natural gas, orother biomass fuels.
22

TP-5789
decomposition produces landfill gas (LFG), which typically consists of 55% methane, 44% CO2,
and 1% assorted trace gases. The CO2 is soluble in water and generally leaches out of thelandfill. Methane remains in the gaseous phase and tends to migrate up from the landfill.Methane is flammable and volatile and can cause explosions at concentrations as low as 5% to15%. Control strategies include venting the methane to the atmosphere, flaring, or other typesof combustion. With the enactment of PURPA and various tax incentives, landfill gas recoveryand combustion for electricity generation became more prevalent (Williams and Porter 1989).
Methane gas is recovered by drilling wells to a depth of 30 to 100 feet (9 to 30 meters) andpiping the gas to a central collection facility where the gas is extracted by utilizing industrialcompressors. The gas also can be cleaned through a filtering system. A 30-acre (12-hectare)landfill, containing 1 million metric tons of solid waste to a depth of 40 feet (12 meters), willgenerate enough gas to fuel a I-MW turbine (Williams and Porter 1989). The average heatingvalue of raw LFG is around 490 Btulscf (Berenyi and Gould 1991).
Pyrolysis
Pyrolysis technologies also can be utilized to convert MSW to gaseous or liquid fuels. The statusof these technologies has been described previously (see Wood and Agricultural Wastes).
Anaerobic Digestion of Animal Wastes
Animal wastes can be converted to biogas by anaerobic digestion. In 1987, U.S. farm animalsproduced some 42 million tons (38 million metric tons) of collectable waste, which is equivalentto 0.3 quads of thermal energy per year. Biogas from animal waste has a heating value ofaround 600 Btu/It' (22 MJ/m3
) , with a methane content of 60%, and a CO 2 content around 40%.Biogas can be directly combusted to provide space or process heat, as a boiler heating fuel, orto power engines to generate electricity.
Anaerobic digestion biologically converts animal wastes to a gas in the absence of oxygen. Thisprocess occurs in two phases. During the first phase, acid-forming bacteria convertcarbohydrates, fats, and protein in the wastes to simple acids. In the second phase, the organicacids are converted by methane-forming bacteria to methane, CO2, and small amounts ofammonia and hydrogen sulfide. The methane-forming bacteria are extremely sensitive to oxygen,temperature, pH, and the feedstock loading rate. These factors must be carefully controlled tobalance methane formers with acid formers. One limiting step of digester operation is that themethane-forming bacteria require four or more days to produce methane.
Digesters are airtight containers that can either be batch or continuously loaded. A concrete/steelvessel or covered lagoon can be used. Concrete/steel vessel digesters have been used in theUnited States because they are readily available. However, covered lagoon systems are becomingmore popular because they are less expensive, easier to operate, and require less maintenance.The process starts with the flushing of manure into a holding pit. The waste is mixed, and ifnecessary, solids are removed with a separator. The slurry is pumped to a grit removal chamber,then into the reactor where anaerobic conversion takes place. The reactor is maintained at aconstant liquid level with a temperature of at least 60°F 05°C). Biogas is pumped through a
23

TP-5789
special membrane to where it can be used as a fuel. The remaining waste product is treated andstored in a holding pond to be used as fertilizer (RTI 1991).
Because of their high capital costs combined with low avoided cost rates in many states,anaerobic digesters are currently not economically viable for bulk power generation, except underspecial circumstances where waste disposal costs are high (RT! 1991). However, digestersystems can provide for farm-specific energy needs, such as fuel for a boiler or furnace,refrigeration (utilizing an absorption chiller), or on-site electricity generation with an enginegenerator set (Safley and Lusk undated).
More than 20 methane recovery systems are operating at private and university livestock centersacross the country. Anaerobic digester systems may have high potential in areas with a welldeveloped agricultural and livestock economy. In North Carolina, for instance, it has beenestimated that anaerobic digesters installed at one-third of the large swine farms in the state coulddisplace the equivalent of nearly 5% of the state's average natural gas consumption. Otherimportant side benefits of these systems include reduced water pollution potential, deodorization,pathogenic threat control, and the fertilizer and animal feed by-products (Lusk 1993).
Biomass Externalities
Externalities, as considered in utility resource planning, generally relate to the environmentalimpacts of power generation or the combustion process itself. Also important, however, areexternalities that may occur over the entire fuel cycle, from fuel harvesting to combustion byproduct waste disposal. Economic externalities, such as local job creation, may also beconsidered. A final type of externality relates to the risk of overreliance on fuel sources that mayhave uncertain price streams, supply availability, or environmental characteristics. We presenta brief survey of these issues below.
Generation Externalities
The primary generation-related externalities of interest in utility resource planning proceedingsare air emissions. Secondary considerations relate to water quality, solid waste disposal, and landuse.
Air Emissions
Several different residual products are formed during the biomass combustion process. NOx
formation from biomass combustion is generally low because biomass contains relatively lowamounts of fuel bound nitrogen. Thermal NOx formation is highly dependent on temperature andoxygen concentration. Minimizing NOx formation is dependent on the ability to control flametemperatures below the diatomic disassociation level (~1700°F [~925°C]) (Hollenbacher 1992).Because of the relatively low sulfur content of most biomass fuels, there is very little S02formation during combustion. Biomass combustion-related S02 emissions are expected to be wellbelow even the more stringent S02 controls enacted in the 1990 Clean Air Act Amendments(Bain and Overend 1992). Furthermore, the potential exists to cofire biomass fuels with fossilfuels, primarily coal, in existing plants as an S02 reduction strategy.
24

TP-5789
The most problematic combustion-related air emissions for biomass are particulates, volatileorganic compounds (VOCs), and toxics. Although uncontrolled biomass combustion can leadto relatively high particulate emissions, these emissions can be reduced substantially through theuse of stack removal technologies such as fabric filters or electrostatic precipitators (Bain andOverend 1992). VOCs are an ozone precursor with the relative importance of their impactdependent on regional, seasonal and other factors (Ottinger, et al 1990).
Non-methane organic compounds (NMOCs) are primarily volatile organic compounds that canbe emitted from landfills; the methane in the landfills acts as a transport gas for NMOCs into theatmosphere. NMOC levels and composition differ greatly by landfill, and actual levels cannotbe determined until test wells are measured. Tests have shown NMOC concentrations to rangefrom 237 ppm to 14,294 ppm at selected landfills with concentrations affected by the quantity,age, pH level, and composition of the refuse, as well as the moisture content of the landfill andwhether the landfill has previously accepted hazardous waste. NMOCs can be removed fromlandfill gas through gas collection systems or gas combustion (USEPA 1991).
Waste-to-energy plants may emit a wide variety of air pollutants including dioxins, furans,cadmium, lead, chromium, mercury, arsenic, and nickel, as well as more well-known airpollutants like sulfur oxides, hydrogen chloride, nitrogen oxides, hydrogen fluoride, particulatematter, carbon monoxide and carbon dioxide (Ottinger, et al. 1990). Increasingly, federal andstate regulations are requiring waste-to-energy plants to control these pollutants. Indeed, wasteto-energy plants are among the first industrial emission sources to be regulated for heavy metaland toxic organic pollutants. With emissions control equipment, waste-to-energy plants typicallyremove more than 900/0 of hydrogen chloride; more than 990/0 of particulate matter; more than850/0 of sulfur dioxide; and between 35% and 69% of nitrogen oxide emissions, depending on thecontrol strategies used. Although data are limited, some plants remove between 900/0 and 990/0of heavy metals and 99% of toxic organics (Gaige and Halil 1992).
An important air emissions characteristic of most biomass resources is that net carbon dioxideor methane emissions can be very low or even negative. Trees and plants absorb CO2 duringgrowth, offsetting CO2 emissions released in combustion. Landfill methane projects can recovermethane, a potent greenhouse gas, that might otherwise be released to the atmosphere (Roos etal. 1993). And waste-to-energy plants can also provide a greenhouse gas benefit by avoidingfuture methane and CO2 emissions from landfills (Brower et al. 1993).
Biomass combustion systems can also provide offsets for air emissions from other combustionsources. For example, wood waste combustion can provide air emissions benefits if the woodwaste would have been burned as forest slash. One study concluded that a wood cogenerationplant would result in about one-tenth the level of particulate, VOC, and polycyclic organiccompound emissions, somewhat less carbon monoxide, and about the same level of nitrogenoxides emissions as open burning of the same amount of wood waste (Eco Northwest 1986). Thedevelopment of landfill gas systems can serve as a mitigation measure for controlling methaneemissions; methane is a greenhouse gas which, molecule for molecule, is approximately 20 timesmore harmful as a global warming agent than carbon dioxide. Worldwide, landfills are estimatedto contribute from 3% to 10% of total methane emissions (Ottinger et al. 1990).
25

TP-5789
Solid Waste
All fuel combustion results in ash by-products that require disposal. Woody biomass materialshave a lower ash content than coal, while MSW has a higher ash content. At the present time,both biomass and coal ash are classified as non-hazardous (USDOE 1992). Ash from woodpower plants is often utilized as a liming agent for acidic soils in agriculture and silviculture.In Maine, half of the wood ash generated by power plants is used in this fashion (Brower, et al.1993). Such beneficial uses of wood ash are expected to increase as the physical, chemical, andenvironmental characteristics of wood ash become better understood (Fehrs and Donovan 1993).
Ash from waste-to-energy facilities includes "fly ash" captured in air pollution control equipmentand residues found in the combustion chamber, or "bottom ash." About 8.5 million tons (7.5million metric tons) of ash are produced annually by waste-to-energy facilities (Kiser 1992a).Concerns have been raised about the presence of heavy metals, dioxins, and furans in ash fromwaste-to-energy facilities, and the potential for leaching of these materials from ash containedin landfills (Ottinger et al. 1990). However, recent studies suggest that ash from waste-to-energyplants may not be hazardous (Kiser 1992a).8
Water Use
Significant amounts of water are required for cooling in thermal power plants. As long as wastewater is non-hazardous, it can be handled by municipal water treatment plants. In general, thewater cooling requirements for biomass and coal power plants are comparable (USDOE 1992).
Land Requirements
Land requirements considerations generally pertain to the amount of land occupied by a powerplant facility and its adjoining infrastructure. There are no significant differences in the landrequirements of biomass and fossil generation plants (Feher 1984). However, also important ishow the land will be utilized and how this use relates to adjacent land use as well as land zoning.
Total Fuel Cycle Externalities
To date, environmental externalities considerations have primarily addressed emissions frompower generation. However, some observers have argued that power generation externalitiesshould be viewed from a total fuel cycle perspective; that is, the entire production cycle of a fuelshould be examined, from the mining or harvesting of the raw material, through transportationand power generation, to waste disposal. Biomass resources generally have fewer "back end"externalities than fossil fuels. For example, biomass combustion can provide waste reductionbenefits as well as offsets for air emissions from other combustion sources, particularly for CO2•
8Studies cited by Kiser note that the use of lime to control acidic gas air emissions hardens the ash and creates acement-like mixture with little leaching or run-off potential. In addition, the dioxins and furans sometimes found in theash become physically bound and thus are not released when the ash is disposed of. Finally, some studies have foundthat the levels of heavy metals in ash leachate from monofills are close to drinking water standards and lower than thetoxicity criteria used by EPA.
26

TP-5789
However, less clear are the comparative "front end" externalities associated with the biomassfeedstock, particularly if the industry moves to dedicated feedstock production. Dedicatedbiomass energy cropping can potentially reverse local ecosystem degradation, such as soilerosion, if it substitutes for traditional intensive agricultural production (Hughes and Ranney1993). On the other hand, some ecologists have expressed concern about the potential impactof bioenergy cropping on biodiversity if conducted in more diverse natural habitats (Hoffman etal. 1993).9 Ultimately, the nature and magnitude of these impacts will be a function of howcarefully larger scale, energy-dedicated biomass production is implemented (Hughes and Ranney1993).
At the present time, there does not appear to be a great inclination among the states to examineexternalities on a total fuel cycle basis. Externalities at the plant site, such as combustionemissions, are easier to quantify and regulate, while externalities beyond the plant site may bemore difficult to quantify. Also, total fuel cycle externalities may transcend state and regionalboundaries.
Nevertheless, some state commissions have considered the issue of total fuel cycle externalities.In Massachusetts for example, the Department of Public Utilities (DPU) has noted that as itbecomes more experienced with assessing externalities values from power plants, it wouldconsider proposals to expand the focus to earlier stages of the fuel cycle on a case-by-case basis(MDPU 1990). And in Oregon, the Public Utilities Commission (PUC), after consideration, alsodecided not to set external cost estimates for upstream or downstream fuel cycle impacts, otherthan air emissions, but left the door open for future consideration (OPUC 1993).
Economic Externalities
Studies have attempted to measure the economic benefits of biomass facilities. The U.S.Department of Energy estimates that the 6500 MW of wood-fired power plant development havegenerated more than 66,000 jobs, $10 billion in capital investment, more than $460 million infederal and state taxes, and $1.8 billion in personal and corporate income in 1992 (USDOE1993a). Other studies have examined regional or local economic benefits of biomass facilities.For example, it has been estimated that, in 1985, every 1000 tons (900 metric tons) of woodenergy consumed in the Northeast resulted in an average of 1.96 jobs and $46,634 of personalincome (COPM 1990). It has been estimated that, in the Southeast, every 1000 tons (900 metrictons) of black liquor consumption by industrial facilities in 1987 created $11,152 of net incomeand 0.77 jobs, while every 1000 tons (900 metric tons) of fuel wood created $23,942 of netincome and 1.39 jobs (TVA 1990).
Public entities receive royalties from the extraction of methane in landfills. Pacific Energy,which has developed 25 landfill methane projects, has paid out $13 million in royalties, mostly
9Hoffman et al. note that large-scale biomass plantations, if not carefully implemented, "could displace significantnatural vegetation and wildlife habitat. and reduce national and global biodiversity." They contend that "biomassplantations are typically envisioned as monocultures that will be intensively managed for maximal production" and as such"will have greatly reduced plant species diversity, and will probably provide good habitat for only a fraction of the faunathat would occupy the site with its natural vegetative cover."
27

TP-5789
to public entities. In addition, the company bought more than $4 million in outside goods andservices for its projects in 1991, and it has a annual payroll exceeding $3 million (Thorneloe1992). A recent study of renewable energy options in the Midwest region estimates that woodfired power plants utilizing dedicated, short-rotation woody crops as a feedstock would producemore jobs than coal-fired plants of equivalent capacity (Brower et aL 1993).
Despite these studies, few states have attempted to consider in-state economic development inresource planning decisions. Because the relative contribution of different types of projects toeconomic development is difficult to quantify, these considerations, where required, have tendedto be very general. However, in Nevada, utilities are required to calculate economic benefitsbased on: "(a) capital expenditures for land and facilities located within the state or equipmentmanufactured in the state; (b) the portion of the cost of materials, supplies, and fuel purchasedin the state; (c) wages paid for work done within the state; (d) taxes and fees paid to the stateor subdivision thereof; and (e) fees paid for services performed within the state" (NPSC 1991).
Some states have decided explicitly not to include local economic impacts of energy technologiesin externalities calculations, among them Oregon and Wisconsin. The Massachusetts DPUconsiders economic and social externalities (e.g., local job creation and support) as transferpayments instead of resource costs and declined to include local job creation in their externalitiesvalues (MDPU 1990). It has also been argued that economic impacts do not constitute truemarket externalities; that is, the direct impacts from employment and earnings, as well as indirectimpacts, are already reflected in the market price of electricity from a power generating facility(Sanghi 1991). Finally, it has also been noted that a state may not realize significant employmentand economic benefits unless it imports most of its fossil fuels (Brower et al. 1993).
Fuel Risk Externalities
Generally, a broad mix of fuel and resource types will provide diversity in utility power supplyand reduce the risks associated with overreliance on anyone particular fuel type. These risksmay come in the form of fuel price escalation, fuel supply interruptions, or future regulatorychanges. Some states have attempted to explicitly account for the value of fuel diversity inresource planning considerations. For example, in California, the PUC has determined thatprotecting against "the financial risks of relying too much on a given fuel" is important but hasyet to devise a methodology to accomplish this. For this reason, the PUC established a set-asideto acquire some new generating capacity from renewable energy resources as an interim measureto achieve fuel diversity (CPUC 1991; CPUC 1992).
At the same time, the Bonneville Power Administration (BPA) has stressed the importance ofanticipating "adverse business risks" in resource decisions. These risks include "mandatorycontrol and equipment retrofits; future regulatory constraints on operations or fuel use; taxesimposed on emissions, fuels, carbon, or other substances; court challenges from unsuccessfulenergy suppliers or public policy advocates; and responsibility to mitigate environmental damageoccurring in other phases of the fuel cycle because of BPA's financial ability to do so"(Buchanan 1992).
28

TP-5789
Conclusions
Many of the environmental externalities associated with fuel combustion are a function of thechemical properties of the fuel and the characteristics of the combustion process itself. Forinstance, woody biomass fuels generally have low sulfur and ash content, thus minimizing S02emissions and ash disposal requirements, but their low fixed carbon and high moisture contentmeans that these fuels have a relatively low heating value. Biomass power technologies maydiffer significantly in their combustion efficiencies. The basic differences relate primarily to thedesign of the combustion chambers, the operating temperature, and the heat transfer mechanism.Several advanced technology concepts offer the potential for increased combustion efficienciesand thus reduced combustion-related externalities.
Air emissions have received the greatest amount of attention in externalities deliberations.Although all new power generation plants must meet prevailing emission performance standards,utility resource choices may increasingly be impacted by how much a particular project canimprove on the prevailing standard. While some states have attempted to consider economic andfuel risk externalities as well, these considerations are not well developed at present.
29

TP-5789
3. Trends in State Externalities Consideration
Introduction
Increasingly, states are factoring the environmental and socioeconomic impacts of energy resourceand technology choices into electricity resource planning and procurement decisions. Over onehalf of the states incorporate externalities in some form in the planning process and several otherstates are currently considering it. This section introduces the different methodologicalapproaches being utilized by the states and assesses the degree to which externalitiesconsideration is actually impacting resource decisions.
Externalities Consideration
In recent years, integrated resource planning (IRP), or least-cost planning, has developed as amore comprehensive process for addressing electricity planning uncertainty. An important aspectof IRP is the consideration of a broader array of factors that may impact future utility operatingconditions. Among these many factors are non-market-related environmental and social concerns,or "externalities." In economics, a market externality occurs when some of the costs (or benefits)of a market transaction are borne (or received) by parties not directly involved in the transaction(Nicholson 1978). These externalities, therefore, represent costs or values that may not bedirectly reflected in the market pricing of the transaction.
Although externalities could encompass a wide variety of costs or values not captured by markettransactions, such as ancillary economic development that may occur because of resource ortechnology choices, states have initially focused on environmental externalities, especially airemissions from power plant operations. Some examples include health or aesthetics-relateddamage from air emissions or the market and business risks of potential regulatory controls ofgreenhouse gases. In 1992, 29 states had existing requirements to consider externalities inresource planning and/or acquisition; six states and the District of Columbia were consideringadopting externalities requirements; six states had considered externalities but had not imposedrequirements; and 10 states had not yet addressed the externalities issue (See Table 3-A at theend of this section).
Approaches to Incorporating Externalities
Several different approaches have been used to integrate externalities concerns into utilityresource planning (Cohen et al. 1990b). The most direct approach is the monetization ofenvironmental externalities. However, this direct quantification of externalities costs has metwith considerable controversy. A primary issue is whether control costs or damage costs areused. Control costs represent the additional costs of equipment to control emissions to somespecified level, while damage costs are estimates of the actual damage caused by environmentalemissions. Although most analysts agree that the use of actual environmental damage costs ispreferable, these costs are very difficult to estimate and may also be subject to revision over time(Buchanan 1990; Freeman et al. 1992). For this reason, emission control costs are often used asa proxy.
30
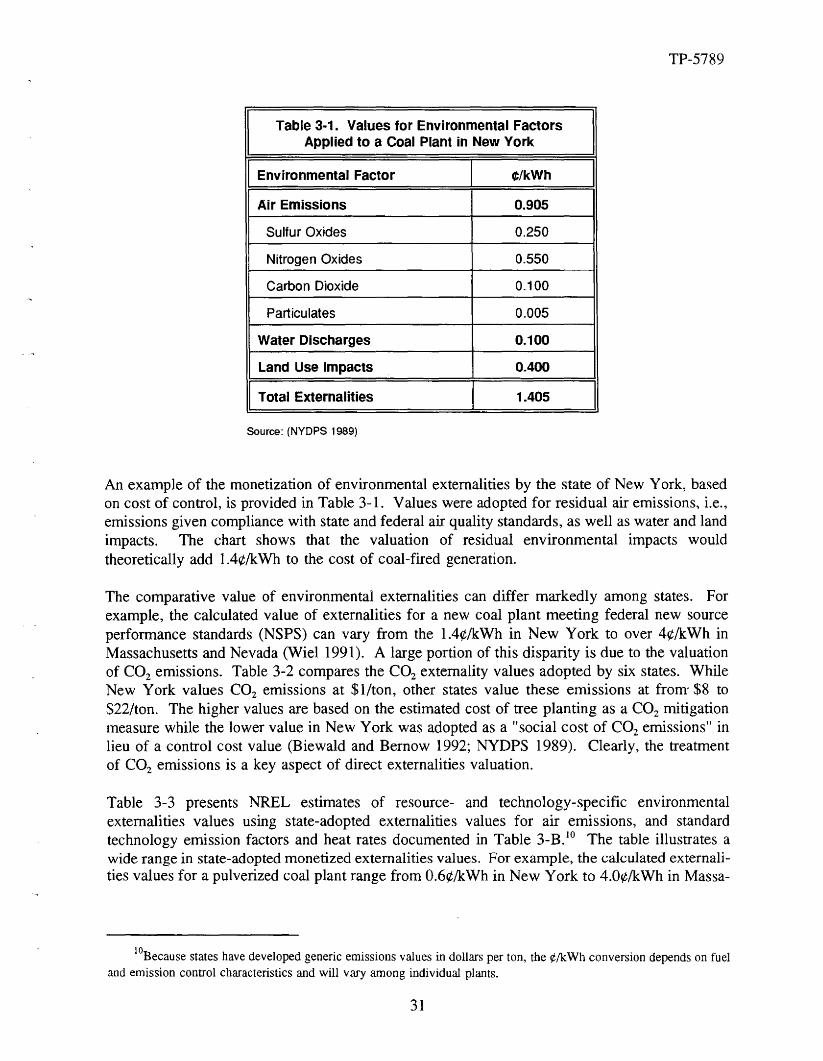
TP-5789
Table 3-1. Values for Environmental FactorsApplied to a Coal Plant in New York
I Environmental Factor I e/kWh IAir Emissions 0.905
Sulfur Oxides 0.250
Nitrogen Oxides 0.550
Carbon Dioxide 0.100
Particulates 0.005
Water Discharges 0.100
Land Use Impacts 0.400
I Total Externalities I 1.405 ISource: (NYDPS 1989)
An example of the monetization of environmental externalities by the state of New York, basedon cost of control, is provided in Table 3-1. Values were adopted for residual air emissions, i.e.,emissions given compliance with state and federal air quality standards, as well as water and landimpacts. The chart shows that the valuation of residual environmental impacts wouldtheoretically add 1.4¢/kWh to the cost of coal-fired generation.
The comparative value of environmental externalities can differ markedly among states. Forexample, the calculated value of externalities for a new coal plant meeting federal new sourceperformance standards (NSPS) can vary from the 1.4¢/kWh in New York to over 4¢/kWh inMassachusetts and Nevada (Wiel 1991). A large portion of this disparity is due to the valuationof CO2 emissions. Table 3-2 compares the CO2 externality values adopted by six states. WhileNew York values CO2 emissions at $1/ton, other states value these emissions at from' $8 to$22/ton. The higher values are based on the estimated cost of tree planting as a CO2 mitigationmeasure while the lower value in New York was adopted as a "social cost of CO2 emissions" inlieu of a control cost value (Biewald and Bernow 1992; NYDPS 1989). Clearly, the treatmentof CO2 emissions is a key aspect of direct externalities valuation.
Table 3-3 presents NREL estimates of resource- and technology-specific environmentalexternalities values using state-adopted externalities values for air emissions, and standardtechnology emission factors and heat rates documented in Table 3-B.1O The table illustrates awide range in state-adopted monetized externalities values. For example, the calculated externalities values for a pulverized coal plant range from O.6¢jkWh in New York to 4.0¢/kWh in Massa-
lOBecause states have developed generic emissions values in dollars per ton, the ¢/kWh conversion depends on fueland emission control characteristics and will vary among individual plants.
31

TP-5789
Table 3-2. Comparative Externality ValuesAdopted for CO2 Emissions
IState I $/ton INew York PSC 1.1
California PUC/CEC 8.0
New Jersey BPU 14.1
Wisconsin PSC 15.0
Nevada PSC 22.0
Massachusetts DPU 22.9.
Sources: (Biewald and Bernow 1992) and (WPSC 1992)
chusetts and Nevada." The wide disparity reflects the different values for certain air pollutantsadopted in each state. The magnitude of the externalities adders for biomass depends on whetherbiomass is penalized for CO2 emissions. To date, Massachusetts is the only state that hasexplicitly adopted a greenhouse-neutral policy for biomass resources, although Nevada has alsoformally considered the issue." With a full CO2 offset, the externalities adder for a wood projectin Massachusetts is lowered from more than 5¢/kWh to about I¢/kWh, which is less than naturalgas combined cycle plants that are considered to be the cleanest fossil fuel option. In those statesthat do not provide for CO2 offsets, the externalities adder for wood projects can be as high as5¢/kWh.
Landfill methane" projects can have an externalities adder ranging froml¢/kWh to 3¢/kWh.However, landfill methane plants collect and utilize methane gas that might otherwise escape intothe atmosphere. If values are applied for methane reduction, landfill gas plants can have anegative total externalities value, i.e., the value of the methane reduction more than offsets thepenalties assessed for SOx, NOx, and CO2 emissions. Three of the five states currently valuemethane emissions but do not allow negative values to be applied. Similarly, waste-to-energy(WTE) proponents have argued that WTE plants should receive an externalities credit for avoid-
IlThe California value represents PUC-adopted values for attainment areas. Other values calculated for Californiarange as high as 1O.2¢/kWh for nonattainment areas in the Southern California Edison (SCE) and San Diego Gas &Electric (SDG&E) service territories.
l~he Massachusetts Department of Public Utilities (DPU) has ruled that CO2 values will apply to "net, rather thangross, emissions of CO2 for facilities using renewable fuels, including wood, wood wastes and crop residues ... to theextent that the fuel supply is sustainably managed," provided that "the developer [must] prove that the fuel supply lot isreplanted annually with biomass of CO2 sequestration potential equal to the value of the reduction stated [in the powerpurchase contract)" (MDPU 1991). In the Nevada externality rulemaking, the PSC noted that "live biomass respirationcan displace some of the emissions of wood burning facilities," and "the use of municipal solid waste and wood wastein electricity generating facilities can displace emissions from decomposition in landfills." The PSC recommended thatdevelopers attempt to quantify these offsets. However, staff at both the New York and Wisconsin Commissions haveexpressed support for CO2 offsets for wood-based fuels (Putta 1993; lliff 1993).
32

TP-5789
Table 3-3. Representative Environmental Adders for States with Monetized Externalities13
(cents/kWh, $1992)
Fuel - Technology California Massachusetts . Nevada New York Wisconsin
Coal - Pulverized (NSPS) 2.2 4.0 4.0 0.6 1.7Coal- AFB 1.7 3.7 3.6 0.3 1.8Coal- IGCC 1.0 2.5 2.5 0.2 1.4Natural Gas - Combined Cycle 0.7 1.5 1.4 0.1 0.7Natural Gas - Combustion Turbine 1.1 2.4 2.4 0.2 1.2Wood - Steam 1.9 5.2/0.9 4.8/0.7 0.3/0.1 2.7/0.1Biomass - Advanced Gasification 1.2 3.0/0.3 3.0/0.3 0.2/0.1 1.7/0.1Municipal Solid Waste 1.8 4.9 4.7 0.3 2.2Landfill Methane 1.7 3.2/-2.8 3.0/-2.9 0.4 1.0/-2.7Geothermal - Flashed Steam <0.1 NA <0.1 NA NA
Solar - Trough with Gas Backup 0.7 NA 1.8 NA NA
NA =not applicable
ing landfill waste disposal and its associated emissions (Taylor 1990). However, no such creditis assumed for WTE plants in Table 3-3.
The way in which monetized externalities values are applied also differs among states. InMassachusetts, the values are applied directly to the economic cost of proposed generationsources in resource evaluation and competitive bidding processes. In New York, the externalitiesvalues have been used to develop weights for "non-price" factors in the state's competitivebidding procedure; the non-price component has typically accounted for about 25% of the totalproject scoring. Finally, in Nevada, the PSC established default externalities values to be usedin the comparison of the "societal costs" of resource options in utility resource planning." Inaddition to these three states, California uses monetized values for residual air emissions in utilityresource planning and the state's competitive bidding process in an effort "to balance manyelectric resource planning objectives along with environmental quality" (CPUC 1992). Thevalues are applied to both new and existing resources. IS
13All externalities values were calculated using standardized technology assumptions and emissions factors (see Table3-B at the end of this section). The variation in total externalities values among these states is largely an artifact ofdifferent CO2 emissions values (see Table 3-2). The California numbers represent PUC-adopted values for attainmentareas, Le., those areas in Clean Air Act compliance; values for nonattainment areas are higher. For wood and advancedbiomass, the first value represents total externalities without CO 2 offsets credit and the second value with CO2 offsets forthose state commissions that have explicitly considered offsets or in which commission staff have expressed support forCO2 offsets. For landfill methane, the second value represents a credit for methane emissions reductions for those statesthat have monetized methane emissions; however, none of these states currently allow negative values to be applied.Externalities values for noncornbustion renewables would be zero.
14However, the state's utilities are not obligated to use these values if they can justify different values. Both of thestate's utilities, in subsequent resource plan filings, have recommended values equal, on average, to 10% or less of thePSC values based on ratepayer willingness to pay studies (Henderson 1992).
ISFor one utility, the application of the externality and fuel diversity considerations has advanced its period ofresource need by eight years (Walther and Jurewitz 1992).
33
TP-5789
A second method that has been utilized to implement externalities considerations in the states isa percentage adder approach in which the cost of "dirtier" resources is increased by somearbitrarily determined percentage to reflect the cost of residual environmental damages.Conversely, "cleaner" resources may receive a percentage cost credit based on theirenvironmental benefits. This method was first implemented in the Northwest Power Act of 1980,under which conservation measures were to receive a 10% cost credit. In at least one case inthe Northwest, this 10% cost credit has been extended to renewable energy sources as well."
Adders may also serve as proxy values to be used in resource planning pending the developmentof more definitive values. In 1989, the Wisconsin PSC adopted a 15% cost credit for noncombustion-based generation sources in resource planning as an "interim step" to account for airemissions externalities pending the development of more advanced quantitative methods (Cohenet al. 1990a). And in 1990, the Vermont PSB adopted a 5% environmental adder to supply-sideresources "as an initial proxy for their unpriced environmental harm," pending further analysisof the external costs of different supply options (VPSB 1990).
Finally, the majority of states that have incorporated externalities into resource planning requireutilities to consider externalities in a qualitative manner. These "orders" range from fairlysuperficial treatment in planning to explicit weighting in resource procurement decisions. Forinstance, in Michigan, utilities have been asked to quantify environmental risks in scenariomodeling for their integrated resource plans. In Ohio, the PUC assesses whether utilities havequalitatively considered environmental impacts and costs in reviewing an integrated resource plan.And in Delaware and Utah, environmental impacts are used only for illustrative purposes and donot factor into resource decisions.
Externalities Issues
Several important issues have been raised concerning the application of externalities in electricityresource planning and procurement. First, electric utilities represent only one source of pollutionemissions, albeit a large one. Concern has been expressed that electric utilities are being singledout for treatment when externalities should be addressed across the entire energy system (Browne1991a). In its order instituting the use of externalities values, the California PUC stated that "ourmeasured actions are designed with the recognition that the utility sector of our economy is onlyone contributor (and not the largest contributor) to the state's air quality problems" (CPUC 1990).
Second, many externalities orders address only residual air emissions when energy use hasenvironmental and social impacts across the entire fuel cycle from mining and harvesting towaste disposal." Third, concerns have been expressed that the application of externalities toprospective plants only may actually degrade air quality by providing an incentive for utilitiesto operate older, dirtier units rather than build new, cleaner plants. For this reason, it has beensuggested that externalities values be applied to existing plants as well (Sutley and Works 1992).
16Puget Sound Powerand Lightextendedthe 10% cost credit to renewables in its 1991 requestfor proposals for 100200 aMW of long-term resources (Swezey 1993).
17See, for example, the discussion in (MDPU 1990).
34

TP-5789
Others recommend that utilities dispatch generating resources based on lowest total cost,including environmental externalities (Bernow et al. 1991). Opponents of this approach arguethat generation costs would rise under environmental dispatch as generation from lower cost,older units was displaced by new, cleaner units with higher direct operating costs, or if olderunits were prematurely retired. Also, environmental dispatch might require plants with higheremissions, designed for baseload operation, to be cycled on a regular basis, incurring efficiencyand performance losses (Browne 1991b). While full environmental dispatch may still be yearsaway, some elements are already being practiced. For instance, the Clean Air Act Amendmentsof 1990, by restricting the total sulfur dioxide (S02) emissions available to the utility sector,provides an impetus for utilities to utilize low S02 emitting units. And local regulations insouthern California require utilities to dispatch generation units on a low NOx basis (Sutley andWorks 1992).
Finally, concerns have been expressed that if electricity rates rise with externalities valuation, astate's economic competitiveness may be negatively impacted relative to other states.Furthermore, industrial customers may choose to self-generate or physically relocate theirproduction facilities (Joskow 1992). As a consequence, some states have been cautious in thevaluation of externalities for competitiveness reasons. For example, in establishing its lowervalue for CO2 emissions, the New York PSC wrote that because of "the wide disparity betweenthese estimates as well as existence of some controversy surrounding the need for controlling CO2
emissions. . .. It is staff's view that before New York State decides to charge itself the fullamount for its CO2 emissions, it should be assured that other states and countries are also actingto resolve this problem" (NYDPS 1989). More recently, the Oregon PUC has requested that thestate's utilities identify and assess the impact of any customer switching to unregulated fuels orother suppliers as a result of its externalities policy (OPUC 1993).
The authority of state utility regulatory agencies to act in this area has also been questioned. Insome states, such as Nevada, the regulatory commissions have been guided by state law.However, in other states, utility regulatory agencies have encountered obstacles in pursuingexternalities policies. For example, the Wisconsin PSC's non-combustion credit was overturnedin state court, in a case brought by several of the state's utilities for being more stringent thanestablished state emissions limits. On the same grounds, Wisconsin utilities have sued to nullifya commission decision to monetize emissions values for greenhouse gases. In Massachusetts, theauthority of the DPU to set externalities values has similarly been challenged in the courts. Andin Oregon, an informal opinion has been rendered that the PUC lacks the authority to requireutilities to monetize externalities.
Finally, in 1992, the California state legislature passed legislation restricting future applicationof externalities requirements in utility resource planning and acquisition. The legislation exemptsutilities from externalities requirements if market-based emissions trading has been implementedin the utility's service territory and limits the advancing of a utility'S resource need based onexternalities considerations (Barakat and Chamberlin 1993).
It has been argued that there are more cost-effective strategies of mitigating environmentalimpacts than monetizing externalities or setting emission-specific limits and using command andcontrol strategies to meet those limits (Joskow 1992; Sutley and Works 1992). In this regard,
35

TP-5789
three approaches have been advanced: the use of emissions fees, under which polluters must paya fee for all measured emissions of a specific pollutant; tradeable emission allowances, underwhich a pollution emissions cap is established and polluters must obtain allowances foremissions;18 and offset requirements, under which new sources of pollution must reduce, oroffset, existing emissions from other sources or purchase offsets from another entity. The offsetsystem is similar to that for tradeable emission allowances, except that there is no formaldesignation and allocation of allowances.
A number of states that have monetized environmental externalities did so before the enactmentof the S02 trading system in the 1990 Clean Air Act Amendments, and some states are revisitingthe externalities issue to assess the impact of this and other federal policy changes. Althoughrecently reaffirming the use of monetized values, the Massachusetts DPU now allows an emitterto forgo the use of externalities values for S02' NOx, and VOCs if it has secured full offsets(MDPU 1992). In addition, parties can substitute offsets for emissions that are not yet regulated,such as CO2, methane, or nitrous oxides, or for pollutants where there are no federal or state offsite reduction provisions in effect, as long as the off-sites are certified by -the MassachusettsDepartment of Environmental Protection.
Wisconsin also allows utilities to use offsets, such as tree planting or forest protection, to partlyor fully substitute for the carbon dioxide, nitrous oxides, or methane values adopted by the state(WPSC 1992). And both Nevada and New York have opened proceedings to revisit theirexternalities values, at least partly to assess the impacts of the Clean Air Act and the EnergyPolicy Act of 1992.
Other federal actions may prompt some states to assess whether certain externalities are alreadybeing internalized. For instance, President Clinton has pledged to reduce U.S. greenhouse gasemissions to 1990 levels by the year 2000. The President's Climate Change Action Plan callsfor voluntary utility commitments to reduce greenhouse gas emissions (Clinton and Gore 1993).The Energy Policy Act of 1992 also requires the U.S. Department of Energy to conduct anational inventory of greenhouse gas emissions and to issue guidelines for voluntary reportingof emissions reductions by any measure, including renewable energy investments or purchases.
It is not yet clear how much impact externalities rulemakings will have on electric resourcedecisions, particularly for biomass resources, since some of the states that have monetizedexternalities have not yet made resource decisions utilizing these considerations. Earlyindications are that the advantages biomass and other renewables may receive from externalitiesconsiderations may not be enough to overcome the competitive disadvantages renewables facefrom low-cost fossil fuels and the perceived higher risk of renewable energy technologyinvestments.
l8Under such a scheme, emissions allowances, or permits, are allocated equal to the cap. New emissions sourcesmust obtain allowances either by buying allowances on the open market or by reducing emissions from existing sourcesto free up allowances. The Clean Air Act Amendments of 1990 utilize a tradeable emissions system as the mechanismto achieve 802 reductions.
36

TP-5789
In New York, for example, results from the first round of competitive bidding indicate that theconsideration of environmental attributes has had the general effect of favoring the selection ofnatural gas-based projects over coal-fired projects. Out of nearly 1,000 MW of winning projects,only one biomass-based project, a 17.7 MW, waste-woad-fired plant, was selected. In fact, thiswas the only renewables project of any type selected. These results have raised questions in NewYork over the interplay of environmental and fuel diversity considerations in the bidding process(NYSEO 1991). In 1991, Boston Edison was the first utility to solicit new capacity under theMassachusetts externalities order. The utility received 40 bids totaling 3,000 MW, including twowood projects, a solid waste project, and a wind plant. None of these projects finished higherthan 18th in the project selection rankings (BECa 1992).
Although the relative impact of externalities considerations on the prospects for renewables isunclear, a number of states and utilities have taken other actions to stimulate renewables. Theseinclude the use of "green RFPs," utility incentives, and renewables set-asides. In 1991, the NewEngland Power Company, a subsidiary of New England Electric System, issued a renewablesonly (or "green") RFP, to place Ita limited number of renewable and waste electric powerproduction facilities into commercial operation to assess the current-day feasibility, value,resource potential, and environmental attributes of renewable resource technologies" (NEP 1991).In response, the utility company received 41 project bids representing 1400 million kWh ofannual generation, seven times the requested amount. Of the 41 projects bid, 7 projects werebiomass, 10 landfill methane, 1 waste-to-energy,7 small hydro, 7 wind, 4 photovoltaic, and fiveothers. Final selection included four landfill gas projects and the waste-to-energy project out ofseven total projects. These biomass-based projects were selected, in part, for their environmentalbenefits, such as reduction of waste and greenhouse gases (Hachey 1993).
More recently, Portland General Electric has released an RFP for up to 50 average MW (or 100to 200 nominal MW) of renewables-based generation as a mechanism to "acquire a limitednumber of projects of diverse and proven renewable technologies into commercial operation" and"to demonstrate the cost-effectiveness of renewable energy resources, as well as their commercialviability" (PGE 1993a). Five projects, including two biomass projects, were chosen for furthernegotiations (POE 1993b).
At the state level, the Wisconsin Public Service Commission recently approved a renewablesincentive program of O.75¢jkWh for qualifying wind and solar-based generation and 0.25¢/kWhfor all other qualifying renewables-based generation (biomass, hydro, waste-to-energy, landfillgas, and tire-derived fuel). The incentive is available for 20 years for both utility-owned andutility-purchased renewables generation from new projects that are placed in operation or receiveconstruction authority by the end of 1998 (WPSC 1993).
Under California law, the state's three investor-owned utilities must set aside a portion of theircapacity need for renewables, to be acquired through competitive bidding (CPUC 1992). Thebidding was conducted during the second half of 1993. A similar set-aside, for 300 MW, wasestablished in New York as a component of the state's 1992 State Energy Plan (NYPSC 1992).Under a recent settlement agreement, the state's utilities will pursue development of between 303MW and 387 MW of renewable energy-based projects. Nearly two-thirds of this total willinvolve biomass resources (NYPSC 1993). And in Minnesota, recent legislation has established
37

TP-5789
a state preference for renewable energy generation as a utility's first choice of new power supply.The law states that "the commission shall not approve a new or refurbished nonrenewable energyfacility in an integrated resource plan or a certificate of need ... nor allow rate recovery (forsuch facility) ... unless the utility has demonstrated that a renewable energy facility is not inthe public interest" (MN 1993).
Conclusions
The consideration of externalities in utility resource planning is still in the formative stages.Furthermore, much of this activity has been focused on establishing the relative attractiveness ofdemand-side management options vis-a-vis supply-side options, primarily fossil fuel plants. Lesswell developed are externalities comparisons of renewable energy options with traditional fossilfuel-based options. In fact, our investigation has found very little consideration of renewablesin this context. Those comparisons that have been performed generally relate to the evaluationof emissions from projects proposed in competitive bidding solicitations. These bid evaluationsare often confidential and thus have not yielded much public information on the relativeenvironmental impacts of utility resource options.
States are increasingly considering environmental and other socioeconomic externalities as partof the electricity resource planning and acquisition process. However, both the methods utilizedand the scope of these considerations differ widely. The treatment of greenhouse gas emissionsand the credits or penalties ascribed to biomass-based projects, will be a key determinant of thecomparative externalities standing of biomass plants. However, to date, there does not appearto be as much attention being paid to developing externalities-related values for biomass-basedresources, or other renewables-oriented projects, as for fossil fuel-based resources.
Even if externalities considerations become more prevalent, it is not clear that renewables-basedprojects, particularly those utilizing biomass resources, would receive much of a benefit comparedto high-efficiency, natural-gas-based generation. Particularly important in this regard is thetreatment of offsets; biomass projects may have little, if any, externalities penalty if CO2,
methane, and other emissions offsets are factored in.
A number of states and utilities are pursuing alternative approaches to assuring the propervaluation of renewable energy attributes in utility resource planning and acquisition. Among theapproaches are the use of "green RFPs," utility incentives, and capacity set-asides for renewableenergy projects. The relative value of pursuing these other approaches, either separate from orin combination with externalities valuations, should be assessed.
38
\--- . ~

TP-5789
Table 3-A. Status of Externalities Consideration in the States
PercentageConsidered but
Has NotState Monetization Qualitative Considering No
AdderRequirements
Addressed
Alabama tI
Alaska tI
Arizona tI
Arkansas tI
California tI
Colorado tI
Connecticut tI
Delaware tI
District of Columbia ,/
Florida ,/
Georgia tI
Hawaii tI
Idaho ./
Illinois tI
Indiana ./
Iowa tI
Kansas ,/
Kentucky ,/
Louisiana tI
Maine tI
Maryland tI
Massachusetts ,/
Michigan tI
Minnesota ./
Mississippi ,/
Missouri ,/
Montana ,/
Nebraska ,/
Nevada ,/
New Hampshire ,/
39

TP-5789
Table 3-A. Status of Externalities Consideration in the States
PercentageConsidered but
Has NotState Monetization Qualitative Considering No
AdderRequirements
Addressed
New Jersey ,/
New Mexico ,/
New York ,/
North Carolina ,/
North Dakota ,/
Ohio ,/
Oklahoma ,/
Oregon ,/"
Pennsylvania ,/
Rhode Island ,/
South Carolina ,/
South Dakota ,/
Tennessee ,/
Texas ,/
Utah ,/
Vermont ,/
Virginia ,/
Washington ,/
West Virginia ,/
Wisconsin ,/
Wyoming ,/
I Totals I 5 I 2 I 22 I 6 I 6 I 10 I'DSM-only and for the first 120 MW of renewables acquired."Separate requirements for consideration of externalities in IRP, competitive bidding, and facility siting.
Sources: (Barakat & Chamberlin 1993); (Cohenet al. 1990a);and NationalRenewable Energy Laboratory, personal communicationswith state utility commissions.
40

TP-5789
Table 3-B. Representative Emissions Factors and Heat Rates for New Plants Utilized in Table 3-3(lb/MBtu: unless otherwise noted)
Technology/Fuel Heat Rate NOx SOx CO2 CH4 CO TSP voe N20
Btu/kWh
Pulverized Coal with 9,400 0.6 0.6 238 0.0015 0.024 0.03 0.004 0.0325Scrubbers
Atmospheric Fluidized Bed 10,000 0.18 0.03" 238 0.0015 0.15 0.01 0.0028 0.0325Coal 0.0066
Integrated Gasification 9,280 0.06 0.03" 198 0.0015 0.01 0.006 0.003 0.0325Combined Cycle Coal 0.0066
Natural Gas Combined Cycle 8,140 0.0787 0.0006 117 0.002 0.021 0.001 0.033 0.0078
Steam Injected Natural Gas 13,100 0.0787 0.0006 119 0.012 0.1095 0.0133 0.012 0.018Combustion Turbine
Wood 16,740 0.03875 0.0083 212 0.033 0.221 0.00486 0.0773 0.033
BIG STIG 10,500 0.06 0.008 212 0.0015 0.002 0.011 0.003 0.0325
Municipal Solid Waste 16,800 0.077 0.038 165 0.0014 0.93 0.0047 0.03 0.033
Flashed Steam Geothermal 40,000 NA NA 0.03 0.0001 NA NA NA NAw/lnjection
Parabolic Trough with 11,000 0.031 0.0006 119 0.0002 0.038 0.0029 0.0013 0.028Natural Gas
Landfill Methane NA 2.66 0.63 1375 -500 6.66 0.00 0.74 0.00(in Ib/MWh)
'Multiply by 4.3 x 10⁻⁷ to convert from Ib/MBtu to kg/kJ"First value is for northern U.S.; second value is for western U.S.
Sources: Nevada Public Service Commission, In Re Rulemaking Regarding Resource Planning Changes PursuantTo S8497, Order 89-752, January 22, 1991, Table 1, except as noted below.
NOx' SOx' and TSP emission factors for atmospheric fluidized bed coal and integrated gasificationcombined cycle goal estimated by NREL staff. Assumptions include 2.5% sulfur content for northern coaland 0.550/0 sulfur content for western coal, and 12% ash content.
NOx data for pulverized coal estimated by NREL staff. Assumptions include control technologies for 650/0NOx reduction.
BIG STIG data, except for CO2 data. from Union of Concerned Scientists et aI., America's Energy Choices(Technical Appendixes). Cambridge, MA: Union of Concerned Scientists, 1992. pp. H-6, 1-4, and 1-5. CO2data estimated by NREL staff.
Landfill methane data provided by New England Power in testimony filed in support of "green RFP"initiative, August 1993.
41

TP-5789
Additional notes and assumptions for Table 3-B:
The atmospheric fluidized bed coal units are equipped with scrubbers for 95% sulphur dioxideremoval, low NOx burners, and ammonia injection for 65% removal of NOx.
The integrated coal gasification units have 95% 802 removal and steam injection to remove70% of NOx.
The combined cycle units have steam/water injection to remove 80% of NOx and oxidationcatalyst to reduce 80% of carbon monoxide.
The combustion turbines have steam injection to remove 80% of NOx.
The parabolic trough system has low NOx burners.
Wood and M8W are equipped with fabric filter baghouses for 99% removal of particulates andNOx controls for a 75% reduction of NOx. M8W units also have wet/dry scrubbers for 90%reduction of SOx.
The chart reflects emissions offsets for CO2 and CH4 that may be available for wood, BIG STIG,and landfill methane. The chart does not reflect offsets that may be available for otherpollutants or technologies. For example, Massachusetts allows offsets for S02' NOx'particulates, and VOCs; Wisconsin allows greenhouse gas offsets; and California allows NOxoffsets in its bidding process.
The BIG STIG data, except for CO2 and SOx, are derived from estimates for coal-based IGCCtechnology (following the UCS study) and thus should be considered very preliminary. The CO2and SOx values are from the Nevada PSC rulemaking.
42

TP-5789
4. Perceptions of Biomass Power Technologies
Introduction
In previous sections, the characteristics of biomass resources and technologies and theirassociated externalities have been profiled, as well as trends among states in the considerationof these externalities in utility resource planning and procurement. Discussions were held withrepresentatives of the biomass project development industry, electric utilities, and state regulatoryagencies in order to gain additional insights into the potential impact that externalitiesconsideration may have on future biomass development. This section reports on the findingsfrom these discussions.
Industry Contacts
A representative group of biomass and utility industry participants were contacted by telephoneto identify and discuss their perceptions of the most important issues facing biomass projectdevelopment, including the potential impact of externalities consideration. Twelve developmentcompanies were selected from the biomass industry; four each from the wood waste, waste-toenergy (WTE) , and landfill gas (LFG) industries. Sixteen representatives of the electric utilityindustry were contacted. The utility group was chosen to be geographically diverse and includeboth investor-owned and publicly owned utilities, as well as utilities with biomass developmentexperience, either as plant operators or as power purchasers. Finally, 17 state regulatory agenciesrepresenting 11 different states were contacted, again to reflect both geographic diversity andstates with either direct experience with biomass development or abundant biomass resources.The majority of the state contacts were with the utility regulatory agency, although some contactswere made with energy offices and planning and siting agencies.
General Findings on Biomass
Below we present a general summary of the project development experiences and perceptionsgleaned from the industry discussions. The responses have been separated into the threecategories of discussants: project developers, electric utilities, and state regulatory agencies.
Biomass Project Developers
The primary impetus to biomass project development has been the favorable power purchasecontracts that developers have received under PURPA, although WTE plants have more oftenbeen pursued by municipalities as a response to community waste disposal needs. The mainselling point for many biomass projects has been the reputation and experience of the developer.
Many project developers noted that environmental and siting concerns (e.g., the not-in-mybackyard or NIMBY syndrome) are the primary issues that contribute to public opposition tobiomass projects. Air quality concerns have been paramount, particularly when projects arelocated close to urban areas. Secondary concerns arise over ash disposal and the impact of fueltransport on local traffic. Remotely located plants have elicited less opposition. The permitting
43

TP-5789
process for biomass projects varies significantly but has become more difficult over time. Airpermits are generally the most difficult to obtain.
At the same time, many developers noted that environmental benefits are the primary factor thathave contributed to public support of biomass projects. These include the waste disposal benefitsof wood waste combustion and the landfill reduction benefits of WTE projects. In addition, itwas noted that the public perception of biomass plants generally improves after these plantscommence operation.
It was generally felt that explicit consideration of externalities would benefit biomass powerplants. However, there was a perception that WTE plants would benefit less, if at all, than othertypes of biomass because of other WTE-specific issues.
Electric Utilities
The utility evaluation process for biomass varies widely. It tends to involve first a resourceassessment and then an economic evaluation. Generally, biomass ranks in the middle to lowerthird of utility resource options, lower than demand-side management (DSM), natural gas (in acombined cycle configuration), and coal. However, one representative noted that wood wasterepresents the most cost-effective longer term resource addition for that utility. Anothermentioned that biomass will soon represent 30% of total system capacity. In a few cases,biomass is given credit as a renewable resource. Some respondents noted that excess capacityand the current emphasis on DSM reduces the likelihood that their utility would pursue biomassdevelopment in the near future.
Many benefits were ascribed to biomass technologies, such as local economic development andjob creation, especially in rural areas; waste disposal and volume reduction of MSW; therenewable nature of the resources; the use of local fuel resources versus imported fuel; thepotential for greenhouse gas mitigation; and other emissions reductions and credits. However,a number of disadvantages were also mentioned, including: facility emissions; the cost of fueldelivery and handling; variability in fuel properties; and the inability of these plants to followload.
Some of the utilities contacted consider externalities in resource decisions, but the methods differ.Other utilities do not measure externalities directly but do consider environmental costs inresource modeling scenarios and sensitivity analyses, or as a nonprice factor in competitivebidding evaluations. Other utilities expect that they will be required to consider externalities inthe future.
The utility perception of the possible impacts of externalities consideration on biomassdevelopment was mixed. Some utilities view explicit consideration of externalities as positivefor biomass, while others saw it as a negative or were uncertain. It was noted that the treatmentof CO2 emissions would have an important impact on the externalities ranking of different typesof biomass. NOx emissions are also a concern in some regions such as the Northeast andSouthern California.
44
..... _-..J

TP-5789
The general utility experience with nonutility biomass projects has been positive, although thereis concern over the high prices that some nonutility developers (of all types) receive for theirpower output under PURPA. At least one utility indicated that it is seeking to renegotiatecontracts with nonutility developers, including biomass developers. Responses varied on therelative ease of biomass plant siting and permitting; there was a general consensus that naturalgas projects are the least difficult to site. However, all types of biomass projects are consideredto be easier to site than coal-based projects.
There was a wide diversity of opinion on the biggest issues and challenges facing biomass in thefuture. Those mentioned more than once were the need to lower biomass power costs, the lowercost of competing fuels, siting, and the incompatibility of biomass power for meeting peakingpower needs.
State Regulators
State regulators, in general, are most concerned with economic issues, noting 'that, over the nearterm, economic issues will impact biomass technologies more than environmental issues. Somestates have capacity surpluses, and thus utilities are not evaluating new supply options of anykind. In these states, overcapacity is keeping avoided costs low, discouraging any new plantdevelopment.
It was noted that few utilities evaluate biomass in their resource plans, and that some utilitiesappear to have conceded biomass development to nonutility developers. However, in some states,utilities have been reluctant to negotiate contracts or pay capacity payments to nonutilitydevelopers, including biomass, and litigation is pending in at least two states involvingcomplaints by nonutility developers, biomass, and nonbiomass alike.
Many early nonutility projects, including biomass projects, received contracts with high avoidedcost rates. These contracts have forced utilities to seek rate increases, which has contributed topublic opposition to some plants. Regulators and the public are now more sensitive to theeconomics of biomass plants.
State approval over power plant development can be spread over several regulatory agencies.It was felt in several states that the communication and coordination between these agenciescould be improved. Few of the state representatives contacted had much involvement in facilitysiting and thus could not readily compare the ease or difficulty of siting a biomass facility to afossil fuel plant. Some respondents felt that wood waste and LFG plants would be easier to sitethan coal plants, but would be roughly the same as a natural gas plant. WTE plants wereconsidered difficult to site in general because of public opposition, except perhaps in pre-existingindustrial zones.
It is generally felt among regulators that environmental externalities will benefit wood waste andlandfill gas but perhaps not enough to overcome the perceived environmental advantages of otherresource options, such as natural gas, wind, and geothermal technologies. Some respondentscautioned that any externalities benefits will depend on the degree to which biomass combustioncan be considered CO2-neutral. Many thought that externalities consideration would have anegative impact on WTE projects.
45
TP-5789
Several regulators noted that biomass development would receive a boost if economic factors,such as job creation, were considered along with environmental externalities. And finally, instates with excess capacity, it was felt that externalities, if evaluated at all, would not have anyimpact on biomass until new capacity resources are needed.
Fuel-Specific Findings
As noted in previous sections of this report, the characteristics of biomass energy resources andpower generation technologies are quite varied. Thus, the perceptions of these resources will alsovary. The following represents fuel-specific perceptions of biomass energy resources andtechnologies. The bulk of these comments come from the biomass project developers since thediscussions with developers tended to be more technology specific.
Wood Waste
Project Developers
Many wood waste projects have been developed because of PURPA and the favorable powersales contracts that it spawned and plentiful supplies of wood waste. Wood waste also provideda niche market for many developers. The main selling points for wood waste projects have beenfavorable environmental considerations and the good reputation of the development companies.
Generally, public perception of wood waste projects has not changed over time. Positive issuesthat have contributed to public support for projects include environmental benefits and therenewable nature of the resource. Other responses included the fact that wood is a domesticresource, waste disposal benefits, new industrial infrastructure development in the community,and the more moderate size of these facilities. Negative issues include environmental concernsand general public opposition to the projects, e.g., NIMBY sentiments.
The developers noted that wood waste technology has been treated well in the permitting process,although this can vary by location. For example, developers noted that it is more difficult to siteprojects in the Northeast. However, today's wood waste projects are subjected to more stringentpermitting requirements than in the past. Water permits are generally the easiest permits toobtain while air permits are the most difficult. Wood waste power plants are considered easierto permit than coal but roughly comparable to natural gas plants.
The impact of state utility regulatory processes on the development of wood waste plants variesfrom state to state, both positive and negative. For example, state implementation of PURPA wasa positive in the 1980s, but the advent of competitive bidding for new resource procurement isa negative. The project developers feel that explicit consideration of externalities in electricutility planning and procurement practices will benefit wood waste projects in the future.
A number of issues and challenges currently confront wood waste project development. Issuesmentioned by developers were the need to account for externalities in energy prices, overcomingcommunity resistance to project construction, lower avoided costs, more stringent particulate andNOx controls, and the need to disassociate wood ash disposal issues from MSW ash.
46

TP-5789
Electric Utilities
Electric utility respondents indicated that there has been both support and opposition to wood andwood waste plants. However, several utilities considered wood plants to be easier to site thancoal plants, particularly if the plants are located in economically depressed areas. Regardingenvironmental externalities, future issues for wood-based projects include CO2 emissions and NOx
compliance. It was questioned whether any environmental externalities benefits for biomasswould be great enough to overcome the current price advantage versus natural gas.
State Regulators
The state contacts felt that wood waste plants are comparatively easy to site, but can face publicopposition based on any number of factors, such as air emissions, land use, impacts onendangered species, fears of overharvesting forest resources, and site-specific impacts such asplant noise and traffic from fuel delivery trucks. In cases where wood waste plants are sited neartraditional forest product or paper mills or in economically depressed areas, they are more readilyaccepted.
The impact of externalities on wood waste will depend on the treatment of CO2 emissions. Themarket potential for wood waste projects will be severely hampered if a CO2 adder is applied towood waste. If wood combustion is considered to be CO2-neutral, wood waste would probablybe more environmentally and economically competitive than coal, but still not as competitive asnatural gas.
Waste-ta-Energy
Project Developers
Waste-to-energy projects have generally been developed by private entines on behalf ofmunicipal governments or entities. The main selling points for WTE projects have been the trackrecord of the technology and the developer.
The following positive issues were noted as having contributed to past public support of WTEplants: the benefits of waste combustion and energy recovery versus landfilling, cost, thereputation of the company, environmental benefits, and provision of a stable long-term disposalsolution. Negatives identified were: air pollution concerns; perceived loss of property values; ashdisposal; incompatibility with recycling; energy costs; general public opposition; and trafficcongestion.
The permitting of WTE projects varies from state to state, but these projects are generallyscrutinized in great detail. Permitting standards have increased as both WTE technology andemissions monitoring has improved. In some cases, air permits were cited as the most difficultto obtain; in one case, it was a local "conditional use" permit. Permits for disposal of theremaining solid waste can sometimes prove difficult to obtain. WTE plants were compared tocoal-fired power plants in permitting complexity, while natural gas plants were said to be easierto permit.
47

TP-5789
It was noted by developers that regulators appear to be comfortable with WTE technology butthat public understanding lags. Public perception generally changes for the better once a projecthas been built and is operating.
Explicit consideration of externalities was felt to be less of an issue for WTE projects than forother resource options because waste disposal needs are what initially drive the development ofWTE facilities; electricity economics are a secondary concern. However, it was felt that afavorable accounting of externalities might make certain projects more feasible.
There are many issues and challenges confronting the future development of WTE projects,including compatibility with recycling; overcoming negative public perceptions, includingdeveloping a better public understanding of WTE air quality controls; and siting.
Electric Utilities
The utility representatives view WTE plants as the most difficult type of biomass plant to sitebecause of the widespread public opposition that has developed. One utility representative,however, expressed support for WTE as a component of a total waste disposal strategyencompassing recycling, source reduction, and composting. Under such a scenario, WTE plantswould be smaller in scale and utilize a more uniform fuel. It was also noted that WTE plantsare base load, must run power sources that are not highly valued today from a utility operationsstandpoint.
State Regulators
State regulators generally view MSW as a problematic resource option; they note that WTEplants are becoming increasingly difficult to site unless they are located in heavily industrializedareas. WTE plants also are viewed as an expensive energy option and a logistical problem if thewaste fuel must be brought in from outside the community. In some states, aggressive recyclingand source reduction efforts have put a damper on the development of WT~ plants. Yet, onestate regulator predicted a bright future for WTE within the state because of the combination ofa rapidly growing urban population, a relatively undeveloped recycling effort, and a lack oflandfill sites.
Several regulators noted that WTE plants have had a mixed performance record, with some plantsexceeding expectations but others marred by unanticipated shutdowns and/or excessive airemissions.
Some state respondents thought that WTE plants would not fare as well as wood waste or landfillgas plants when externalities are considered; concerns over emissions and ash disposal may beconsidered negative externalities for WTE projects.
48

TP-5789
Landfill Gas
Project Developers
Like other biomass power projects, many LFG projects have been developed primarily becauseof PURPA and favorable power sales contracts. In addition, LFG production benefits from thefederal unconventional fuels tax credit. In one case, an LFG project was developed for its publicrelations value. The main selling points for past LFG projects have been economic feasibilityand environmental benefits.
The principal positive issue that has contributed to public support of LFG plants is the beneficialuse or reduction of migrating landfill gas as well as reduced odor. Negative issues have includednoise, NIMBY concerns, and architectural review issues. Most developers felt that landfill gasis treated fairly in the permitting process but receives no special consideration. Generally, publicperception toward LFG plants is positive and in some cases has changed for the better.
The easiest permits for LFG plants to obtain are building permits; air permits are the mostdifficult. In general, all of the permitting for LFG projects has become more difficult, and theneed for more sophisticated emissions control technologies has increased costs. However,because LFG projects tend to be small, the permitting process is easier than for larger fossil fuelgenerating plants.
The primary impact of the state utility regulatory process on landfill gas projects has been theavailability of power sales contracts. The developers all agreed that the explicit considerationof externalities would be beneficial for LFG projects.
Future challenges or issues for LFG projects include new environmental regulations, a morecompetitive marketplace for power, and obtaining additional economic incentives.
Electric Utilities
There were very few comments by utilities regarding LFG projects. Generally, it was felt thatthere has been little public opposition to LFG plants and that these plants are relatively easy tosite. One utility representative noted that the state is encouraging LFG projects to generaterevenue for closed landfills and to mitigate methane emissions. In addition, this representativestated that utility management supports LFG project development as a component of itsgreenhouse gas reduction strategy. However, it also was noted that LFG power projects mayrequire NOx offsets if located in nonattainment areas.
State Regulators
Landfill gas plants will benefit from externalities because they reduce methane leakage fromlandfills (methane is considered to be a more potent greenhouse gas than CO2) , and because theyutilize a pre-existing waste resource. However, in some areas, NOx emissions from combustioncould be a problem. LFG plants are considered to be easy to site because of the perception thatplants mitigate potential environmental problems and, in most instances, are sited in remote orotherwise unattractive landfill locations.
49

TP-5789
Conclusions
The following represents a summary of our discussions with representatives of the biomassproject development industry, the electric utility industry, and state regulatory agencies:
• Much of the biomass development that has occurred to date resulted from the responseof nonutility developers to the incentives that were created by PURPA. The high-pricedpayment contracts of the past are no longer available and, with lower utility avoidedcosts, the power generation market has become much more competitive.
• Only a handful of electric utilities have direct experience in developing biomass powerprojects because the majority of this development has been performed by nonutilitygenerators. State utility regulators also appear .to have paid less attention to the relativebenefits of biomass development compared to traditional fossil-fuel-based generation. 11.Iefocus of most state regulators is on traditional project economics.
• The public perception of biomass development varies widely. The environmentalcharacteristics of biomass projects were cited as both potential positives and -negatives,In general, the permitting requirements for all types of biomass projects have becomemore stringent.
• The potential impact of externalities consideration on future biomass development isunclear. Generally, biomass externalities are considered to be more favorable than coalbut less favorable than natural gas or other renewables-based resource options. For woodfired projects, the treatment of CO2 emissions (i.e., whether or not wood-fired plantsreceive CO2 offsets) will be an important factor. LFG projects may benefit from methanereduction considerations.
50

TP-5789
5. References
Anderson, C. (1992). Testimony before the Wisconsin Public Service Commission. Docket No.05-EP-6. December 3.
Bain, R.; Overend R. (1992). "Biomass Electric Technologies: Status and Future Development."Advances in Solar Energy: An Annual Review of Research and Development. Boulder, CO:American Solar Energy Society, K. Boer ed., Volume 7.
Barakat & Chamberlin Inc. (1993). Contents of EPRINET's Environmental ExternalitiesClearinghouse: State Regulatory News. June.
Berenyi, E.; Gould, R. (1991). 1991-1992 Methane Recovery from Landfill Yearbook. NewYork: Governmental Advisory Associates Inc.
Berenyi, E.; Gould, R. (1993). 1993 Resource Recovery Yearbook. New York: GovernmentalAdvisory Associates Inc.
Bernow, S.; Biewald, B.; Marron, D. (1991). "Full-Cost Dispatch: Incorporating EnvironmentalExternalities in Electric System Operation." The Electricity Journal. March.
Biewald, B.; Bemow, S. (1992). "Climate Change and the U.S. Electric Sector." Proceedings:Fourth National Conference on Integrated Resource Planning Washington, DC: NationalAssociation of Regulatory Utility Commissioners.
Boston Edison Co. (1992). RFP 3 - Final Public Summary. June 1.
Broom, R; Stasis, R; Williams, J. (1993). "Waiting for the Other Shoe to Drop: New AirQuality Rules for WTE." Solid Waste & Power. May/June.
Brower, M; Tennis, M; Denzler, E.; Kaplan, M. (1993). Powering the Midwest: RenewableElectricity for the Economy and the Environment. Cambridge, MA: Union of ConcernedScientists.
Browne, G. (l991a). "A Utility View of Externalities: Evolution, Not Revolution." TheElectricity Journal. March.
Browne, G. (l991b). "Environmental Dispatch." Proceedings from the Conference on DemandSide Management and the Global Environment. Palo Alto, CA: Electric Power ResearchInstitute. ApriL
Buchanan, S. (1990). "Estimating Environmental Costs of Energy Resources." The ElectricityJournal. July.
51

TP-5789
Buchanan, S. (1992). "Dancing with the Bear: Lessons Learned in Applying Externality Coststo Real World Resources." Proceedings: Fourth National Conference on Integrated ResourcePlanning. Washington, DC: National Association of Regulatory Utility Commissioners.
California Public Utilities Commission. (1991). Order Instituting Investigation on theCommission's own motion to implement the Biennial Resource Plan Update following theCalifornia Energy Commission's Seventh Electricity Report. "Phase lB Opinion: Changes toFinal Standard Offer 4 for Use in Conjunction with the 1990 Electricity Report." Decision 9106-022. June 5.
California Public Utilities Commission. (1992). Interim Opinion, Resource Plan Phase: Biddingfor New Generation Sources. Decision 92-04-045. April 22.
Charles, M. (1992). "Integrated Waste Management-If It's Not Broke, Why Fix It'?" WasteAge. November.
Chupka, M.; Howarth, D; Zoi, C. (1992). Renewable Electric Generation: An Assessment ofAirPollution Prevention Potential. Washington DC: U.S. Environmental Protection Agency. ANR445. March.
Clinton, W.; Gore, A. (1993). Climate Change Action Plan. October.
Cohen, S.; Eto, 1.; Goldman C.; Beldock 1.; Crandall G. (1990a). A Survey of State PUCActivities to Incorporate Environmental Externalities into Electric Utility Planning andRegulation. Berkeley, CA: Lawrence Berkeley Laboratory, LBL-286l6. May.
Cohen, S.; Eto, J.; Goldman C.; Beldock J.; Crandall G. (1990b). "Environmental Externalities:What State Regulators Are Doing." The Electricity Journal. July.
Connecticut Office of Policy and Management. (1990). Study of the Potential Impact and Benefitof Wood Burning Facilities in Connecticut. January.
Doll, D. (1993). Personal Communication. Research Triangle Park, NC: U.S. EnvironmentalProtection Agency. June 10.
Eco Northwest; Shapiro and Associates; Seton, Johnston and Odell. (1986). EstimatingEnvironmental Costs and Benefits for Five Generating Resources. Portland, OR: BonnevillePower Administration. March.
Edison Electric Institute. (1993). 1992 Capacity and Generation of Non-Utility Sources ofEnergy. Washington, D.C.
Electric Utility Week. (1992). "PG&E Anticipates Losing Numerous Wood Units Selling Powerto Grid." Electric Utility Week. February 24.
Feher, 1. (1984). "A Comparison of Siting Factors for Various Electricity-GeneratingTechnologies." Proceedings ofthe 19th Intersociety Energy Conversion Engineering Conference.
52

TP-5789
Fehrs, J.; Donovan, C. (1993). "Environmental Issues: New Techniques for Managing and UsingWood Ash." Proceedings: First Biomass Conference of the Americas. Volume I. Golden, CO:National Renewable Energy Laboratory.
Freeman, A.; Burtraw D.; Harrington W.; Krupnick A. (1992). "Externalities - How to Do itRight." The Electricity Journal. August/September.
Gaige, C.; Halil, R. (1992). "Clearing the Air About Municipal Waste Combustors." Solid Waste& Power. January/February.
Gold, B.; Tillman, D. (1993). "Wood Cofiring Evaluation at TVA Power Plants: EPRI ProjectRP 3704-1." Presented at the Conference on Strategic Benefits of Biomass and Waste Fuels.Washington, D.C.: Electric Power Research Institute. March 28 - April 1.
Hachey, M. (1993). "New England Power Company's Renewable Energy Initiative (GreenRFP)." Proceedings of the National Regulatory Conference on Renewable Energy. Washington,DC: National Association of Regulatory Utility Commissioners. October.
HCI Publications. (1993). Landfill Gas-to-Energy: 1993 Activity Report. Kansas City, MO.
Henderson, T. (1992). Personal Communication. Nevada Public Service Commission. August.
Hoffman, W.; Cook, J.; Beyea J. (1993). "Some Ecological Guidelines for Large-Scale BiomassPlantations. II Proceedings: First Biomass Conference of the Americas. Volume I. Golden, CO:National Renewable Energy Laboratory.
Hollenbacher, R. (1992). "Biomass Combustion Technologies in the United States." Paperpresented at the Biomass Combustion Conference, Reno, NV, January 28-30.
Hougan, O. et al. (1943). Chemical Process Principles. Part 1, Material and Energy Balances.New York: John Wiley & Sons, Inc., Second Edition.
Hughes, M.; Ranney, J. (1993). "Environmental Issues Related to Biomass: An Overview."Proceedings: First Biomass Conference of the Americas. Volume I. Golden, CO: NationalRenewable Energy Laboratory.
Iliff, D. (1993). Personal Communication. Wisconsin Public Service Commission. August 12.
Independent Power Report. (1993). "Supreme Court Agrees to Hear Appeal of Chicago Case onIncinerator Ash." Independent Power Report. July 2.
Joskow, P. (1992). "Weighing Environmental Externalities: Let's Do It Right!" The ElectricityJournal. May.
Kiser, J. (l992a). "Municipal Waste Combustion Ash: Recent Developments." Environmental& Waste Management World. Vol. 6, No.5. May.
53

TP-5789
Kiser, J. (1992b). "Municipal Waste Combustion in North America: 1992 Update." Waste Age.November.
Kiser, J. (1993). "Putting the Pieces Together: Integrated Waste Management." American City& County. June.
Klass, D. (1983). "Energy and Synthetic Fuels from Biomass and Wastes." Handbook ofEnergyTechnology and Economics. New York: John Wiley & Sons, R. Meyers ed., pp. 712-786.
Levin, M; Smith, (1991). "New Landfill Gas Emission Rules Present Problems, Opportunities."Solid Waste & Power. December.
Lusk. P. (1993). Personal Communication. May 17.
McCarroll R.; Partanen, W. (1993). "On-Site Power Generation for the Future." Proceedings:First Biomass Conference of the Americas. Volume I. Golden, CO: National Renewable EnergyLaboratory.
McGowin c.; Gold, B. (1992). "Potential Benefits of Co-Firing Wood and Coal." Presented atthe 5th Annual National Biofuels Conference. Newton, MA. October.
Massachusetts Department of Public Utilities. (1990). Investigation by the Department ofPublicUtilities on its own motion into proposed rules to implement integrated resource managementpractices for electric companies in the Commonwealth. D.P.U. 89-239. August 31.
Massachusetts Department of Public Utilities. (1991). Investigation by the Department on its ownmotion into the filing made by Eastern Edison Company pursuant to 220 C.MR. 8.00, rulesgoverning sales of electricity by small power producers and cogenerators to utilities and salesof electricity by utilities to small power producers and cogenerators. D.P.U. 90-141. June 14.
Massachusetts Department of Public Utilities. (1992). Investigation by the Department ofPublicUtilities on its own motion as to the environmental externality values to be used in resource costeffectiveness tests by electric companies subject to the Department's jurisdiction. D.P.U. 91-131.November 10.
Midwest Research Institute. (1988). Guidelines for Co-firing Refuse-Derived Fuel in ElectricUtility Boilers. Palo Alto, CA: Electric Power Research Institute, Volume 1: ExecutiveSummary.
Minnesota, State of. (1993). An Act: ... providing that the public utilities commission establisha preference for renewable resource energy production . . . Chapter No. 356, H.F. No. 1253.
Morris, G. (1991). The California Biomass Energy Industry in 1990: Supply, Demand, andOutlook for Biomass Fuels. A Report to the Pacific Gas and Electric Company. Berkeley, CA:Future Resources Associates. May.
54

TP-5789
Musso, J. (1991). Testimony before the Wisconsin Public Service Commission. Docket No. 05EP-6. December 3.
National Renewable Energy Laboratory (1993). Profiles in Renewable Energy: Case Studies ofSuccessful Utility-Sector Projects. Golden, CO: National Renewable Energy Laboratory.DOE/CHI0093-206. October.
Nevada Public Service Commission. (1991). Order. In Re rulemaking regarding resourceplanning changes pursuant to SB 497. February 1.
New England Power Company. (1991). "Notice of Intent: Small Power Producer Request forProposals."
New York Department of Public Service. (1989). "Consideration of Environmental Externalitiesin Competitive Bidding Program of Orange and Rockland Utilities. II
New York Public Service Commission. (1992). Case 92-£-0954: Proceeding on Motion of theCommission to Examine the Plans for Implementation of Renewable Resources as Part ofMeeting Future Electricity Needs in New York State. Order Instituting Proceedings. October 14.
New York Public Service Commission. (1993). Case 92-E-0954: Proceeding on Motion of theCommission to Examine the Plans for Implementation of Renewable Resources as Part ofMeeting Future Electricity Needs in New York State. Settlement Agreement. October 12.
New York State Energy Office; Department of Public Service; Department of EnvironmentalConservation. (1991). Draft New York State Energy Plan: 1991 Biennial Update. Volume III:Issue Reports (Competitive Bidding). July.
Nicholson, R. (1978) Microeconomic Theory: Basic Principles and Extensions. Hinsdale, IL:The Dryden Press. Second Edition.
Office of Technology Assessment. (1980). Energy From Biological Processes. Washington, DC:U.S. Government Printing Office, Volume II - Technical and Environmental Analyses, p. 124.
Oregon Public Utility Commission. (1993) In the Matter of the Development of Guidelines forthe Treatment of External Environmental Costs. Order No. 93-695. May 17.
Ottinger, R; et al. (1990). Environmental Costs of Electricity. New York: Oceana Publications.
Peterson, J. (1991). Wood Energy Technology Assessment. Albany, NY: New York State EnergyResearch and Development Authority. July.
Portland General Electric. (l993a). Request for Power Supply Proposals: Renewable ResourceTechnologies. June.
Portland General Electric. (1993b). Press Release. December 28.
55

TP-5789
Project Finance Monthly. (1993). "IRS Adjusts Section 29 Tax Credit." Project FinanceMonthly. April.
Putta, S. (1993). Personal Communication. New York Public Service Commission. August 10.
Rader, N.; Bossong K.; Becker, J.; Borson, D.; Manuel, C. (1990). The Power of the States: AFifty-State Survey of Renewable Energy. Washington, D.C.: Public Citizen. June.
Research Triangle Institute. (1991). Biomass State-of-the-Art Assessment. Palo Alto, CA:Electric Power Research Institute, Volume 1: Guide.
Richards, D; et al. (1990). Waste-to-Energy Commercial Facilities Profiles. Park Ridge, NJ:Noyes Data Corporation.
Rinebolt, D. (1990). "Wood Power for the Future," Public Power, June.
Roos, K.; Jacobs, C; Orlic, M. (1993). "Options for Cost-Effectively Reducing AtmosphericMethane Concentrations from Anthropogenic Biomass Sources." Proceedings: First BiomassConference of the Americas. Volume III. Golden, CO: National Renewable Energy Laboratory.
Safley, L.; Lusk, P. (undated). "Low Temperature Anaerobic Digester." North CarolinaDepartment of Economic and Community Development: Energy Division.
Sanghi, A. (1991). "Should Economic Impacts Be Treated as Externalities'?" The ElectricityJournal. March.
Solid Waste & Power. (1991a). "New Jersey Advances First Regional Facility Since WTE BanLifted." Solid Waste & Power. June.
Solid Waste & Power. (1991b). "EPA Proposes Rules for Controlling Landfill Emissions." SolidWaste & Power. August.
Solid Waste & Power. (1991c). "EPA Issues Landfill Regulations," Solid Waste & Power.December.
Solid Waste & Power. (1992a). "Regulatory Requirements." Solid Waste & Power.January/February.
Solid Waste & Power. (1992b). "States Dismiss, Consider WTE Moratoriums." Solid Waste &Power. May/June.
Solid Waste & Power. (1992c). "Groups Seek Changes in Proposed Landfill Gas Rules," SolidWaste & Power. 1992 Industry Sourcebook.
Solid Waste & Power. (1993a). "Chicago Asks Supreme Court to Decide Ash Issue, Again."Solid Waste & Power. May/June.
56

TP-5789
Solid Waste & Power. (l993b). "EPA Modifies Proposal for MSW Landfills." Solid Waste &Power. November/December.
SRI International. (1992). Data Summary of Municipal Solid Waste Management Alternatives:Volume IV, Appendix B - RDF Technologies. Golden CO: National Renewable EnergyLaboratory. NRELfTP-431-4988D. October.
Sutley, N; Works, D. (1992). Managing Externalities: Market Challenges and Solutions.Washington, DC: National Independent Energy Producers. October.
Sweet, J. (1991). Testimony before the Wisconsin Public Service Commission. Docket No. 05EP-6. December 3.
Swezey, B. (1993). The Impact of Competitive Bidding on the Market Prospects for RenewableElectric Technologies. Golden, CO: National Renewable Energy Laboratory. NRELtrP-4625479. September.
Talbot, T. (1991). Testimony before the Wisconsin Public Service Commission. Docket No. 05EP-6. December 3.
Taxation, Budget and Accounting. (1993). "IRS Issues Non-Conventional Source Fuel Credit,Inflation Credit, 1992 Price." Taxation, Budget and Accounting. April.
Taylor, H. (1990). "Municipal Waste-To-Energy Facilities Reduce Greenhouse Gas Emissions."(Black & Veatch, Engineers-Architects). Presented at the Institute of Gas Technology FourthAnnual National Symposium on Municipal Solid Waste Disposal and Energy Production.January.
Tennessee Valley Authority. (1990). Economic Impact of Industrial Wood Energy Use in theSoutheast Region of the U.S., Summary Report. Natural Fertilizer and Environmental ResearchCenter, Biotechnical Research Department. TVA/NFERC/BIO-90/5 V.I, November.
Thomeloe, S. (1992). "Landfill Gas Utilization - Options, Benefits and Barriers." (U.S.Environmental Protection Agency) Presented at the Second United States Conference onMunicipal Solid Waste Management. Arlington, VA. June 3-5.
Tillman, D.; Hughes, E.; Gold, B. (1993). "Cofiring of Biofuels in Coal Fired Boilers: Resultsof Case Study Analysis." Proceedings: First Biomass Conference of the Americas. Volume I.Golden, CO: National Renewable Energy Laboratory.
Turnbull, J.; Hay, G.; Hollenbacher, R. (1991). PG&E Biomass Qualifying Facilities LessonsLearned Scoping Study - Phase I. San Ramon, CA: Pacific Gas and Electric Company. May.
U.S. Department of Energy. (1992). Electricity From Biomass: A Development Strategy. Officeof Solar Energy Conversion, Solar Thermal and Biomass Power Division. April.
57

TP-5789
u.s. Department of Energy. (1993a). Electricity from Biomass: National Biomass PowerProgram Five Year Plan (FY 1994-FY 1998). Office of Solar Energy Conversion, Solar Thermaland Biomass Power Division. April.
u.S. Department of Energy. (1993b). Annual Energy Review 1992. Washington D.C.: U.S.Government Printing Office. June.
u.S. Environmental Protection Agency. (1991) Standards of Performance for New StationarySources and Guidelines for Control of Existing Sources: Municipal Solid Waste Landfills.Federal Register. Vol. 56, No. 104. 40 CFR, Parts 51, 52 and 60. May 30.
u.S. House of Representatives. (1990) Compilation of Selected Acts - Environmental Law, asamended through December 31,1990. Committee on Energy and Commerce. 102nd Congress,1st Session.
Vermont Public Service Board. (1990). "Investigation into Least-Cost Investments, EnergyEfficiency, Conservation and Management of Demand for Energy." Order, Docket No. 5270,Volume IV. April 16.
Walther, R.; Jurewitz, J. (1992). "Including Environmental Externalities and Market-BasedMechanisms in Utility Resource Planning: Some Thoughts and Experiences." AdvancedWorkshop in Regulation and Public Utility Economics. San Diego: Fifth Annual WesternConference. July 8-10.
Wiel, S. (1991). "The New Environmental Accounting: A Status Report." The ElectricityJournal. November.
Williams, S.; Porter, K. (1989). Power Plays: Profiles of America's Independent RenewableElectricity Developers. 1989 Edition. Washington, D.C.: Investor Responsibility ResearchCenter.
Williams, S. (1991). Trash to Cash. Washington D.C.: Investor Responsibility Research Center.
Wiltsee, G.; McGowin, c.; Hughes, E. (1993). "Biomass Combustion Technologies for PowerGeneration." Proceedings: First Biomass Conference of the Americas. Volume I. Golden, CO:National Renewable Energy Laboratory.
Wisconsin Public Service Commission. (1992). Findings ofFact, Conclusion ofLaw and Order.Docket No. 05-EP-06. September 18.
Wisconsin Public Service Commission. (1993). Supplemental Findings of Fact, Conclusion ofLaw and Order, Supply Side, Renewable Technologies. Docket No. 05-EP-6. May 21.
58

Document ControlPage
1. NREL Report No.2. NTIS Accession No.
NREL-TP-462-5789 DE94000247
3. Recipient's Accession No.
4. Title and SubtitleThe Potential Impact of Externalities Considerations on the Market forBiomass Power Technologies
7. Author{s)B.G. Swezey, K.L. Porter, and J.S. Feher
9. Performing Organization Name and AddressNational Renewable Energy Laboratory1617 Cole BoulevardGolden, Colorado 80401-3393
12. Sponsoring Organization Name and Address
15. Supplementary Notes
5. Publication Date
February 1994
6.
8. Performing Organization Rept. No.
10. ProjectlTaskIWork Unit No.
BF165155 and BF261011
11. Contract (C) or Grant (G) No.
(C)
(G)
13. Type of Report & Period Covered
Technical report
14.
16. Abstract (Limit: 200 words)This study assesses the current status of externalities considerations-nonmarket costs and benefits-in state andutility electricity resource planning processes and determines how externalities considerations might help or hinderthe development of biomass power plants. It provides an overview of biomass resources and technologies,including their market status and environmental impacts; reviews the current treatment of externalities in thestates; and documents the perspectives of key utility, regulatory, and industry representatives concerningexternalities considerations. The authors make the following recommendations to the biomass industry: (1) thewood and agricultural waste industries should work toward having states and utilities recognize that wood andagricultural waste are greenhouse gas neutral resources because of carbon sequestration during growth; (2) thebiomass industry should emphasize nonenvironmental benefits such as economic development and job creation;and (3) the biomass industry should pursue and support efforts to establish renewable energy set-asides or "green"requests for proposals.
17. Document Analysisa. Descriptors
externalities; biomass; biomass power technologies: energy marketb. Identifiers/Open-Ended Terms
c. UC Categories233,247
18. Availability StatementNational Technical Information ServiceU.S. Department of Commerce5285 Port Royal RoadSpringfield, VA 22161
Form No. 0069E (6-30-87)
19. No. of Pages
68
20. Price
A04