the positive announcement-period returns of …...equity carveouts 155 are significant in the...
TRANSCRIPT

153
(Journal of Business, 2002, vol. 75, no. 1)� 2002 by The University of Chicago. All rights reserved.0021-9398/2002/7501-0006$10.00
Anand M. VijhUniversity of Iowa
The Positive Announcement-PeriodReturns of Equity Carveouts:Asymmetric Information orDivestiture Gains?*
I. Introduction
Stock issues are important news. The market reactiondepends on whether a firm sells more of its own stockin a seasoned equity offering (SEO) or the stock of awholly owned subsidiary in an equity carveout. Ma-sulis and Korwar (1986) examine a sample of 690SEOs by industrial firms during the period 1963–80and measure an average announcement-period excessreturn of –3.25%.1 Schipper and Smith (1986) ex-amine a sample of 76 carveouts during the period1963–84 and measure an excess return of 1.83%.
The negative market reaction to SEOs is usuallyexplained by asymmetric information. In the Myersand Majluf (1984) model, managers issue stock whenthey have private information that their stock is over-valued. Rational investors thus lower the stock priceon the announcement of an SEO. The reasons behind
* I have benefited from comments of seminar participants at theAmerican Finance Association meetings, Emory University, theFinancial Association meetings, the University of Iowa, OklahomaState University, Tulane University, and the University of Wiscon-sin. I wish to thank George Benston, Matt Billett, Arnie Cowan,Albert Madansky (the editor), and Vikram Nanda for specific com-ments. I also wish to thank Gonul Colak, Jennifer Westberg, andSterling Yan for help with the data collection. I am especiallyobliged to a referee of the Journal of Business for many commentsthat improved this article substantially.
1. Asquith and Mullins (1986), Mikkelson and Partch (1986),and Schipper and Smith (1986) also document similar announce-ment-period returns for different samples of SEOs.
Using a sample of 336carveouts that occurred inthe period 1980–97, thisarticle shows that the an-nouncement-period re-turns increase with theratio of subsidiary tononsubsidiary assets.This finding contradictsthe asymmetric informa-tion model proposed byNanda. Additional testsrelate the returns to thefollowing divestiture-based explanations pro-posed by Schipper andSmith and others: refo-cusing of the parent andsubsidiary operations, fi-nancing of new and ex-isting projects, reducingthe complexity of stockvaluation, and enablingan eventual spinoff orthird-party acquisition.The combined evidencerejects the asymmetric in-formation hypothesis andsupports the divestituregains hypothesis ofcarveouts.

154 Journal of Business
the positive market reaction to carveouts are more varied. Schipper and Smithoffer one set of reasons based on divestiture gains, such as obtaining separatefinancing for the subsidiary’s investment projects, designing more efficientcompensation contracts for the subsidiary’s managers, and the creation ofpure-play stocks. This list can be expanded to include other reasons associatedwith divestitures accomplished by spinoffs and asset sales, such as refocusingof the parent and subsidiary operations, and using proceeds to retire debt.Nanda (1991) offers another set of reasons based on asymmetric information.He argues that carveouts should be interpreted as not only issues of subsidiarystock but also as nonissues of parent stock. He extends the Myers and Majlufmodel to show that, on average, firms will issue subsidiary stock when theparent assets are undervalued and the subsidiary assets are overvalued. Ra-tional investors raise the stock price as the positive information concerninglarger parent assets dominates the negative information concerning smallersubsidiary assets.
Empirical verification of whether the positive announcement-period returnsof carveouts reflect asymmetric information or divestiture gains, or both, hasbeen scarce. Slovin, Sushka, and Ferraro (1995) provide some indirect evi-dence of asymmetric information. They show that rival firms in the subsid-iary’s industry earn an excess return of –1.1%, presumably because they sharesome of the subsidiary’s overvaluation. However, their evidence of industryeffects is based on a small sample of 36 carveouts, and it does not hold upfor the rival firms in the parent’s industry. Allen and McConnell (1998) providesome evidence of divestiture gains. They argue that the positive announce-ment-period returns arise when financially distressed firms use carveout pro-ceeds to pay down on debt. Two other studies provide further evidence insupport of divestiture gains, but they use issue-date returns or long-term returnsafter issue. Hand and Skantz (1997) find that the parent stocks earn negativereturns during a 5-day period starting with the issue date, and they suggestthat these returns reverse the earlier announcement-period returns. They ques-tion the rationality of positive announcement-period returns, but they alsosuggest that these may occur as investors confuse carveouts with spinoffs.Vijh (1999) examines 3-year returns of parent and subsidiary stocks afterissue. He finds some evidence that the long-term returns are related to thenumber of business segments before carveout, which he uses as a proxy fordivestiture gains arising from the refocusing of parent and subsidiaryoperations.
This article examines the announcement-period returns of a sample of 336carveouts completed during the period 1980–97 to explore whether the returnsare likely to be caused by asymmetric information or by the previously citedexplanations of wealth gains from divestitures. I develop and test a predictionof Nanda’s asymmetric information model, which states that the returns shoulddecrease as the ratio of subsidiary assets to nonsubsidiary assets increasesand should eventually become negative as this ratio exceeds one. My results
Equity Carveouts 155
are significant in the opposite direction of this prediction. On average, theannouncement-period excess returns equal 4.92% when the precarveout sub-sidiary assets are greater than the nonsubsidiary assets, and they equal 1.19%when the subsidiary assets are smaller than the nonsubsidiary assets. Thedifference equals 3.73%, which is significant at the 1% level. The positivecorrelation between the excess returns and the ratio of subsidiary to nonsub-sidiary assets is inconsistent with the asymmetric information hypothesis. Itis simultaneously consistent with the divestiture gains hypothesis. Severalstudies of spinoffs and asset sales show that their wealth gains increase withsuch ratio.
Given the lack of support for the asymmetric information hypothesis, I turnmy attention to a detailed analysis of the divestiture gains hypothesis. Inparticular, I subdivide the divestiture gains hypothesis into the following morespecific components: the refocusing strategy hypothesis; the financing strategyhypothesis; the investment strategy hypothesis; the complexity, undervalua-tion, and pure play hypothesis; the managerial incentives hypothesis; and othermiscellaneous hypotheses.
The refocusing strategy hypothesis is based on previous evidence by Com-ment and Jarrell (1995), John and Ofek (1995), Daley, Mehrotra, and Sivak-umar (1997), and Desai and Jain (1999), who show that improving focusthrough spinoffs and asset sales leads to higher firm value. In support of thishypothesis, I first show that the parent and subsidiary firms in carveouts belongto different industry sectors just as often as in spinoffs and asset sales andthat this difference is associated with higher announcement-period returns.Second, my methodology includes a detailed scrutiny of the Wall Street Jour-nal reported motives for carveouts. I find that a majority of the Wall StreetJournal reports mention lack of fit or focus and a desire to restructure op-erations by divesting subsidiary assets as a reason for carveout. Third, morethan a third of all carveouts are followed by a complete spinoff or a third-party acquisition. The market reacts more positively to this last subset of caseson the announcement of carveout and on the subsequent announcement ofspinoff or acquisition.
The financing strategy hypothesis and the investment strategy hypothesisboth suggest that raising equity capital is a primary reason for carveouts.However, the financing strategy hypothesis suggests that capital is requiredto repay the parent’s or the subsidiary’s debt or for other financial contin-gencies, whereas the investment strategy hypothesis suggests that capital isrequired to finance the subsidiary’s new projects or upgrade existing projects.The financing strategy hypothesis is based on Lang, Poulsen, and Stulz (1995)and Allen and McConnell (1998), who find that financially distressed parentfirms raise capital by asset sales or equity carveouts and that the market reactspositively when this capital is used to repay debt. The investment strategyhypothesis is based on McConnell and Muscarella (1985), who find that theannouncement of a capital expenditures plan results in a positive market
156 Journal of Business
reaction, and on Mikkelson and Partch (1986), who find that the announcementof an SEO leads to a less negative market reaction if proceeds are used tofinance capital expenditures.
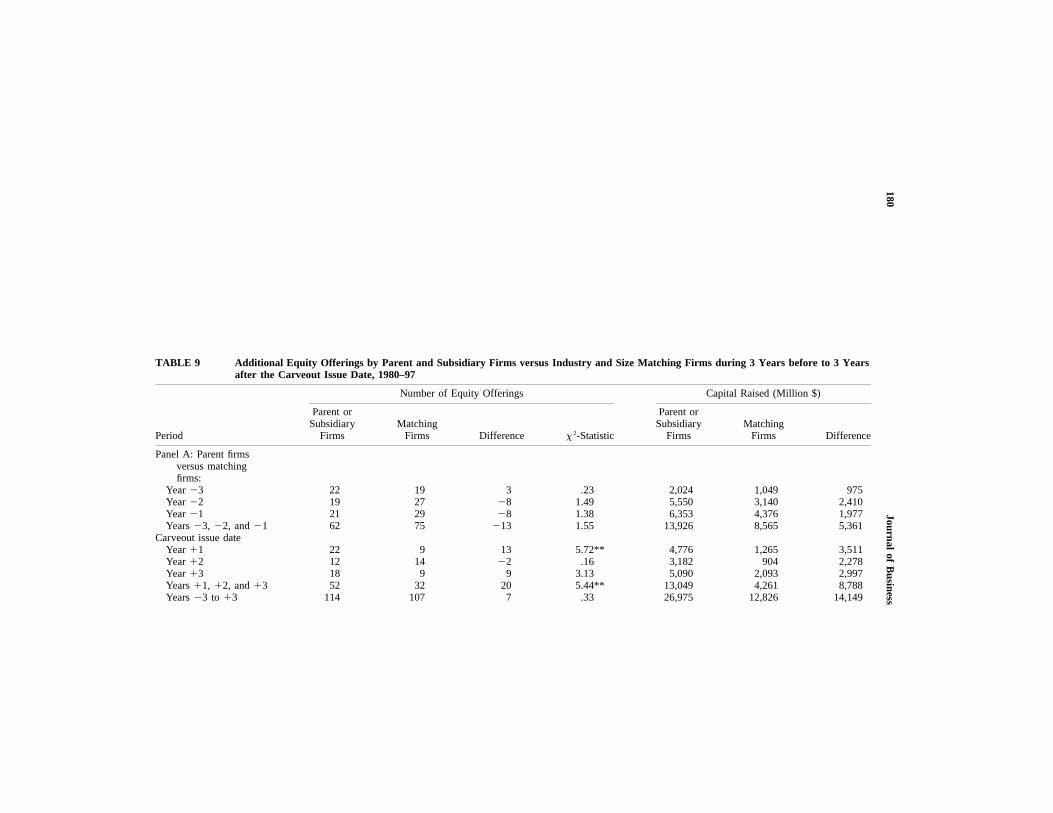
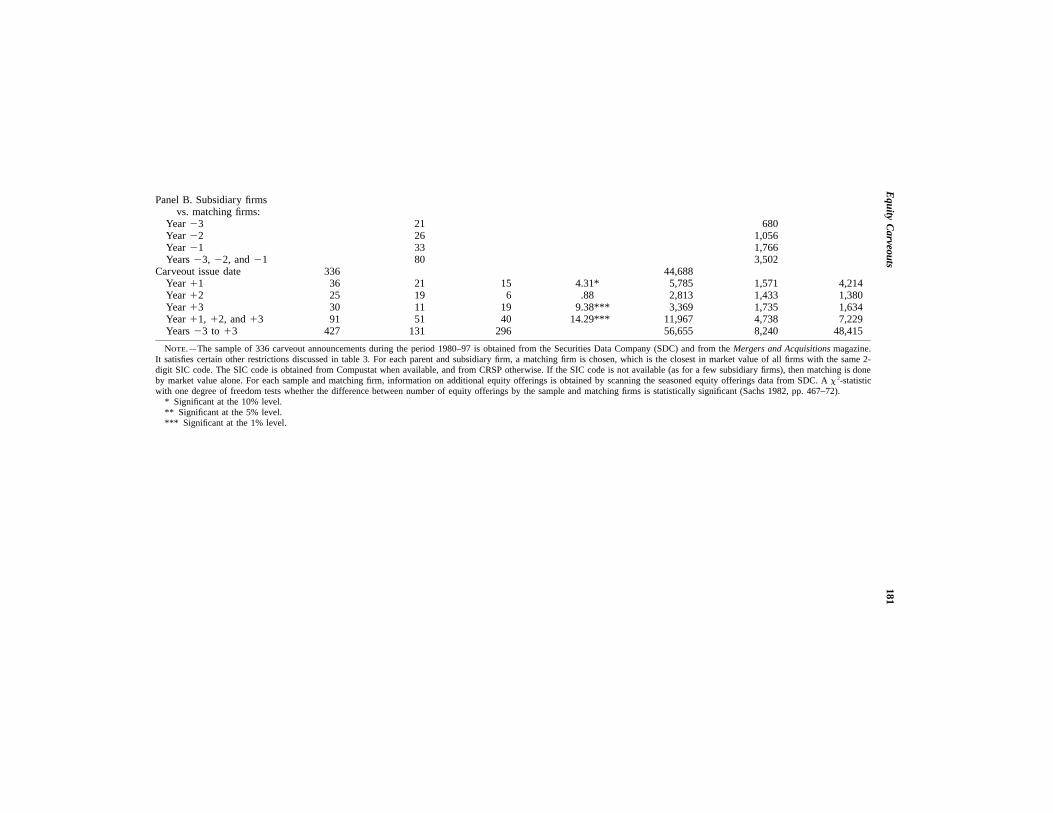
My evidence supports both the financing strategy and investment strategyhypotheses. The Wall Street Journal reports mention both reasons frequently,and cases where such reasons are mentioned result in more positive an-nouncement-period returns. Stronger evidence in support of these two hy-potheses is provided by the subsequent financing and investment activities ofparent and subsidiary firms relative to industry- and size-matched controlfirms. The parent firms issue a greater number of SEOs than control firmsover a 3-year period after carveout. This is surprising because parent firmsreceive nearly a third of the carveout proceeds represented by the sale ofsecondary shares and some part of the remaining proceeds that subsidiaryfirms use to repay debt owed to parent firms. One may imagine that, afterraising substantial carveout capital, at least the subsidiary firms would stayaway from equity markets for some time. However, the difference betweenthe number of SEOs by subsidiary firms and control firms is even greaterthan between parent firms and control firms.
Investigation of capital expenditures provides more evidence on the fi-nancing strategy hypothesis and the investment strategy hypothesis. The parentfirms have significantly lower capital expenditures than the control firms dur-ing the following 3 years, which suggests that the capital raised in carveoutsand subsequent SEOs may be used to repay debt or meet other financialcontingencies, as is suggested by the financing strategy hypothesis. The sub-sidiary firms have higher capital expenditures than the control firms, which,combined with the evidence on subsequent SEOs, supports the investmentstrategy hypothesis.
The evidence on subsequent SEOs by subsidiary firms reveals anothersimilarity between spinoffs and carveouts. Aron (1991) has a model in whichmanagers who receive stock-based compensation after spinoffs create firmvalue by exploiting investment opportunities. Her model predicts that newinvestment in spinoffs in the period immediately following spinoff will behigher than before spinoff and higher than in firms of similar characteristicsthat are not spun off. Krishnaswami and Subramaniam (1999) show that thisprediction holds for spinoffs, and this article shows that it holds for carveouts.In many cases, it appears that spinoffs and carveouts differ only in whetherfinancing is raised at birth or soon afterward.
The complexity, undervaluation, and pure play hypothesis is based onSchipper and Smith (1986), Vijh (1994), and Krishnaswami and Subramaniam(1999). The separation of unlike parent and subsidiary assets into indepen-dently traded units helps markets in understanding their combined value. Italso attracts investors interested in only the subsidiary assets. Both factorsincrease the combined firm value. I find that many Wall Street Journal reportsmention these reasons for carveouts and that such reasons are associated withhigher than average announcement-period returns. The managerial incentives

Equity Carveouts 157
hypothesis is again based on the theoretical model by Aron (1991), who arguesthat improved managerial incentives created by stock-based compensationafter spinoff lead to higher firm value. Surprisingly, I find that this motive israrely mentioned in the Wall Street Journal reports. But that should not un-dermine its importance in wealth gains from divestitures. A recent paper byLarraza-Kintana et al. (2000) shows that stock-based compensation is usedin nearly all firms after initial public offerings (IPOs). Finally, similar to thecase of spinoffs, I find that carveouts are occasionally motivated by miscel-laneous reasons, such as takeover defense, tax reduction, and regulatorycompliance.
The overall evidence of this article is inconsistent with the asymmetricinformation hypothesis and consistent with the divestiture gains hypothesis.The positive announcement-period returns of equity carveouts arise becausethe combined firm value is expected to increase as a result of improved focus,new financing, reduced complexity, and improved managerial incentives. Theremainder of the article is organized as follows. In Section II, I discuss thedifferent hypotheses and their specific predictions. In Section III, I describethe data and methods. In Sections IV and V, the empirical predictions aretested, and in Section VI, I conclude.
II. The Asymmetric Information Hypothesis versus the DivestitureGains Hypothesis
A. The Asymmetric Information Hypothesis (and the Contrast with theDivestiture Gains Hypothesis)
Nanda (1991) presents an asymmetric information model to explain when all-equity firms will forgo a positive net present value (NPV) project and whenthey will finance it with an SEO or an equity carveout. His model is brieflydescribed as follows. Before the announcement of equity issue, the parentfirm consists of nonsubsidiary and subsidiary assets in place. The value ofnonsubsidiary assets is known to be either or with equal probability.1 1V VH L
The value of subsidiary assets is similarly known to be either or with2 2V VH L
equal probability. There is no correlation between the nonsubsidiary and sub-sidiary asset values. Thus, states HH, HL, LH, and LL are equally likely.State HL denotes that the nonsubsidiary assets are of high value and thesubsidiary assets are of low value, and so on. The manager knows the truestate, but the market knows only the probabilities. Thus, the nonsubsidiaryassets have a market value of and the subsidiary assets have a1 1(V � V )/2,H L
market value of 2 2(V � V )/2.H L
In addition to the assets in place, the firm has a project under consideration.The project has a positive NPV, which is common knowledge. For simplicity,Nanda assumes that which means that there is equivalent1 1 2 2V /V p V /V p m,H L H L
information asymmetry concerning the nonsubsidiary and subsidiary assetvalues. He denotes where g is the ratio of the market1 2 1 2V /V p V /V p g,H H L L

158 Journal of Business
value of the nonsubsidiary assets to subsidiary assets in both the high andlow value states.
The manager has the choice of three actions: O, do not issue equity andforgo the project; S, sell subsidiary stock (i.e., do an equity carveout); andC, sell stock in the consolidated firm (i.e., do an SEO). Debt issues are notallowed. The manager’s actions are guided by whether the equity issue willincrease the value of existing equity. The possible equilibria are denoted byWXYZ, where W, X, Y, and Z are the actions taken by firms of type HH,HL, LH, and LL. At first, since W, X, Y, and Z may each take the values O,S, and C, a total of different equilibria appear possible. However,43 p 81by using other criteria, Nanda shows that only the equilibria CSCC, SSCS,OSCC, OSOC, and OSOS are possible. In the first two cases, all firm typesfinance the project. This occurs when the project has a large NPV relative tothe value of the assets in place. In the last three cases, the firm types HH,and possibly LH, forgo the project. This occurs when the project has a smallNPV relative to the value of the assets in place.
Table 1 shows the revision in market values after the announcement of acarveout. Consider equilibrium SSCS to appreciate the calculations. After theannouncement, the market knows that the firm type is HH, HL, or LL withequal probability. Thus, the ex post value of nonsubsidiary assets equals
This exceeds their ex ante value by1 1 1 1 1(2V � V )/3. [(2V � V )/3] � [(V �H L H L H
Similarly, the ex post value of subsidiary assets equals1 1 1V )/2] p (V � V )/6.L H L
which exceeds their ex ante value by2 2 2 2(V � 2V )/3, [(V � 2V )/3] �H L H L
Using the size ratio g, the total revision in2 2 2 2[(V � V )/2] p �(V � V )/6.H L H L
firm value equals The1 1 2 2 2 2[(V � V )/6] � [(V � V )/6] p [(g � 1)(V � V )]/6.H L H L H L
revision in firm value under each of equilibria CSCC, OSCC, and OSOC issimilarly shown to be Under equilibrium OSOS the2 2[(g � 1)(V � V )]/2.H L
revision in firm value equals which is negative and unrelated2 2�(V � V )/2,H L
to g, because the announcement leads to downward revision in the value ofsubsidiary assets but no revision in the value of nonsubsidiary assets.
Nanda assumes that the nonsubsidiary assets are of greater value than thesubsidiary assets, that is, that He does not offer any justification forg 1 1.this assumption, except that “we believe this is in line with the Schipper andSmith (1986) sample” (Nanda 1991, p. 1720, n. 9). Under this assumption,four of the five equilibria imply a positive return following the announcementof a carveout. In the fifth case, the return is negative. Nanda argues that thiscase is infrequent, occurring for very low NPV projects, as both firm typesHH and LH forgo the project. Overall, announcing a carveout reveals negativeinformation about the subsidiary assets and zero or positive information aboutthe nonsubsidiary assets. If the nonsubsidiary assets are greater, then the netmarket reaction will be positive.
Within the range of g values considered by Nanda, table 1 shows that themarket reaction should be decreasing with decreasing g. When theg p 1,market reaction should equal zero. When the market reaction shouldg ! 1,be negative and decreasing, as the negative information concerning the sub-

Equity
Carveouts
159
TABLE 1 Carveout Announcement-Period Revision in Market Value Predicted by the Asymmetric Information Model of Nanda (1991)
Equilibrium
Nonsubsidiary Assets in Place Subsidiary Assets in Place
Total Firm Revi-sion in Market
ValueEx Post Market Value*Revision in
Market Value† Ex Post Market Value‡
Revision inMarketValue§
CSCC1VH
1 1(V � V )/2H L2VL
2 2�(V � V )/2H L2 2(g � 1)(V � V )/2H L
SSCS1 1(2V � V )/3H L
1 1(V � V )/6H L2 2(V � 2V )/3H L
2 2�(V � V )/6H L2 2(g � 1)(V � V )/6H L
OSCC1VH
1 1(V � V )/2H L2VL
2 2�(V � V )/2H L2 2(g � 1)(V � V )/2H L
OSOC1VH
1 1(V � V )/2H L2VL
2 2�(V � V )/2H L2 2(g � 1)(V � V )/2H L
OSOS1 1(V � V )/2H L 0
2VL2 2�(V � V )/2H L
2 2�(V � V )/2H L
Note.—The table summarizes the announcement-period returns predicted by Nanda’s model. His model is described in Sec. II.A. In each equilibrium, the table shows the revision in themarket value of the nonsubsidiary and subsidiary assets, and the total revision in the combined firm value following the announcement of carveout.
* The ex post market value is obtained by averaging the ex post value of nonsubsidiary assets in each of the states in which carveout occurs. This value equals in states HH and HL1VH
and in states LH and LL.1VL
† The revision in market value is obtained by subtracting the ex ante market value of the nonsubsidiary assets, which equals .1 1(V � V )/2H L
‡ The ex post market value is obtained by averaging the ex post value of subsidiary assets in each of the states in which carveout occurs. This value equals in states HH and LH,2VH
and in states HL and LL.2VL
§ The revision in market value is obtained by subtracting the ex ante market value of the subsidiary assets, which equals .2 2(V � V )/2H L

160 Journal of Business
sidiary assets dominates the positive information concerning the nonsubsidiaryassets.
The specific predictions of the divestiture gains hypothesis are describedin the following section. But here I present a prediction common to all formsof the divestiture gains hypothesis that is the opposite of the main predictionof the asymmetric information hypothesis. It is reasonable to argue that thebenefits of increased focus, new financing and investment opportunities, im-proved managerial incentives, and reduced complexity should increase withincreasing size of the subsidiary assets relative to the combined assets. Hiteand Owers (1983) and Krishnaswami and Subramaniam (1999) show that themarket reaction to spinoffs is increasing with this relative size variable. Klein(1986) and Lang, Poulsen, and Stulz (1995) show that the market reaction toasset sales is also increasing with this variable. In the case of spinoffs, whereno new shares are issued, this relative size variable equals It in-1/(1 � g).creases monotonically with decreasing value of g, which shows the contrastwith the asymmetric information hypothesis.
B. The Divestiture Gains Hypothesis
The Oxford English Dictionary defines a divestiture as the deprivation of apossession or a right. A carveout results in the partial loss of ownership andcontrol of a subsidiary that was previously wholly owned and controlled bythe parent. Strictly speaking, a carveout is only a partial divestiture whereasa spinoff or an asset sale are complete divestitures. In practical terms, all threeforms of divestiture involve restructuring of operations and management. Car-veouts invariably involve financing, asset sales usually involve financing(when the sale is for cash), but spinoffs do not involve financing. New in-vestments often follow in each case, but this is not a requirement in any case.Below, I discuss several hypotheses related to the operations, management,ownership, financing, and investment aspects of carveouts.
The refocusing strategy hypothesis. An equity carveout replaces one legalfirm with two firms of distinct boundaries. It is remarkable that the increasein carveout activity has coincided with a trend toward focus and specializationin recent years. Comment and Jarrell (1995) argue that the economies of scopehave been reversed during the 1980s (and 1990s). They show that the averagenumber of business segments and different standard industrial classification(SIC) codes used by firms included in the Compustat segment file decreasedsubstantially from 1978 to 1989. They also show that focus-increasing firmsearned superior long-term returns during this period, which may be partly theundoing of a 13%–15% diversification discount documented by Berger andOfek (1995). The two separated firms after carveout are subject to the scrutinyof capital markets, which eliminates inefficient cross-subsidies and otherwealth-decreasing activities invisible to shareholders of the combined firm. Italso reduces any negative synergy between parent and subsidiary firms arisingfrom the incompatibility of their businesses.

Equity Carveouts 161
Previous research has shown the benefits of improving focus by spinoffsand asset sales. John and Ofek (1995) show that, in three-fourths of assetsales, the sold division has a different SIC code from the remaining divisionsof the seller. They show that the announcement-period returns of asset salesare higher when the SIC code of the sold division is different from that ofthe seller and still higher when it is the same as that of the buyer. Daley,Mehrotra, and Sivakumar (1997) show that the announcement-period returnsand the post-issue operating performance of spinoffs are higher when theparent and subsidiary have different SIC codes. Desai and Jain (1999) showthat their long-term returns are also higher.
Vijh (1999) shows that the long-term returns of carveouts increase withthe number of distinct business segments of the precarveout firm, which heuses as a proxy for the benefits of increased focus. I argue that some of thepositive announcement-period returns of carveouts should also be attributedto the increased focus and the synergy gains from the separation of distinctbusinesses. The refocusing strategy hypothesis thus predicts the following.First, a careful analysis of the Wall Street Journal reports on carveouts willshow frequent mention of refocusing and divestiture type of reasons givenby the firm managers, the analysts, and the reporters. Second, firms proposingcarveouts will be more diversified than the average firm. Third, the an-nouncement-period returns will be higher in cases where the carveout leadsto a greater increase in firm focus. Fourth, many carveouts will be followedby spinoffs or asset sales. This prediction follows from the observation thatcarveouts are only partial divestitures, as the parent firms often maintain acontrolling stake in the subsidiary firms. A complete divestiture would requirea spinoff or an asset sale. Fifth, if the market can rationally anticipate thesecond events, then the announcement-period returns will also be higher incases where the carveout is followed by a spinoff or an asset sale.
The financing strategy hypothesis and the investment strategy hypothesis.Financing is an integral part of carveouts. This dimension distinguishes car-veouts from spinoffs, which involve no immediate financing, and it relatesthem to asset sales, which are usually for cash and do involve immediatefinancing. The proceeds of carveout may belong to the subsidiary or the parent,depending on whether the issue involves primary or secondary shares, and itmay be used to repay debt, meet other contingencies, or pay for the subsid-iary’s investment projects. Based on these considerations, I propose two sep-arate hypotheses. The first hypothesis is termed the financing strategy hy-pothesis and is related to Lang, Poulsen, and Stulz (1995) and Allen andMcConnell (1998). These studies view asset sales and carveouts as beneficialwhen the proceeds are used to repay debt. Allen and McConnell propose amanagerial discretion hypothesis in which managers derive tangible or intan-gible compensation based on the size of assets under their control. Theydocument that the carveout announcement-period returns are higher in caseswhere the proceeds are used to repay debt and are no longer subject to man-agerial discretion. They emphasize that their evidence does not explain why

162 Journal of Business
carveouts create value (i.e., why the average return is positive), only that dueto agency costs the returns are higher if cash is removed from the firm. Thefinancing strategy hypothesis proposed in this study is a little broader thanAllen and McConnell’s hypothesis. It includes the use of proceeds to repaydebt and to meet other financial contingencies, such as build working capitalor support cash flow needs of existing operations.
The second hypothesis is termed the investment strategy hypothesis. Itemphasizes positive use of proceeds by retaining funds within the subsidiaryfirm to finance new projects or upgrade existing projects. Schipper and Smith(1986) suggest that this is an important motive for carveouts. Carveout an-nouncements are often simultaneous announcements of the subsidiary’s in-vestment opportunities. Many studies have shown that the market reacts pos-itively to the second set of announcements. For example, McConnell andMuscarella (1985) show that announcements of increases in planned capitalexpenditures are associated with significantly positive excess returns. Mik-kelson and Partch (1986) show that the otherwise very negative excess returnsof SEOs are only slightly negative and insignificantly different from zerowhen the stated purpose of the offering is to finance capital expenditures.
Both the financing strategy and the investment strategy hypotheses predictthat the Wall Street Journal reports will mention the corresponding use ofproceeds and that such reports will lead to more positive announcement-periodreturns. The financing strategy hypothesis also predicts that the issue willinvolve secondary shares and that such issue will result in a more positivereaction. In comparison, the investment strategy hypothesis predicts that theissue will involve primary shares and that such issue will result in a morepositive reaction. The last prediction of the financing strategy and investmentstrategy hypotheses is as follows. The financing strategy hypothesis predictsthat the financially constrained parent firms will raise more equity during thefollowing years but that this equity may not result in greater capital expen-ditures. In comparison, the investment strategy hypothesis predicts that sub-sidiary firms will raise more equity and that this equity will result in greatercapital expenditures.
The complexity, undervaluation, and pure play hypothesis. Schipper andSmith (1986) suggest that the initiation of public trading of subsidiary stockis an important reason for the market’s enthusiasm. They argue that a carveoutprecommits the subsidiary to supply audited periodic financial reports, andthey cite examples in which a resulting improvement in investor understandingof the subsidiary business is a major reason for carveout. In the case ofspinoffs, Krishnaswami and Subramaniam (1999) use analyst forecast data toshow that the earnings forecasts of the combined firm are less accurate thanthe earnings forecasts of the separated firms. Vijh (1994) shows that there aresubstantial ex date price and volume effects for spinoffs, which he relates todifferent investor clienteles for the two separated stocks. The attractivenessof pure-play stocks to such investors can also lead to positive announcement-

Equity Carveouts 163
period returns for carveouts, although the effect should be smaller (since onlythe subsidiary stock after carveout can be considered to be a pure-play stock).
The complexity, undervaluation, and pure play hypothesis predicts that theWall Street Journal reports will mention this reason and that such reports willbe associated with higher announcement-period returns. A second predictionfollows from the observation that the complexity, undervaluation, and pureplay effects all increase with the dissimilarity of parent and subsidiary assets.Empirically, this prediction coincides with a prediction of the refocusing strat-egy hypothesis, which says that the announcement-period returns will behigher when the parent and subsidiary firms belong to different industries.
The managerial incentives hypothesis and other miscellaneous hypotheses.Schipper and Smith (1986) argue that carveouts are associated with a restruc-turing of managers’ responsibilities and incentives. Aron (1991) builds a modelin which even the possibility of a future spinoff can create strong incentivesfor divisional managers. She argues that, after spinoff, the stock value of thesubsidiary firm is a cleaner measure of managerial productivity than the stockvalue of the parent firm when the subsidiary was one of its many divisions.A stock-based compensation plan thus motivates the managers to work harderand exploit valuable investment opportunities. Since the value creation comesfrom exploiting investment opportunities, an important prediction of Aron’smodel is identical to a prediction of the investment strategy hypothesis. Bothhypotheses predict that new financing and investment in subsidiary firms willbe higher than in firms of similar characteristics that were not recently spunoff. Finally, following Hite and Owers (1983) and Schipper and Smith (1983),I will also examine whether carveouts facilitate mergers, reduce taxes, or helpwith regulatory compliance.
C. Summary of Different Hypotheses and Possible Overlap
Table 2 summarizes the testable implications of the different hypotheses. Notethat the hypotheses are neither independent nor mutually exclusive. The re-focusing strategy and complexity, undervaluation, and pure play hypothesesboth predict higher returns when the parent and subsidiary firms are in differentindustries; the investment strategy and managerial incentives hypotheses bothpredict that the subsidiary capital expenditures will be higher than matchingfirms; and the asymmetric information and complexity, undervaluation, andpure play hypotheses both assume that investors have incomplete information.Yet, every hypothesis has a distinct motivation and at least one distinct testableimplication.
III. The Data and Methods
A. The Sample of Carveouts
The sample of carveouts used in this study starts with the sample used inVijh (1999). My 1999 sample includes 300 cases during the period 1980–95

164Journal
ofB
usiness
TABLE 2 Summary of the Asymmetric Information and Divestiture Gains Hypotheses of Carveouts
Hypothesis Motivation Testable implications
Asymmetric information Carveouts occur when subsidiary assets areovervalued and nonsubsidiary assets are un-dervalued. Nonsubsidiary assets are usuallybigger, so more positive information isreleased.
1. Excess returns will decrease with decreasingg, the ratio of nonsubsidiary to subsidiaryassets values.*
2. Excess returns will be positive when ,g 1 1zero when , and negative when .g p 0 g ! 1
3. Wall Street Journal reports will mentionasymmetric information types of reasons.Excess returns will be higher in such cases.
Divestiture gains:Refocusing strategy Carveouts are a form of restructuring. Im-
proved focus from separation of parent andsubsidiary business increases the combinedfirm value.
1. Wall Street Journal reports will mentionrefocusing and divestiture types of reasons.Excess returns will be higher in such cases.
2. Parent firms before carveout will be morediversified than average.
3. Excess returns will be higher when parentand subsidiary are in different industries.†
4. Many carveouts will be followed by com-plete divestiture (spinoff or asset sale).
5. Excess returns will be higher when there isa subsequent complete divestiture.
Financing strategy Carveouts are a financing mechanism. Pro-ceeds are used to repay debt and meet otherfinancial contingencies of parent (and possi-bly subsidiary).
1. Wall Street Journal reports will mentionfinancing strategy types of reasons. Excessreturns will be higher in such cases.
2. Issue will involve secondary shares. Excessreturns will be higher for such issues.‡
3. Parents will raise additional capital fromSEOs during surrounding years. But parentcapital expenditures will not be higher thanmatching firms.

Equity
Carveouts
165
Investment strategy Carveouts are a financing mechanism. Pro-ceeds are used to finance new projects orupgrade existing operations of subsidiary.
1. Wall Street Journal reports will mentioninvestment strategy types of reasons. Excessreturns will be higher in such cases.
2. Issue will involve primary shares. Excessreturns will be higher for such issues.‡
3. Subsidiaries will raise additional capitalfrom SEOs during surrounding years.Subsidiary capital expenditures will behigher than matching firms.§
Complexity, undervaluation, and pure play Carveouts result in greater information for asubsidiary that starts trading separately. In-vestors are attracted to such pure plays.
1. Wall Street Journal reports will mentioncomplexity, undervaluation, and pure playtypes of reasons. Excess returns will behigher in such cases.
2. Excess returns will be higher when parentand subsidiary are in different industries.†
Managerial incentives Carveouts enable firms to offer stock-basedcompensation to subsidiary’s managers. Thismotivates them to work harder and exploitinvestment opportunities.
1. Wall Street Journal reports will mentionmanagerial incentives types of reasons. Ex-cess returns will be higher in such cases.
2. Subsidiary capital expenditures will behigher than matching firms.§
* “Excess return” is an abbreviation for carveout announcement-period excess return.† Common to the refocusing strategy hypothesis and the complexity, undervaluation, and pure play hypothesis.‡ Contrasts the financing strategy hypothesis and the investment strategy hypothesis.§ Common to the investment strategy hypothesis and the managerial incentives hypothesis.

166 Journal of Business
for which I could find information on both the parent and the subsidiary firmson the Center for Research in Security Prices (CRSP) tapes.2 I here expandthis sample to include carveouts completed during 1996 and 1997 from theSecurities Data Company (SDC) database. I exclude cases where an an-nouncement date cannot be found by using the procedure described below. Ialso exclude utility issues and penny stocks (i.e., cases where the parent stockprice is less than one dollar on the announcement date). The net result is asample of 336 carveouts completed during the period 1980-97.
I searched the Wall Street Journal Index during the period 1980–94 andits electronic ProQuest version during the period 1995–97 for the first pub-lication date of a carveout announcement during the 2 years before the issuedate. In cases when there is no Wall Street Journal report, I use the Securitiesand Exchange Commission (SEC) filing date in place of the publication date.A total of 311 carveouts in my sample are included in the SDC database. Ican find the filing date in 300 of these 311 cases. In the remaining 25 casesthat I collected from the Mergers and Acquisitions magazine, I can find thefiling date in 24 cases by searching the Lexis/Nexis and the Compact Dis-closure databases. Overall, I have the publication date in 185 cases, the filingdate in 324 cases, both dates in 173 cases, and at least one date in all 336cases.
B. Sample Distribution and Summary Statistics
Panel A of table 3 gives the sample distribution by the calendar year ofannouncement during the period 1980–97. The 336 carveouts issued newequity in the amount of $44.9 billion in the domestic market. The sample ismore concentrated during the 1990s, with 204 of the 336 announcementsoccurring during the period 1990–97. The average offering value has alsogone up, from $84 million during the period 1980–89 to $165 million duringthe period 1990–97.
Panel B of table 3 presents the summary statistics. Given the extremeskewness in variables, the medians and the first and third quartiles of distri-bution are reported. The median parent firm is valued at $720 million, andthe median subsidiary firm is valued at $166 million. The median offering isworth 7.9% of the parent value and 27.5% of the subsidiary value on thelisting date. The median dilution ratio, defined by the new primary sharesoffered to the total shares outstanding after issue, equals 0.203. The medianbook-to-market value equals 0.538 for parent firms and 0.431 for subsidiaryfirms. The subsidiary firms are more likely to be growth firms. Finally, in the
2. I (1999) collected my sample from two sources. First, I purchased a list of carveouts thatoccurred in the period 1980–95 from the Securities Data Company (SDC). Second, I collectedfrom the Mergers and Acquisitions magazine a few carveouts for the period 1991–95 that werenot included in the SDC data. My 1999 sample includes 328 cases for which I could findinformation on only the subsidiary firms. These cases are excluded in this study of the an-nouncement-date returns of parent stocks.

Equity Carveouts 167
TABLE 3 Sample Distribution over Time and Descriptive Statistics for CarveoutAnnouncements, 1980–97
A. The Sample Distribution by the Year of Announcement
YearNumber of
AnnouncementsAverage
Offering ValueTotal Offering
Value
1980 1 11 111981 11 13 1431982 6 16 961983 15 47 7051984 5 56 2801985 20 69 1,3801986 33 99 3,2671987 19 128 2,4321988 10 188 1,8801989 12 78 9361990 8 185 1,4801991 28 63 1,7641992 35 175 6,1251993 40 173 6,9201994 28 140 3,9201995 26 196 5,0961996 28 248 6,9441997 11 137 1,5071980–97 336 133 44,886
B. Other Descriptive Statistics
Item Description
Parent Firms Subsidiary Firms
Q1 Median Q3 Q1 Median Q3
Firm value (mil-lion $) 138 720 2,793 58 166 457
Ratio of offeringvalue to parentor subsidiaryvalue .035 .079 .186 .158 .275 .546
Dilution ratio .116 .203 .357Book-to-market
value .326 .538 .793 .254 .431 .646Parent’s fractional
ownership ofsubsidiary aftercarveout .500 .719 .828
Note.—The sample of 336 carveout announcements during the period 1980–97 is obtained from the SDCand from the Mergers and Acquisitions magazine. It satisfies the following additional requirements: (1) Theparent and subsidiary returns data are available on CRSP tapes, (2) the publication date can be found in theWall Street Journal Index and/or the filing date can be found in the SDC, Lexis/Nexis, or Compact Disclosuredatabases (the earlier of the publication date and the filing date is chosen as the announcement date), (3) utilityissues are excluded, (4) penny stocks (i.e., cases where the parent stock price is less than one dollar onannouncement date) are excluded. The offering value is based on the offering price multiplied by the numberof shares offered in the domestic market and is expressed in millions of dollars. The median offering valueis 49. The firm value is measured by the market value of equity on the first trading day after carveout. Thedilution ratio is measured by the number of primary shares offered, divided by the total outstanding sharesafter issue. The book-to-market value for parent firms is as of the last fiscal year ending before the carveout,and for subsidiary firms as of the first fiscal year ending after the carveout. Given the extreme skewness inall measures, only the first quartile, the median, and the third quartile values are reported.

168 Journal of Business
median case, the parent firm continues to own 71.9% of the subsidiary’soutstanding shares after carveout.
C. The Measurement of Announcement-Period Excess Returns
The measurement of announcement-period excess returns requires addressingquestions related to the measure of excess returns and the length of the an-nouncement period. I use two different measures of excess returns. First, foreach day of the event period, I calculate the difference between the stockreturns and the market returns. The mean market-adjusted excess returns andthe t-statistics are calculated from the distribution of these return differencesfor all stocks included in the sample. Second, for each day of the event period,I also calculate the difference between the stock returns and the expectedstock returns based on a market model. The mean market-model adjustedexcess returns and the t-statistics are calculated from this latter distributionof return differences. The market returns used in both calculations are mea-sured by the returns on the CRSP value-weighted portfolio of all stocks. Toavoid biases arising from possible price runup before announcement, the mar-ket-model parameters are estimated over a 250-day period ending 250 daysbefore the event period (which is shown to begin one day before the firstannouncement date).
Table 4 reports the market reaction on each day from AD � 5 to AD �5, where AD denotes the first announcement date of the carveout and rep-resents the last business day preceding the Wall Street Journal publicationdate in 79 cases, the SEC filing date in 202 cases, and a simultaneous day-before-publication date and filing date in 55 cases. Since the news may arrivebefore or after the end of trading on AD, one must include AD and AD �1 in the announcement period. In addition, one should include AD � 1 ifthere is a significant market reaction on that day because of partial anticipationof news, leakage of news, or reporting delays.
Table 4 shows that the market reaction on each of AD � 1, AD, and AD� 1 is significantly positive, with t-statistics ranging between 2.30 and 3.56.I, therefore, measure the carveout announcement-period returns over a 3-dayperiod spanning AD � 1 to AD � 1 in all subsequent tests. Table 4 alsoshows that, for all 336 carveouts, the 3-day mean market-adjusted excessreturn equals 1.94%, whereas the mean market-model adjusted excess returnequals 1.93% (t-statistics p 5.68 and 5.64). The two alternate measures givenearly identical results. I use the market-adjusted excess returns in all sub-sequent calculations, but the inferences are unchanged by using the market-model excess returns. Finally, table 4 shows that parent stocks earn market-adjusted returns of 14.88% (t-statistic p 3.21) during a 250-day period endingon AD � 2, which could not have contributed to the undervaluation of parentstocks.

Equity
Carveouts
169
TABLE 4 Carveout Announcement-Period Excess Returns of Parent Stocks, 1980–97
Event Date Market-Adjusted Excess Returns Market-Model Adjusted Excess Returns
AD � 5 .03 (.24) .05 (.31)AD � 4 .14 (1.02) .10 (.70)AD � 3 .29 (1.72)* .31 (1.83)*AD � 2 .03 (.20) .01 (.07)AD � 1 .42 (2.30)** .47 (2.48)**AD .67 (3.30)*** .63 (3.05)***AD � 1 .87 (3.56)*** .84 (3.40)***AD � 2 .19 (1.12) .15 (.86)AD � 3 .04 (.23) .04 (.23)AD � 4 �.19 (�1.29) �.22 (�1.44)AD � 5 �.23 (�1.58) �.25 (�1.71)*
toAD � 1 AD � 1 1.94 (5.68)*** 1.93 (5.64)***toAD � 251 AD � 2 14.88 (3.21)***toAD � 501 AD � 252 4.59 (1.32)
Note.—The sample of 336 carveout announcements during 1980–97 is obtained from the SDC and from the Mergers and Acquisitions magazine. It satisfies certain other restrictionsdiscussed in table 3. AD denotes the first announcement date. It represents the day before the Wall Street Journal publication date in 79 cases, the SEC filing date in 202 cases, and asimultaneous day-before-publication date and filing date in 55 cases. Each day, the market-adjusted excess returns are computed by subtracting the value-weighted market returns from thestock returns, and the market-model adjusted excess returns are computed by using a market-model whose parameters are estimated over to . The cumulative excessAD � 501 AD � 252returns over the announcement period of to are obtained by the sum of daily returns for the market model, but not for the market-adjusted returns. In the latter case, theAD � 1 AD � 1cumulative excess returns are obtained by subtracting the cumulative market returns from the cumulative stock returns over the 3-day period. The preannouncement excess returns, over
to and to , are similarly computed by subtracting the cumulative market returns from the cumulative stock returns. In six cases out of the total 336AD � 501 AD � 252 AD � 251 AD � 2cases, the returns data over to are inadequate to compute the market-model parameters. The reported market-model adjusted excess returns are calculated by averagingAD � 501 AD � 252over the remaining observations. The t-statistics are reported in parentheses.
* Significant at the 10% level.** Significant at the 5% level.*** Significant at the 1% level.
170 Journal of Business
IV. Cross-Sectional Tests of the Asymmetric Information Hypothesis
A. The Calculation of g
The calculation of g in Nanda’s model requires the market values of thesubsidiary and nonsubsidiary assets of a parent firm before the announcementdate. The first problem concerns the definition of assets. Nanda assumes anall-equity firm, but real firms have varying amounts of debt. I, therefore, usetwo definitions of assets, one based on total assets, which gives the measureg1, and another based on net assets, which gives the measure g2.
3 The secondproblem concerns the inability to observe separate market values of subsidiaryand nonsubsidiary assets on the announcement date. I overcome this limitationby using the market values on the listing date. This procedure will give theexact g1 and g2 if the unobserved changes in the market values of the subsidiaryand nonsubsidiary assets between the announcement and the listing date areproportional. If the change in nonsubsidiary value is greater, perhaps becauseof the positive information conveyed by carveout, then the calculated valuesof g1 and g2 will be higher than the true values, but it will be so for all firms.The third problem arises because the market values of liabilities and preferredstock are almost never available. I overcome this problem by assuming thatthe market values of liabilities and preferred stock are equal to their bookvalues.
I calculate the number of outstanding shares of the subsidiary before car-veout (old shares) by subtracting the newly issued primary shares from alloutstanding shares on the listing date. I have the data on total shares issuedand the primary versus secondary shares issued in the large majority of car-veouts that are included in the SDC database. However, in the 25 carveoutsthat originated from the Mergers and Acquisitions magazine, I do not havethe data on primary versus secondary shares. In such cases, I assume that allnew shares are primary shares. This approximation is justified by the obser-vation that only primary shares are issued in 64% of all cases and that nearly70% of the total issue volume consists of primary shares. I multiply the numberof old shares of subsidiary firm by the stock price on the listing date tocalculate the market value of the subsidiary stock in the combined firm. Ithen add the book value of assets other than common stock (Compustat item6 minus item 60) in the year ending before carveout, if available, or the yearof carveout, if not, to obtain the subsidiary total assets. I subtract the subsidiarytotal assets from the parent total assets calculated in a similar manner to obtainthe nonsubsidiary total assets. The ratio of nonsubsidiary to subsidiary totalassets equals g1. I obtain g2 by a similar procedure but by assuming that thedebt, other liabilities, and preferred stock are absent.
The above procedure gives values of g1 and g2 in 279 and 292 cases,
3. “Total assets” refers to the bottom line on the assets or the liabilities side of the balancesheet. “Net assets” refers to the common stock; it equals the total assets minus debt, otherliabilities, and preferred stock.

Equity Carveouts 171
respectively. In the remaining cases, I cannot obtain a value because of datalimitations, such as the Compustat data for the subsidiary or the parent firmis not available, the number of shares issued is not available, the calculatedold shares of the subsidiary firm are negative, or the calculated market valueof the nonsubsidiary assets is negative. To overcome the problem posed bythe missing values of g1 and g2, I construct a third relative size measure. Thismeasure equals the ratio of the market value of all outstanding equity of thesubsidiary firm to the equity of the parent firm on the listing date. As a practicalmatter, the correlation between the decile ranks based on the three relativesize measures is very high, ranging between 0.867 and 0.925. However, thereis no obvious separation based on the third measure similar to versusg ≤ 1
for the first two measures.g 1 1
B. The Relationship between the Excess Returns and g
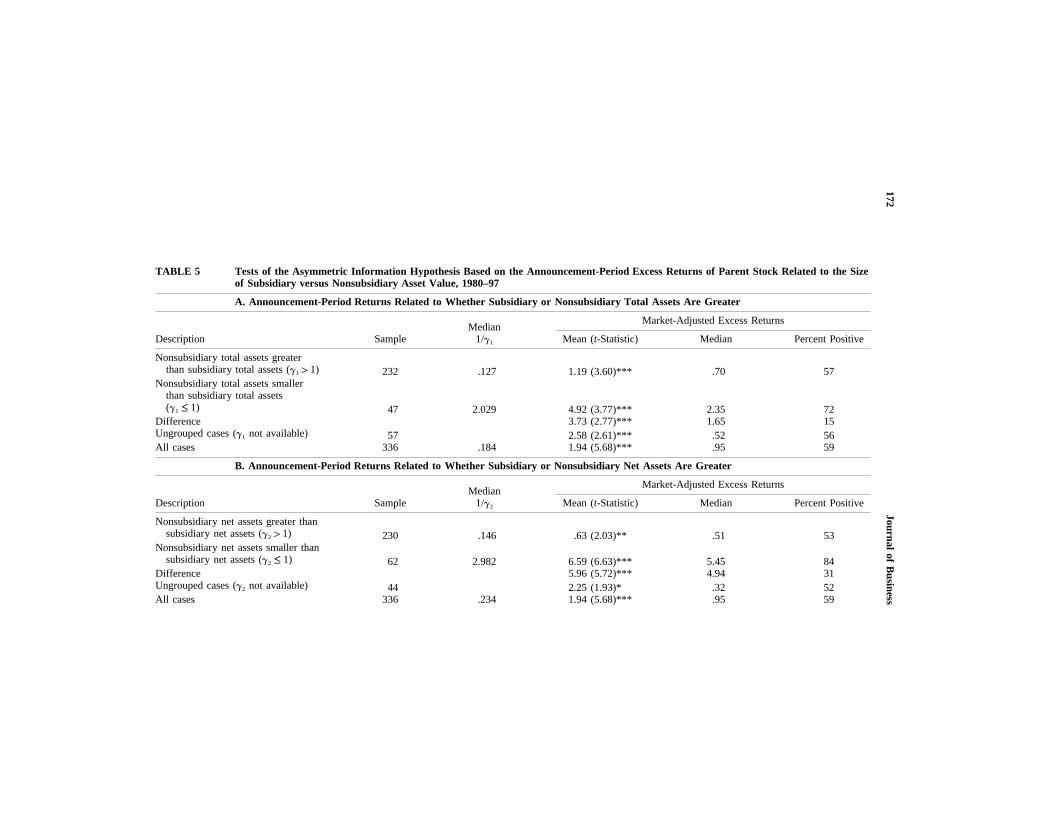
Panel A of table 5 shows the announcement-period returns across subsetsformed by g1, the ratio of the market values of the nonsubsidiary and sub-sidiary total assets. The mean market-adjusted excess return equals 1.19%
for the 232 cases for which the nonsubsidiary assets are(t-statistic p 3.60)greater than the subsidiary assets, or The corresponding value equalsg 1 1.1
4.92% ( ) for the 47 cases for which the nonsubsidiary assetst-statistic p 3.77are smaller than the subsidiary assets, or Recall that the asymmetricg ≤ 1.1
information model predicts a negative return for these cases. The differencebetween average returns for the and the cases equals 3.73%g 1 1 g ≤ 11 1
which is significant at the 1% level. The difference be-(t-statistic p 2.77),tween median returns and the percent positive provides nonparametric con-firmation of the results. Panel B of table 5 shows that the evidence with g2
is even stronger. All pieces of evidence in panels A and B are highly significant,but they are so in the opposite direction of the prediction of Nanda’s asym-metric information model.
Panel C of table 5 shows the excess returns across 10 subsets formed bythe decile ranks of 1/g1, 1/g2, and the third relative size measure. I prefer touse 1/g instead of g, as it is conventional in the divestitures literature to usethe size of subsidiary assets divided by the total assets. The rank correlationbetween the decile ranks and the mean excess returns equals 0.84, 0.64, and0.77 with the three measures (significant at the 1%, 10%, and 5% levels).These tests provide further evidence that the excess returns are increasingwith the size of subsidiary assets relative to the nonsubsidiary assets.
My evidence is consistent with Allen and McConnell (1998), who find thatthe announcement-period returns are positively related to another relative sizemeasure, formed by the ratio of the book value of assets of the carveoutsubsidiary to the book value of assets of the precarveout firm. However, theyuse this variable as one of the control variables in their paper and do notdiscuss its role in distinguishing between the asymmetric information and thedivestiture gains hypothesis. I interpret my evidence as inconsistent with the
172Journal
ofB
usiness
TABLE 5 Tests of the Asymmetric Information Hypothesis Based on the Announcement-Period Excess Returns of Parent Stock Related to the Sizeof Subsidiary versus Nonsubsidiary Asset Value, 1980–97
A. Announcement-Period Returns Related to Whether Subsidiary or Nonsubsidiary Total Assets Are Greater
Description SampleMedian
1/g1
Market-Adjusted Excess Returns
Mean (t-Statistic) Median Percent Positive
Nonsubsidiary total assets greaterthan subsidiary total assets ( )g 1 11 232 .127 1.19 (3.60)*** .70 57
Nonsubsidiary total assets smallerthan subsidiary total assets( )g ≤ 11 47 2.029 4.92 (3.77)*** 2.35 72
Difference 3.73 (2.77)*** 1.65 15Ungrouped cases ( not available)g1 57 2.58 (2.61)*** .52 56All cases 336 .184 1.94 (5.68)*** .95 59
B. Announcement-Period Returns Related to Whether Subsidiary or Nonsubsidiary Net Assets Are Greater
Description SampleMedian
1/g2
Market-Adjusted Excess Returns
Mean (t-Statistic) Median Percent Positive
Nonsubsidiary net assets greater thansubsidiary net assets ( )g 1 12 230 .146 .63 (2.03)** .51 53
Nonsubsidiary net assets smaller thansubsidiary net assets ( )g ≤ 12 62 2.982 6.59 (6.63)*** 5.45 84
Difference 5.96 (5.72)*** 4.94 31Ungrouped cases ( not available)g2 44 2.25 (1.93)* .32 52All cases 336 .234 1.94 (5.68)*** .95 59

Equity
Carveouts
173
C. Parent Announcement-Period Returns Related to Decile Ranks Formed by Different Relative Size Measures
Decile Rank
Ratio of Subsidiary Total Assets to Non-subsidiary Total Assets ( )1/g1
Ratio of Subsidiary Net Assets to Non-subsidiary Net Assets )1/g2
Ratio of Subsidiary Stock Value to ParentStock Value
SampleMedian
1/g1 Excess Returna SampleMedian
1/g2 Excess Returna Sample Median Ratio Excess Returna
Lowest 27 .012 .33 29 .011 .41 33 .022 .052 28 .033 1.10 29 .032 .47 34 .070 �.193 28 .063 �.17 29 .072 .37 33 .109 .834 28 .092 .71 30 .114 .22 34 .180 .835 28 .146 .40 29 .187 1.22 33 .254 1.586 28 .242 2.12 29 .300 1.76 34 .369 �.027 28 .359 1.83 30 .565 �.70 34 .543 .898 28 .664 1.79 29 .833 2.53 33 .763 5.869 28 1.100 3.85 29 1.807 5.32 34 1.087 5.49Highest 28 2.607 6.13 29 6.403 7.54 33 1.724 4.30Unranked 57 2.58 44 2.25 1 �1.08
Total 336 .184 1.94 336 .234 1.94 336 .313 1.94
Rank correlation .84*** .64* .77**
Note.—The sample of 336 carveout announcements during the period 1980–97 is obtained from the SDC and from the Mergers and Acquisitions magazine. It satisfies certain otherrestrictions discussed in table 3. The grouping procedure in panel A uses , the ratio of the market value of nonsubsidiary to subsidiary total assets. The grouping procedure in panel Bg1
uses , the ratio of the market value of nonsubsidiary to subsidiary net assets. The calculation of both and is discussed in Section IV.A. The three ranking procedures in panel C useg g g2 1 2
, , and the ratio of subsidiary market value to parent market value on the listing date. Some observations in both panels cannot be grouped or ranked because of data limitations.1/g 1/g1 2
Excess returns during the announcement period are calculated by subtracting the cumulative value-weighted market returns over to from the cumulative parent stock returns.AD � 1 AD � 1The t-statistics in panels A and B are calculated by using the cross-sectional distribution of market-adjusted returns and are reported in parentheses. The Spearman rank correlations in panelC are calculated by the simple correlation between the decile ranking and the ranking of mean market-adjusted returns.
* Significant at the 10% level.** Significant at the 5% level.*** Significant at the 1% level.a Mean market-adjusted excess return.

174 Journal of Business
asymmetric information hypothesis, which suggests that a higher value ofsubsidiary assets relative to nonsubsidiary assets conveys more of the negativenews and less of the positive news concerning asset values. My evidence isconsistent with the divestiture gains hypothesis, which suggests that the di-vestiture of a larger subsidiary is associated with a higher increase in themarket value of the parent firm.
V. Cross-Sectional Tests of the Divestiture Gains Hypothesis
A. Evidence Based on the Wall Street Journal Reports
I begin my investigation by analyzing statements made by the firm managers,the analysts, and the reporters to assess the motives behind carveouts. I ex-amine every relevant statement from the first Wall Street Journal report thatcarries a story of the proposed carveout to calculate a zero-one (no-yes) coderelated to the components of the asymmetric information and divestiture gainshypotheses as shown in table 6. Multiple statements related to the same subsethypothesis for the same firm are counted only once.
The Wall Street Journal reports exist in 185 cases, but one or more relevantstatements are available in 134 cases. These are the bigger carveouts, withan average offering value of $235 million, accounting for 70% of the totaloffering value of my sample. Their average announcement-period excess re-turn equals 2.44% which is somewhat higher than the(t-statistic p 4.69),1.62% return for the remaining carveouts. The difference(t-statistic p 3.57)equals 0.82% and can be attributed to statements related(t-statistic p 1.19)to divestiture gains that constitute the bulk of all statements.
Table 6 shows that only 11 out of 134 reports, or 8% of the sample, containstatements suggesting that the issuers may be offering overpriced subsidiarystock. Eight reports suggest that the subsidiary’s industry may be overvalued,and three suggest that the subsidiary itself may be overvalued. Allstate Cor-poration, carved out by Sears, Roebuck & Company, provides an example ofthe former: “The offering comes at what seems an ideal time, given the soaringvalues of property and casualty stocks since last August’s Hurricane Andrew”(Wall Street Journal, March 19, 1993). Sabre Group Holdings, Incorporated,carved out by AMR Corporation, provides an example of the latter: “Butsome airline industry experts aren’t climbing on board. They note that AMRChairman Robert Crandall is a take-no-prisoners competitor who rarely handsout gifts. ‘Bob Crandall has always known when to sell off at the top,’ saysErnest Arvai, a consultant to the reservation business based in Windham,N.H.” (Wall Street Journal, October 7, 1996).
There is only one report suggesting that the nonsubsidiary assets may beovervalued. Surprisingly, there are 38 reports suggesting that the subsidiary,and possibly the parent, may be undervalued. These reports are not in thenature of overvalued-subsidiary–undervalued-parent, as suggested by Nanda’sasymmetric information hypothesis, but rather in the nature of ignored and

Equity Carveouts 175
TABLE 6 Analysis of the Wall Street Journal Reports for Evidence on theAsymmetric Information Hypothesis versus the Divestiture GainsHypothesis, 1980–97
Description Code Number of Firms
Firms for which there is at least one statementsuggesting asymmetric information: 12
Overvalued subsidiary assets AA 11Overvalued nonsubsidiary assets AB 1Undervalued subsidiary or nonsubsidiary as-
sets (same as DU below) DU See belowFirms for which there is at least one statement
suggesting divestiture gains: 133Refocusing strategy hypothesis: 82
Direct statement of spinoff, split-off, assetsale, or other forms of divestiture DS1 64
Lack of fit or focus, improve corporatestrategy, restructure operations DS2 42
Financing strategy hypothesis: repay debt,build working capital, finance existingoperations, proceeds will be used forgeneral corporate purposes DF 76
Investment strategy hypothesis: invest innew projects or upgrade existingoperations DI 34
Complexity, undervaluation, and pure playhypothesis: unlock hidden values, cre-ate pure play stocks DU 38
Managerial incentives hypothesis: creatingincentive pay for managers, givingstock to managers DM 3
Miscellaneous hypotheses: 16Takeover defense DT 8Tax reduction DX 4Regulatory compliance DR 6
Note.—This table includes 134 firms during the period 1980–97 for which the first Wall Street Journalreport on carveout gives one or more reasons related to the asymmetric information hypothesis or the divestituregains hypothesis. The table shows the frequency distribution of firms for which the firm managers, the analysts,or the reporters made one or more statements relating to the following broad categories.
unlocked values, as suggested by the complexity, undervaluation, and pureplay hypothesis. Nabisco Holdings Corporation, carved out by RJR NabiscoHoldings Corporation, provides an example: “The planned Nabisco shareoffering is the culmination of a frustrating, two-year struggle by RJR man-agement to increase the value of its tobacco-tainted stock by getting WallStreet to focus on the performance of red-hot Nabisco” (Wall Street Journal,October 31, 1994).
I find that 133 reports contain one or more statements related to the broadcategory of divestiture gains. Alternately, only one report does not mentionsuch reasons. Statements related to the refocusing strategy hypothesis are themost numerous. There are 64 reports with statements of intended spinoff,split-off, asset sale, or other forms of divestiture, and 42 reports with statementsthat the carveout is part of a broader strategy to improve fit or focus, improvecorporate strategy, or restructure operations. Lucent Technology, Incorporated,

176 Journal of Business
carved out by AT&T Corporation, provides an example of the former: “AT&Thas set initial plans to spin off 15% to 20% of its equipment business in aninitial public offering in March or April. The remaining 80% to 85% of thestock is expected to be distributed to AT&T shareholders as part of a plannedthree-way breakup of AT&T into separate, publicly held long-distance, com-puter, and equipment companies” (Wall Street Journal, February 6, 1996).ITT Educational Services, Incorporated, carved out by ITT Corporation, pro-vides an example of the latter: “The announcement underscored ITT’s recentefforts to revamp its collection of businesses” (Wall Street Journal, March15, 1994).
Statements related to the financing strategy hypothesis are the second mostnumerous. Younkers, Incorporated, carved out by Equitable of Iowa Company,provides an example: “Equitable said it will use proceeds from the plannedsale of its 4,703,555 Younkers shares for its life insurance and annuity busi-ness. Younkers itself plans to sell 1,466,445 new shares and use the proceedsto reduce debt” (Wall Street Journal, February 26, 1992).
Statements related to investment strategy are less numerous. Switchco, In-corporated, carved out by Graphics Scanning Corporation, provides an ex-ample: “Graphic Scanning, a data services communications concern, said theproceeds would help fund research and development and other operations.Switchco is starting up production of interactive packet switching products”(Wall Street Journal, August 11, 1981).
Surprisingly, there are only three statements related to the managerial in-centives hypothesis. Also uncommon are statements related to takeover de-fense, tax reduction, and regulatory compliance. Still, reports containing thesefour types of reasons are twice as numerous as reports raising concerns aboutovervalued subsidiary or subsidiary’s industry. The relative frequencies ofdifferent statements convey an unambiguous impression that carveouts aremotivated by divestiture types of reasons.
B. Evidence on the Refocusing Strategy Hypothesis
Before carveout, the parent firms tend to be unfocused in their operations.The 184 firms for which I can find the Compustat segment data have anaverage of 2.94 business segments and 5.16 different SIC codes in the yearbefore carveout. This compares with 1.53 business segments and 2.59 differentSIC codes for all firms included in the segment file during the period 1983–97(a total of 90,816 firm years). Desai and Jain (1999) document that even the155 parent firms that spun off subsidiaries during the period 1975–91 havean average of 3.14 business segments. It is, therefore, not surprising thatrefocusing strategy types of reasons are more common than any other typeof reasons in table 6.
Panel A of table 7 examines whether carveouts that mention refocusingstrategy types of reasons earn higher announcement-period excess returns thanthe others. The difference equals 0.40% which is positive(t-statistic p 0.54),

Equity
Carveouts
177
TABLE 7 Tests of the Refocusing Strategy Hypothesis of Carveouts Based on the Announcement-Period Excess Returns of Parent Stocks, 1980–97
Description
Market-Adjusted Excess Returns
Number Mean (t-Statistic) Median Percent Positive
Panel A. Based on the Wall Street Journal reports of refocusingstrategy:
Reports suggesting that carveout is a result of refocusing strategy,codes DS1 or DS2 from table 6 82 2.25 (3.65)*** 1.30 65
No such reports 254 1.85 (4.53)*** .79 57Difference of means—reports of refocusing strategy vs. no reports .40 (.54)
Panel B. Based on the relatedness of parent and subsidiary busi-nesses:
Different two-digit SIC code of parent and subsidiary 221 2.34 (5.27)*** 1.14 63Same two-digit SIC code of parent and subsidiary 100 .80 (1.44) �.14 47Incomplete SIC code data 15 3.84 (2.72)** 3.20 73Difference of means—different vs. same two-digit SIC code 1.54 (2.17)**
Panel C. Based on the second event after carveout:Spun off 43 3.86 (4.02)*** 2.31 74Acquired by third party 74 2.60 (3.39)*** .53 57Acquired back by parent 28 2.01 (1.73)* 1.90 71No second event 191 1.25 (2.83)*** .53 54Difference of means—spun off vs. no second event 2.61 (2.47)**
Acquired by third party vs. no second event 1.35 (1.53)Acquired back by parent vs. no second event .76 (0.61)
Note.—The sample of 336 carveout announcements during the period 1980–97 is obtained from the SDC and from the Mergers and Acquisitions magazine. It satisfies certain otherrestrictions discussed in table 3. Section II.B and table 6 provide a description of the refocusing strategy hypothesis. Excess returns during the announcement period are calculated bysubtracting the cumulative value-weighted market returns over to from the cumulative parent stock returns. The t-statistics of sample means are calculated by using the cross-AD � 1 AD � 1sectional distribution of market-adjusted returns and are reported in parentheses. The t-statistics in difference-of-means tests are calculated by assuming that the two samples may have unequalvariances.
* Significant at the 10% level.** Significant at the 5% level.*** Significant at the 1% level.

178 Journal of Business
but statistically insignificant.4 Perhaps refocusing is such an essential part ofcarveouts that explicit statements do not result in a greater market reaction.
Panel B of table 7 examines whether the excess returns are higher whenthe refocusing benefits are greater, which occurs when the parent and subsid-iary businesses are unrelated. I classify the parent and subsidiary businessesas unrelated if their two-digit SIC codes are different. The SIC codes areobtained from Compustat when available, and from CRSP otherwise.5 PanelB shows that the SIC codes are different in 221 cases and the same in 100cases. The excess returns average 2.34% in the first case and 0.80% in thesecond case The difference equals 1.54%(t-statistics p 5.27 and 1.44).
which is significant at the 5% level.6(t-statistic p 2.17),The final tests of the refocusing strategy hypothesis are based on the second
event after carveout. Following Klein, Rosenfeld, and Beranek (1991), forevery carveout, I examine whether there is a later complete spinoff, an ac-quisition by a third party, or an acquisition by the parent firm before the endof 1998. The first two actions result in a complete divestiture of the subsidiaryfirm. The third action can be interpreted as an admission that a spinoff or athird-party acquisition was intended but given up.
Panel C of table 7 shows that a second event occurs in 145 cases, or 43%of all cases. Third-party acquisitions are the most frequent second events (74cases), followed by spinoffs (43 cases) and parent acquisitions (28 cases). Ifthe market can rationally anticipate the second event on the announcementof the first event, then these cases should result in higher announcement-period excess returns. There is some evidence to support this conjecture. Thecarveouts that are followed by a complete spinoff earn announcement-periodexcess returns that are 2.61% higher than carveouts that are followed by nosecond event before the end of 1998 Corresponding dif-(t-statistic p 2.47).ferences for carveouts that are followed by a third-party acquisition are sub-stantial but not statistically significant, while the differences for carveouts thatare followed by a parent acquisition are small and insignificant.7
4. Relating announcement-period excess returns to the type of statements in the Wall StreetJournal reports raises a potential concern. In 10 cases, the publication date is at least 2 daysafter the first announcement date, which is defined as the earlier of the day before publicationdate and the SEC filing date. The market may not have known the reasons given for thesecarveouts on the first announcement date. To correct for this problem, I repeated my tests afteradding the 3-day excess returns around the publication date to the original announcement-periodexcess returns in these 10 cases. The results were nearly unchanged. I prefer to report results inthis article with the original returns, because the cross-sectional variables other than the statementtype are known on the first announcement date.
5. Kahle and Walkling (1996) show that the SIC codes from Compustat are generally moreaccurate.
6. As in my 1999 research, I also examined whether the announcement-period excess returnsare higher when the precarveout firm has four or more segments. The results were insignificantand are not reported.
7. I also examined the second announcement-period excess returns. The subsidiary stocksthat are spun off earn –0.60%, the stocks acquired by third parties earn 14.31%, and the stocksacquired back by parents earn 8.26% The corresponding(t-statistics p 0.52, 5.95, and 1.96).parent stocks earn 4.80%, 1.12%, and 2.50% (t-statistics p 3.60, 1.76, and 2.13).

Equity Carveouts 179
TABLE 8 Tests of the Financing Strategy Hypothesis and the Investment StrategyHypothesis of Carveouts Based on the Announcement-Period ExcessReturns of Parent Stocks, 1980–97
Market-Adjusted Excess Returns
Description N Mean (t-Statistic) Median Percent Positive
Panel A. Based on the Wall Street Journalreports of financing strategy:
Reports suggesting that carveout is a result offinancing strategy, code DF from table 6 76 3.04 (4.06)*** 1.42 70
No such reports 260 1.63 (4.24)*** .77 56Difference of means—reports of financing strategy
vs. no reports 1.41 (1.68)*Panel B. Based on the Wall Street Journal reports of
investment strategy:Reports suggesting that carveout is a result of
investment strategy, code DI from table 6 34 4.04 (2.83)*** 1.70 74No such reports 302 1.71 (4.97)*** .79 57Difference of means—reports of investment
strategy vs. no reports 2.33 (1.59)Panel C. Based on primary versus secondary stock is-
sue:Only primary shares issued 186 1.62 (3.64)*** .86 59Only secondary shares issued 47 1.02 (1.47) 1.01 57Both primary and secondary shares issued 58 4.20 (4.49)*** 1.66 66Data on primary vs. secondary not available 45 1.33 (1.31) .75 51Difference of means—both primary and secondary
vs. only primary 2.58 (2.49)**Difference of means—both primary and secondary
vs. only secondary 3.18 (2.76)***Difference of means—only primary vs. only
secondary .58 (.72)
Note.—The sample of 336 carveout announcements during the period 1980–97 is obtained from the SDCand from the Mergers and Acquisitions magazine. It satisfies certain other restrictions discussed in table 3.Section II.B and table 6 provide a description of the financing strategy hypothesis and the investment strategyhypothesis. Excess returns during the announcement period are calculated by subtracting the cumulative value-weighted market returns over to from the cumulative parent stock returns. The t-statistics ofAD � 1 AD � 1sample means are calculated by using the cross-sectional distribution of market-adjusted returns and are reportedin parentheses. The t-statistics in difference-of-means tests are calculated by assuming that the two sampleshave possibly unequal variances.
* Significant at the 10% level.** Significant at the 5% level.*** Significant at the 1% level.
The combined evidence of tables 6 and 7 supports the refocusing strategyhypothesis. I point to the large frequency of related statements in the WallStreet Journal reports, the higher returns when the parent and subsidiarybusinesses are unrelated, the large frequency of subsequent complete dives-titures, and the higher first announcement-period returns when there is a sub-sequent complete divestiture.
C. Evidence on the Financing Strategy and Investment Strategy Hypotheses
Panel A of table 8 shows that the 76 carveouts for which the Wall StreetJournal reports mention financing strategy type of reasons (repay debt, buildworking capital, finance existing operations, general corporate purposes) earn
180Journal
ofB
usiness
TABLE 9 Additional Equity Offerings by Parent and Subsidiary Firms versus Industry and Size Matching Firms during 3 Years before to 3 Yearsafter the Carveout Issue Date, 1980–97
Period
Number of Equity Offerings Capital Raised (Million $)
Parent orSubsidiary
FirmsMatching
Firms Difference -Statistic2x
Parent orSubsidiary
FirmsMatching
Firms Difference
Panel A: Parent firmsversus matchingfirms:
Year �3 22 19 3 .23 2,024 1,049 975Year �2 19 27 �8 1.49 5,550 3,140 2,410Year �1 21 29 �8 1.38 6,353 4,376 1,977Years �3, �2, and �1 62 75 �13 1.55 13,926 8,565 5,361
Carveout issue dateYear �1 22 9 13 5.72** 4,776 1,265 3,511Year �2 12 14 �2 .16 3,182 904 2,278Year �3 18 9 9 3.13 5,090 2,093 2,997Years �1, �2, and �3 52 32 20 5.44** 13,049 4,261 8,788Years �3 to �3 114 107 7 .33 26,975 12,826 14,149
Equity
Carveouts
181
Panel B. Subsidiary firmsvs. matching firms:
Year �3 21 680Year �2 26 1,056Year �1 33 1,766Years �3, �2, and �1 80 3,502
Carveout issue date 336 44,688Year �1 36 21 15 4.31* 5,785 1,571 4,214Year �2 25 19 6 .88 2,813 1,433 1,380Year �3 30 11 19 9.38*** 3,369 1,735 1,634Year �1, �2, and �3 91 51 40 14.29*** 11,967 4,738 7,229Years �3 to �3 427 131 296 56,655 8,240 48,415
Note.—The sample of 336 carveout announcements during the period 1980–97 is obtained from the Securities Data Company (SDC) and from the Mergers and Acquisitions magazine.It satisfies certain other restrictions discussed in table 3. For each parent and subsidiary firm, a matching firm is chosen, which is the closest in market value of all firms with the same 2-digit SIC code. The SIC code is obtained from Compustat when available, and from CRSP otherwise. If the SIC code is not available (as for a few subsidiary firms), then matching is doneby market value alone. For each sample and matching firm, information on additional equity offerings is obtained by scanning the seasoned equity offerings data from SDC. A -statistic2xwith one degree of freedom tests whether the difference between number of equity offerings by the sample and matching firms is statistically significant (Sachs 1982, pp. 467–72).
* Significant at the 10% level.** Significant at the 5% level.*** Significant at the 1% level.

182 Journal of Business
TABLE 10 Capital Expenditures by Parent and Subsidiary Firms versus Industryand Size Matching Firms during 1 Year before to 3 Years after theCarveout Issue Date, 1980–97
Capital Expendi-tures for Sample
Firms
Capital Expendi-tures for Matching
Firms
Fiscal Year Number Median Number Median Difference in Medians
Panel A. Parentfirms vs.matchingfirms:
Year �1 240 .0431 251 .0549 �.0118*Year 0 238 .0528 243 .0557 �.0029Year �1 222 .0528 222 .0529 �.0001Year �2 198 .0507 200 .0527 �.0020*Year �3 169 .0443 172 .0549 �.0106***
Panel B. Subsid-iary firmsvs. match-ing firms:
Year �1 260 .0373 263 .0432 �.0059**Year 0 288 .0443 244 .0416 .0027Year �1 280 .0506 231 .0416 .0090Year �2 238 .0513 203 .0396 .0117*Year �3 200 .0446 181 .0443 .0003
Note.—The sample of 336 carveout announcements during 1980–97 is obtained from the SDC and fromthe Mergers and Acquisitions magazine. It satisfies certain other restrictions discussed in table 3. For eachparent and subsidiary firm, a matching firm is chosen, which is the closest in market value of all firms withthe same two-digit SIC code. The SIC code is obtained from Compustat, when available, and from CRSPotherwise. If the SIC code is not available (as for a few subsidiary firms), then matching is done by marketvalue alone. Annual data on capital expenditures and sales are obtained from Compustat for a 5-year periodbeginning one fiscal year before the carveout year. Capital expenditures are normalized by sales and thencompared across sample and matching firms. Due to extreme skewness in capital expenditures, the mean valuesare practically meaningless and are not reported. The Wilcoxon rank sum test is used to measure the statisticalsignificance of the difference in capital expenditures for sample and matching firms (Sachs 1982, pp. 293–303).
* Significant at the 10% level.** Significant at the 5% level.*** Significant at the 1% level.
1.41% more than the remaining cases Panel B of table 8(t-statistic p 1.68).shows that the 34 carveouts for which the Wall Street Journal reports mentioninvestment strategy type of reasons (invest in new projects, upgrade existingoperations) earn 2.33% more than the remaining cases (t-statistic p 1.59).The difference in excess returns is greater in the second case but, perhapsdue to the smaller sample size and the assumption of unequal subsamplevariances in all difference of means tests reported in this article, the t-statisticis not significant at the 10% confidence level. I later show that the regressiontests that implicitly assume equal subsample variances give significant t-sta-tistics. I, therefore, interpret these results as an endorsement of the financingstrategy and investment strategy hypotheses.
Panel C of table 8 relates the excess returns to whether the issue includesprimary or secondary shares. I have the required data in 291 cases. Only
Equity Carveouts 183
primary shares are issued in 186 cases, only secondary shares are issued in47 cases, and both primary and secondary shares are issued in the remaining58 cases. The excess returns are substantially higher when both primary andsecondary shares are issued than when only primary or only secondary sharesare issued. The difference between only primary or only secondary issues isinsignificant. I have no satisfactory explanation for these results.
Table 9 compares the equity financing activity of the parent and subsidiaryfirms with their matching firms. For each sample firm, I choose a matchingfirm that has the closest market value of all firms with the same two-digitSIC code. I then scan the SDC files for data on SEOs. Panel A shows thatthe parent firms raise $26,975 million from 114 SEOs over a period starting3 years before the carveout issue date and ending 3 years after the carveout.In comparison, the matching firms raise $12,826 million from 107 SEOs. Theparent firms raise 2.10 times as much equity as their size and industry matchingfirms. This ratio increases to 3.16 if I include the proceeds of secondary sharessold in carveout (which equal 30.15% of the total proceeds of $44,886 millionin table 3).
Panel B of table 9 shows that even the subsidiary firms are heavy equityissuers despite the carveout. The subsidiary firms raise an additional $11,967million from 91 SEOs over a 3-year period starting after the carveout issuedate. In comparison, the matching firms raise $3,502 million from 80 SEOsbefore the issue date and $4,738 million from 51 SEOs after the issue date.Over the combined period, the subsidiary firms raise 1.45 times as muchequity as their size and industry matching firms, a ratio that increases to 5.26if I include the proceeds of primary shares sold in carveout.
The evidence of table 9 supports both the financing strategy and investmentstrategy hypotheses. To distinguish between them, I examine the capital ex-penditures data. Panel A of table 10 shows that the median capital expendituresnormalized by sales for parent firms are less than for matching firms duringeach year of a 5-year period beginning one fiscal year before the carveoutyear. The difference is statistically significant during 3 of these 5 years. PanelB of table 10 shows that the median capital expenditures normalized by salesfor subsidiary firms are less than for matching firms in the fiscal year beforethe carveout year but then increase to more than for matching firms duringthe following 4 years. The difference is statistically significant in years �1and �2.
The combined evidence of tables 9 and 10 shows that the parent firms raisesubstantial amounts of equity, yet their capital expenditures are lower thanfor matching firms. This evidence is consistent with the financing strategyhypothesis. The parent firms may be using the proceeds to retire debt or meetother financial contingencies, as suggested by Allen and McConnell (1998).The subsidiary firms raise more equity than their matching firms, but theyalso spend more on capital expenditures. This evidence is consistent with theinvestment strategy hypothesis.
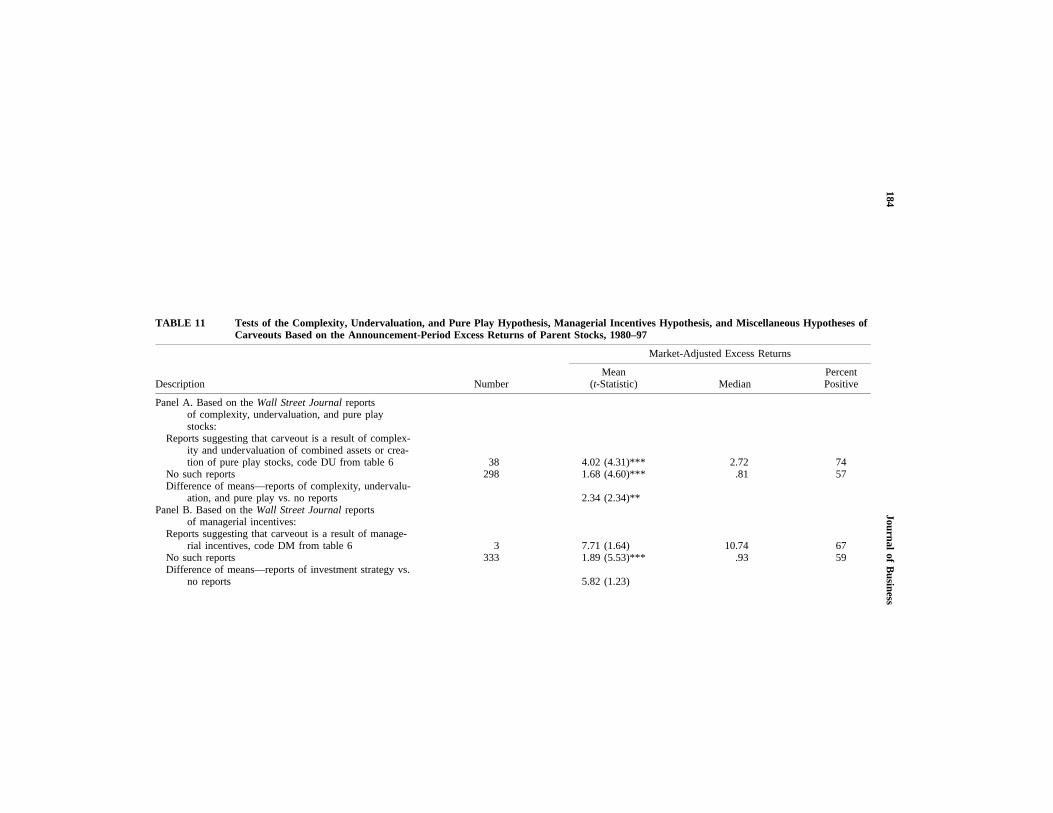
184Journal
ofB
usiness
TABLE 11 Tests of the Complexity, Undervaluation, and Pure Play Hypothesis, Managerial Incentives Hypothesis, and Miscellaneous Hypotheses ofCarveouts Based on the Announcement-Period Excess Returns of Parent Stocks, 1980–97
Description Number
Market-Adjusted Excess Returns
Mean(t-Statistic) Median
PercentPositive
Panel A. Based on the Wall Street Journal reportsof complexity, undervaluation, and pure playstocks:
Reports suggesting that carveout is a result of complex-ity and undervaluation of combined assets or crea-tion of pure play stocks, code DU from table 6 38 4.02 (4.31)*** 2.72 74
No such reports 298 1.68 (4.60)*** .81 57Difference of means—reports of complexity, undervalu-
ation, and pure play vs. no reports 2.34 (2.34)**Panel B. Based on the Wall Street Journal reports
of managerial incentives:Reports suggesting that carveout is a result of manage-
rial incentives, code DM from table 6 3 7.71 (1.64) 10.74 67No such reports 333 1.89 (5.53)*** .93 59Difference of means—reports of investment strategy vs.
no reports 5.82 (1.23)

Equity
Carveouts
185
Panel C: Based on the Wall Street Journal reports of mis-cellaneous reasons:
Reports suggesting that carveout is part of a takeoverdefense, code DT from table 6 8 3.08 (1.26) 3.95 63
Reports suggesting that carveout is part of a tax reduc-tion strategy, code DX from table 6 4 1.17 (.19) �3.17 50
Reports suggesting that carveout is a result of regula-tory reasons, code DR from table 6 6 .10 (.11) 1.05 66
No such reports 320 1.93 (5.53)*** .95 59Since none of the miscellaneous factors are significant,
the difference of means tests are not reported
Note.—The sample of 336 carveout announcements during 1980–97 is obtained from the SDC and from the Mergers and Acquisitions magazine. It satisfies certain other restrictionsdiscussed in table 3. Section II.B and table 6 provide a description of the complexity, undervaluation, and pure play hypothesis, managerial incentives hypothesis, and miscellaneous hypotheses.Excess returns during the announcement period are calculated by subtracting the cumulative value-weighted market returns over to from the cumulative parent stock returns.AD � 1 AD � 1The t-statistics of sample means are calculated by using the cross-sectional distribution of market-adjusted returns and are reported in parentheses. The t-statistics in difference-of-means testsare calculated by assuming that the two samples may have unequal variances.
* Significant at the 10% level.** Significant at the 5% level.*** Significant at the 1% level.

186Journal
ofB
usiness
TABLE 12 Multivariate Tests of the Carveout Announcement-Period Excess Returns, 1980–97
Variable (1) (2) (3) (4) (5) (6) (7) (8) (9) (10)
Intercept �.82 2.34 1.63 1.71 1.68 1.50 1.66 �1.64 1.19 .90(�1.34) (5.54)*** (4.19)*** (4.76)*** (4.65)*** (3.75)*** (4.56)*** (�2.32)** (2.26)** (1.66)*
REL_ SIZE_ RANK .62 .69(5.36)*** (5.64)***
SAME_INDUSTRY �1.54 �1.66 �1.30 �1.30(�2.04)** (�2.20)** (�1.64)* (�1.65)*
DF 1.41 .33 .35 .36(1.73)* (.38) (.38) (.39)
DI 2.33 1.68 2.29 2.26(2.06)** (1.46) (1.90)** (1.89)*
DU 2.34 2.69 2.24 1.88(2.17)** (2.43)** (1.92)* (1.61)
PS 2.69 2.42 2.84 2.93(3.00)*** (2.80)*** (3.13)*** (3.25)***
SPINOFF 2.20 2.25(2.16)** (2.14)**
Sample 335 321 336 336 336 291 336 277 277 277Adjusted 2R .077 .010 .006 .010 .011 .027 .011 .155 .059 .071
Note.—The sample of 336 carveout announcements during 1980–97 is obtained from the SDC and from the Mergers and Acquisitions magazine. It satisfies certain other restrictions discussedin table 3. The dependent variable is the excess return calculated by subtracting the cumulative value-weighted market return over to from the cumulative parent stock returns.AD � 1 AD � 1The independent variables are as follows: REL_SIZE_RANK: decile rank of the ratio of subsidiary market value to parent market value on listing date; SAME_INDUSTRY: A dummy that takesthe value 1 if the parent and subsidiary have the same 2-digit SIC code, 0 otherwise; DF: a dummy that takes the value 1 if there is a Wall Street Journal report that mentions financing motives,0 otherwise; DI: a dummy that takes the value 1 if there is a Wall Street Journal report that mentions investment motives, 0 otherwise; DU: a dummy that takes the value 1 if there is a Wall StreetJournal report that mentions complexity, undervaluation, and pure play reasons, 0 otherwise; PS: a dummy that takes the value 1 if both primary and secondary shares are issued, 0 otherwise;SPINOFF: a dummy that takes the value 1 if the carveout is followed by spinoff of the subsidiary before 1998, 0 otherwise. Section V.A and table 6 provide a further description of the DF, DI,and DU variables. The t-statistics are reported in parentheses.
* Significant at the 10% level.** Significant at the 5% level.*** Significant at the 1% level.

Equity Carveouts 187
D. Evidence on the Remaining Divestiture Gains Hypotheses
Panel A of table 11 shows that the 38 carveouts for which the Wall StreetJournal reports mention complexity, undervaluation, and pure play type ofreasons earn 2.34% more than the remaining cases This(t-statistic p 2.34).evidence simultaneously supports the divestiture gains hypothesis and con-tradicts Nanda’s asymmetric information hypothesis. In many cases, the re-ports suggest that the subsidiary is hidden inside a complex organization andtherefore undervalued by the market (recall the report on Nabisco HoldingsCorporation, which refers to the subsidiary as “red-hot”). Although not shownin tables, the 11 firms for which the reports raise concerns of overvaluedsubsidiary or subsidiary’s industry earn excess returns of 2.37%, insignifi-cantly different from 1.93% for the remaining 325 firms. Further evidence onthe complexity, undervaluation, and pure play hypothesis is provided by anearlier result from table 7, which shows that the excess returns are higherwhen the parent and subsidiary firms are in different industries.
Panels B and C of table 11 show the excess returns of firms that mentionmanagerial incentives, takeover defense, tax reduction, and regulatory com-pliance type of reasons. The small sample sizes make these cases indistin-guishable from the remaining cases. However, an earlier result from table 10that shows that subsidiary firms undertake greater capital expenditures thanmatching firms provides some support for the managerial incentiveshypothesis.
E. Regressions
Table 12 shows univariate and multivariate regressions of the carveout an-nouncement-period excess returns. The regressions serve two purposes. First,the univariate regressions provide an alternative to the difference of meanstests in tables 5, 7, 8, and 11 by assuming that the subsample variances areequal. Second, the multivariate regressions test whether the many cross-sec-tional determinants of excess returns remain significant in the presence ofeach other.
The cross-sectional determinants are as follows: REL_SIZE_RANK p dec-ile rank of the ratio of subsidiary market value to parent market value onlisting date; SAME_INDUSTRY p a dummy that takes the value 1 if theparent and subsidiary have the same two-digit SIC code, 0 otherwise; DF pa dummy that takes the value 1 if a Wall Street Journal report mentionsfinancing motives, 0 otherwise; DI p a dummy that takes the value 1 if aWall Street Journal report mentions investment motives, 0 otherwise; DU pa dummy that takes the value 1 if a Wall Street Journal report mentionscomplexity, undervaluation, and pure play reasons, 0 otherwise; PS p adummy that takes the value 1 if both primary and secondary shares are issued,0 otherwise; SPINOFF p a dummy that takes the value 1 if the carveout isfollowed by spinoff of the subsidiary before 1998, 0 otherwise.
Univariate regressions (1)–(7) show that each of the above seven variables

188 Journal of Business
is significant at the 10% confidence level, or better. The variableREL_SIZE_RANK is the dominant one, and it remains highly significant inthe opposite direction of the asymmetric information hypothesis.
Multivariate regressions follow next. Regression (8) includes all variablesexcept SPINOFF, which uses information available after the carveout. Re-gression (9) excludes both SPINOFF and REL_SIZE_RANK. The secondvariable is excluded because it is a proxy for wealth gains on account of allof the divestiture gains hypotheses, which are separately captured bySAME_INDUSTRY, DF, DI, and DU. Regression (10) includes SPINOFF,but it excludes REL_SIZE_RANK. Together, these regressions show the fol-lowing results. First, DF becomes insignificant in the presence of other var-iables. Second, the remaining variables are quite stable. Their coefficients arestatistically significant in at least two of the three multivariate regressions.Overall, the regression results uphold and even strengthen the evidence infavor of the different divestiture gains hypotheses.
VI. Conclusions
Using a sample of 336 carveouts that were done during the period 1980–97,this article examines whether the positive announcement-period returns ofequity carveouts reflect the resolution of asymmetric information concerningthe parent and subsidiary stock values, or the likely wealth gains from di-vestitures. The asymmetric information hypothesis is based on Nanda (1991),and it extends the Myers and Majluf (1984) framework to the case of parentand subsidiary stock issues. This framework has been used to explain thenegative announcement-period returns of SEOs and the negative long-termexcess returns of IPOs and SEOs. The divestiture gains hypothesis is basedon Schipper and Smith (1986). It has long been used to explain the positivemarket reaction to spinoffs and asset sales.
The first part of this article shows that, unlike other security issues, asym-metric information does not explain the carveout decision. I reach this con-clusion by deriving and testing a key prediction of the asymmetric informationmodel, which states that the announcement-period returns should decreasewith an increase in the ratio of overvalued subsidiary assets to the undervaluednonsubsidiary assets and eventually become negative as this ratio exceedsone. My results are significant in the opposite direction of this prediction.
The remainder of this article shows many results that support the divestituregains hypothesis. First, I analyze the Wall Street Journal reports accompanyingthe carveout, and I find extensive evidence that the firm managers, the analysts,and the reporters treat carveouts like divestitures. Second, the parent firmsbefore carveout are as diversified as the parent firms before spinoffs, and themarket reaction is higher when they divest subsidiary business unrelated tothe parent business. Third, many carveouts are followed by a complete spinoffor a third-party acquisition. I find some evidence that the market anticipatesthis second event on the announcement of carveout and reacts more enthu-
Equity Carveouts 189
siastically in such cases. Fourth, the market also reacts positively when theWall Street Journal reports mention that the carveout proceeds will be usedto repay debt or meet other financial contingencies and to invest in newprojects. I show that the parent and subsidiary firms issue more equity thansize and industry matching firms despite the carveout. The additional equityappears to be used to meet the financial contingencies of parent firms and theinvestment needs of subsidiary firms. Fifth, I show that the market reactsmore enthusiastically when the Wall Street Journal reports mention that car-veout is intended to create pure plays and thereby unlock hidden values insidea complex firm structure. The combined evidence of this article thus showsthat the market reacts positively to the announcement of carveouts becauseit thinks that carveouts create value by divesting unrelated businesses, enablinga complete spinoff or a third-party acquisition, providing new financing, un-dertaking new investments, and reducing stock complexity.
References
Allen, J. W., and McConnell, J. J. 1998. Equity carveouts and managerial discretion. Journal ofFinance 53 (February): 163–86.
Aron, D. J. 1991. Using the capital market as a monitor: Corporate spinoffs in an agencyframework. Rand Journal of Economics 22 (Winter): 505–18.
Asquith, P., and Mullins, D. W. 1986. Equity issues and offering dilution. Journal of FinancialEconomics 15 (January/February): 61–89.
Berger, P. G., and Ofek, E. 1995. Diversification’s effect on firm value. Journal of FinancialEconomics 37 (January): 39–65.
Comment, R., and Jarrell, G. A. 1995. Corporate focus and stock returns. Journal of FinancialEconomics 37 (January): 67–87.
Daley, L.; Mehrotra, V.; and Sivakumar, R. 1997. Corporate focus and value creation: Evidencefrom spinoffs. Journal of Financial Economics 45 (August): 257–81.
Desai, H., and Jain, P. C. 1999. Firm performance and focus: Long-run stock market performancefollowing spinoffs. Journal of Financial Economics 54 (October): 75–101.
Hand, J. R. M., and Skantz, T. R. 1997. The bad news in equity carveouts. Working paper.Chapel Hill: University of North Carolina.
Hite, G. L., and Owers, J. E. 1983. Security price reactions around corporate spinoff announce-ments. Journal of Financial Economics 12 (December): 409–36.
John, K., and Ofek, E. 1995. Asset sales and increase in focus. Journal of Financial Economics37 (January): 105–26.
Kahle, K. M., and Walkling, R. A. 1996. The impact of industry classifications on finance research.Journal of Financial and Quantitative Analysis 31 (September): 309–35.
Klein, A. 1986. The timing and substance of divestiture announcements: Individual, simultaneous,and cumulative effects. Journal of Finance 41 (July): 685–95.
Klein, A.; Rosenfeld, J.; and Beranek, W. 1991. The two stages of an equity carveout and theprice response of parent and subsidiary stock. Managerial and Decision Economics 12 (De-cember): 449–60.
Krishnaswami, S., and Subramaniam, V. 1999. Information asymmetry, valuation, and the cor-porate spin-off decision. Journal of Financial Economics 53 (July): 73–112.
Lang, L.; Poulsen, A.; and Stulz, R. 1995. Asset sales, firm performance, and the agency costsof managerial discretion. Journal of Financial Economics 37 (January): 3–37.
Larraza-Kintana, M.; Wiseman, R. M.; Gomez-Mejia, L. R.; and Welbourne, T. M. 2000. Framing,compensation, and employment risk influences on CEO risk taking behavior. Working paper.Tempe: Arizona State University.
Masulis, R. W., and Korwar, A. N. 1986. Seasoned equity offerings: An empirical investigation.Journal of Financial Economics 15 (January/February): 91–118.

190 Journal of Business
McConnell, J. J., and Muscarella, C. J. 1985. Corporate capital expenditure decisions and themarket value of the firm. Journal of Financial Economics 14 (September): 399–422.
Mikkelson, W. H., and Partch, M. M. 1986. Valuation effects of securities offerings and theissuance process. Journal of Financial Economics 15 (January/February): 31–60.
Myers, S. C., and Majluf, N. S. 1984. Corporate financing and investment decisions when firmshave information that investors do not have. Journal of Financial Economics 13 (June):187–221.
Nanda, V. 1991. On the good news in equity carveouts. Journal of Finance 46 (December):1717–37.
Sachs, L. 1982. Applied Statistics. New York: Springer-Verlag.Schipper, K., and Smith, A. 1983. Effects of recontracting on shareholder wealth: The case of
voluntary spin-offs. Journal of Financial Economics 12 (December): 437–67.Schipper, K., and Smith, A. 1986. A comparison of equity carveouts and seasoned equity of-
ferings: Share price effects and corporate restructuring. Journal of Financial Economics 15(January/February): 153–86.
Slovin, M. B.; Sushka, M. E.; and Ferraro, S. R. 1995. A comparison of the information conveyedby equity carveouts, spinoffs, and asset sell-offs. Journal of Financial Economics 37 (January):89–104.
Vijh, A. M. 1994. The spinoff and merger ex-date effects. Journal of Finance 49 (June): 581–609.Vijh, A. M. 1999. Long term returns from equity carveouts. Journal of Financial Economics 51
(February): 273–308.