the plane truth
TRANSCRIPT

THE PLANE TRUTH
Air Quality Impacts of Airport
Operations and Strategies for Sustainability: A Case Study of the Los Angeles World Airports
A comprehensive project submitted in partial satisfaction of the requirements for the degree
Master of Arts in Urban Planning from the University of California, Los Angeles
By: Colleen Callahan
Client: The Coalition for Clean Air
With support from: Environment Now
June, 2010

ii | P a g e
Neither the University of California, the School of Public Affairs, the
Coalition for Clean Air, nor Environment Now either supports or disavows the
findings in the report listed herein. University affiliations are for identification only;
the University is not involved in or responsible for the project.
Disclaimer

iii | P a g e
I would like to thank all the air quality and aviation experts that provided
valuable information for this report. Staff at the Coalition for Clean Air─
particularly Martin Schlageter, Interim Executive Director, and Luis Cabrales,
Deputy Director of Campaigns─ provided support and guidance to make this
project possible. I am grateful to Environment Now for financially supporting the
report and Mara Burstein, Air and Communications Program Manager at
Environment Now, for her strategic thoughts on this project. I also greatly
appreciate the guidance and feedback from my academic advisors, Brian Taylor
and Chris Tilly.
Acknowledgments

iv | P a g e
Executive Summary…….…………………………………………………….1
Introduction …………………………………………………………………...5
Client, Goals, and Structure of the Report…………………..5
Overview of the Problem………………………….…………..7
Methodology…………………………………………………...17
Setting, Issues, and Analysis ……………………………………………..20
Setting: Southern California…………………………………20
Airport Ownership and Governance……………………...…23
Regionalism……………………………………………………24
The Los Angeles World Airports……………………………..26
The LAX Community Benefits Agreement………..………...30
The LAWA‘s Sustainability Efforts………………….……….36
Air Pollution………………..…………………………………..37
Air Quality Impacts of Airports…..………….........................46
Main Sources of Pollution from Airport Operations…....…..51
State of Standards, Regulations, and Programs…………..58
Findings and Recommendations…………………………………………76
Recommendations for Overall Emission Reductions……..76
Table of Contents

v | P a g e
Target Source: Ground Access Transportation……………79
Target Source: Aircraft…...…….…………………………….82
Target Source: Ground Support Equipment…...………….84
Target Source: Airport Vehicle Fleets………………………85
Target Source: Stationary Sources…..……………………..86
Conclusion……………………………………………………….…………..88
Appendix……………………………………………………………………..89
Glossary of Terms and Acronyms…………….……………89 Labor Dynamics………………………………………………94 Other Airport Environmental Impacts………………………95 Other Environmental Initiatives of the LAWA……………..98 Works Cited…………………………………………………..100

1 | P a g e
Aviation facilitates economic and cultural exchange because it is one of
the fastest and most efficient ways to transport products and people.1 Aviation is
also one of the most energy intensive and polluting modes of transportation.2
Staff at the US Joint Planning Development Office predict that air pollution
emissions from the aviation sector are likely to increase by 140 to 200 percent by
2025, unless aggressive actions are taken to control and reduce aviation‘s
environmental footprint.3
This report was commissioned by the Coalition for Clean Air (CCA) ─ a
non-profit organization that works to restore California‘s air quality through
advocacy, outreach, and education ─ as a first step to potentially develop a
campaign to reduce air pollution from airports in the Los Angeles region. The
report provides a case study of the Los Angeles World Airports (LAWA), which
owns and operates Los Angeles International Airport, Van Nuys Airport, Ontario
International Airport, and Palmdale Regional Airport. As such, the report explores
the LAWA as the basis to explore the following: 1) aviation‘s impact on local and
global air pollution, 2) the sources of air pollution related to airport operations,
3) the current regulatory landscape that governs airport emissions, and
4) strategic opportunities to reduce emissions from these main sources of air
pollution. The Los Angeles International Airport (LAX) is a focus of this report
because LAX is the most significant source of airport-related air pollution in
Southern California. In addition, the best emission source data and travel
behavior data exist for LAX.
Airport-related pollution comes from numerous sources. Nitrogen
oxides─ a precursor to ozone smog─ result in local and regional health impacts.
The following sources contribute to nitrogen oxide (NOx) emissions from LAX-
related operations:
1) Ground access transportation for travelers and cargo accounts for
approximately 43 percent of NOx emissions from all LAX-related
operations.
2) Aircraft accounts for 40 percent.
3) Ground service equipment accounts for 11 percent.
4) Airport vehicles account for four percent.
Executive Summary

2 | P a g e
5) Stationary sources, primarily from energy production, account for two
percent.
Any campaign to significantly and comprehensively reduce emissions from
the LAWA-related operations should seek to address these emissions sources.
There are myriad ways that clean air advocates could approach such a
campaign. Based on communications with experts and an extensive literature
review, I summarized 10 key findings and recommended associated actions for a
clean air campaign based on these findings. My criteria for evaluating and
prioritizing recommendations was based on: 1) impact─ the importance of the
recommended action in terms of emission reduction potential over the current
baseline and 2) ease of implementation─ the potential feasibility of a clean air
advocacy organization based in Los Angeles to move the target agency to adopt
the recommended action. I ranked the following five recommended actions as a
high priority.
Create a Clean Air Action Plan for the LAWA
Finding: The LAWA‘s various environmental data collection,
programmatic, and policy efforts concentrate on LAX while often not applying to
its other airports. Van Nuys Airport has the second largest number of landings
and take-offs in the Los Angeles County, however, the airport is virtually ignored
in the LAWA‘s Sustainability Plan. Furthermore, there is only limited alignment
between the environmental programs at LAX and at Ontario International Airport.
Even at LAX, however, the LAWA does not coordinate its various air quality
measures under a comprehensive plan.
Recommendation and Target: Clean air advocates should encourage the
LAWA to set a health-based emission reduction goal for all three airports and
develop a plan to comprehensively target airport-related emission sources
through a consistent application of programs, goals, and policies among the
three airports. Such a plan should be included as part of the Southern California
Association of Governments‘ Regional Transportation Plan.
As a starting point, the LAX Community Benefits Agreement contains
commitments that should be enforceable and applied to the other airports. A
comprehensive clean air action plan should also include measures to protect
vulnerable populations living near the LAWA airports. Effective and relatively
inexpensive air filtration systems are available on the market and have already
been installed in schools near the Ports of Los Angeles and Port of Long Beach,
with support from the ports and the South Coast Air Quality Management District.
3 | P a g e
Ban Lead in Aviation Gasoline
Finding: Lead is banned in all fuel in the US except aviation gasoline
(avgas). Avgas is used in piston-engine, normally non-commercial aircraft that
frequent generation aviation airports including Van Nuys Airport, the largest
general aviation airport in the world. On a national basis, avgas is the largest
single source of air-borne lead emissions.4 The lead found in leaded avgas is a
potent neurotoxin. The US Centers for Disease Control and Prevention
concluded in 2005 that there is ―no safe threshold for blood lead.‖5 The Federal
Aviation Administration (FAA) certified a non-lead alternative, AGE85, but it is not
widely used in part because the FAA has been slow to certify AGE85 for all types
of small planes. On April 28, 2010 the EPA Administrator Lisa Jackson issued an
―Advance Notice of Proposed Rulemaking on Lead Emissions From Piston-
Engine Aircraft Using Leaded Aviation Gasoline‖.6
Recommendation and Target: Clean air advocates should submit
comments to the EPA about the high levels of lead particulate found in the areas
surrounding Van Nuys Airport and other general aviation airports in Los Angeles
County, as well as the number of schools located within a three-mile buffer zone
of key airports (see pages 37 through 39 for this information). Clean air
advocates should then track the EPA‘s rulemaking process and advocate for a
rule that will protect the approximately three million children who attend school
and the up to 16 million adults who reside in close proximity to one or more of the
almost 20,000 airports in the U.S. frequented by piston-engine aircraft.
Fully Implement the LAX Community Benefits Agreement
Finding: Implementation of the LAX Community Benefits Agreement
(CBA) is moving at a slow pace and the LAWA has much further to go to meet
many of its commitments as part of the CBA. For example, the LAWA agreed to
convert all on-airport ground service equipment (GSE) to the cleanest technology
available by 2015. Currently, only approximately a quarter of LAX‘s tenant GSE
is zero-emission.7
Recommendation and Target: Monitoring the LAWA‘s progress in
implementing the LAX Community Benefits Agreement (CBA) should be a high
priority for clean air advocates because most major emission sources from LAX
operations are addressed in the CBA. Clean air advocates should seek to ensure
that the LAWA meets its commitments.

4 | P a g e
Focus on Heavy-duty Trucks
Finding: Ontario Airport is part of an expanding freight movement system
in which trucks move freight from the Port of Los Angeles and Port of Long
Beach to the Inland Empire‘s freight loading facilities, warehouses, rail yards, and
airports. Diesel trucks also deliver products to airport tenants and airliners at
LAX, which ranks 13th in the world in air cargo tonnage handled.8 However, the
LAWA does not track commercial truck trips at its airports.9 The lack of data
indicates a lack of focus on this emission source.
Recommendations and Target: First of all, clean air advocates should
request that the LAWA collect and make publically available data on truck trips
and their contribution to airport-related air pollution. This is important because
managing a source of pollution requires the ability to measure that pollution
source. Second, clean air advocates should request that the LAWA pursue a
policy to phase-out the oldest and dirtiest trucks that enter onto the LAWA
property. The LAWA should explore the San Pedro Ports Clean Trucks Program,
already implemented at the Port of Los Angeles and Port of Long Beach, as a
model program. The Clean Trucks Program progressively bans all trucks that do
not meet the most recent (2007) federal emission standards by 2012.10 The
LAWA serves as a landlord at its airports and as such the LAWA should be able
to set terms for the trucking companies that do business on its property.
Target Aircraft and Airports in State Implementation Plans
Finding: Although aircraft are a major source of air pollution comparable to
industrial sources, they escape inclusion in State Implementation Plans, the US
Environmental Protection Agency‘s (EPA) principal means of achieving cleaner
air in air quality nonattainment areas.11 This omission has serious consequences
in efforts to both monitor and reduce air pollution.12 In California, the Air
Resources Board faces obstacles in its ability to regulate airport-related sources.
However, the agency faces similar challenges in regulating the shipping and
railroad industries and has found some creative ways to target emissions related
to these industries.
Recommendation and Target: Clean air advocates should work with staff
at the California Air Resources Board (CARB) to explore creative ways to
address emissions from aircraft and other airport-related sources. In addition to
exploring regulatory strategies, CARB should conduct more research about the
health impacts, including cancer risk, from airports.

5 | P a g e
REPORT CLIENT, OBJECTIVE, AND STRUCTURE
This report was commissioned by the Coalition for Clean Air (CCA). With
offices in Los Angeles, Fresno, and Sacramento, the CCA is a statewide non-
profit organization that since 1971 has worked to restore California‘s air quality
through advocacy, outreach, and education. The report serves as a first step for
the Coalition for Clean Air to potentially develop a campaign to reduce air
pollution from airport operations in the Los Angeles region. Support for this
research comes from Environment Now, a private non-profit foundation based in
Santa Monica. Environment Now's mission is to be an active leader in creating
measurably effective environmental programs to protect and restore California's
environment.
The focus of this report is on the Los Angeles World Airports (LAWA),
which owns and operates four airports in Southern California. The report aims to
set a roadmap for staff at the CCA and other clean air advocates wanting to
understand: 1) aviation‘s impact on local and global air pollution, 2) the sources
of air pollution related to the LAWA operations, 3) the current regulatory
landscape that governs the LAWA-related emissions, and 4) strategic
opportunities to reduce emissions from these main sources of air pollution.
I begin the report by summarizing the problem of air pollution associated
with airport-related emissions. Then, in the ‗Setting, Issues, and Analysis‘
chapter, I describe the regional and governing context in which the LAWA
operates, introduce important environmental initiatives at the LAWA‘s airports,
state the health and environmental impacts of key air pollutants, and describe
what the literature reveals about air quality near airports. I then highlight the
major sources of emissions from LAX operations. Finally, I analyze the state of
regulations and programs that affect air pollution from the LAWA‘s operations,
analyze the effectiveness of these efforts, and identify regulatory gaps and
potential opportunities for additional emission reductions.
In the ‗Findings and Recommendations‘ chapter, I summarize 10 key
problems and recommend associated actions that clean air advocates could
encourage specific agencies to achieve. I develop these recommendations both
Introduction

6 | P a g e
from my review of the literature and from my communications with citizen
activists, scientists, airport operations, and air regulators. My criteria for
evaluating and prioritizing recommendations is based on: 1) impact─ the
importance of the recommended action in terms of emission reduction potential
over the current baseline and 2) ease of implementation─ the potential feasibility
of a clean air advocacy organization based in Los Angeles to move the target
agency to adopt the recommended action.
Figure 1
Airports in the Greater Los Angeles Region

7 | P a g e
OVERVIEW OF THE PROBLEM
The aviation industry emits air pollution
Aircraft and the vehicles, facilities, and operations that support aviation
emit many types of ―criteria air pollutants,‖i including nitrogen oxides (NOx),
particulate matter (PM), carbon monoxide (CO), and sulfur oxides (SOx) that
cause local environmental and health problems. For example, NOx ─ combined
with volatile organic compounds (VOC) in the presence of sunshine ─ is a key
precursor to ground-level ozone. Ozone (smog) is a powerful oxidant that can
damage the respiratory tract and induce symptoms such as coughing, chest
tightness, shortness of breath, worsening of asthma symptoms, and even
death.13 The majority of our nation‘s busiest airports fall in ozone non-attainment
areas.14
Aviation contributes approximately 0.5 percent of the total US inventory of
NOx pollution.15 According to members of the State and Territorial Air Pollution
Program Administrators, NOx emissions from major airports are often greater
than emissions from large stationary sources such as refineries and electrical
generating facilities.16 Table 1 shows the contributions that the nation‘s largest
airports have on regional NOx inventories. Considering the myriad sources of
NOx pollution, even a small percentage in the total NOx inventory represents a
large amount of pollution.
Los Angeles International Airport is one of the largest sources of NOx and
VOC emissions in the South Coast Air Basin.17 The staff of the South Coast Air
Quality Management District (SCAQMD) estimated that LAX contributes one
percent of the Air Basin‘s annual NOx emissions. To put the airport‘s emissions
in perspective, LAX‘s 6,522 tons of NOx emissions in 1993 placed it as the top
emitter of this pollutant in the South Coast Air Basin, well ahead of second place
Mobil Oil Corporation (2,731 tons), and third place Chevron Corporation (1,921
i The U.S. Environmental Protection Agency sets National Ambient Air Quality Standards
for six common air pollutants known as ―criteria pollutants‖ because EPA develops
human health-based and/or environmentally-based criteria for setting permissible levels
for these six pollutants. These pollutants are particle pollution (often referred to as
particulate matter), ground-level ozone, carbon monoxide, sulfur oxides, nitrogen oxides,
and lead. Source: U.S. Environmental Protection Agency,
http://www.epa.gov/air/urbanair/.

8 | P a g e
tons). With regard to VOC, LAX‘s 1993 VOC emissions were almost three times
the emissions from the basin‘s largest oil refinery and more than 10 times the
VOC emissions from Santa Ana‘s John Wayne Airport.18
Table 1
Airport Contributions to NOx Inventories
Source: Federal Aviation Administration, Office of Energy and Environment. “Aviation and Emissions: A Primer.” January, 2005. http://www.faa.gov/regulations_policies/policy_guidance/envir_policy/media/aeprimer.pdf
Aircraft− just one source of airport-related emissions− is a major source of
SOx pollution in the South Coast Air Basin. As illustrated in Table 2, aircraft are
the fifth largest source of SOx emissions. The SCAQMD expects this ranking to
jump to number three by 2014.19 It should be noted that the most recent regional
and state emission inventories do not address airport emissions cumulatively.
Not included in the inventory are other sources of airport related emissions, such
as the equipment that services the aircraft and the vehicles going to and from an
airport. Therefore, the inventories underestimate the role that the aviation sector
plays in emission inventories.

9 | P a g e
Table 2
Top 10 Sources of SOx Emissions (2002, 2014, and 2023)
in the South Coast Air Basin, from Highest to Lowest
Source: South Coast Air Quality Management District, “2007 Air Quality Management
Plan.” http://www.aqmd.gov/aqmp/07aqmp/draft/07aqmp.pdf.
A total of 48 airports were identified as having reportable operations within the District
boundaries.
Aircraft is currently not one of the top ten emitters of NOx in region, but
SCAQMD expects aircraft‘s contribution to NOx pollution in the South Coast
Basin to grow significantly to the fourth top source of NOx pollution by 2023, as
indicated in Table 3.20 This is due to expected growth in air travel and reductions
in other sources of emissions.

10 | P a g e
Table 3
Top Ten Sources of NOx Emissions (2002, 2014, and 2023)
in the South Coast Air Basin, from Highest to Lowest
Source: South Coast Air Quality Management District, “2007 Air Quality Management Plan.” http://www.aqmd.gov/aqmp/07aqmp/draft/07aqmp.pdf. A total of 48 airports were identified as having reportable operations within the District boundaries.

11 | P a g e
Aviation emits greenhouse gases
The Intergovernmental Panel on Climate Change concluded in 1999 that
aircraft alone accounted for 13 percent of all carbon dioxide emissions (CO2)
from the transportation sector and was responsible for 3.5 percent of global
climate change.21 CO2 is the greenhouse gas with the most significant impact on
climate change. Airplanes emit more CO2 per passenger-mile than most other
modes of transportation because of their high energy intensity.22
While aircraft fuel efficiencies have steadily increased over the past
several decades, demand for air travel has grown more rapidly than efficiency
improvements, causing CO2 and other greenhouse gases emissions to continue
to increase.23 These trends will continue under a ―business-as-usual‖ scenario
where the global economy continues to grow over the long-term and there are no
specific policies targeting aviation related greenhouse gas emissions.24 Table 4
illustrates the growth in US world greenhouse gas emissions.
Table 4
US and World Greenhouse Gas Emissions
Units: Millions of metric tons of CO2 equivalent
Year: 1990 Year: 2005 % Change from 1990 to 2005
World
Total Aircraft: Domestic and International
─ 641.0 ─
United States
Commercial, Domestic 136.7 150.4 10% increase
General Aviation, Domestic 9.4 13.8 47% increase
Source: McCollum, D.; Gould, G.; Greene, D. “Greenhouse Gas Emissions from
Aviation and Marine Transportation: Mitigation Potential and Policies.” Pew Center on Global Climate Change. Dec 2009.

12 | P a g e
Air travel is down, but long-term growth will likely occur
The US aviation industry experienced turbulence during the first decade
of the twentieth century. Negatively impacted by the September 11, 2001 terrorist
attacks, the industry rebounded by 2006. However, unprecedented fuel prices in
2008 followed by a worsening global economic recession constrained the airline
industry in 2008 and 2009.25 In 2008, the US airline industry experienced $5.8
billion in operating losses for the year and multiple bankruptcies. Prior to the
fourth quarter of 2007, the industry had experienced six consecutive quarters of
operating profits totaling $11.8 billion.26
During the first half of the decade, the Los Angeles World Airports
announced several airport projects designed to accommodate expected growth
in both passenger and cargo air traffic, but since then business at these airports
has decreased. Such projects at Los Angeles International Airport (LAX) and
LA/Ontario International Airport are still moving forward despite passenger and
cargo operations that are lower than forecasted.
LA/Ontario International Airport (ONT) exemplifies the turbulence in the
airline industry during this past decade. Until recently, ONT was setting growth
records. Airlines flocked to the Inland Empire airfield in what Los Angeles Mayor
Antonio Villaraigosa hailed as the "great first steps" to regionalizing air travel in
Southern California.27 However, ONT has been hit harder than any other airport
in Southern California by the aviation fuel and economic crisis.28 In the fall of
2008, flights were down approximately one-third from the previous year,
frustrating promises by politicians to shift some service away from LAX.29
Officials for the Los Angeles World Airports say that ONT and LAX are
particularly affected because they are neither hubs nor headquarters for major
domestic airlines; when economic times are bad, airlines concentrate flights at
their hubs to save money and to take advantage of their established markets.30
Despite the recent dip in air traffic nationwide and locally, officials at the
Federal Aviation Administration (FAA) continue to forecast long-term aviation
growth. Their 2009 forecast for commercial aviation anticipates a sharp decline in
activity in the near- term, with a return to growth over the long-term. Specifically,
this forecast predicts that the US commercial aviation industry will break a new
record and carry one billion passengers by 2016.31 At a more local level, staff at
the Southern California Association of Governments (SCAG) predict that air
passenger demand in the region will more than double to 170 million passengers
in 2030 and that air cargo will more than triple to 8.7 million tons in 2030.32

13 | P a g e
As aviation traffic increases, so will the environmental impacts
Airport-related air pollution and greenhouse gas emissions are projected
to grow as the demand for air travel is expected to increase more than aviation
technology, operations, or other advancements over the long-term.33 In 2005,
staff at the US Department of Transportation (DOT) predicted that aircraft
greenhouse emissions would increase 60 percent by 2025.34
Other projections are even more staggering. In 2007, experts at the US
DOT Volpe Center forecasted aviation-related CO2 globally to rise from 572
million tons in 2000 to 1,228 million by 2025, a 114 percent increase.35 These
experts also predicted that NOx pollution around airports would rise from 2.5
million tons in 2000 to 6.1 in 2025, a 144 percent increase.36 Finally,
computations provided to the US House of Representatives by staff at the Joint
Planning Development Office show that aviation noise pollution and air pollution
emissions are likely to increase by a whopping 140-200 percent by 2025 under
future aviation growth scenarios, unless aggressive actions are taken to control
and reduce aviation‘s environmental footprint.37
While these predictions from 2005 and 2007 are likely somewhat inflated
based on the recent downturn in air travel, the timeline for reaching these
projected numbers has merely shifted. Given what will likely be a long-term
increase in air travel, these emission forecasts cannot be ignored. Aviation will be
able to count on technology to reduce some emissions per passenger mile, but
the long-term growth in air travel─ both an enabler and a product of the
burgeoning global economy─ is likely to outpace technology efficiency gains.38
This is at a time when other sources of pollution are decreasing. For most states
and localities with major airports and seaports, aircraft and international marine
vessels are the only two source sectors where emissions are projected to
increase in the future.39
14 | P a g e
Air quality regulators and airports managers face challenges─
while also missing opportunities─ to reduce airport-related air
pollution
Airport-related emissions are subject to a complex, multidimensional
patchwork of regulations and voluntary programs. Most airport-related emission
sources are independently regulated through equipment specific regulations,
standards, and operational guidelines, which are established by a variety of
agencies. For example, stationary sources at airports, like power boilers and
refrigeration chillers, must meet independent state regulations. And the Federal
Aviation Administration is responsible for enforcing aircraft emissions standards
established by the US Environmental Protection Agency based on the
international standards set by International Civil Aviation Organization (ICOA).
The International Civil Aviation Organization (ICAO) is a United Nations
intergovernmental body responsible for worldwide planning, implementation, and
coordination of civil aviation. The United States is one of 188 participating
member States. Under the basic ICAO treaty established in 1944, as long as a
participating nation adopts aircraft emission standards that are equal to or more
stringent than the ICAO's standards, it satisfies its obligations under ICAO.40
Therefore, the ICAO sets emission standards for jet engines that are the basis of
the FAA‘s aircraft engine performance certification standards, established
through the EPA‘s regulations. The ICAO has long been the forum for evaluating
the environmental performance of aircraft engines.41
The ICAO has taken a ―technology progressing‖ approach, raising
standards within the capabilities of proven technologies and certified products
(engines and aircraft) rather than a ―technology forcing‖ approach, which set
standards based on technology that is not yet certified, still in the development
process, or may not even exist.42 The ICAO‘s approach is based on the premise
that the safety of aircraft operations restricts the use of unproven new
technologies.
The FAA and the ICOA, in a sense, limit the EPA‘s jurisdiction over airport
related emission sources. The EPA has historically worked with the FAA and the
ICAO in the development of international aircraft emission standards. The FAA
enforces the aircraft emissions standards established by the EPA in alignment
with the ICAO‘s standards. The ICOA itself does not have much authority to
enforce the standards that they set.

15 | P a g e
Furthermore, federal law complicates the ability of airport proprietors or
state and local air regulators from setting emission standards for aircraft or
otherwise regulating air carriers.ii Although aircraft are a major source of air
pollution comparable to industrial sources, they escape inclusion in State
Implementation Plans, the EPA‘s principal means of achieving cleaner air in air
quality nonattainment areas. Citing the prevention of interstate commerce
conflicts, Congress purposefully left the Federal Aviation Administration out of the
State Implementation Process (SIP) process and thereby the regional Air Quality
Management Plans (AQMPs). This omission has serious consequences in efforts
to reduce air pollution.43 Because the FAA is not directly involved in the SIP
planning process and emissions from aircraft cannot be addressed in AQMPs,
state and local regulators must find ways to reduce emissions elsewhere.44
In California, the state‘s Air Resources Board (CARB) sets and oversees
on-road vehicle emissions standards, fuel specifications, and some off-road
sources, yet airport emissions are not represented cumulatively in the SIP.
―Regional aircraft‖ is only a line item (not differentiated by airport), ―ground
service equipment‖ is hidden in the ―off-road source‖ category, ―stationary
sources‖ are lumped with similar processes, and ―ground access vehicles‖ are
lost within the huge ―regional on-road‖ category.45 While the CARB can regulate
airport-related sources that do not cross state borders, because state regulators
do not cumulatively consider airport emissions, state regulation often does not
specifically target an airport-related source. Instead, airport-related sources are
placed in broader categories with non-airport related sources. For example, the
CARB lumps ground service equipment in its ―In-Use Off-Road Diesel Rule.‖ Due
in part to the broad scope of this rule, opponents of the diesel rule challenged it
and the CARB ultimately severely weakened the rule. Emissions from this source
remain significant.
Transportation to and from airports (for travelers and cargo) is another
major source of air pollution, yet managing this source is particularly complex.
On-road vehicles, which take passengers to and from the airport, meet federal
tailpipe standards set by the US Environmental Protection Agency. While airport
proprietors have only indirect control of this source, they and other local/regional
agencies have significant influence over the factors that incentivize passengers
and employees to use less pollution-inducing forms of travel to and from airports.
The ‗Setting, Issues, and Analysis‘ chapter elaborates on this point.
ii This does not constitute official legal analysis or counsel.

16 | P a g e
International and national leadership is lacking in efforts to
reduce greenhouse gas emissions from the aviation sector
While some countries− New Zealand, Australia, and members of the
European Union− have taken steps to include aviation in their domestic
greenhouse gas (GHG) cap-and-trade programs, the majority of GHG emissions
from aviation are unregulated. Specifically, the US does not regulate greenhouse
gas emissions at a national level.
The Kyoto Protocol─ a protocol to the United Nations Framework
Convention on Climate Change aimed at fighting global warming─ did not include
GHG emission limits from international aviation, leaving the regulation of GHGs
from international flights to the International Civil Aviation Organizations (ICAO).
The ICOA has not set standards for either GHGs or fuel efficiency.46 According to
the Federal Aviation Administration, it is working with the ICAO to evaluate policy
options to limit or reduce GHG emissions from aviation. For several years the
ICAO has been evaluating voluntary approaches and market approaches, such
as emission trading, to limit aviation emissions growth while allowing continued
expansion of air travel. Their preliminary results show that emission-related
levies are not cost effective, but voluntary arrangements and emissions trading
may be cost effective in limiting or reducing greenhouse gas emissions.47
Due to a lack of strong leadership at the international and national levels,
voluntary local and regional leadership has become increasingly important but is
currently limited. Laura Zahn conducted an investigation of what airport
managers are doing to reduce greenhouse gas emissions from airport-based
emissions. In her study, ―Cleaner Skies, Brighter Future,‖ she found that a limited
number of airport managers─ predominantly in Europe, Canada, and the United
States─ are taking concrete steps to reduce airport-based greenhouse gas
emissions. Zahn concluded that there are opportunities for cities and city-owned
airports to work together to reduce overall emissions but that two key barriers
remain: no consistent way to measure the success of implemented projects and
no central tool to communicate those successes to other airports. According to
Zahn, future progress hinges on developing these two tools.48

17 | P a g e
METHODOLOGY
The Los Angeles World Airports serves as a case study in this report. The
Los Angeles World Airports (LAWA) owns and operates Los Angeles
International Airport, LA/Ontario International Airport, and Van Nuys Airport. The
LAWA also owns Palmdale Regional Airport, but because of virtually no
operations at Palmdale Regional Airport, this report addresses only the
aforementioned three airports. The Los Angeles International Airport (LAX) is a
particular focus in this report, both because LAX is the most significant source of
airport-related air pollution in Southern California and because the best emission
source data and ground access travel behavior data exists for LAX.
Through an extensive literature review and by communicating with
experts, I identified and analyzed the key regional, governance, political,
economic, environmental, and regulatory conditions that affect the LAWA and air
pollution from its operations. Specifically, I reviewed what the literature reveals
about the air quality impacts of airports and then highlighted the emission
sources associated with LAX. The LAWA has direct or indirect control over these
emission sources but international, federal, state, and regional agencies also
play a role. Consequently, my recommendations are not focused on merely one
target agency or just one emission source.
I summarized 10 key findings and recommended associated actions. My
objective was to prioritize the actions that clean air advocates could strategically
request the target agency to pursue to maximize emission reductions. My criteria
for evaluating and prioritizing actions was based on: 1) impact─ the importance
of the recommended action in terms of emission reduction potential over the
current baseline and 2) ease of implementation─ the feasibility of a clean air
advocacy organization based in Los Angeles to move the target agency to adopt
the recommended action. The findings and recommendations are organized by
emission source. The people who I communicated with to write this report
include:
Joe Lyou, Executive Director of the California Environmental Rights
Alliance and a leading member of the LAX Coalition
Martin Rubin, Founder and Director of Concerned Residents Against
Airport Pollution
Ken Petche, US Environmental Protection Agency
Jim Thomson, Aviation Data Base Products

18 | P a g e
Bill Piazza, Los Angeles Unified School District, Environmental Health and
Safety
Suzanne Paulson, University of California, Los Angeles, Department of
Atmospheric and Oceanic Sciences
Norene Hastings, Environmental Specialist, Los Angeles World Airports
Patrick Tomcheck, Senior Transportation Engineer, Los Angeles World
Airports
While this report focuses on the opportunities to reduce local criteria and
toxic air pollutants, I also address greenhouse gas emissions because there is a
connection between local and global air pollution. In one specific circumstance
there is a tradeoff, but in general, efforts to reduce criteria pollutants will also
reduce greenhouse gas emissions. Unless specified, the recommendations that I
provide apply to criteria, toxic, and greenhouse gas emissions. See the pull-out
box on the following page for more details about this connection.
Given the nature of this topic, this report contains many terms and
acronyms. The Appendix contains a glossary of definitions and acronyms.

19 | P a g e
Criteria Pollutants and CO2 Reductions Goals: Consistency and Tradeoff
Reducing the amount of fossil fuels burned in: 1) aircraft, 2) vehicles
traveling to, from, and at airports, 3) airport ground support equipment, and 4)
airport operations and construction, etc., in general, results in benefits both in
terms of reducing criteria and toxic emissions associated with local health
effects and also reducing greenhouse gas emissions associated with global
climate change. Aircraft fuel efficiency improvements are made via: 1)
aerodynamic aircraft improvements, 2) weight reductions, and 3) engine
developments. The first two provide consistency between criteria pollutant
reduction goals and greenhouse gas emission reduction goals. The engine
development method involves emission tradeoffs.
Developments that reduce airplane weight or reduce aerodynamic drag
can offer all-round emission benefits for criteria, toxic and greenhouse gas
pollutants. Lightweight composite materials for the majority of the aircraft
structure are beginning to appear and promise significant weight reductions and
fuel burn benefits. The use of winglets, fuselage airflow control devices, and
laminar fuel technology (which reduces airframe drag through control of the
boundary layer), can increase aerodynamic efficiency and reduce fuel
consumption.
On the other hand, engine developments require a balancing of the emissions produced to both satisfy operational need (fuel efficiency) and regulatory need (NOx and CO). This tradeoff is most difficult for those engines having the highest pressure ratios (PR). Higher PRs increase the temperature of the air used for combustion, exacerbating the NOx emissions challenge. Increasing an engine‘s PR is one of the main options manufacturers have to improve engine efficiency. Thus, an engine may be optimized for minimum NOx emissions, at which design point the engine will burn more fuel than it might otherwise have done. However, in general, reducing local pollutants from an airport related sources will also have climate benefits. Source: Ribeiro, K.; Kobayashi, S.; Beuthe, M.; Gasca, J.; Greene, D; Lee, D.S.; Muromachi, Y.; Newton, P.J.; Piotkin, S.; Sperling, D.; Wit, R.; Zhou, P.J. “Transport and its Infrastructure.” 2007. In “Climate Change 2007: Mitigation.” Contribution of Working Group III to the Fourth Assessment Report of the Intergovernmental Panel on Climate Change [B. Metz, O.R. Davidson, P.R. Bosch, R. Dave, L.A. Meyer )eds)], Cambridge University Press, Cambridge, United Kingdom and New Yorlk, NY, USA.

20 | P a g e
SETTING: SOUTHERN CALIFORNIA
The Los Angeles World Airports (LAWA) owns and operates Los Angeles
International Airport (LAX), LA/Ontario International Airport (ONT), and Van Nuys
Airport (VNY). Although these represent just three of 57 airports in the five-
county region of Southern California, they are the most significant in terms of
traffic and air quality impacts. LAX is the sixth busiest airport in the world in terms
of number of passengers and fourth busiest in terms of number of annual
takeoffs and landings.
Table 5
World’s Busiest Airports by Passengers in 2008
Rank Airport Location Rank Change from 2007
% Change Total # of Passengers in 2008
1 Hartsfield-Jackson Atlanta International
Atlanta, Georgia, US ▬ ▲0.7% 90,039,280
2 O‘Hare International
Chicago, Illinois, US ▬ ▼9.0% 69,353,876
3 London Heathrow
Greater London, U.K. ▬ ▼1.5% 67,056,379
4 Tokyo International
Ota, Tokyo, Japan ▬ ▼0.2% 66,754,829
5 Paris Charles de Gaulie
Roissy, France ▲1 ▲1.6% 60,874,681
6 Los Angeles International
Los Angeles, California, US
▼1 ▼4.7% 59,497,539
7 Dallas-Fort Worth Internat.
Dallas/Fort Worth, Texas, US
▬ ▼4.5% 57,093,187
8 Beijing International
Beijing, China ▲1 ▲4.4% 55,937,289
9 Frankfurt Flughafen, Germany ▬ ▼1.3% 50,900,000
10 Denver International
Denver, Colorado, US
▬ ▲2.8% 46,164,063 (Jan-Nov)
Source: Airports Council International.
Setting, Issues, and Analysis

21 | P a g e
Van Nuys Airport is the world‘s largest general aviation airport, used by
non-commercial (private and government) aircraft. Table 6 and Figure 2 highlight
the operations─ number of annual landings and takeoffs─ at LAX and Van Nuys
Airport compared to other main commercial and general aviation airports in Los
Angeles County.
Table 6
Number of Takeoffs and Landings in 2008 for Los Angeles County Airports
Airport Approximate Number of Annual Takeoffs and Landings
Los Angeles International Airport 623,000
Van Nuys Airport 380,000
Long Beach Airport 300,000
Zamperini Field 150,000
Santa Monica Airport 150,000
Burbank Airport 130,000
Whiteman Airport 115,000
El Monte Airport 90,000
Hawthorne Airport 80,000
Compton Airport 65,000
Source: Federal Aviation Administration, 5010 Data: http://www.faa.gov/airports/airport_safety/airportdata_5010/ and the Los Angeles World Airports.

22 | P a g e
Figure 2
Source: UCLA Mapshare
By Colleen Callahan

23 | P a g e
AIRPORT OWNERSHIP AND GOVERNANCE
Most US commercial service airports are typically owned by a local or
state government, either directly or through an authority (a quasi-governmental
body established to operate the airport). While Congress established
a "privatization program" in 1997 under which the airport ownership could be
transferred to a non-governmental entity, no airports currently participate in this
program. US airports are typically managed in one of three ways:49
1. Management by a city, county or state. Examples of airports in this
category include Atlanta, Pittsburgh, and Honolulu. In a few instances,
such as Los Angeles and St. Louis, the airport is governed by an
appointed commission which in turn reports to the City Council or Board.
2. Management by an airport authority. These entities are autonomous and
have an appointed board that makes policy and financial
decisions. Orlando, Minneapolis, and San Diego are a few examples.
3. Port Authority management. These airports are managed as part of a
multi-modal entity. Examples include the Port Authority of New York and
New Jersey, Seattle, and Portland.
The airport operator is responsible for the airport‘s long- and short-term
planning, financial performance, maintenance, operation and compliance with
numerous federal, state and local laws and regulations.50 Some airports operate
multiple airports within its system, such as the Los Angeles World Airports.
The Los Angeles World Airports (LAWA) is a municipal department of the
City of Los Angeles. A seven-member Board of Airport Commissioners governs
Los Angeles World Airports. By the Charter of the City of Los Angeles, the Board
is responsible for the formulation of airport policy. The Board is composed of
business and civic leaders who are appointed by the Mayor, approved by the City
Council, and serve staggered five-year terms.
Los Angeles Mayor Antonio Villaraigosa named five of the current
members of the Los Angeles Board of Airport Commissioners on July 25, 2005.
They are labor leader Joseph A. Aredas; Alan Rothenberg, an executive and
business leader; Fernando Torres-Gil, associate Dean of the UCLA School of
Public Affairs; attorney Michael A. Lawson; and Valeria C. Velasco, also an
attorney. The mayor also reappointed Airport Commissioner Walter Zifkin. The
City Council later confirmed Sam Nazarianon. President Alan Rothenberg was
first elected as president on Sept. 14, 2005.51

24 | P a g e
REGIONALISM
The current airport management system in the Southern California region
is among the most decentralized and complex in the nation, if not the world.52
Ten separate governing bodies operate the 12 commercial airports. The
organization of these bodies range from municipal departments (the LAWA and
Long Beach‘s Public Works Department), to county agencies (Orange County‘s
John Wayne Airport) to facilities operated as Joint Powers Authorities (Bob Hope
Airport operated by the Burbank-Glendale-Pasadena Airport Authority).53
Clifton Moore, Executive Director of the Los Angeles‘ Department of
Airports (later renamed the Los Angeles World Airports) from 1968-1992, was a
strong advocate for airport regionalization. He came to argue that growing
community opposition limited LAX expansion prospects and that new airport
capacity was needed in outlying areas. Moore proposed the creation of a new
regional airport authority to ―appropriately accommodate regional aviation
demand.‖54 In 1985, the Counties of Los Angeles, Riverside, San Bernardino,
and the City of Los Angeles signed a joint powers agreement, officially creating
the Southern California Regional Airport Authority (SCRAA). Orange County
originally declined membership but in 1992 decided to join the SCRAA on the
condition that each member had contractual veto power over the authority‘s
decisions.55
Soon thereafter, members of the SCRAA were in conflict over battles
featuring the LAX Masters Plan and a proposed commercial airport at the
recently closed Marine Corps Air Station El Toro in South Orange County. The
group advocating against the airport proposal consisted primarily of residents of
Irvine, Lake Forest, Laguna Niguel, and other cities in proximity to El Toro. The
cities opposed to the airport created a joint powers authority, the El Toro Reuse
Planning Authority to oppose the project.
After Orange County voters in 2002 rejected a commercial airport at El
Toro (Measure W), members of the SCRCC advocated for a proposed ―airport
without runways‖ high speed rail system to run from Anaheim to Inland Empire
airports. But by 2004 the SCRCC became dormant for a lack of a quorum when
Orange and Riverside Counties withdrew because of airport development
conflicts and the City of Los Angeles failed to send a representative, ostensibly
because of L.A. County‘s use of the SCRCC to oppose the LAX Master Plan.56

25 | P a g e
In recent years there has been a shift in the policy focus and political tenor
of aviation debates in Southern California. The focus has changed from adding
capacity to making better use of capacity already available at suburban airports
in a strategy termed ―regionalism.‖ The SCAG‘s Regional Aviation Plan─ part of
the 2004 Regional Transportation Plan─ recommends strategies for
decentralizing passenger and air cargo service from congested urban airports to
suburban airports. The Regional Aviation Plan also recommends a new
―Regional Airport Consortium‖ for coordinating airport master planning, facilities
construction, and ground access transportation policies and planning. Staff at the
SCAG note that the SCRAA could be reinvigorated to serve as a consortium.
Figure 3
2002 Air Passenger Demand 2030 Air Passenger Demand
(SCAG’s Preferred Plan)
2002 Air Cargo Passengers 2030 Air Cargo Passenger (SCAG’s Preferred Plan) Source: Armstrong, M. “Regional Aviation Planning in Southern California.” Presentation at the 33rd Annual FA Aviation Forecast California Meeting. March 11, 2008.

26 | P a g e
THE LAWA OWNED AND OPERATED AIRPORTS
Ontario Airport
LA/Ontario International Airport
(ONT) is an airport with commercial jet
service to major US cities and
international destinations. The airport
is the centerpiece of one of the fastest-
growing regions in the United States.
ONT's service area includes a
population of six million people living in Source: Los Angeles World Airports
San Bernardino and Riverside Counties
and portions of north Orange County and east Los Angeles County. Passenger
traffic at ONT has increased over the past 10 years. In 2006, 7 million
passengers used the airport. ONT's has approximately 220 flights per day and a
total of approximately 120,000 landings and takeoffs per year.57
History: The "new" Ontario International Airport opened September 27,
1998. The $270 million project included two new terminals at 265,000 square foot
each, a new ground transportation center, an additional parking lot, a new
roadway system, airfield improvements, landscaping, and a site storm-drain
system. The new terminals are eight times larger than the former terminal and
can accommodate up to 10 million passengers a year. LAWA plans to construct
a third terminal when passenger traffic at ONT reaches 10 million in two
consecutive years.58
Freight transport: ONT is part of a freight movement system that includes
the airport, two railroads, and four major freeways. Although ONT is not located
as close to the Ports of Los Angeles and Long Beach as many other airports in
the region, it is located in proximity to the freight transfer facilities, warehouses
and logistics centers where trucks and trains take freight to be loaded, organized,
and distributed to its final destination. The airport moved 602,326 tons of air
freight in 2006. Major US air freight carriers include Ameriflight, Federal Express,
Kalitta Air, and United Parcel Service.59
Master Plan: LAWA is in the process of developing a new master plan for
the Ontario International Airport. As such, LAWA has forecasted major growth in
operations, as illustrated from the following three tables.

27 | P a g e
Table 7
Proposed Ontario Airport Master Plan Recommendation 2030
2006 2030 Increase
Aircraft Passenger Gates
26 71 173 %
Rental Car Facilities (Acres)
26.5 73 175 %
Cargo Facilities (Acres) 100 254 154 %
Parking Spaces 6,575 30,680 366 %
Source: Los Angeles World Airports, LA/Ontario Proposed Master Plan
Recommendations 2030. Master Plan and Environmental Impact Scoping Meeting.
September 7, 2007.
Table 8
The LAWA’s Forecast for Ontario Airport
Year 2006 2030 Increase
Annual Operations (Takeoffs and
Landings)
108,191 383,987 254 %
Total Cargo Volumes (Tons)
544,600 3, 260,000 500 %
Passengers 9 million 33.4 million 271 %
Source: Los Angeles World Airports, LA/Ontario Proposed Master Plan Recommendations 2030. Master Plan and Environmental Impact Scoping Meeting. September 7, 2007.

28 | P a g e
Van Nuys Airport
Surprisingly to many Angelinos, Van Nuys Airport (VNY) ranks as the
world's busiest general aviation airport. As such, VNY is dedicated to non-
commercial air travel, serving a variety of private, corporate, and government
aircraft.60
VNY averages close to 400,000 takeoffs and landings annually. The
Mayor of Los Angeles signed the VNY Master Plan in 2006. The Master Plan
does not add acreage to the existing 730-acre airport, but does state the LAWA‘s
intent to establish VNY as the Southern California general aviation center for the
next 20 years.61
Source: Los Angeles World Airports
Los Angeles International Airport
Los Angeles International Airport (LAX) is the world‘s busiest origin and
destination (O & D) airport. O&D passengers are those beginning or ending their
trips in Southern California rather than using the airport for connecting flights.
Based on number of passengers, LAX is the sixth busiest airport in the world. In
2008, the airlines of LAX served 59.8 million passengers.62
Freight: LAX ranks 13th in the world in air cargo tonnage handled.63 In
2008, the airlines of LAX handled 1.8 million tons of freight and mail, with more
than 1,000 flights departing and arriving every day carrying cargo. The majority of
the air cargo at LAX arrives and departs in the bellies of passenger aircraft,
allowing airlines serving LAX to offer some of the lowest airfares to travelers.
More than 50 percent of LAX air cargo activity is international in origin or
destination.64

29 | P a g e
Economics: The annual budget
for LAX was more than $524.1 million
for 2008. According to the LAWA, LAX
contributes $61 billion to the economy
annually, and is a source of jobs.65
Regional issues: LAX handles
70 percent of the passengers and an
estimated 79 percent of the air cargo
for a five-county Southern California
region.66 Thirteen percent of LAX Source: Los Angeles World Airports
passengers come from Orange County.67
In the 1990‘s and early 2000‘s, Orange County residents opposed proposals to
build an international airport in South Orange County at the former Marine Corps
Air Station, El Toro. The area is now designated as park land.
LAX Master Plan: In 2001, staff at the Los Angeles World Airports (LAWA)
announced a new airport expansion plan. In December 2004, the Los Angeles
City Council approved the LAX Master Plan and related entitlements for the
future development of LAX. The LAX Master Plan provides the first major airport
expansion plan since 1984. A main goal of the LAX Master Plan was to
accommodate the expected growth in the number of passengers at LAX through
the year 2015. Specifically, the gates would be reconfigured to accommodate
larger planes and approximately 90 million annual passengers, up from its then
current traffic of 61 million. In addition, the plan initially proposed doubling the
airport‘s cargo capacity from almost two million tons to more than four million, but
ultimately settled for expanding to about three million tons.68
The LAX Master Plan serves as a broad policy statement regarding
planning for projects, such as the Bradley West Project. The draft Environmental
Impact Report for this project, released in May, 2009, states that this project,
consistent with the LAX Master Program, would result in ―unavoidable significant
air quality impacts for construction and operations-related emissions‖ (1-14). 69
In summary, the LAX Master Plan and the elements therein, are moving
forward and are designed to accommodate increases in passengers and cargo.
While the airport is used by residents of the entire country and beyond, the LAX-
adjacent communities that suffer the daily impacts of airport operations – traffic
congestion, air pollution, and noise pollution– could find those problems
exacerbated with implementation of the LAX Master Plan.70

30 | P a g e
LAX COMMUNITY BENEFIT AGREEMENT
In 2000, Attorney Jerilyn Lopez Mendoza, who at the time worked for the
nonprofit organization Environmental Defense, was monitoring the proposed LAX
expansion and she suggested the obvious plan of attack for the environmental
justice community: a Title VI complaint under the Civil Rights Act of 1964.71
―Based on LAWA‘s own analysis of the expansion—more cars, more trucks,
more people—it would have a disparate impact on people of color,‖ Lopez
Mendoza said.72 However, in April 2001, the United States Supreme Court
tossed a wrench in Mendoza‘s plan with its decision in Alexander v. Sandoval
(2001). The Supreme Court held that Title VI did not give rise to a private cause
of action, which means that only public agencies (rather than private citizens) can
file suits based on evidence of disparate impact. With a Title VI lawsuit no longer
in the cards, Lopez Mendoza and others began to explore strategies that did not
involve litigation.
In the summer of 2003, members of the Los Angeles Alliance for a New
Economy (LAANE) met with community members, elected officials, and
representatives from several nonprofits and churches to discuss pursuing a
community benefit agreement as a way to address and mitigate LAX expansion
impacts without litigation. By September 2003, the essential participants had
gathered− 25 groups strong─ into the LAX Coalition, which consisted of two
school districts (Inglewood Unified School District and Lennox School District),
twelve community organizations, seven environmental organizations, and four
labor unions.
In February 2004, LAX Coalition representatives had their first meeting
with officials of the LAWA. Reverend William Smart from the LAANE led the
negotiations for the Coalition. Jim Ritchie, Deputy Airport Director, was the
principal negotiator for the LAWA. The LAWA staff had a powerful negotiating
tactic in their communication with the Federal Aviation Administration and the
revenue diversions rule, which states that airport revenue cannot be used for
funding of non-airport-related purposes. Officials from the LAWA would claim that
some of the measures on the LAX Coalition‘s program request list did not
constitute a close enough nexus with airport operations.73
Although officials from the LAWA and members of the LAX Coalition often
wanted different things, they both wanted an agreement. On February 15, 2005,
the LAX Coalition and the LAWA signed the community benefits agreement

31 | P a g e
(CBA) and cooperation document. The cooperation document is the legally
binding contract between the LAX Coalition and LAWA. The CBA serves an
attachment to the cooperation agreement and describes all the programs and
policies agreed on in the cooperation agreement.74
The Final Agreement
The CBA ―sets forth a range of community benefits and impact mitigations
that will be provided by the Los Angeles World Airports as part of the LAX Master
Plan Program, and an ongoing role for the LAX Coalition in implementation and
oversight of these benefits and mitigations.‖75 The main environmental benefits
and mitigations related to air pollution are as follows:76
1. Air quality study. Details are in a preceding section of this report.
2. Health study. The LAWA will fund a study to measure and investigate
upper respiratory and hearing loss impacts for LAX operations due to the
LAX Master Plan Program.
3. Air quality mitigation measures. The main components include:
a. Electrification of Passenger Gates: By 2010, 100 percent of the
passenger gates shall be equipped and able to provide electricity to
parked aircraft.
b. Electrification of Cargo Operations Areas: The LAWA shall ensure that
unless determined operationally and/or technically infeasible, five
years from the effective date of this Agreement, 100 percent of all
cargo operations areas shall be equipped and able to provide
electricity to parked aircraft.
c. Electrification of LAX hangars: The LAWA shall conduct an
assessment of operations at LAX hangars.
d. Construction equipment: The LAWA shall require that all diesel
equipment used for construction related to the LAX Master Plan
Program be outfitted with the best available control devices primarily to
reduce diesel emissions of PM, including fine PM, and secondarily, to
reduce emissions of NOx.
e. ULSD and other fuels: All construction equipment shall use only Ultra-
Low Sulfur Diesel fuel (15 parts per million or lower), as supplies allow.

32 | P a g e
f. Ground service equipment diesel emissions reduction incentive
program: LAWA shall create a program providing incentives for the
reduction of emissions from ground service equipment, expending at
least $500,000 on the program.
g. Ground service equipment inventory: The LAWA shall prepare a study
detailing all ground service equipment operated on-site.
h. Emission reductions from On-Road trucks, buses, and shuttles: LAWA
shall fund a study of on-road heavy-duty vehicle traffic related to LAX
operations. LAWA shall ensure that by 2010, 50 percent of the covered
vehicles (on-road vehicles, including trucks, shuttles, passenger vans,
and buses that are 8,500 gross vehicles weight rating or more and are
used in operations related to LAX) operated by any airport contractor,
airport lessee, and airport licensee are alternative-fuel vehicles or
operational low NOx standard vehicles. By 2015, LAWA shall bring that
percentage up to 100 percent.
i. Limits on diesel idling: LAWA shall prohibit diesel-powered vehicles
from idling or queuing for more than 10 consecutive minutes on-site,
unless CARB adopts a stricter standard, in which case LAWA shall
enforce that standard.
j. Cleaner burning jet fuels: LAWA shall support efforts to encourage the
airlines and petroleum industries to embark on a study to promote the
use of jet fuels that minimize air pollutant emissions from jet engines.
4. Green building principles. LAWA agreed to incorporate Leadership in
Energy and Environmental Design (LEED) building standards into the all
aspect of LAX Master Plan to the extent practical and feasible.
5. Energy Conservation and Green Power.
a. LEED Building Standards: On January 22, 2007, the Board of Airport
Commissioners (BOAC) adopted a policy requiring new remodeling
and tenant improvement construction projects at all LAWA facilities to
include design and construction elements that comply with or are
substantially consistent with the highest possible Leadership in Energy
and Environmental Design (LEED) standards, or their practical
equivalent.

33 | P a g e
b. LAWA has agreement with the City‘s Department of Water and Power
committing to 25 percent Green Power in all LAWA facilities.
c. Dedicated in September 1998, the LA/Ontario International Airport
complex was designed with energy conservation in mind.
d. The Tom Bradley International Terminal at LAX is undergoing major
renovations that will make the facility more energy efficiency. This
project has been registered for LEED certification and the facility will
offer a 15 percent energy savings over the ASGRAE 90.1-2001 Energy
Standard.
Implementation of the CBA
Since the CBA signing, members of the LAX Coalition and officials from
the LAWA continue to meet to move the implementation process forward.
However, there have been several setbacks and delays. The mayoral election in
2005 affected the pace of implementation. The new mayor appointed Lydia
Kennard as executive director of the LAWA and Kennard was generally less in
favor of the CBA compared to the former executive director, Kim Kay.77
The
political scene was further complicated by a settlement agreement between the
LAWA and the City of Inglewood, City of El Segundo, County of Los Angeles,
and the Alliance for a Regional Solution to Airport Congestion, that were not
partners in the CBA. According to members of the LAX Coalition, the litigation
diverted valuable city staff time and slowed down implementation of the CBA.78
By far the biggest challenge for the LAX Coalition was the Federal
Aviation Administration (FAA), which needed to approve some of the CBA‘s
components in order to ensure that provisions did not violate the revenue
diversion rule. The FAA denied the job training program as outlined in the CBA.
In addition, the FAA approval of the school settlement agreement has been
difficult because the FAA believed that the school districts‘ 1980s agreement
precluded the need for an additional agreement. While approval was finally
granted by the FAA, the school districts have not been awarded any mitigation
funding as of the spring of 2009.79 As a result, the schools located in the flight
path of LAX continue to experience significant levels of noise and air pollution
that impact student learning and the ability to participate in physical education.
Officials at the LAWA have used the economic downturn as an
explanation for the slow progress in implementing many measures of the CBA.

34 | P a g e
For example, off-airport parking companies are required by the CBA to have 50
percent of their fleet run on alternative fuel by 2012, but little progress has been
made. According to LAX staff, there are very few alternative fuel off-airport
parking shuttles, taxicabs, door-to-door vans being used in the LAX CTA.80 In
addition, the LAWA agreed to convert all on-LAX ground service equipment to
the cleanest technology available; however, only approximately 25 percent of
ground service equipment is zero-emission electric.81
Despite setbacks and delays in implementation of the CBA, the members
of the LAX Coalition continue to monitor and guide the process. Doing so until
the cooperation agreement expires in 2020 requires a major commitment from
the members of the LAX Coalition, many of which are nonprofit and community
group with small budgets and limited staff and/or volunteer capacity.
LAX Air Quality and Source Apportionment Study
As required by the CBA, the Los Angeles World Airports is in the process
of undertaking the largest and most comprehensive study ever of air quality
around a major airport with the goal of fully identifying emission sources in the
area around the airport and also attempting to, for the first time, scientifically and
measurably apportion the contribution of ambient air quality of these sources.
Efforts to initiate the LAX Air Quality and Source Apportionment Study go back
nearly a decade, but were short-circuited after the events of September 11, 2001.
As part of the CBA and the Stipulated Settlement as part of the LAX Master Plan,
the LAWA agreed to re-initiate the Study. 82
The effort to kick-off this project involved the development of a Technical
Working Group composed of air quality scientists, researchers, and engineers
from the various governmental agencies as well as representatives of the LAX
Coalition and the City of El Segundo. While the LAWA retains ultimate decision-
making authority and responsibility for the study, the Technical Working Group
strives for consensus-based decision-making.83
Efforts are currently underway to complete the study, which is broken into
two main components:
1. Technology and Methodology Feasibility Demonstration Project (Phases 1
& 2) - Monitoring is to be conducted at five on-airport locations to evaluate
techniques.

35 | P a g e
2. Long-Term Study (Phase 3) - Using the results of the Demonstration
Project, the final phase of work will evaluate and document the
contribution of LAX to area emissions.84
The Study‘s Technical Working Group has reviewed the draft
documentation from the Technology and Methodology Feasibility Demonstration
Project (Demonstration Project) and recommended that before launching into the
Long-Term Study (Phase 3), additional evaluation of the Demonstration Project
data is needed. This ongoing additional evaluation of the Demonstration Project
is termed ―Phase 2.5.‖ After the work in Phase 2.5 is completed, the LAWA will
then go back to the Board of Airport Commissioners with the newly developed
Phase 3 scope to seek authorization and funding for the Long-Term Study.85
Once Phase 2.5 is authorized and funded, staff at the LAWA will formulate a
public outreach plan and schedule a public meeting about the project. 86

36 | P a g e
THE LAWA’S SUSTAINABILITY EFFORTS
In 2007, Mayor Villaraigosa released "Green LA-An Action Plan to Lead
the Nation in Fighting Global Warming."87 The goal of the plan is to reduce the
City of Los Angeles' greenhouse gas emissions by 35 percent below 1990 levels
by 2030. Likewise, the LAWA set a target of reducing its greenhouse gas
emission levels to 35 percent below 1990 levels by the year 2030. In order to
quantify its emissions, identify areas for improvement, and evaluate the
effectiveness of its reduction measures, the LAWA is performing a
comprehensive GHG emission inventory.
In addition to the Green LA plan, Mayor Villaraigosa released his
Executive Directive on sustainable practices in 2007. Echoing Mayor
Villaraigosa‘s commitment, Los Angeles Councilmember Bill Rosendahl
introduced a motion that requires LAX to be ―built and held to the highest green
standards.‖ In response, the Los Angeles Board of Airport Commissioners
adopted the ―Los Angeles World Airports Sustainability Plan‖ in 2008. 88 The plan
establishes the following fundamental objectives:89
1) Increase water conservation in all airport facilities and for all operations.
2) Increase use of environmentally and socially responsible products.
3) Increase recycling and source reduction efforts at all facilities and for all
operations.
4) Reduce energy usage and increase usage of green power at all airport
facilities and in all operations.
5) Reduce emissions from all operations.
6) Reduce single occupancy trips to, from, and within LAWA airports.
7) Incorporate sustainable planning, design, and construction practices into
all airport projects.
8) Promote sustainability awareness to airport employees and the greater
community.
9) Integrate sustainable practices into internal policies, business processes,
and written agreements.
There is considerable overlap between the measures that the LAWA
agreed to implement as part of the CBA and the measures that the LAWA now
promotes as part of its Sustainability and Environmental Initiatives. The ‗Findings
and Recommendations‘ section elucidates on this point and highlights the
specific efforts that the LAWA is taking to achieve these objectives.

37 | P a g e
AIR POLLUTION
The Clean Air Act requires the EPA to set National Ambient Air Quality
Standards for six common air pollutants found all over the US. They are:
particulate matter, ground-level ozone, carbon monoxide, sulfur oxides, nitrogen
oxides, and lead. Airports operations emit all of these pollutants along with toxic
air pollutants and greenhouse gases. I have already described some of pollutants
and their impacts earlier in this report. The following section provides more detail
about key pollutants related to airports in the Los Angeles region.
Lead Pollution
Lead is a metal now banned in the kerosene fuel used in commercial
aircraft in the US In fact, due to its toxicity, the Clean Air Act of 1990 originally
stated that all leaded fuels would be eliminated by 1996. However, the Clean Air
Act of 1990 was later amended to include one exemption─ for aviation gas
(avgas). Avgas is a leaded fuel used in non-commercial, piston-engine aircraft
(private, corporate, and government jets) that frequent general aviation and air
taxi airports. Avgas contains four times more lead than leaded gasoline before it
was banned from new cars in 1973.90 Emissions of lead from avgas are the
largest single source category for emissions of airborne lead in the US,
comprising approximately half of the national inventory.91
The tetra-ethyl lead found in leaded avgas and its combustion products
are potent neurotoxins. The US Centers for Disease Control and Prevention
(CDC) concluded in 2005 that no ―safe threshold for blood lead has been
identified.‖92 Lead can adversely affect the nervous system, kidney function,
immune system, reproductive and developmental systems and the
cardiovascular system.93 The lead effects most commonly encountered in current
populations are neurological effects in children and cardiovascular effects (e.g.
high blood pressure and heart disease) in adults. Infants and young children are
especially sensitive to even low levels of lead, which may contribute to behavioral
problems, learning deficits and lowered IQ.94 Lead exposure can occur from
breathing or swallowing lead particles/dust, or by eating soil or paint chips
containing lead.95
Figures 4 and 5 illustrate that lead levels are elevated near airports. The
correlation is especially apparent near airports with high levels of general aviation
operations (takeoff and landings of private, corporate, and government jets),
such as Van Nuys Airports with almost 400,000 general aviation operations in

38 | P a g e
2008, Long Beach Airport with about 300,000 general aviation operations in
2008, Santa Monica Airport with approximately 150,000 general aviation
operations, and Whiteman Airport with about 115,000 general aviation
operations.
Figure 4

39 | P a g e
Figure 5
As illustrated in Figure 5, there are three airports within an approximately
five mile area in the San Fernando Valley of Los Angeles County that are
frequented by general aviation aircraft. These jets use leaded fuel. Figure 10 also
illustrates a correlation between the locations of the three airports─ in the middle
of the three-mile buffer zones─ and the highest levels of lead. There are 82
schools and day care centers within this three-mile buffer zone of an airport in
the San Fernando Valley.

40 | P a g e
Particulate Pollution
Particle pollution (also called particulate matter or PM) is the term for a
mixture of solid particles and liquid droplets found in the air. Some particles─
such as dust, dirt, soot, or smoke─ are large or dark enough to be seen with the
naked eye. Others are so small that they can only be detected using an electron
microscope. There are three main types of particles based on size: 1) "inhalable
coarse particles‖ or PM10 with diameters larger than 2.5 micrometers (2.5 μm)
and smaller than 10 micrometers; 2) ―fine particles‖ with diameters that are .1-
2.5 micrometers; and 3) ultrafine/nano-particles that are less than 100
nanometers (nm). In comparison, the average human hair is about 70
micrometers in diameter – making it 30 times larger than the largest fine
particle.96
The size of the particle is directly linked to its potential for causing health
problems. Small particles pose the greatest problems because they can get deep
into the lungs and even enter the bloodstream. Numerous scientific studies have
linked particle pollution exposure to a variety of problems, including:
increased respiratory symptoms
decreased lung function
aggravated asthma
development of chronic bronchitis
heart attacks
pre-mature death in people with heart or lung disease.97
The study of ultrafine particles is relatively nascent compared to the study
of fine particles. Early research indicates reason to be very concerned.
Nanoparticles are deposited on the deep lung regions even more efficiently than
fine particles.98
In addition to size, particles vary by composition depending on their
source. Sources of particulate pollution include fires, dust, industrial processes,
and fossil fuel combustion. Particulate pollution emitted from the combustion of
diesel fuel is especially problematic in terms of health impacts. In 1998 the ARB
identified diesel particulate matter as a toxic air contaminant, which means that it
is linked to cancer.99

41 | P a g e
Figures 6 and 7
Estimated Cancer Risk from Toxic Air Pollutants, Without Diesel PM
Estimated Cancer Risk from Toxic Air Pollutants, including Diesel PM

42 | P a g e
Source: South Coast Air Quality Management District, MATES II Study: Multiple Air
Toxics Exposure Study in the South Coast Air Basin.
Toxic Air Pollutants
Toxic air pollutants, also known as hazardous air pollutants, are known or
suspected to cause cancer or other serious health effects, such as birth and
reproductive effects.100 Many toxic air pollutants are emitted in the form of volatile
organic compounds (VOC) or particulates. Specific examples include benzene,
which is found in gasoline, diesel particulate matter, which is emitted by diesel
powered trucks, trains, and ships, and lead particulate, which is found in aviation
gasoline.101
People are exposed to toxic air pollutants in many ways that can pose
health risks, including but not limited to:
Breathing contaminated air.
Eating contaminated food products, such as fish from contaminated
waters.
Drinking water contaminated by toxic air pollutants.
Ingesting contaminated soil. Young children are especially vulnerable
because they often ingest soil from their hands or from objects they place
in their mouths.
Touching contaminated soil, dust, or water.102
People exposed to toxic air pollutants at sufficient concentrations and
durations may have an increased chance of getting cancer or experiencing other
serious health effects. These health effects can include damage to the immune
system, as well as neurological, reproductive (e.g. reduced fertility),
developmental, respiratory and other health problems. In addition to exposure
from breathing air toxics, some toxic air pollutants such as mercury can deposit
onto soils or surface waters, where they are taken up by plants and ingested by
animals and move up through the food chain.103
Figures 6 and 7 (preceding page) indicate the large role that diesel
particulate matter plays in cancer risk from toxic air contaminants in the South
Coast Air Basin, including the area surrounding LAX. Figure 6 also illustrates
elevated levels of other toxic pollution, excluding diesel PM, in the area near

43 | P a g e
LAX. Figure 8 confirms that toxic pollution levels are high in the area surrounding
LAX. This map contains data from the EPA‘s National Scale Air Toxic
Assessment, a database that provides emissions and health risk information on
around 300 air toxins that present the greatest threat to public health in the
largest number of urban areas.104
Figure 8
Figure 9

44 | P a g e
Figure 9
An astonishing 153 schools and day care centers are located within a
three-mile buffer zone around LAX. The schools located in the area directly east
of the airport─ the direction that the wind blows and the direction of the airplane
flight path─ and along the 405 and 105 freeways are exposed to multiple sources
of air pollution. Not surprising these schools are most at risk from exposure to
toxic air pollutants according to data from the US Environmental Protection
Agency‘s National Scale Air Toxic Assessment.

45 | P a g e
Climate Impacts of Non-CO2 Emissions from Aviation
The largest source of aviation-related greenhouse gas emissions are
aircraft. According to the Intergovernmental Panel on Climate Change, aircraft
account for 13 percent of all carbon dioxide emissions from the transportation
sector, and in 1999, were responsible for 3.5 percent of global climate change.105
While the principal greenhouse gas related to aircraft is carbon dioxide
(CO2), other non-CO2 emissions have a significant impact on radiative forcing
and climate change. These include nitrogen oxides (NOx) and particulate matter.
Non-CO2 emissions tend to be much shorter lived than CO2 emissions, and
depending on where they occur may have a positive (warming) or negative
(cooling) radiative force impact.106 No agreement has been reached on a suitable
metric for calculating the radiative forcing effects of non-CO2 emissions on an
equivalent basis to CO2. This is in part due to inherent difficulty in treating long-
lived (CO2) and short-lived (non-CO2) pollutants the same way.107
Aircraft emit significant amounts of NOx, which promotes the formation of
ozone smog, a radiatively active gas with a warming effect. Yet, NOx can also
accelerate the removal of atmospheric methane. Since methane has a strong
warming effect, removing methane can have a cooling effect on the global
climate.108 The total radiative forcing of NOx is an area of active research.
In addition to being an air pollutant linked to severe local health effects,
scientists are discovering that particulate matter in the form of black carbon
(soot) ─ from burning diesel fuel ─ is a potent agent of global climate change.
NASA scientists now estimate that black carbon is responsible for about 12
percent of the man-made global warming.109 While CO2 lasts hundreds of years
in the atmosphere, black carbon lasts only months or years. As a result, several
climate models suggest that reducing particulate pollution can produce an
immediate cooling effect on climate faster than any action on emissions like
CO2.110 According to NASA scientists, trimming black carbon represents an
alternate and more immediate global warming solution for regulators stymied by
the complexities of greenhouse gases such as CO2.111 Scientists are only
beginning to give attention to the climate impacts of black carbon, but this issue
will likely gain in importance because reducing black carbon has both primary
climate benefits and immediate secondary benefits. Therefore, reducing diesel
particulate matter from airport operations can have both immediate local health
benefits and global climate benefits.

46 | P a g e
AIR QUALITY IMPACTS OF AIRPORTS
Research on Air Quality and Commercial Airports
Several studies have documented seriously elevated levels of both toxic
air pollutants and criteria pollutants such as nitrogen oxides and particulate
matter levels near commercial airports.112
The Multiple Air Toxics Exposure Study of 1999 (MATES II) conducted by
the South Coast Air Quality Management District involved sampling of diesel
particulate matter and volatile organic compounds at 24 sites near LAX, including
residential and ―fixed‖ location sites. The researchers of the South Coast Air
Quality Management District (SCAQMD) measured high concentrations of
elemental carbon (a surrogate for diesel particulates), benzene, and 1,3
butadiene at locations adjacent to LAX compared to sites further away from the
airport. All key compounds are associated with mobile sources. Compounds
were especially elevated at Aviation and Felton School sites, which are located
near major arterials (Aviation Blvd. and 405 Freeway) and LAX. The staff at the
SCAQMD contend that the higher concentrations of pollution near LAX were due
primarily to the on-road vehicle activity resulting from airport operations.113
A study of toxic pollutants near Chicago O‘Hare Airport in 2000 also
documented elevated levels of pollutants such as acetaldehyde, benzene,
formaldehyde, toluene and lead.114 Yet another study found significantly higher
levels of some toxic volatile organic compounds near the Teterboro Airport in
New Jersey in 2006, with spikes in pollution recorded when wind was blowing
from the runway/taxiway.115
As part of the California Air Resources Board and University of Southern
California‘s LAX and Ultrafine Particulate Matter Study, scientists performed air
monitoring in the vicinity of LAX during the spring of 2003 to determine the extent
of airport emissions on downwind ambient air in a mixed-use neighborhood that
includes residences. The scientists found markedly higher ultrafine particulate
(UFP) counts at a site 500 meters downwind of the airport, in an area that was
strongly influenced by aircraft landings and where the community interfaced with
airport facilities.116 Figure 10 illustrates that particle numbers are highest in the
airplane takeoff zone, an order of magnitude higher than even on the 710
Freeway. Levels are highest during takeoff, taxing, and landing when the sizes of
the particles are about 20 nanometers in diameter.

47 | P a g e
Figure 10
Particle Number Distribution in the Vicinity of LAX
Source: Westerdahl D, Fruin S, Fine P, and Sioutas C. “The Los Angeles International
Airport as a source of ultrafine particles and other pollutants to nearby communities.”
California Air Resources Board and the USC. Atmospheric Environment. 2008, 42:
3143-3155.
In another study of LAX supported by the California Air Resources Board,
scientists from UCLA performed three field studies during 2005-2006. The results
are compiled in a 2007 report titled ―Monitoring and Modeling of Ultrafine
Particles and Black Carbon at the Los Angeles International Airport.‖117 The
scientists observed elevated levels of high ultrafine particle concentrations 900
meters downwind of a runway. The study authors concluded that ―airports are
important sources of PM in urban air sheds, yet regulators and public health
agencies have little data available to them that address the characteristics of
particles emitted from aircraft and their impacts on exposure and health in
adjacent communities. Toxicological research is needed to fully characterize the
potential health impacts.‖ 118

48 | P a g e
Figure 11
Particle Size and Concentration at LAX Runway Blast Fence,
Community Site near LAX, and the Regional Average
1.E+02
1.E+03
1.E+04
1.E+05
1.E+06
1.E+07
1 10 100 1000
Mobility Particle Size, nm
dN
/dlo
gD
p
Community
Sites
AQMD
LAX-BF
Source: Joe Lyou, Presentation on April 7, 2008 at the C40Airports and Climate
Protection Workshop. Data from: Froines, J.; Fanning, E.; Chun, R.; and Lu, R.
“Monitoring and Modeling of Ultrafine Particles and Black Carbon at the Los Angeles
International Airport.” University of California, Los Angeles. Prepared for the California
Air Resources Board and the California Environmental Protection Agency. June 20,
2007.
In respect to nitrogen oxides (NOx), in 2006 scientists studied NOx in the
vicinity of Heathrow Airport in England and reported elevated NOx levels more
than two and a half kilometers from the airport.119 Approximately 27 percent of
the annual mean NOx in the region was due to airport operations at the
downwind airfield boundary.120

49 | P a g e
Air Quality Studies and General Aviation Airports
While several studies have documented poor air quality in the vicinity of
major commercial airports, studies near general aviation airports− that serve
private and government aircraft− are more limited. Three key studies related to
general aviation airports exist from the Los Angeles region. Bill Piazza of the Los
Angeles Unified School District conducted a Health Assessment of the Santa
Monica Airport in 1999. He estimated that for individuals who reside in closest
proximity to the airport, elevated cancer risk exists at a level of 26, 22, and 13 in
a million (depending on assumptions made about the type of plane traffic). These
values represent discrete elevated cancer risks associated with airport-related
exposure because no background or ambient concentrations were incorporated
into the risk quantification. In consideration of the Federal Clean Air Act,
emissions associated with airport operations were clearly found to exceed the
―acceptable risk criterion‖ of one in a million.121
In addition, scientists at the South Coast Air Quality Management District
conducted a Santa Monica and Van Nuys Airports Study. The scientists recorded
no discernible elevation of fine particles (with diameters that are .1- 2.5
micrometers, also called PM2.5) but did find spikes in ultrafine number
concentrations associated with aircraft departures. They also observed highly
elevated total suspended particulate lead at levels that were seven times higher
than background levels.122
Most recently, in 2009, scientists at UCLA published a study titled ―Aircraft
Emission Impacts in a Neighborhood Adjacent to a Ground Aviation Airport in
Southern California.‖ The scientists reported that average ultrafine particle (UFP)
concentrations 600 meters downwind of Santa Monica Airport were two and a
half to three times the background level, higher than typical major roadway
concentrations.123 Figure 12 illustrates that black carbon and ultrafine particles
are elevated at residential sites downwind of the Santa Monica Airport. The study
authors also noted that while Van Nuys Airport has a buffer zone between the
airport and residences, the Santa Monica Airport does not; houses are adjacent
to the runway.

50 | P a g e
Figure 12
Black Carbon Mass and Ultrafine Particles Elevated at
Residential Sites East (Downwind) of the Santa Monica Airport
Source: Paulson, Suzanne. “Aircraft Impacts on Particulate Pollution Downside of Santa
Monica Airport.” University of California, Los Angeles and the California Air Resources
Board. PowerPoint presentation, Santa Monica Airport Forum, January11, 2010.

51 | P a g e
MAIN SOURCES OF POLLUTION FROM AIRPORT
OPERATIONS
Airport-related pollution comes from numerous sources. These sources
include: 1) aircraft while on the ground and in the air, 2) transportation to and
from the airport for travelers, employees, and cargo (called ground access
transportation or regional vehicles), 3) on-airport vehicles owned by the airport,
4) ground service equipment (GSE) that services the aircraft, 5) airport
infrastructure (stationary sources), and 6) auxiliary power units. The source
apportionment varies depending on the type of air pollutant.
Figure 13 illustrates that aircraft is a main source of sulfur oxides (SOx)
emissions at LAX while Figures 14, 15, and 16 illustrate that ground access
vehicles/regional vehicles moving passengers, employees, and cargo can
produce as much or even more nitrogen oxides (NOx), volatile organic
compounds (VOC), and particulate matter (PM10) as planes. Missing from the
source apportionment data is information about fine or ultrafine particles, which
air quality monitoring and modeling studies reveal are of particular concern near
airports.
The LAX emission source apportionment data illustrated in the following
four graphs has policy implications. The major sources of LAX emissions serve
as an organizing method used in this report to categorize, recommend, and
prioritize emission reduction strategies.

52 | P a g e
Figure 13
SOx Emissions from Total LAX-related Operations
Figure 14
NOx Emissions from Total LAX-related Operations
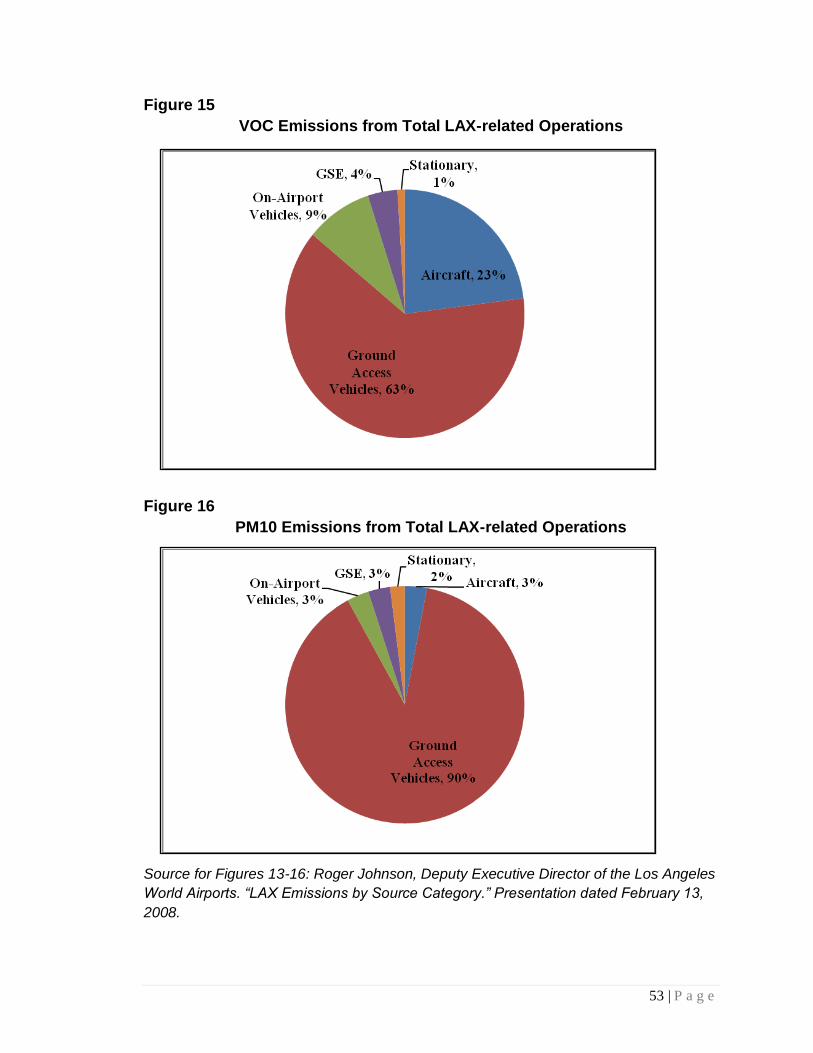
53 | P a g e
Figure 15
VOC Emissions from Total LAX-related Operations
Figure 16
PM10 Emissions from Total LAX-related Operations
Source for Figures 13-16: Roger Johnson, Deputy Executive Director of the Los Angeles
World Airports. “LAX Emissions by Source Category.” Presentation dated February 13,
2008.

54 | P a g e
STANDARDS, REGULATIONS & PROGRAMS
Due to the many sources of emissions, types of pollutants emitted, and
the difficulty in their characterization, controlling the pollutants generated by an
airport‘s operations is a complex, multi-faceted issue.124 The main air quality
mitigation measures for airports and associated activities include replacing,
repowering, retrofitting, refueling, and reducing idling of regional vehicles,
aircraft, airport vehicles, and ground service equipment. Other mitigation
measures include redirecting passengers and cargo to less congested airports or
to other less polluting alternatives, such as public transit.
This section focuses on the key standards, regulations, and programs at a
national, state, regional, and local level that affect the main sources of emissions
related to the LAWA operations. The focus is on LAX. As previously described,
particulate matter (PM) emissions are of particular concern from a local and
global environment and health perspective. Therefore, the emissions sources are
ordered from greatest to least effect on total LAX related PM emissions.
Emission Source Target: Ground Access Transportation
As previously illustrated in Figures 14, 15, and 16, ground access
transportation is the most significant source of air pollution associated with
airports like LAX. In fact, 90 percent of PM10 emissions are from ground
access/regional vehicles. Nationally, ground access vehicles emit 56 percent of
VOCs, while aircraft taking off and landing give off only 32.6% (including
emissions from auxiliary power units).125 Air pollution is emitted from private cars
and trucks traveling at, to, and from the airport. These trips are generated by: 1)
airport employees, 2) arriving and departing passengers, and 3) cargo and mail
transport to and from the airport.126
A root cause of the problem is not how many people travel to the LAWA
airports, but how they do so. For example, if every employee and passenger
arrived to the airport on low-emission and readily available public transit and
every airplane departed completely full, the pollution problem would be
minimized while the travel benefits would be maximized. However, according to
2006 LAX Passenger Survey, public transit represents only one percent of mode
access to/from LAX for both Southern California residents and visitors.127 More
than half of all LAX passengers (56 percent) are Southern California residents
and seventy-five percent of Southern California based LAX passengers took a

55 | P a g e
private vehicle to/from the airport.128 Of those LAX passengers, over half used
either the I-405 Freeway or the I-105 Freeway.129 Based on Caltrans‘ 2006 traffic
counts, the I-105 and the I-405 carry an annual average daily traffic volume of
approximately 247,000 and 305,000 vehicles per day near LAX, respectively.130
These volumes are among the highest in the nation. The California Department
of Transportation and the Los Angeles County Metropolitan Transportation
Authority (Metro) expect that peak period traffic volumes on the freeway
segments near LAX will rise by 20 to 90 percent from 2006 and 2030.
Figure 17
Mode of Transportation for Southern California
Residents Traveling to/from LAX
Source: Los Angeles World Airports. “2006 LAX Air Passenger Survey Final Report.”
December 2007.
http://www.lawa.org/uploadedfiles/lax/pdf/2006LAXPassengerSurveyFinal.pdf.

56 | P a g e
Figure 18
The LAX/Crenshaw Corridor Area
Source: Los Angeles County Metropolitan Transportation Authority
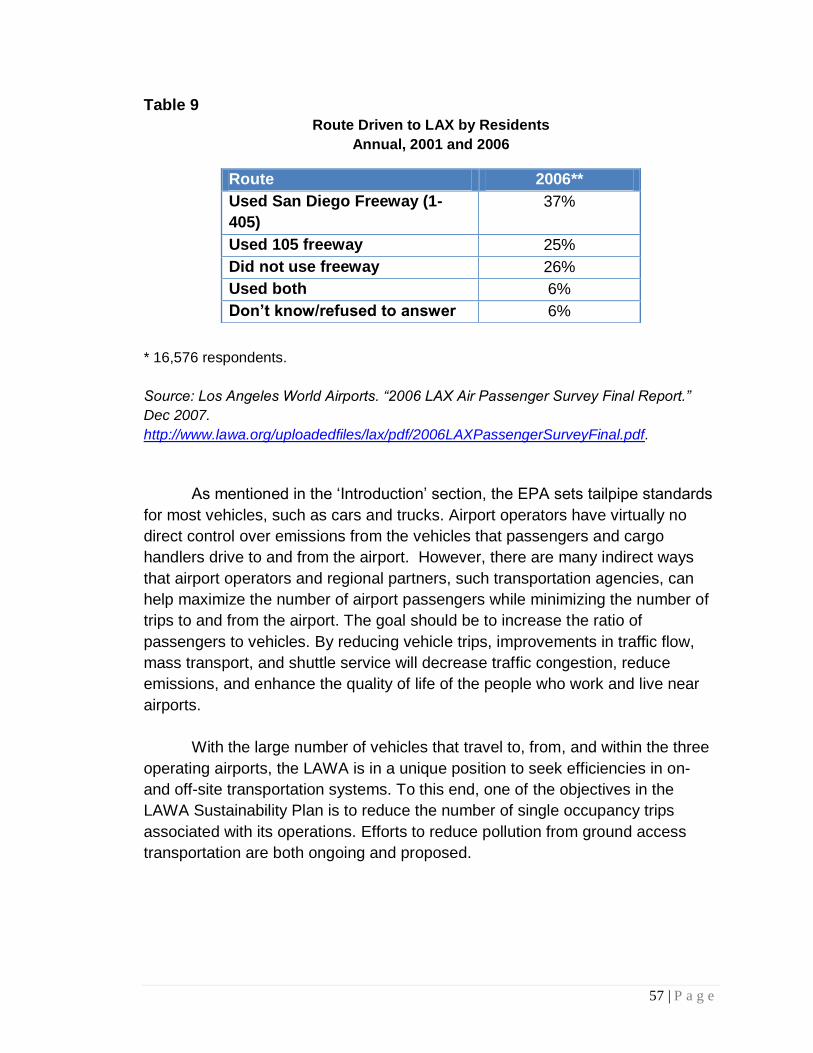
57 | P a g e
Table 9
Route Driven to LAX by Residents
Annual, 2001 and 2006
* 16,576 respondents.
Source: Los Angeles World Airports. “2006 LAX Air Passenger Survey Final Report.”
Dec 2007.
http://www.lawa.org/uploadedfiles/lax/pdf/2006LAXPassengerSurveyFinal.pdf.
As mentioned in the ‗Introduction‘ section, the EPA sets tailpipe standards
for most vehicles, such as cars and trucks. Airport operators have virtually no
direct control over emissions from the vehicles that passengers and cargo
handlers drive to and from the airport. However, there are many indirect ways
that airport operators and regional partners, such transportation agencies, can
help maximize the number of airport passengers while minimizing the number of
trips to and from the airport. The goal should be to increase the ratio of
passengers to vehicles. By reducing vehicle trips, improvements in traffic flow,
mass transport, and shuttle service will decrease traffic congestion, reduce
emissions, and enhance the quality of life of the people who work and live near
airports.
With the large number of vehicles that travel to, from, and within the three
operating airports, the LAWA is in a unique position to seek efficiencies in on-
and off-site transportation systems. To this end, one of the objectives in the
LAWA Sustainability Plan is to reduce the number of single occupancy trips
associated with its operations. Efforts to reduce pollution from ground access
transportation are both ongoing and proposed.
Route 2006**
Used San Diego Freeway (1-
405)
37%
Used 105 freeway 25%
Did not use freeway 26%
Used both 6%
Don’t know/refused to answer 6%

58 | P a g e
Existing Efforts to Reduce Emissions from Ground Access Transportation
Rideshare and Carpool Program: LAWA‘s Rideshare Program consists of
63 vanpools, 64 carpools and free monthly transit passes, as well as marketing
and advocacy activities to recruit and retain program participants. Approximately
a quarter (27 percent in March 2009) percent of LAWA‘s employees participate in
this program saving over 1,000 vehicle trips to LAWA airports every day and 7.9
billion pounds of air pollutants per year.131
Hotel Courtesy Shuttle Trip Reduction Program: Many airport-area hotels
provide courtesy transportation from LAX terminals to hotels along the Century
Boulevard corridor. In December 2006, the Board of Airport Commissioners
approved a consolidated hotel courtesy shuttle operation to reduce traffic
congestion in the central terminal area at LAX. The two-phase program requires
hotels to set trip reduction targets and establishes financial penalties for excess
trips. Phase I of the program started on July 1, 2007 and required hotels to
reduce shuttle trips by at least 15 percent from a 2004 base year, with penalties
of $10 per trip for non-compliance. Phase II began on February 1, 2008 and
required hotels to reduce shuttle trips an additional 20 percent with penalties of
$5 per trip for non-compliance.
According to the LAWA, since implementation of the program, vehicle
miles traveled have been reduced by 55 percent and emissions have been
reduced 65 percent over baseline years. However, more research is needed to
determine the effectives of the current $5 penalty to incentivize compliance with
LAX‘s Hotel Courtesy Shuttle Trip Reduction Program.132
LAX FlyAway Program: The FlyAway is a non-stop shuttle bus service
operated by the LAWA that transports people to and from four locations and LAX.
The LAWA is required to operate the FlyAway program as a mitigation measure
of the LAX Master Plan (the stipulated settlement agreement). The FlyAway
service was used by approximately 97,000 passengers in 2009, which removed
approximately 1.2 million vehicle trips, reduced 133 tons of criteria pollutants,
and reduced 8,540 tons of CO2 pollution.133
Yet, only one percent of Southern California residents take FlyAway as
their mode of access to LAX.134 The reason for this low percentage may be due
in part to limited service, with only four pick-up/drop-off locations in a large
region. As required by the stipulated settlement agreement, the LAWA plans to
add five new FlyAway locations by 2015.135 However, the increasing cost to ride
FlyAway may be a deterrent. A trip from Union Station in downtown Los Angles

59 | P a g e
to LAX costs $7 one-way or $14 round trip.136 The newly added FlyAway line
from Irvine to LAX costs $50 round trip. Fifty dollars is more expensive than
paying for parking at a lot near LAX for a few days. Not surprisingly, only 84
people rode FlyAway to/from the Irvine location in 2009 after it the line opened in
November.137 Notwithstanding other issues of convenience and accessibility,
taking FlyAway mostly makes economic sense for long trips.
Figure 19
Existing (Indicated by Red Circles) and Proposed FlyAway Locations
Source: Los Angeles World Airports, Presentation to the Board of Airport
Commissioners, May 3, 2010.
http://www.lawa.org/uploadedFiles/board_agenda/ManagementReports/boac100503z
FlyAway%20Performance%20Update%20050310.pdf.
Rental Cars: In January 2003, the Board of Airport Commissioners
approved on-airport concessions for 10 rental car companies at LAX. These 10
concessionaires are the only firms permitted to provide curbside pick-up and
drop-off at passenger terminals. The program calls for on-airport rental car

60 | P a g e
operators to reduce the number of monthly courtesy vehicles trips by at least 20
percent from a 2004 baseline year.138
Alternative Fuel Fleets: Two of the major contributors to vehicle traffic at
LAWA facilities are passenger shuttle buses and taxis. The LAWA is working with
its tenants and airport service providers to develop requirements and incentives
for incorporating cleaner vehicles into their fleets. The LAWA has developed and
is implementing an Alternative Fuel Vehicle (AFV) policy with a target of
converting 50 percent of the larger vehicles (over 8,500 pounds gross weight)
fleets to AFVs by December of 2010 and 100 percent by 2015. While it is too
early to know whether LAX will meet these goals, experts are concerned that the
airport will fail to reach these targets.
Consolidated Rental Car Facility (ConRac): Since 1999, LA/ONT has
operated a ConRac that houses six rental car companies with tram service from
the terminals to alleviate traffic congestion on the terminal roadways.

61 | P a g e
Proposed Plans to Reduce Emissions from Ground Access Transportation
Consolidated Rental Car Facility (ConRac): With the success of LA/ONT‘s
ConRac (see immediately preceding paragraph), the LAWA plans to open a
Consolidated Rental Car Facility in operation at LAX by 2015.139
Alternative Fuel Fleets: The LAWA plans to work with the taxi
concessionaires at LA/ONT to develop a program to require that 10 percent of
taxis run on alternative fuel vehicles.140 There is no such goal at LAX and this
remains an area of need. However, regulating the taxi industry at LAX has been
problematic for the LAWA. Taxi services are operated by nine city-authorized taxi
companies and regulated by Authorized Taxicab Supervision Inc. (ATS). City
Controller Laura Chick audited ATS in Jan. 2007 and found ATS was
mismanaging monies collected from passengers at LAX. Despite the audit, staff
at the LAWA recommend that the Board of Airport Commissioners award a five-
year concession agreement from the City to ATS.
Centralized Delivery Facility: Another significant source of vehicle traffic at
LAX is the delivery of products to tenants and airlines.141 Delivery trucks tie up
passenger loading areas and increase congestion in the central terminal area. To
reduce these impacts, the LAWA plans to reutilize an existing building as a
centralized delivery facility, where the trucks will unload their materials and
delivery trips will be consolidated.142 The LAWA pledged to have the centralized
delivery facility in operation by 2010. This will be something to monitor in the
upcoming year.
Crenshaw/LAX Transit Rail Line: Over the past 40 years, the Los Angeles
County Metropolitan Transportation Authority (Metro) and its predecessors have
undertaken numerous plans and studies that documented the need for
transportation improvements in the Crenshaw Corridor near LAX. The LAWA
became an active member of the Green Line Task Force, which now also
includes the California Department of Transportation, Metro, and local community
groups. Their goal was to develop integrative approaches to relieve congestion
around LAX with the proposed Crenshaw/LAX Transit Corridor Project.
The Draft Environmental Impact Statement (Draft EIR) for the proposed
Crenshaw/LAX Transit Corridor Project analyzed two main project options− rapid
bus transit and light rail along the Crenshaw Corridor− and recommended the
light rail transit alternative. In December 2009, Board members of Metro adopted
the light rail transit alternative as the preferred alternative, thereby allowing the
final review of the Crenshaw/LAX Transit Rail Line to move forward. Metro will

62 | P a g e
release the Final Environmental Impact Report in 2010. The Crenshaw/LAX
Transit Rail Line would run perpendicular to the Green Line and the Expo Line
(under construction).
Figure 20
The Proposed Crenshaw/LAX Transit Corridor Project
Source: Los Angeles County Metropolitan Transportation Authority. Crenshaw Transit
Corridor Draft Environmental Impact Statement.” 2009.

63 | P a g e
The stated explanation in the Draft EIR for recommending the light rail
alternative was that rail─ compared to bus rapid transit─ would generate the
greatest travel time savings, reliability, and higher ridership as well as promote
connections with other elements of the Metro rail system.143 This argument has
some merit given that the Crenshaw Corridor already has a rapid bus line
plagued by slow travel speeds due to road congestion. Adding a dedicated line
for bus rapid transit would mean taking away an existing road lane. This poses
political and operations challenges that a rail line would help to avoid. A rail line─
able to combine at grade, below grade, and aerial service─ could provide faster
service and more reliability.
However, the eight and a half mile rail line would not solve all problems of
connectivity. The vast majority of LAX passengers live outside of the Crenshaw
Corridor and the proposed rail line stops short of connecting to the Purple Line
on Wilshire Boulevard and the residential and employment centers in that area.
Moreover, it is unclear whether the proposed rail line would indeed provide more
connectivity to LAX compared to the current Green Line, which requires a free
shuttle trip to connect to LAX. The proposed rail line‘s Aviation Station will also
not directly connect to the LAX terminal and therefore the current proposal calls
for an automatic people mover along Century Boulevard, a very busy street
dominated by cars, to connect the Aviation Station to LAX.
Century Boulevard and Aviation Boulevard─ cross streets of the proposed Aviation
Station of the LAX/Crenshaw Corridor project. The airport plans to construct an
automatic people mover to provide connection to LAX terminals.
Photo source: LA County Metro.

64 | P a g e
Furthermore, any benefit of the proposed LAX/Crenshaw Corridor rail line
would come at a cost. Metro staff estimate the project construction cost at $1.76
billion or approximately 207 million dollars per mile.144 If the construction cost
were divided by an estimated 50,000 riders per year for 10 years, the cost per
passenger would be a whopping $3,520. This does not include operating costs,
which, based on the experience from other rail lines in the Los Angeles region,
will likely not be fully covered by the fares. For example, research indicates that
riders of the Blue Line, a light rail line from downtown Los Angeles to Long
Beach, pay a fare that covers only about eleven percent of the operating costs.145
In comparison, local buses in Los Angeles cover close to 40 percent of the costs
from the fare paid, and some crowded city routes mange to cover nearly 90
percent of their operating costs through revenue.146 The funding that Metro is
counting to build the Crenshaw/LAX Transit Corridor project will come mainly
from Measure R, the half-cent local sales tax that Los Angeles County voters
approved in November of 2008, and the federal government.
Analysis
The LAWA is taking significant steps to reduce air pollution associated
with ground access transportation. However, none of the existing or proposed
initiatives will address the fundamental issue of relative mode cost and will
therefore not solve the pollution problem. The ‗kiss and fly‘ mode─ in which a
passenger is dropped-off or picked-up in a private vehicle─ is the least costly
ground access mode for the individual and most costly ground access mode for
society because it results in four, one-way private vehicle trips instead of two or
none. Through the ground access pricing system, the LAWA incentivizes the
most polluting and least efficient transportation mode and creates a disincentive
to take transit, FlyAway, shuttle, or taxi. For example, LAX collects $2.50 every
time a cab enters the airport, but there is no charge for private vehicles to enter
the LAX circle and the immediate roads into LAX.
A more efficient way to address the issue of ground access transportation
would be to accurately price trips to the LAWA operated airports in order to
internalize the negative externalities. The LAWA, Metro, and Caltrans could
explore market based strategies in which vehicles pay a toll to enter a designated
area such as the LAX driving pick-up and drop-off loop. The fee could be
variable, increasing during peak travel times as a way to incentive travel during
less congested times or by alternative modes. If the price was set right, the
LAWA would generate income to go toward its air quality and ground
transportation programs while airport passengers would be incentivized to take a

65 | P a g e
less polluting mode of transportation. Tolling at LAX may be a political none-
starter today. However, toll roads, like the 91 Express Lanes owned and
operated by the Orange County Transportation Authority, are becoming more
politically acceptable.147
Emission Source Target: Aircraft
Airplanes account for 90 percent of SOx, 40 percent of NOx, 23 percent of
VOC, and three percent of PM10 emissions from operations at LAX. Policy,
technological, and operational options are available to limit the growth in aircraft
emissions. These include regulating the amount of emissions released,
improving aircraft fuel efficiency via technological advancements, reducing
aircraft fuel use while at airport gates, reducing congestion through either
demand management strategies or operations advancements in air traffic control,
and shifting from petroleum-based kerosene jet fuel to alternative fuels. The
leadership to pursue most of these strategies must come from the federal
government because federal law preempts states from setting emission
standards for aircraft. However, airports owners may be able to employ their
landlord authority to require or incentivize operations changes and the use of
specific fuel while planes are on their property.
NOx standards: In 2005, the EPA amended its nitrogen oxides (NOx)
emission standards for new commercial aircraft engines. These new standards
are equivalent to the International Civil Aviation Organization‘s NOx emission
standards (adopted in 1999 for implementation beginning in 2004) and bring the
US aircraft standards into line with the international standards. The new
standards reflect a 16 percent NOx reduction over the 1996 standards and a 33
percent reduction over the original standards agreed to in 1981. However, the
combined effect of these standards with previously adopted standards will be a
reduction in NOx emissions of only about 40 to 50 percent from new engine
models relative to uncontrolled levels.148 By comparison, emission standards and
regulations set by air regulatory agencies require that other emission sources are
controlled to well over 50 percent and some as high as 95 percent.149
The International Civil Aviation Organization‘s policy is to set ―technology
supporting‖ rather than ―technology forcing‖ standards. In fact, approximately 85
percent of aircraft engines already met the standards when they were adopted by
ICAO in 1999.150 In contrast, emission standards set by air regulatory agencies
for other sources of air pollution define a ―technology-forcing‖ performance level
that goes beyond what sources are currently achieving.151

66 | P a g e
Further limiting the impact of the standards, aircraft engines that do not
meet the new standards are not required to do so because the standards only
apply to new aircraft and not to existing aircraft. The turnover of the
approximately 15 percent of older engines that do meet the standards will not
happen immediately due to the long fleet turn-over rate of aircraft (60 percent of
aircraft are in service at 30 years of age.)152
Reducing fuel use through research and development: Historically,
technological advances have resulted in the bulk of aviation emission reductions,
but current research funding is lacking. Over the past three decades US
manufacturers, with support from the US government, have invested billions of
dollars in aircraft research and development. They have made significant strides
in engine innovations and other technologies that save fuel and decrease
emissions. The Boeing 787 aircraft, for example, achieves a 20 percent decrease
in fuel use and CO2 emissions, 60 percent reduction of noise, and 28 percent
less NOx than the B787 airplane that it replaces.153
The National Aeronautics and Space Administration (NASA) has
historically been the lead US governmental agency involved with aircraft
research and development. In 2004, NASA established a five-year goal to deliver
technologies to reduce CO2 emissions of new aircraft by 25 percent. However,
NASA‘s budgets for this work have declined since 2004 and, in early 2006, the
agency realigned, leaving most of this proposal underfunded.154 Manufacturers
have expressed concerns that the US risks losing its global leadership in
aeronautics due to reduced NASA and FAA research and development
programs.155
There are incentives for airlines to reduce fuel use because fuel costs can
over 50 percent of airline operating costs in the US156 Investing in new aircraft is
a key way for air carriers to reduce their fuel costs, but aircraft have a long
product lifetime and are expensive to replace. Therefore, air carriers are
employing a variety of other procedures to reduce fuel consumption, including: 1)
selective engine shutdowns during ground delays, 2) cruising longer at higher
altitudes and employing shorter, steeper approaches, and flying slower, 3)
investing in winglets to reduce aircraft drag and reduce fuel burn, 4)
experimenting with towing aircraft during some portion of travel to and from the
gate, and 5) using airport power rather than onboard auxiliary power units when
at the gates. 157 Several of these methods require coordination with federal
agencies and airport operators; the fifth method is applicable to the LAWA and is
highlighted in the following section.

67 | P a g e
Reducing fuel use at gate: Some airports, including LAX, are moving
toward 100 percent electrification of airport gates. This allows planes to plug into
electric power at gate instead of burning kerosene jet fuel or using an auxiliary
power unit. As part of the LAX Community Benefits Agreement, LAWA agreed to
equip 100 percent of passenger gates at LAX to electric power and be able to
provide electricity to parked aircraft by 2010. This commitment only applies to
LAX and not the other airports owned and operated by the LAWA.
Reducing airport congestion: There are three main ways to reduce airport
congestion and the related energy use and air pollution without reducing overall
air travel. One is to invest in infrastructure, but new runways take a considerable
amount of time and money to build, plus construction periods are associated with
increased congestion and emissions.158 A second way to reduce congestion is
via airport demand management, either through 1) congestion pricing 2)
restrictions on airport slots.159
In respect to pricing, currently airlines pay land fees to airports depending
only on aircraft weight. The land fees do not vary by time of day. Under
congestion pricing, the landing fees paid by airlines would rise at peak hours, and
in response, airlines would move some flights to off-peak hours.160 The LAWA
does not employ a timed-based congestion pricing system nor does it employ a
slot system. Under a slot system, flights cannot exceed the total available
number of hourly slots. One way to set up a slot system is to distribute the slots
among the airlines and then allow trading. The FFA governs such as system at
four congested US airports (LaGuardia, JFK, O‘Hare, and Reagan-National).
Another possibility is to auction the available airport slots to the airliners. In 2008,
the FAA proposed a partial auction for the New York area airports, but the
airliners strongly objected (they were being asked to pay for something that they
now hold for free), and the FAA recently withdrew its auction proposal.161
A third way to reduce aviation congestion─ referred to in the previous
section on ‗research and development‘─ is through technological advancements
in air traffic control. The Next Generation Air Transportation System (NextGen)
is the FAA‘s plan to modernize the National Airspace System through 2025 while
simultaneously improving safety and reducing environmental impacts. Core
elements of NextGen include improving operational procedures, introducing new
technology in aircraft and engines, and developing alternative fuels. For example,
conversion to a satellite-based NextGen navigational system could cut emissions
and delays by approximately 15 percent.162 This system would support
continuous descent arrivals, which allow aircraft to remain at cruse altitude longer

68 | P a g e
and avoid excess fuel burn associated with traditional landing procedures. The
NextGen navigational system is still in the development phase.
Alternative fuels: Alternative fuels are not widely used or accepted in the
aviation industry, but this could change with more research and development. In
partnership with the airlines, airports, and manufacturers, FAA launched the
Commercial Aviation Fuels Initiative (CAAFI). CAAFI is leading efforts to develop
alternative, environmentally progressive aviation fuels. Their goal is to develop a
100 percent synthetic fuel by 2010 and 100 percent bio-fuel by 2013.163
Representatives from Boeing, the world‘s largest aircraft manufacturer, claim that
bio-fuel powered aircraft could be on the market as early as 2011 and expect
authorities to certify a 30 percent bio-fuel blend for commercial aircraft in the near
future. 164
But harvesting enough biomass to meet the industry‘s need remains a
huge barrier to widespread adoption of the alternative fuel. The airline industry
burns about 85 billion gallons of kerosene annually.165 The Guardian estimates
that fueling the world‘s 13,000 commercial airplanes with nothing but soybean-
based fuel would require using the equivalent of the entire land mass of Europe
to grow soybeans.166 Moreover, the CO2 reduction benefits of crop-based bio-
fuels are questionable when considered under a full lifecycle analysis because
the entire process of growing, harvesting, and distilling the crop is quite energy
and CO2 intensive.
The drawbacks of crop-based bio-fuels are one reason that Boeing is
pursing algal fuels. The startup company Solazyme, based in San Francisco, has
developed an algal jet fuel that behaves like kerosene. Called Solajet, this jet fuel
has passed all of the eleven essential tested specifications required to meet the
Jet-A1 standard.167 It is the world‘s first microbially-derived jet fuel to do so.
Another family of fuels called synthetic paraffinic kerosene− which includes those
distilled from the oils of Helianthus (sunflowers) and jatropha− are close to
becoming certified.168
The importance of bio-fuel research, development, certification, and
procurement is particularly apparent when seen as part of a larger US
government strategy to control aviation CO2 emissions. As Graph 21 illustrates,
even with currently available solutions to control CO2 emissions from the aviation
industry, operational and technological improvements, and possible CO2
standards, aviation‘s carbon footprint will continue to increase without the
widespread use of alternative fuels.

69 | P a g e
Figure 21
US Strategy to Reduce Aviation’s Carbon Footprint
Source: Maurice, L., US Federal Aviation Administration. “The Commercial Aviation
Fuels Initiative.” Presentation to the Aviation Alternative Fuels Side Event, Bonn,
Germany. June 3, 2009.
In addition to use in large commercial aircraft, alternative fuels are also
needed for use in small planes. As described earlier in this report, lead is banned
in the kerosene fuel used in larger commercial aircraft and every other fuel in the
US except the aviation gas (avgas) used in non-commercial, piston engine
aircraft (private, corporate, and government jets) that frequent general aviation
airports. The lead additive has been the most economical method for achieving
100-octane fuel in these high performance planes.169 Avgas contains four times
more lead than in leaded gasoline before it was banned from new cars in
1973.170
An alternative bio-fuel mix is available for use in some small planes. In
1999, the FAA certified a fuel known as AGE85, which is about 85 percent
ethanol and contains a high-octane petroleum product and agriculturally derived
‗biodiesel‘ for lubrication.171 It is unleaded and burns cleaner than avgas.
However, its use is limited in part because FAA has been slow to establish a
standard for the fuel and develop standards for aircraft flying with AGE85.172

70 | P a g e
Analysis
Aircraft is a challenging emission source for local clean air advocates and
local airport operators to target. Most regulatory and standard setting authority
exists at the international and national levels, but there are key ways for local
clean air advocates to exert an influence. The most immediate way is to respond
to the EPA‘s ‗Advanced Notice of Proposed Rulemaking on Lead Emissions from
Piston-Engine Aircraft Using Leaded Aviation Gasoline.‘ More details on this rule-
making and comment period can be found in the ‗Findings and
Recommendations‘ chapter of this report.
Emission Source Target: Ground Support Equipment
Ground support equipment (GSE) accounts for four percent of PM10, one
percent of SOx, four percent of VOC, and 11 percent of NOx emissions from LAX
operations. This equipment that services aircraft include tugs, baggage loaders,
catering trucks, and fueling vehicles. The main strategies for reducing emissions
from this source involve federal emission standards, voluntary national and state
programs, and more binding local fuel requirements.
EPA Standards for Non-Road Diesel Engines: The EPA does not
specifically target ground support equipment in any of its regulations, but new
ground support equipment with diesel engines that are used only on airport
property will be required to meet EPA‘s Non-Road Diesel Engine Standards. The
EPA is phasing in these standards from 2008 to 2014. According to the FAA, the
new equipment will achieve emission performance comparable to today‘s
automobiles.173 The standards do not apply to existing ground support equipment
or to non-diesel equipment, such as gasoline or other alternative fueled
equipment in use at airports like LAX.
Voluntary Federal GSE Programs: The EPA, the FAA, and the
Department of Energy developed a pilot program, called the Inherently Low-
Emissions Airport Vehicle Pilot Program, to demonstrate air quality
improvements with alternative fuel ground support equipment. These agencies
recently expanded the program, now called the Voluntary Airport Low Emission
Program, to increase eligibility for airport low-emission projects for commercial
service airports in all air quality nonattainment areas. Through the use of funding
and emission credit incentives, this voluntary program includes the conversion of
ground support equipment to low emission technologies, among other emission
reduction projects.174

71 | P a g e
United Airlines made notable progress in reducing emissions from their
ground service equipment fleet, but overall industry progress has been limited.
United‘s 1,797 alternative-fueled and zero-emitting vehicles represent nearly 25
percent of their active ground service equipment fleet.175
Voluntary GSE Initiative in Southern California: As part of the 1994
California State Implementation Plan (SIP) for ozone attainment, control measure
M15 focused on the need for emission reductions from airports. The South Coast
Air Quality Management District led the consultative process to focus on airport
activities. One of the main goals of this process was to develop a Memorandum
of Understanding (MOU) for ground service equipment that would be a voluntary
program providing reductions in hydrocarbon (HC) and nitrogen oxide emissions
beyond what is required. The MOU was developed in cooperation with the EPA,
the FAA, the Air Transport Association representing the major airlines, and the
five major airports in the South Coast Air Basin. It was signed in December 2002.
Under the terms of the MOU, the airlines would have been exempted from new
regulation of in-use programs until the MOU expired. However, the airlines chose
to exercise their option to terminate the MOU, effective January 1, 2006.176
Instead of continuing with the MOU, the airlines choose to focus their efforts and
resources on new and future regulatory programs.
State Regulations that Apply to GSE: The state of California has not
specifically targeted ground support equipment in its binding regulations.
However, Board members of the California Air Resources Board (CARB) did
adopt regulations that apply to in-use fleets, including airport ground service
equipment (GSE). Those measures include the air toxic control measure for
portable engines, new emission standards and fleet requirements for forklifts and
other industrial equipment, and in-use requirements for off-road diesel vehicles.
This approach of using multiple broad regulations (non-industry specific)
makes it challenging to focus in and analyze the effectiveness for emission
reductions from ground service equipment. For example, the CARB approved the
In-Use Off-Road Diesel Vehicle Regulation in July 26, 2007. This regulation
applies to GSE. However, the GSE component of the regulation is caught up in
the heated controversy over the entire regulation after industry opposition arose
during the recent economic recession in California. As part of the 2009 California
budget, the California legislature directed the CARB to make several changes to
the In-Use Off-Road Diesel Vehicle Regulation. These changes in effect reduce
the emission benefits associated with the rule by extending compliance deadlines
and making other requirements less stringent.177

72 | P a g e
LAWA‘s GSE Conversion Program: The LAWA and its tenants have made
an effort to convert GSEs to more efficient and less polluting models. As part of
the LAX Community Benefits Agreement, the LAWA is committed to converting
all on-LAX GSE to the cleanest technology available by 2015. Currently, only
approximately a quarter (25 percent) of LAX‘s tenant GSEs are zero-emission
vehicles.178 This will be an area to monitor because of the potential for additional
emission reductions.179
Analysis
Full implementation of the CARB‘s In-Use Off-Road Diesel Vehicle
Regulation and the LAX Community Benefits Agreement could result in
significant emission reductions from ground support equipment. However, the full
potential of both are certainly not guaranteed and are areas that warrant
monitoring and pressure from clean air advocates.
Emission Source Target: Airport Vehicles Fleet
On-airport vehicles account for three percent of particulate matter and four
percent of nitrogen oxide emissions from LAX operations. The main way that
airport operators are reducing emissions from airport owned vehicles is by
transitioning to less polluting fuel sources. I am not aware of federal or state
programs designed specifically to target airport vehicles (which is in a separate
category from ground support equipment). However, the LAWA has a long
history of integrating alternative fuel vehicles into its fleet. As part of the LAX
Community Benefits Agreement, the LAWA agreed to expedite this transition, but
it is still off its final goal of 100 percent conversion.
Figure 22 illustrates that LAX‘s fleet includes liquid natural gas (LNG),
compressed natural gas (CNG), gasoline/electric hybrids, electric, solar, and
hydrogen powered vehicles. Currently, about three-fourths of LAX‘s fleet is
comprised of alternative fuel vehicles (AFV).180

73 | P a g e
Figure 22
LAX Fleet Vehicles
Source: Los Angeles World Airports. “Los Angeles World Airport Sustainability Plan.”
2008.
Analysis
The LAWA has not publicized its fleet ratio for its other airports, an
indication that the alternative fuel vehicle percentage of its fleets is significantly
lower elsewhere. This is an area of more potential emission reductions that
warrants attention. In terms of LAX, the most important effort for clean air
advocates to pursue is to monitor and ensure that the LAWA fully meets its
commitment to clean vehicles as part of the LAX Community Benefits
Agreement.

74 | P a g e
Emission Target: Stationary Sources
Although mobile sources constitute the bulk of emissions related to airport
operations, stationary sources─ primarily from energy production─ also certainly
matter. The LAWA has a Central Utilities Plant (CUP) onsite at LAX to heat and
cool the airport terminals. In November 2009, the LAWA Board of Airport
Commissioners approved a new central utility plant at LAX. The existing CUP is
an obsolete facility that no longer meets energy and safety codes. While the new
utility plant will decrease emissions relative to current levels, the effort does not
go as far as some airports─ like Denver International─ that are investing in on-
site solar arrays. To its credit, however, in October 1999 the Board of Airport
Commissioners adopted a resolution establishing the LAWA‘s participation in the
City‘s Department of Water and Power‘s ―Green Power for LA‖ program to
purchase electricity from renewable resources. LAWA purchases approximately
15 percent of its power from renewable energy resources.181
In addition, in January 2007, the LAWA Board of Airport Commissioners
committed the LAWA to incorporate the highest possible LEED (Leadership in
Energy and Environmental Design) standards in all future construction projects at
the LAWA‘s airports. However, the LAWA airports lag behind some other airports
in terms of LEED certification. For example, Hangar 25 at the Bob Hope Airport
in Burbank was recently designated by the US Green Building Council as a
"LEED Platinum" facility, the highest LEED ranking.182 Representatives from
Shangri-La Construction, the firm that created and constructed the hanger, state
that Hanger 25 is the "most sustainable airplane hangar in the world." The
Hanger 25 building contains solar arrays that will produce 400 kWH per year of
clean, renewable energy to supply 110 percent of the building‘s total energy
needs.183 Airplane process loads will be powered by solar charging carts,
avoiding jet fuel consumption and improving air quality.184
The LAWA also strives to reduce energy consumption at its airports. The
new terminal at LA/ONT includes energy efficient windows and a ceiling system
that maximizes light distribution without radiating heat in the terminal. Other
efforts have included retrofitting 90 percent of light fixtures at LAX for higher
efficiency and installing light sensors in the LAWA administrative buildings.185

75 | P a g e
Analysis
The LAWA has taken steps to reduce emissions from stationary sources,
but there is certainly more that the LAWA could do to invest in renewable energy
and improve energy efficiency in its facilities and operations. The Board of Airport
Commissioners established a target of reducing energy use by 10 percent per
passenger and/or cargo tonnage by the end of 2010. In order to meet these
targets, the LAWA plans to perform the following initiatives: install energy
efficient light fixtures when changing burned out bulbs; install new or increase
efficiency of existing heating and cooling equipment; purchase more energy
efficient computer servers; install energy efficient variable speed motors during
replacement; and when replacing older building-related process energy systems
and equipment, upgrade with energy efficient systems.
Several of these initiatives depend on an unknown replacement schedule
and/or opportunities that could be maximized during new construction projects
related to the LAX Master Plan and the Ontario Master Plan. In addition, the
LAWA has an unrealized potential to invest in solar and fuel cell infrastructure as
renewable sources of energy.

76 | P a g e
After communicating with experts and conducting an extensive literature
review, I summarized key findings and based on these findings, I prioritized
recommended objectives for a campaign to reduce pollution from the LAWA‘s
owned and operated airports. Each recommendation is assigned a suggested
priority level. My criteria for evaluating and prioritizing recommendations was
based on: 1) impact─ the importance of the recommended action in terms of
emission reduction potential over the current baseline─ and 2) ease of
implementation─ the feasibility of a clean air advocacy organization based in Los
Angeles to move the target agency to adopt the recommended action. The
recommendations are listed in order of top emission sources of PM10, NOx, and
VOC pollution from LAX operations.
RECOMMENDATIONS FOR OVERALL EMISSION
REDUCTIONS
1) Create a Clean Air Action Plan for the LAWA
Finding: The LAWA‘s various environmental data collection,
programmatic, and policy efforts concentrate on LAX while often not applying to
its other airports. Van Nuys Airport has the second largest number of landings
and take-offs in the Los Angeles County, however, the airport is virtually ignored
in the LAWA‘s Sustainability Plan. Furthermore, there is only limited alignment
between the environmental programs at LAX and at Ontario International Airport.
Even at LAX, however, the LAWA does not coordinate its various air quality
measures under a comprehensive plan.
Recommendation: Clean air advocates should encourage the LAWA to set
a health-based emission reduction goal for all three airports and develop a plan
to comprehensively target airport-related emission sources through a consistent
application of environmental programs, goals, and policies among the three
airports. A LAWA clean air action plan should be included as part of the Southern
California Association of Governments‘ Regional Transportation Plan.
As a starting point, the LAX Community Benefits Agreement contains
commitments that should be applied to the other airports. A comprehensive clean
Findings and Recommendations

77 | P a g e
air action plan should also include measures to protect vulnerable populations
living near the LAWA airports. Effective and relatively inexpensive air filtration
systems are available on the market and have already been installed in schools
near the Ports of Los Angeles and Port of Long Beach with support from the
ports and the South Coast Air Quality Management District.
The San Pedro Bay Ports Clean Air Action Plan could serve as a general
model for the LAWA to develop a plan to more comprehensively and consistently
target multiple emission sources across all of its airports. The San Pedro Bay
Ports Clean Air Action Plan (the CAP) targets all port-related emission sources─
ships, trains, trucks, terminal equipment and harbor craft─ to significantly reduce
health risks posed by air pollution. The CAP is landmark for both its
comprehensiveness and agency cooperation. It was created with participation of
the South Coast Air Quality Management District, the California Air Resources
Board and the US Environmental Protection Agency. The Harbor Commissioners
of the Port of Los Angeles and the Harbor Commissioners of the Port of Long
Beach Plan approved the CAP in a joint meeting on November 20, 2006. By
doing so, the Harbor Commissioners committed the ports to an aggressive plan
to reduce pollution by at least 45 percent in the next five years. The San Pedro
Ports Bay Clean Air Action Plan was the culmination of years of organizing and
advocacy work by residents and environmental organizations.
Clean air advocates could target the Los Angeles World Airports as the
lead agency while also reaching out to the South Coast Air Quality Management
District, the California Air Resources Board, and the US Environmental
Protection Agency about cooperatively designing a plan, as these agencies did
for the CAP.
Priority: The action ranks as a high priority. If designed properly, a
comprehensive clean air plan could lead to significant emission reductions at all
of the LAWA‘s airports. Results of the forthcoming LAX Air Quality and Source
Apportionment Study may highlight the need for a comprehensive approach to
reducing air pollution and will provide a forum for the public to discuss such
action. In addition, as air traffic increases at LA/ONT and the Ontario Airport
Master Plan moves forward, advocates will have the opportunity to weigh in on
the future direction of the airport.

78 | P a g e
2) Target Aircraft and Airports in State Implementation Plans
Finding: Although aircraft are a major source of air pollution comparable to
industrial sources, they escape inclusion in State Implementation Plans, the US
Environmental Protection Agency‘s (EPA) principal means of achieving cleaner
air in air quality nonattainment areas.186 This omission has serious
consequences in efforts to reduce air pollution.187 In California, the Air Resources
Board faces obstacles in its ability to regulate airport-related sources. However,
the California Air Resources Board faces similar challenges in regulating the
shipping, trucking, and railroad industries and has found creative ways to target
emissions related to these industries.
Recommendation 2.1 and Target: Clean air advocates should work with
staff at the California Air Resources Board to explore creative ways to reduce
emissions from aircraft and other airport-related sources. This should involve
conducting research about the health impacts, including cancer risk, from
airports, as the CARB has done with rail yards.
Priority of Recommendation 2.1: Working with staff from the California Air
Resources Board should be a high priority for clean air advocates. While the
California Air Resources has limited control over airport-related emission
sources, the state has more power and authority than local or regional agencies
and the proven ability to work creatively to target major emission sources.
Recommendation 2.2 and Target: Clean air advocates should lobby US
Senators to author and support legislation that would give states more ability to
regulate airports─ like other major sources of pollution─ as part of the State
Implementation Plan process. Allowing states to include control strategies for
ground-level aircraft emissions in their SIPs and regional air districts to more
easily control other airport-related sources in their air quality management plans
would definitely help achieve air quality goals.188 The South Coast Air Quality
Management District could potentially be an ally in this effort.
Priority of Recommendation 2.2: This action ranks as a medium priority.
While the action could have major impacts on reducing emissions from airport-
related operations in the Los Angeles region, achieving the desired action would
be particularly challenging for clean air advocates based in Los Angeles to
achieve given the amount of resources needed to affect federal legislation.

79 | P a g e
SOURCE TARGET: GROUND ACCESS TRANSPORTATION
3) Increase the Viability of Alternative Ground Access Options
via Cordon Pricing and Improved Public transit
Finding: Ground access transportation accounts for 63 percent of VOC
emissions, 42 percent of NOx emissions, and 90 percent of PM10 emissions
from LAX-related operations.189 Nationally, ground access vehicles emit an
average of 56 percent of VOCs from airport-related sources, while aircraft taking
off and landing give off only 32.6% (including emissions from auxiliary power
units) from airport-related sources.190 Ground access trips are generated are
generated by: 1) airport employees, 2) arriving and departing passengers, and 3)
cargo and mail transport to and from the airport.191
A root cause of the problem is not how many people travel to LAX and
other airports owned by the LAWA, but how they do so. If every employee and
passenger arrived to the airport on low-emission and readily available public
transit, the pollution problem from ground access transportation would be
minimized while the travel benefits would be maximized. However, public transit
represented only one percent of the trips to/from LAX in 2006. During this same
year, three-fourth of LAX passengers who lived in Southern California took a
private vehicle to LAX and more than three-fourths of these passengers were
dropped-off at the curb. This ‗kiss and fly‘ mode is the least expensive for the
individual and most expensive mode for society because it results in congestion
and air pollution from four, one-way vehicle trips. Through its ground access
pricing system, the LAWA incentivizes the most polluting and least efficient mode
of transportation while creating disincentives to take less polluting modes like
transit, FlyAway, and shared shuttle. A more efficient way to address the issue of
ground access transportation would be to accurately price trips to the LAWA
operated airports in order to internalize the negative externalities.
Recommendation 3.1 and Target: Clean air advocates should ask the
LAWA and other regional partners to explore cordon pricing in which private
vehicles would be accessed a toll to enter an airport pick-up and drop-off circle. If
the price was set right, the LAWA would generate income to go toward its air
quality and ground transportation programs while airport passengers would be
incentivized to use a less polluting mode of ground access transportation.

80 | P a g e
Priority of Recommendation 3.1: This action ranks as a medium priority.
While ground access is the most significant source of air pollution from LAX
operations and pricing could have the most significant impact on mode choice,
road pricing is currently not particularly politically viable at this time. However, toll
roads─ like the 91 Express Lanes owned and operated by the Orange County
Transportation Authority─ are becoming more acceptable and therefore, the
political calculation could shift in the future.192 Regardless, clean air advocates
would need to be willing to risk supporting a controversial measure.
Recommendation 3.2 and Target: Clean air advocates should ensure that
the Los Angeles County Metropolitan Transportation Authority (Metro) properly
designs the proposed Crenshaw/LAX Transit light rail line, which would run past
LAX and connect the Green Line with the Expo Line. If properly designed, this
eight and a half mile rail line could lure some passengers and employees to take
public transit to LAX versus driving. However, access and convenience to LAX
will impact the viability of this proposed transit option. The current plan calls for a
transit station at Century Boulevard and Aviation Boulevard─ a busy intersection
about a mile outside of LAX─ and the construction of a people mover between
this station and LAX terminals. The location of this transit station in a non-
pedestrian friendly area and the distance from LAX could serve as a barrier to
attracting riders. Clean air advocates should request that Metro address
concerns with LAX connectivity and safety at the proposed LAX transit station.
Priority of Recommendation 3.2: This action ranks as a medium but urgent
priority. The project planning is well underway and clean air advocates will want
to meet with Metro staff member as soon as possible. The Final Environment
Impact Study/Environment Impact Report could be ready by the end of 2010,
with the line scheduled to open in 2018.

81 | P a g e
4) Focus on Heavy-duty Trucks
Finding: Ontario Airport is part of an expanding freight movement system
in which trucks move freight from the Port of Los Angeles and Port of Long
Beach to the Inland Empire‘s freight loading facilities, warehouses, rail yards, and
airports. Diesel trucks also deliver products to airport tenants and airliners at
LAX, which ranks as the 13th in the world in air cargo tonnage handled.193
However, while the LAWA tracks some commercial vehicle traffic, it does not
track commercial truck trips at any of its airports.194 This lack of data indicates a
lack of focus on this emission source.
Recommendation and Target: First of all, clean air advocates should
request that the LAWA collect and make publically available data on cargo-
handling trucks. Managing a source of pollution requires the ability to measure
that pollution source. Second, clean air advocates could request that the LAWA
pursue a policy to phase-out the oldest and dirtiest trucks that enter onto the
property of the LAWA. The model that the LAWA should explore is the Clean
Trucks Program at the Port of Los Angeles and Port of Long Beach. The Clean
Trucks Program progressively bans all trucks that do not meet the most recent
emission standards by 2012.195 Like at the Port of Los Angeles, the City of Los
Angeles serves as a landlord at its airports and as a landlord, the City can set
terms for companies that do business on its property.
Priority: These two interrelated actions rank as a medium and potentially
high priority. Without good data, it is hard to know how significant cargo handling
vehicles are to air pollution related to the LAWA‘s operations. Obtaining this data
is important and could help determine next steps.

82 | P a g e
SOURCE TARGET: AIRCRAFT
5) Ban Lead in Aviation Gasoline
Finding: Studies of emissions near airports in Los Angeles County
demonstrate highly elevated levels of lead particulate. Lead is banned in all fuel
in the US except aviation gasoline (avgas). Avgas is used in non-commercial,
piston-engine aircraft that frequent generation aviation airports including Van
Nuys Airport, the largest general aviation airport in the world. On a national basis,
emissions of lead from aircraft engines using leaded avgas are the largest single
source category for emissions of lead to air, comprising approximately half of the
national inventory in 2005.196 The tetra-ethyl lead found in leaded avgas and its
combustion products are potent neurotoxins. The US Centers for Disease
Control and Prevention (CDC) concluded in 2005 that no ―safe threshold for
blood lead has been identified.‖197 The Federal Aviation Administration (FAA)
certified a non-lead alternative, AGE85, but it is not widely used in part because
the FAA has been slow to certify AGE85 for all types of small planes.
On April 28, 2010 the EPA Administrator Lisa Jackson issued an
Advance Notice of Proposed Rulemaking on Lead Emissions From Piston-
Engine Aircraft Using Leaded Aviation Gasoline. Until June 28, 2001, the EPA
will accept comments on the ―data available for evaluating lead emissions,
ambient concentrations, and potential exposure to lead from the continued use of
leaded avgas in piston-engine powered aircraft,‖ as well as ―additional
information that will inform future action.‖198
Recommendation 5.1 and Target: Clean air advocates should submit
comments to the EPA─ prior to the June 28th, 2010 comment period deadline─
about the high levels of lead particulate found in the areas surrounding Van Nuys
Airport and other general aviation airports in Los Angeles County, as well as the
number of schools located within a three mile buffer zone of these airports (see
pages 37 to 39 for this information). Clean air advocates should then track the
EPA‘s rulemaking process and advocate for the removal of lead in avgas.
Priority of Recommendation 5.1: This action ranks as a high and urgent
priority given that the EPA is in the beginning of their rulemaking process and
there is the potential to affect regulation that could protect the public from lead
exposure from avgas.
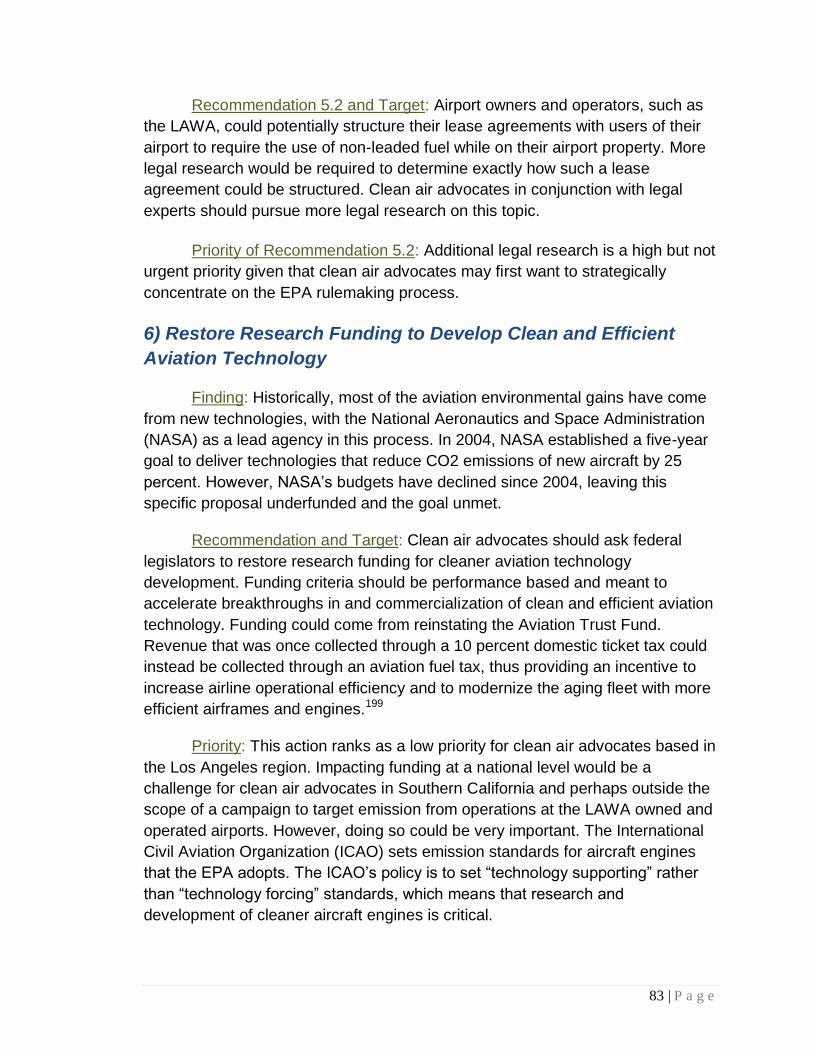
83 | P a g e
Recommendation 5.2 and Target: Airport owners and operators, such as
the LAWA, could potentially structure their lease agreements with users of their
airport to require the use of non-leaded fuel while on their airport property. More
legal research would be required to determine exactly how such a lease
agreement could be structured. Clean air advocates in conjunction with legal
experts should pursue more legal research on this topic.
Priority of Recommendation 5.2: Additional legal research is a high but not
urgent priority given that clean air advocates may first want to strategically
concentrate on the EPA rulemaking process.
6) Restore Research Funding to Develop Clean and Efficient
Aviation Technology
Finding: Historically, most of the aviation environmental gains have come
from new technologies, with the National Aeronautics and Space Administration
(NASA) as a lead agency in this process. In 2004, NASA established a five-year
goal to deliver technologies that reduce CO2 emissions of new aircraft by 25
percent. However, NASA‘s budgets have declined since 2004, leaving this
specific proposal underfunded and the goal unmet.
Recommendation and Target: Clean air advocates should ask federal
legislators to restore research funding for cleaner aviation technology
development. Funding criteria should be performance based and meant to
accelerate breakthroughs in and commercialization of clean and efficient aviation
technology. Funding could come from reinstating the Aviation Trust Fund.
Revenue that was once collected through a 10 percent domestic ticket tax could
instead be collected through an aviation fuel tax, thus providing an incentive to
increase airline operational efficiency and to modernize the aging fleet with more
efficient airframes and engines.199
Priority: This action ranks as a low priority for clean air advocates based in
the Los Angeles region. Impacting funding at a national level would be a
challenge for clean air advocates in Southern California and perhaps outside the
scope of a campaign to target emission from operations at the LAWA owned and
operated airports. However, doing so could be very important. The International
Civil Aviation Organization (ICAO) sets emission standards for aircraft engines
that the EPA adopts. The ICAO‘s policy is to set ―technology supporting‖ rather
than ―technology forcing‖ standards, which means that research and
development of cleaner aircraft engines is critical.

84 | P a g e
SOURCE TARGET: GROUND SUPPORT EQUIPMENT
7) Ensure Implementation of the LAX CBA
Finding: Ground service equipment account for four percent of VOC
emissions, two percent of PM10 emissions, and 11 percent of NOx emissions. As
part of the LAX Community Benefits Agreement (CBA), the LAWA agreed to
convert all on-airport ground service equipment (GSE) to the cleanest technology
available by 2015. Currently, only approximately a quarter of LAX‘s tenant GSE
are zero-emission.200
Recommendation and Target: Clean air advocates should monitor and
ensure that the LAWA meets its commitments in the CBA.
Priority: This action ranks as a high priority. Significant resources are
required to monitor and put pressure on the LAWA to meet its commitment to
clean GSE and other air quality components as part of the CBA. Yet doing so is
important because of the potential for significant emission reductions and the
logic in fully implementing an existing agreement rather than developing new and
potentially duplicative policies.
8) Defend California’s On-Road Diesel Regulation and/or
Advocate for a New Regulation that Targets GSE
Finding: The state of California does not specifically target ground support
equipment (GSE) in any of its binding regulations. While the CARB‘s In-Use Off-
Road Diesel Vehicle Regulation applies to GSE, among many other emission
sources, as part of the 2009 California budget, the California legislature directed
the CARB to make several changes to the rule that reduce the emission
reduction and health benefits associated with the rule by extending compliance
deadlines and making other requirements less stringent.201
Recommendation and Target: Clean air advocates should work with the
CARB to defend this important rule. If the CARB does not strengthen the rule,
clean air advocates should encourage the CARB to develop a separate rule that
specifically and aggressively addresses airport GSE.
Priority: This action ranks as a medium priority. An effective statewide rule
could have significant emission reduction potential, but strengthening or creating
a new rule to effectively target emissions from GSE at airports would be

85 | P a g e
challenging given the current political and regulatory climate
TARGET SOURCE: AIRPORT VEHICLE FLEETS
9) Ensure that the LAWA Meets its Commitment to Cleaner
Airport Vehicles and Extend the Commitment to Ontario and Van
Nuys Airports
Finding: Airport-owned vehicles contribute nine percent of VOC emissions,
four percent of NOx emissions, and three percent of PM10 emissions from LAX-
related operations. As part of the LAX Community Benefits Agreement, the
LAWA agreed that 100 percent of its fleet vehicles would be alternative fueled, or
vehicles with comparable emissions, by 2015. Currently, the LAX fleet is
comprised of approximately 72 percent alternative fuel vehicles (AFV). LAWA
has not publicized its fleet ratio for its other airports, an indication that the AFV
rate is significantly lower elsewhere.
Recommendation 9.1 and Target: Clean air advocates should monitor and
ensure that the LAWA meets its commitment to a 100 percent transition of its
LAX fleet to alternative fuel vehicles, or vehicles with comparable emission
reductions, as part of the LAX Community Benefits Agreement.
Priority for Recommendation 9.1: In general, monitoring the LAWA‘s
progress in implementing the LAX Community Benefits Agreement (CBA) should
be a high priority for clean air advocates.
Recommendation 9.2 and Target: The commitment to alternative fueled
vehicles via the CBA should be extended to Ontario Airport and Van Nuys
Airports. Although the LAWA is behind in its original schedule for the Ontario
Master Plan due to the recent downturn in air travel, the LAWA will likely move
forward with development plans for Ontario Airport at some point in the future.
Clean air advocates could use that opportunity to ensure that the LAWA is
maximizing opportunities for emission reductions from its vehicle fleet as part of
any plan to expand.
Priority of Recommendation 9.2: This action ranks as a low to medium
priority. While creating something like a community benefits agreement for
Ontario Airport could result in significant emission reductions, doing so would
take a significant amount of resources and a comprehensive clean air action
plan, per recommendation number one, is the preferred strategy.

86 | P a g e
TARGET: STATIONARY SOURCES
10) Go Solar at the LAWA Airports
Finding: Although mobile sources constitute the bulk of emissions related
to airport operations, stationary sources─ primarily from energy production─
account for two percent of both NOx and PM10 emissions from LAX operations.
In November 2009, the LAWA Board of Airport Commissioners approved a new
central utility plant at LAX that will decrease emissions relative to current levels.
However, the effort does not go as far as some airports─ like Denver
International─ that are investing in onsite solar arrays.
Recommendation and Target: Clean air advocates should ask the Los
Angeles World Airports and the Los Angeles Department of Water (DWP) to
invest in solar panels at every airport owned and operated by the LAWA. In
particular, the LAWA and the DWP should follow through with the proposal to
build a large solar facility on unused land on Palmdale Airport property.
Priority: This action ranks as a medium priority. Stationary sources are not
the most significant source of criteria air pollution from airport operations, but
reducing emissions associated with airport energy use would be achieved simply
by shifting to more solar power. The LAWA certainly has the space to install solar
panels on its properties and doing so could help meet the City of Los Angeles‘
renewable energy goals and advance the City‘s Solar Plan.
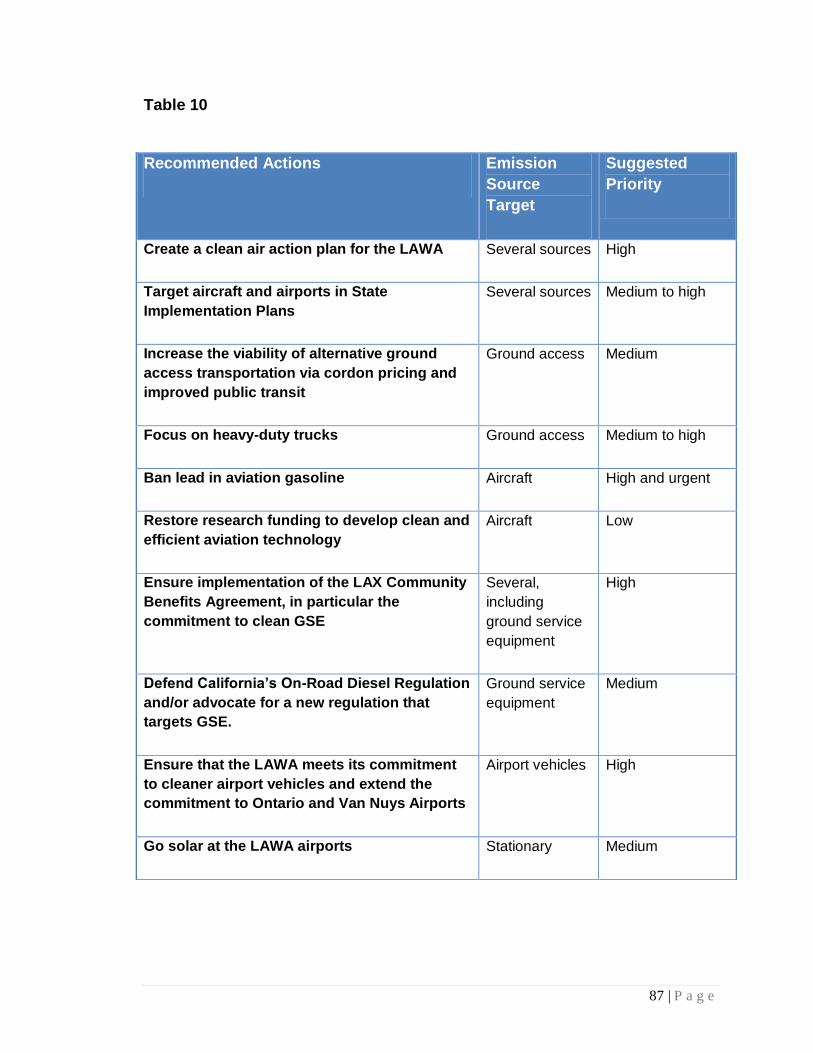
87 | P a g e
Table 10
Recommended Actions Emission
Source
Target
Suggested
Priority
Create a clean air action plan for the LAWA Several sources High
Target aircraft and airports in State
Implementation Plans
Several sources Medium to high
Increase the viability of alternative ground
access transportation via cordon pricing and
improved public transit
Ground access Medium
Focus on heavy-duty trucks Ground access Medium to high
Ban lead in aviation gasoline Aircraft High and urgent
Restore research funding to develop clean and
efficient aviation technology
Aircraft Low
Ensure implementation of the LAX Community
Benefits Agreement, in particular the
commitment to clean GSE
Several,
including
ground service
equipment
High
Defend California’s On-Road Diesel Regulation
and/or advocate for a new regulation that
targets GSE.
Ground service
equipment
Medium
Ensure that the LAWA meets its commitment
to cleaner airport vehicles and extend the
commitment to Ontario and Van Nuys Airports
Airport vehicles High
Go solar at the LAWA airports Stationary Medium

88 | P a g e
Aviation is one of the most rapidly growing sources of both criteria
pollutants and greenhouse gas emissions. This trend will continue if the long-
term demand for air travel increases without policy, technology, and operational
changes. Fortunately, many opportunities exist for emission reductions that clean
air advocates can pursue. A combination of international, national, state,
regional, and local entities have a role in reducing emissions from a variety of
sources at the Los Angeles World Airports (LAWA). These emission sources
include: ground access transportation, aircraft, airport fleet vehicles, ground
support equipment, and stationary sources.
Any campaign to significantly reduce emissions from the LAWA‘s airports
should seek to move the LAWA to develop a comprehensive plan to reduce
emissions from all airport-related emission sources through a consistent
application of air quality goals and policies at all of the LAWA‘s airports. While
not simple, designing a successful clean air campaign is important given
significant air quality and health impacts of airports.
Conclusion

89 | P a g e
GLOSSARY OF TERMS AND ACRONYMS
air carriers ─ airlines holding a certificate issued under section 401 of the
Federal Aviation Act of 1958 that operate aircraft designed to have a maximum
seating capacity of more than 60 seats or a maximum payload capacity of more
than 18,000 pounds or conduct international operations. There are four different
types of air carriers: major, national, large regional, and medium regional. Their
annual operating revenues are, respectively, greater than $1 billion, $100 million
to $1 billion, $20 million to $100 million, and up to $20 million.
air taxis ─ planes that 1) perform at least five round trips per week between two
or more points according to flight schedules that specify the times, days of the
week, and places between which such flights are performed or 2) transport mail
pursuant to a current contract with the US Postal Service.
airport operations ─ the number of arrivals and departures from the airport at
which the airport traffic control tower is located.
AFV ─ alternative fuel vehicle
attainment area ─ an area considered to have air quality as good as or better
than the national ambient air quality standards as defined in the Clean Air Act. An
area may be an attainment area for one pollutant and a nonattainment area for
others. See also nonattainment area.
CARB ─ California Air Resources Board
CBA ─ community benefits agreement
commercial aircraft ─ the sum total of air carrier and air taxi flights.
CO2 ─ carbon Dioxide
criteria pollutant ─ The US Environmental Protection Agency sets National
Ambient Air Quality Standards for six common air pollutants, which are known as
Appendix 1

90 | P a g e
―criteria pollutants‖ because EPA develops human health-based and/or
environmentally-based criteria for setting permissible levels. These pollutants are
particle pollution (often referred to as particulate matter), ground-level ozone,
carbon monoxide, sulfur oxides, nitrogen oxides, and lead.
day-night sound level (DNL) ─ a level of noise derived by measuring average
sound levels in a 24-hour day, in decibels. Night time noise, between the hours of
10:00 p.m. and 7:00 a.m. is "weighted"; that is, given an additional 10 decibels to
compensate for sleep interference and other disruptions caused by loud
nighttime noise. For airport noise exposure purposes, an annual average of the
daily day-night average sound levels is used. 65 dB DNL is the noise threshold at
which the FAA defines areas as "compatible" with residential use; areas at or
above 65 dB DNL are designated as "incompatible" with residential use.
decibel (dB) ─ a unit of sound measurement. A sound doubles in loudness for
every increase of ten decibels.
emission ─ pollution discharged into the atmosphere from smokestacks, other
vents, and surface areas of commercial or industrial facilities; from residual
chimneys; and from motor vehicle, locomotive, or aircraft exhausts.
EPA ─ Environmental Protection Agency
EU ─ European Union
general aviation ─ all aviation that is not commercial or military.
GHG ─ greenhouse gas
GSE ─ ground service equipment
hazardous air pollutants (HAP) ─ also known as toxic air pollutants, are those
pollutants that are known or suspected to cause cancer or other serious health
effects, such as reproductive effects or birth defects, or adverse environmental
effects. See also toxic air pollutants.
HC ─ hydrocarbon

91 | P a g e
ICAO ─ International Civil Aviation Organization
IPCC ─ International Panel on Climate Change
FAA ─ Federal Aviation Administration
LA ─ Los Angeles
LAWA ─ Los Angeles World Airports
LAX ─ Los Angeles International Airport
landing and takeoff cycle (LTO) ─ the basis of ground-level aircraft emissions
calculations. The components of an LTO are approach, taxi/idle-in, taxi/idle-out,
take-off, and climb-out. LTO cycle calculations include only the emissions planes
create within 3,000 feet of the earth's surface, all of which affect ground-level air
quality.
MOU ─ memorandum of understanding
National Ambient Air Quality Standards (NAAQS) ─ air quality standards
established by EPA that apply to outside air throughout the country.
nitrogen oxide (NOx) ─ a product of combustion from transportation and
stationary sources, a major contributor to acid deposition and the formation of
both ground level and upper tropospheric ozone.
non-attainment area ─ geographic area that does not meet one or more of the
National Ambient Air Quality Standards for ozone, nitrogen dioxide, carbon
monoxide, particulates, sulfur dioxide, and lead.
ONT ─ Ontario International Airport
ozone (O3) ─ a form of oxygen found in two layers of the atmosphere: the
stratosphere and the troposphere. This report refers to ozone in the
troposphere─ the layer extending up seven to 10 miles from the earth's surface.
Ozone is a chemical oxidant and major component of photochemical smog.
Ozone can seriously affect the human respiratory system and is one of the most
prevalent and widespread of all the criteria pollutants for which the Clean Air Act

92 | P a g e
required EPA to set standards. Ozone in the troposphere is produced through
complex chemical reactions of nitrogen oxides, hydrocarbons, and sunlight.
PM ─ particulate matter
RTP ─ Regional Transportation Plan
SCAG ─ Southern California Association of Governments
SCAQMD ─ South Coast Air Quality Management District
SCRAA ─ Southern California Regional Airport Authority
SIP (State Implementation Plan) ─ EPA-approved state plans for the
establishment, regulation, and enforcement of air pollution standards. States that
violate federal air quality standards for carbon monoxide, nitrogen dioxide,
ozone, PM10 (particulate matter smaller than 10 microns), lead or sulfur dioxide
must prepare SIPs.
smog ─ air pollution caused by chemical reactions of various pollutants emitted
from different sources.
sulfur dioxide (SO2) ─ a pungent, colorless gas formed primarily by the
combustion of fossil fuels; becomes a pollutant when present in large amounts.
sulfur oxides (SOx) ─ the entire group of sulfur oxides that include SO2 and the
less common SO3. EPA‘s National Ambient Air Quality Standard for SO2 is
designed to protect against exposure to the entire group of sulfur oxides.
Emissions that lead to high concentrations of SO2 generally also lead to the
formation of other SOx. Control measures that reduce SO2 can generally be
expected to reduce people‘s exposures to all gaseous SOx.
Toxic air pollutants ─ also known as hazardous air pollutants, are those
pollutants that are known or suspected to cause cancer or other serious health
effects, such as reproductive effects or birth defects, or adverse environmental
effects. The EPA is working with state, local, and tribal governments to reduce
the release of 188 toxic air pollutants.
93 | P a g e
Toxic Release Inventory (TRI) ─ a national database of information on toxic
chemical releases and transfers, administered by the EPA.
US ─ United States
VNY ─ Van Nuys Airport
volatile organic compound (VOC) ─ any organic compound that participates in
atmospheric photochemical reactions except for those designated by EPA as
having negligible photochemical reactivity.
Sources for definitions:
―Glossary of Environmental Terms,‖ Environmental Protection Agency. Last
updated December 1997. http://www.epa.gov/OCEPAterms/.
“Air Traffic Activity Data System,” Federal Aviation Administration. Last updated
July, 2009. http://aspmhelp.faa.gov/index.php/Glossary.

94 | P a g e
LABOR DYNAMICS
Traditionally, the airline industry has provided middle-class jobs. However,
job quality may have decreased in the industry in part due to economic
concessions and contracting policies that have driven down wages and
benefits.202 Labor costs have been a major focus for the industry‘s cost-cutting.203
According to the Wall Street Journal, airlines have cut wages and benefits so
much that they are having problems with attracting and retaining workers.204
Major network carriers cut more than 170,000 workers, or 38 percent of the total
workforce, between August 2001 and October 2006, according to the Air
Transport Association.205
In Los Angeles, labor issues have been a focus of airport oriented
organizing efforts. The Los Angeles Alliance for a New Economy was the lead
organization behind the community benefits (CBA) agreement reached with the
Los Angeles World Airports. The main labor related components of the CBA are
as follows:206
1. Job training. The LAWA committed to providing $3 million per year for five
years to fund job training, with funding priority given to low-income
individuals, special needs individuals, and individuals working in airport
jobs or aviation-related jobs. Programs include job readiness programs,
skills development, and career ladder programs.
2. First source hiring program. This program is geared toward low-income
individuals who have lived in the project impact area for at least one year
and special needs individuals given priority for available airport jobs.
Second priority is given to low-income individuals living in the city.
3. Living wage, worker retention, and contractor responsibility. The City‘s
Living Wage Ordinance applies to all Airport Contractors, Lessees, and
Licensees.
Appendix 2

95 | P a g e
OTHER AIRPORT-RELATED ENVIRONMENTAL
IMPACTS
In January 1995, the nonprofit organization the Natural Resources
Defense Council (NRDC) undertook a study and survey of airports throughout
the country to determine the most important environmental issues connected with
airports.207 The NRDC found that while airports vary in terms of size and
geographical characteristics, significant environmental impacts were common to
most of the airports in their survey. These impacts included: noise pollution, air
pollution, climate/energy impacts, and water pollution and use. The following two
sections are a summary of the findings and policy implications in respect to noise
pollution and water pollution impacts from airport operations.
Noise pollution
The bulk of the research on the health effects of airport operations have
focused on noise pollution. Research suggests that aircraft noise affects millions
of people every day in a variety of ways both short-term and long-term, both
obvious and difficult to gauge.208 Research proves that noise affects one's ability
to concentrate and can cause hearing loss and sleep deprivation, resulting in
potentially deleterious effects on health and well-being.209
A myriad of studies have also found that community exposure to aircraft
noise is associated with hypertension (high blood pressure).210 For example, in
2001, M. Rosenlund evaluated aircraft noise exposure for 2,959 adults and found
an association between the increase in raised blood pressure and a continuous
24 hour aircraft noise level above 55 dB and at maximum levels above 72 dB.211
Eriksson et al. studied 2,037 men in the 40 to 60 year age group over a 10 year
period and found that exposure to aircraft noise above 50 dB was associated
with a significant 20 percent increase in the risk of hypertension.212 The HYENA
study of 4,861 adults aged 45 to 70 years living in the close vicinity of six
European airports, reported that a 10 dB increase in the continuous night-time
noise level was found to be significantly associated with a 14 percent increase in
the probability of being diagnosed with hypertension.213 The largest study of
medication use was performed in the vicinity of Cologne/Bonn Airport in
Appendix 3

96 | P a g e
Germany).214 The study revealed significant relationships between the intensity
of aircraft noise and the number of antihypertensive medications prescribed per
patient. Antihypertensive medications for women were prescribed 27 percent
more often at for women exposed to continuous aircraft noise at a level of 40 to
45 dB and 66 percent more often at level of 46 to 61 dB.
Research also links airport noise to an increased risk of stroke and heart
disease. A recent (2010) study commissioned by Germany's Federal
Environment Agency studied data from public health insurers on more than 1
million Germans ages 40 and over who live near Cologne-Bonn Airport in
western Germany. According to the study, men who are exposed to jet noise
have a 69 percent higher risk of being hospitalized for cardiovascular disease.215
Women living under flight paths fare even worse, logging a 93 percent higher
rate of hospitalization with cardiovascular problems, compared with their
counterparts in quiet residential areas.216 The study also found that women who
are exposed to jet noise (of about 60 decibels) during the day are nearly two-
times as likely to suffer a stroke as women not exposed jet noise.217
Policy Implications
These studies clearly demonstrate that health effects are seen at levels
below 65 db DNL. The FAA's threshold of 65 dB for residential use is problematic
because: 1) it is based on an averaging of noise, rather than the loud "single
event" noise that specifically characterizes aircraft noise, and 2) the threshold of
65 dB significantly underestimates the level at which many people are impacted
by aircraft noise.218 The most recent studies on noise and health have been
conducted mostly in Europe rather than the United States. This is due, at least in
part, to the current limited role of the US Environmental Protection Agency (EPA)
in the field of aircraft noise.219 More research in the US is needed to perhaps
revisit safe noise levels. While most airports have some type of program in place
to lessen noise for their neighbors (such as using flight paths farther away from
residential areas at night), a fundamental key to good aircraft noise policy lies in
setting appropriate land uses adjacent to airports.220

97 | P a g e
Water Pollution
The presence of snow, ice, or slush on runways or aircraft frequently
causes hazardous conditions that can contribute to aircraft accidents, delays,
and flight cancellations. Consequently, deicing or anti-icing (preventing the
formation of ice) of aircraft and runways is a necessary part of operations at most
US airports in winter months. The most common method of controlling ice is
through the use of chemicals, particularly ethylene or propylene-based glycol
mixtures with additives. Given that many, if not most, of the country's largest
airports are sited along waterways, the control disposal of deicing chemicals and
other chemicals, solvents, and metals used at airports constitute a significant
water pollution issue. In addition, the use of deicing chemicals (particularly
ethylene glycol) and other toxic substances at airports may present threats to
human health, particularly to airport workers. Ethylene glycol and the issue of
worker health and safety needs to be further addressed.221
Revisions to the Clean Water Act revisions in 1987 recognized storm
water run-off for the first time under federal law. The result was a national storm
water permit system. However, the run-off management system that airports are
required to implement under the national storm water system is problematic
because of gaps in the areas of effluent standards, enforcement, and monitoring.
Policy Implications
Currently, aircraft deicing is not subject to a traditional effluent guideline
permitting process.222 The EPA could reinstate aircraft deicing in its
Transportation Cleaning effluent guidelines. The FAA could revise its Advisory
Circular on Airport Winter Safety and Operations (AC 150/5200-30A) to include
information on the latest, least environmentally-damaging deicing procedures
that also meet safety requirements.223 In addition, more research should be
conducted and information made available on the health effects of and the
alternatives to chemicals for deicing.224

98 | P a g e
OTHER ENVIRONMENTAL INITIATIVES OF THE LOS
ANGELES WORLD AIRPORTS
The LAWA‘s environmental programs─ beyond the air quality related
initiatives highlighted in the body of this report─ include the following:225 226
1) Hazardous Materials Management Programs
a. The LAWA technicians removed 2,200 pounds of mercury in old
instruments from the LAX Central Utilities Plan and replace them with
mercury-free electronic transmitters.
2) Noise Management Program
a. Residential Soundproofing Program. The number of eligible dwelling
around LAX is approximately 8,200. (The LAWA has not revealed how
many have actually been soundproofed, which probably means a lower
number). The Van Nuys Airport Residential Soundproofing Program
encompasses 1,054 dwelling units that are scheduled to be completed
by 2010.
b. Land Use Mitigation Program. This program is designed to administer,
monitor, and expedite the LAWA funding for noise mitigation programs,
including land acquisition and soundproofing in impacted areas around
LAX and within the cities of Inglewood, El Segundo, and
unincorporated areas of Los Angeles County as well as areas
surrounding ONT.
c. Voluntary Residential Acquisition and Relocation Program. This
program involved relocating approximately 1,400 unit owners who
voluntarily requested the LAWA to acquire their residential properties
and provide relocation assistance to owners and renters.
d. Federal Aviation Regulations, Part 161 Studies. LAWA initiated a study
in 2005 that was intended to restrict departures between midnight and
6:30 am over the communities east of the airport. (Residents note that
the flight restrictions are not enforced to a manner that significantly
limits night flights). The goal of the VNY Part 161 Study is to implement
Appendix 4

99 | P a g e
seven noise control measures. The scope of the work has expanded
and additional restrictions proposed include the phase-out of Stage 2-
type corporate jet aircraft and expanding the existing curfew to 9 am
and weekends.
e. LA/Ontario Airport Noise Advisory Committee and LAX Community
Noise Roundtable.
3) Source Reduction and Recycling Program
a. LAWA recycled and reused more than 64 percent of trash it generated
in 2007.
b. LAWA also uses recycled materials in its construction projects. More
than 75 percent of the construction and demolition waste from the LAX
Tom Bradley International Terminal Renovation Project will be recycled
or salvaged.
4) Water Conservation and Management Programs
a. All LAWA toilets and sinks use low-flow devices.
b. Presently, 35 percent of all landscaped areas at LAX are irrigated by
reclaimed water, saving approximately 40.2 million gallons per year.
5) Storm-water Monitoring
a. Prevention. LAWA staff conducts state-mandated storm-water
management programs at LAX, ONT, and VYN.
b. Inspection. Airport tenant sites are inspected annually to ensure
compliance with storm-water regulations.
c. Training. LAWA holds storm-water training sessions annually.
6) Wildlife and Habitat Conservation Programs
a. LAX Sand Dunes Restoration.
b. Palos Verdes Peninsula Land Conservancy.

100 | P a g e
WORKS CITED
1 Zhan, L. ―Cleaner Skies, Brighter Future: Opportunities and Obstacles to Reduce Airport-based Greenhouse Gas Emissions.‖ June 2, 2008. 2 McCollum, D.; Gould, G.; Greene, D. ―Greenhouse Gas Emissions from Aviation and Marine Transportation: Mitigation Potential and Policies.‖ Pew Center on Global Climate Change. Dec 2009. 3 U.S. House of Representatives, Committee on Transportation and Infrastructure, Subcommittee on Aviation staff. U.S. House of Representatives hearing on ―Aviation and the Environment: Emissions.‖ May 5, 2008. 4 U.S. Environmental Protection Agency Electronic Report on the Environment. Updated in December 2009 using the 2005 National Emissions Inventory. http://cfpub.epa.gov/eroe. 5 Advisory Committee on Childhood Lead Poisoning Prevention (ACCLPP) (2007) Interpreting and managing blood lead levels <10 ug/dL in children and reducing childhood exposures to lead: Recommendations of CDC's Advisory Committee on Childhood Lead Poisoning Prevention. Morbidity and Mortality Weekly Report. 56(RR-8). November 2, 2007. 6 U.S. Environmental Protection Agency. ―Advance Notice of Proposed Rulemaking on Lead Emission from Piston-Engine Aircraft Using Leaded Aviation Gasoline.‖ Federal Registry. Vol. 75, No 81, April 38, 2010. 7 Los Angeles World Airports. ―Los Angeles World Airport Sustainability Plan.‖ 2008. 8 Los Angeles World Airports. LAX Airport General Description. http://www.lawa.org/welcome_lax.aspx?id=40. 9 Hastings, Norene. Communication with Environmental Specialists at the Los Angeles World Airports. Nov. 9, 2009. 10 Port of Los Angeles and Port of Long Beach. http://www.cleanairactionplan.org/about_caap/clean_trucks.asp. 11 State and Territorial Air Pollution Program Administrators and the Association of Local Air Pollution Control Officials. Letter to the U.S. Environmental Protection Agency. Docket No. OAR-2002-0030. December 15, 2003. 12 Ibid.
Appendix 5

101 | P a g e
13 California Air Resources Board and the American Lung Association of California. ―Recent Research Findings: Health Effects of Particulate Matter and Ozone Air Pollution.‖ November, 2007. http://www.arb.ca.gov/research/health/fs/pm_ozone-fs.pdf. 14 U.S. House of Representatives, Committee on Transportation and Infrastructure, Subcommittee on Aviation staff. U.S. House of Representatives hearing on ―Aviation and the Environment: Emissions.‖ May 5, 2008. 15 Federal Aviation Administration, Office of Energy and Environment. ―Aviation and Emissions: A Primer.‖ January, 2005. http://www.faa.gov/regulations_policies/policy_guidance/envir_policy/media/aeprimer.pdf 16 State and Territorial Air Pollution Program Administrators and the Association of Local Air Pollution Control Officials. Letter to the U.S. Environmental Protection Agency. Docket No. OAR-2002-0030. December 15, 2003. 17 Ton, M. K. Ecos Consulting. ―Plane Smog: An Assessment of the Sources and Effects of LAX Air Pollution on the Local and Global Environment.‖ January, 2001. Data from South Coast Air Quality Management District, 1997. 18 Ibid.
19 Ibid. 20 Source: South Coast Air Quality Management District, ―2007 Air Quality Management Plan.‖ http://www.aqmd.gov/aqmp/07aqmp/draft/07aqmp.pdf. 21 Intergovernmental Panel on Climate Change (IPCC). ―Aviation and Climate Change.‖ 1999. 22 Natural Resources Defense Council. ―Flying Off Course: Environmental Impacts of America's Airports.‖ October, 1996. http://www.rcaanews.org/nrdc_FOC.pdf. 23 McCollum, D.; Gould, G.; Greene, D. ―Greenhouse Gas Emissions from Aviation and Marine Transportation: Mitigation Potential and Policies.‖ Pew Center on Global Climate Change. Dec 2009. 24 Ibid.
25 U.S. Department of Transportation. ―Aviation Industry Performance: A Review of the Aviation Industry in 2008.‖ May 6, 2009. 26 Ibid.
27 Weikel, D. & Pae, P. ―A dizzying descent at airport.‖ LA Times, August 6, 2008.
28 Ibid.

102 | P a g e
29 Ibid.
30 Ibid. 31 U.S. Department of Transportation, Federal Aviation Administration. ―Aerospace Forecast: Years 2006-2025.‖ 2009. http://www.faa.gov/data_research/aviation/aerospace_forecasts/2009-2025/media/2009%20Forecast%20Doc.pdf. 32 Southern California Association of Governments. ―General Aviation Plan for the 2004 Regional Transportation Plan.‖ April 2004. 33 Zhan, L. ―Cleaner Skies, Brighter Future: Opportunities and Obstacles to Reduce Airport-based Greenhouse Gas Emissions.‖ June 2, 2008. 34 Federal Aviation Administration, Office of Energy and Environment. ―Aviation and Emissions: A Primer.‖ January, 2005. http://www.faa.gov/regulations_policies/policy_guidance/envir_policy/media/aeprimer.pdf. 35 Fleming, G.; Malwitz, A.; Balasubramanian, S.; Roof, C.; Grandi, B.K.; Usdrowski, S.; Elliff, T.; Eyers, C.; and Lee, D. ―Trends in Global Noise and Emissions from Commercial Aviation for 2000 through 2025.‖ Paper submitted to the 7th USA /Europe Air Traffic Management R&D Seminar, Barcelona. DOT Volpe Center, Wyle Laboratories, Inc., EUROCONTROL, QinetiQ, and Manchester Metropolitan University. 2007.
36 Ibid.
37 U.S. House of Representatives, Committee on Transportation and Infrastructure, Subcommittee on Aviation staff. U.S. House of Representatives hearing on ―Aviation and the Environment: Emissions.‖ May 5, 2008. 38 Zhan, L. ―Cleaner Skies, Brighter Future: Opportunities and Obstacles to Reduce Airport-based Greenhouse Gas Emissions.‖ June 2, 2008. 39 State and Territorial Air Pollution Program Administrators and the Association of Local Air Pollution Control Officials. Letter to the U.S. Environmental Protection Agency. Docket No. OAR-2002-0030. December 15, 2003. 40 Ibid. 41 Federal Aviation Administration, Office of Energy and Environment. ―Aviation and Emissions: A Primer.‖ January, 2005. http://www.faa.gov/regulations_policies/policy_guidance/envir_policy/media/aeprimer.pdf. 42 Ibid.
103 | P a g e
43 Ibid.
44 Ibid. 45 Humphries, J. ―Aviation Air Quality 101: Airport Operations in Air Quality Plans.‖ PowerPoint presentation at the Airport Air Quality Symposium. March 12-14, 2003. 46 Ribeiro, K.; Kobayashi, S.; Beuthe, M.; Gasca, J.; Greene, D; Lee, D.S.; Muromachi, Y.; Newton, P.J.; Piotkin, S.; Sperling, D.; Wit, R.; Zhou, P.J. 2007. ―Transport and its Infrastructure.‖ In Climate Change 2007: Mitigation. Contribution of Working Group III to the Fourth Assessment Report of the Intergovernmental Panel on Climate Change. [Metz, M.; Davidson, O.R.; Bosch, P.R.; Dave, R.; Meyer, L.A. (eds)]. Cambridge University Press, Cambridge, United Kingdom and New York, NY, USA. 47 Federal Aviation Administration, Office of Energy and Environment. ―Aviation and Emissions: A Primer.‖ January, 2005. http://www.faa.gov/regulations_policies/policy_guidance/envir_policy/media/aeprimer.pdf. 48 Zhan, L. ―Cleaner Skies, Brighter Future: Opportunities and Obstacles to Reduce Airport-based Greenhouse Gas Emissions.‖ June 2, 2008. 49 Information from this section taken from: Air Transport Association. http://www.airlines.org/customerservice/airports/Airports_QandA.htm. Viewed on February 20, 2010. 50 Information from this section taken from: Air Transport Association. http://www.airlines.org/customerservice/airports/Airports_QandA.htm. Viewed on February 20, 2010. 51 Los Angeles World Airports. http://www.lawa.org/welcome_LAWA.aspx?id=682. Accessed on March 6, 2010. 52 Southern California Association of Governments. ―General Aviation Plan for the 2004 Regional Transportation Plan.‖ April 2004. 53 Erie, S.; Mckenzie, A.; NacJebsue, S.; Shaler, S. ―Regional Airport Management Study.‖ Prepared for the Southern California Association of Governments by CitiGroup Technologies Corporation. September 2005. 54 Ibid. 55 Ibid. 56 Ibid.

104 | P a g e
57 Los Angeles World Airports. Ontario Airport General Description. http://www.lawa.org/welcomeONT.aspx. 58 Ibid. 59 Ibid.
60 Los Angeles World Airports. Van Nuys Airport General Description. http://www.lawa.org/welcome_VNY.aspx?id=92. 61 Ibid. 62 Los Angeles World Airports. LAX Airport General Description. http://www.lawa.org/welcome_lax.aspx?id=40. 63 Ibid. 64 Ibid.
65 Ibid. 66 Ibid.
67 Los Angeles World Airports. LAWA Air Passenger Survey Report. http://www.lawa.org/uploadedfiles/lax/pdf/2006LAXPassengerSurveyFinal.pdf. 68 LAX Master Plan Supplement to the Draft Environmental Impact Report/ Environmental Impact Statement, Executive Summary table ES-1, Summary of Activity, Comparison of Alternatives, p. ES-2. 69 LAX Bradley West Project Draft Environmental Impact Report. Executive Summary, p. 1-10. May 2009. 70 Kaye, Laurie and Lopez Mendoza, Jerilyn. ―Everybody Wins: Lessons Learned from Negotiating Community Benefit Agreements in Los Angeles.‖ Environmental Defense. 2008. 71 Ibid. 72 Ibid. 73Ibid. 74 Ibid. 75 Community Benefits Agreement: LAX Master Plan Program. Page 1.

105 | P a g e
76 LAX Community Benefits Agreement. 2005. http://www.ourlax.org/cb_CBA_Exhibits.cfm. 77 Kaye, Laurie and Lopez Mendoza, Jerilyn. ―Everybody Wins: Lessons Learned from Negotiating Community Benefit Agreements in Los Angeles.‖ Environmental Defense. 2008. 78 Ibid. 79 Joe Lyou. Personal communication. October 15, 2009. 80 Jacobs Consultancy. Letter to LAX SAS File re: Commercial Vehicles Using Alternative Fuel in the LAX Central Terminal Area. Sep. 9, 2008. 81 Los Angeles World Airports. ―Los Angeles World Airport Sustainability Plan.‖ 2008. 82 Los Angeles World Airports. http://www.lawa.org/welcome_LAX.aspx?id=1066. November 1, 2009. 83 Ibid. 84 Ibid.
85 Joe Lyou. Personal communication. October 15, 2009. 86 Los Angeles World Airports. http://www.lawa.org/welcome_LAX.aspx?id=1066. November 1, 2009. 87 Los Angeles World Airports. 2008. ―Environmental Overview.‖ 88 Ibid.
89 Ibid. 90 Visser, Ben. ―Visser‘s Voice: ‗Knock, Knock: Who‘s there? Unleaded avgas.‘‖ General
Aviation. August 29, 2003.
http://www.generalaviationnews.com/editorial/articledetail.lasso?-token.key=7813&-
token.src=column&-nothing.
91 U.S. Environmental Protection Agency Electronic Report on the Environment. Updated in December 2009 using the 2005 National Emissions Inventory. http://cfpub.epa.gov/eroe. 92 Advisory Committee on Childhood Lead Poisoning Prevention (ACCLPP) (2007) Interpreting and managing blood lead levels <10 ug/dL in children and reducing childhood exposures to lead: Recommendations of CDC's Advisory Committee on Childhood Lead Poisoning Prevention. Morbidity and Mortality Weekly Report. 56(RR-8). November 2, 2007.

106 | P a g e
93 U.S. Environmental Protection Agency. ―Advance Notice of Proposed Rulemaking on Lead Emission from Piston-Engine Aircraft Using Leaded Aviation Gasoline.‖ Federal Registry. Vol. 75, No 81, April 38, 2010. 94 Ibid.
95 U.S. Environmental Protection Agency. ―Lead.‖ http://www.epa.gov/lead/. 96 U.S. Environmental Protection Agency. ―Particulate Matter.‖ http://www.epa.gov/air/particlepollution/basic.html. Viewed on February 21, 2010. 97 Environmental Protection Agency. ―Particulate Matter, Health and Environment.‖ http://www.epa.gov/air/particlepollution/health.html. Viewed on February 21, 2010. 98 Jovasevic-Stoganovic, M. ―Some Issus of Risk From Exposure to Nanoparticules from Different Sources.‖ Radiation and Environmental Protection Department, Institute Vinča, Begrade, Serbia. Report presented at the South Coast Air Quality Management District,
Ultrafine Particle Conference, April 30-May 2, 2006. 99 California Air Resources Board. ―History.‖ http://www.calepa.ca.gov/about/History01/PDF/9arb.pdf. 100 Environmental Protection Agency. ―About Air Toxics.‖ http://www.epa.gov/ttn/atw/allabout.html. Viewed on May 8, 2010. 101 Ibid.
102 Ibid. 103 Ibid.
104 Ibid. 105 Intergovernmental Panel on Climate Change (IPCC). ―Aviation and Climate Change.‖ 1999. 106 McCollum, D.; Gould, G.; Greene, D. ―Greenhouse Gas Emissions from Aviation and Marine Transportation: Mitigation Potential and Policies.‖ Pew Center on Global Climate Change. Dec 2009. 107 Ibid. 108 Ibid. 109 Begley, S. ―The Evolution of an Eco-Prophet.‖ Newsweek. Nov 9, 2009.

107 | P a g e
110 Ibid. 111 Fischer, Douglas. ―Cleaning the Air Helps Cool Planet.‖ Environmental Health News: Dec. 12, 2008. 112 Hu S, Fruin S, Kozwa K, Mara, S, Winer A, and Paulson S. ―Aircraft Emission Impacts in a Neighborhood Adjacent to a General Aviation Airport in Southern California.‖ Environ. Sci. Technol. 2009, 43, 9839-8045. 113 Coel, D. and Pourzand, H.―Staff Report: Rule 1194 Commercial Airport Ground Access.‖ South Coast Air Quality Management District. August 2000.
114 Fine, P. March 5, 2008. PowerPoint at the Fling Green Conference. http://airquality.ucdavis.edu/pages/events/2008/flying_presentations/FINE.pdf.
115 Ibid.
116 Westerdahl D, Fruin S, Fine P, and Sioutas C. ―The Los Angeles International Airport as a source of ultrafine particles and other pollutants to nearby communities.‖ California Air Resources Board and the University of Southern California. Atmospheric Environment. 2008, 42: 3143-3155. 117 Froines, J.; Fanning, E.; Chun, R.; and Lu, R. ―Monitoring and Modeling of Ultrafine Particles and Black Carbon at the Los Angeles International Airport.‖ University of California, Los Angeles. Prepared for the California Air Resources Board and the California Environmental Protection Agency. June 20, 2007. 118 Ibid. 119 Carslaw D, Beevers S, Ropkins K, and Bell M. C. ―Detecting and quantifying aircraft and other on-airport contributions to ambient nitrogen oxides in the vicinity of a large international airport.‖ Atms. Environ. 2006, 40, 5424-5434. 120 Hu, S; Fruin S.; Kozwa, K.; Mara, S.; Winer. A.; and Paulson, S. ―Aircraft Emission Impacts in a Neighborhood Adjacent to a General Aviation Airport in Southern California.‖ Environ. Sci. Technol. 2009, 43, 9839-8045. 121 Piazza, B. "Santa Monica Municipal Airport: A Report on the Generation and Downwind Extent of Emissions Generated from Aircraft and Ground Support Operations." Los Angeles Unified School District. Prepared for the Santa Monica Airport Working Group. June, 1999. 122 Fine, P. ―Community-Scale Air Toxics Monitoring- Sun Valley Neighborhood and General Aviation Airport.‖ U.S. EPA Air Toxics Data Analysis Workshop Presentation: Chicago, IL, 2007. 123 Hu, S.; Fruin, S.; Kozawa, K.; Mara, S. and Paulson, S. ―Aircraft Emission Impacts in a Neighborhood Adjacent to a Ground Aviation Airport in Southern California.‖ University

108 | P a g e
of California, Los Angeles, University of Southern California, and the California Air Resources Board. Environ. Sci. Technol. 2009, 43, 8039-8045. 124 Ton, M. K. Ecos Consulting. ―Plane Smog: An Assessment of the Sources and Effects of LAX Air Pollution on the Local and Global Environment.‖ January, 2001. Data from South Coast Air Quality Management District, 1997. 125 Holzman, D. ―Plane Pollution.‖ Environmental Health Perspectives. Volume 105, Number 12, December 1997. http://ehp.niehs.nih.gov/qa/105-12focus/focus.html. 126 U.S. Department of Transportation, Research and Innovative Technology Administration. ―Airport Ground Access Planning Guide.‖ Lead author: Lee, Chimini. 1995. http://ntl.bts.gov/DOCS/AGAPP.html. 127 Los Angeles World Airports. ―2006 LAX Air Passenger Survey Final Report.‖ December 2007. http://www.lawa.org/uploadedfiles/lax/pdf/2006LAXPassengerSurveyFinal.pdf. 128 Ibid. 129 Ibid. 130 Los Angeles County Metropolitan Transportation Authority. ―Crenshaw Transit Corridor Draft Environmental Impact Statement.‖ 2009. 131 Johnson, R. ―Sustainability and Environmental Initiatives at Los Angeles World Airports.‖ Presentation on March 4, 2009. 132 Los Angeles World Airports. ―Los Angeles World Airports Sustainability Plan.‖ April 2008. 133 Los Angeles World Airports, Presentation to the Board of Airport Commissioners, May 3, 2010. http://www.lawa.org/uploadedFiles/board_agenda/ManagementReports/boac100503zFlyAway%20Performance%20Update%20050310.pdf. 134 Los Angeles World Airports. ―2006 LAX Passenger Survey Final Report.‖ December, 2007. 135 Los Angeles World Airports. ―Los Angeles World Airports Sustainability Plan.‖ April 2008. 136 Weikel, D. ―FlyAway Bus Fare to LAX to Rise.‖ LA Times. June 11, 2009. http://latimesblogs.latimes.com/lanow/2009/06/flyaway-bus-fare-to-lax-to-rise.html. 137 Los Angeles World Airports, Presentation to the Board of Airport Commissioners, May 3, 2010.

109 | P a g e
http://www.lawa.org/uploadedFiles/board_agenda/ManagementReports/boac100503zFlyAway%20Performance%20Update%20050310.pdf. 138 Los Angeles World Airports. ―Los Angeles World Airports Sustainability Plan.‖ April 2008. 139 Ibid. 140 Ibid. 141 Ibid. 142 Ibid. 143 Los Angeles County Metropolitan Transportation Authority. ―Crenshaw Transit Corridor Draft Environmental Impact Statement.‖ 2009. 144 Ibid.
145 Wachs, M. 1993. ―Learning from Los Angeles: Transport, Urban Form, and Air Quality.‖ Kluwer Academic Publishers. 146 Ibid. 147 Orange County Transportation Authority. http://www.91expresslanes.com/. 148 State and Territorial Air Pollution Program Administrators and the Association of Local Air Pollution Control Officials. Letter to the U.S. Environmental Protection Agency. Docket No. OAR-2002-0030. December 15, 2003. 149 State and Territorial Air Pollution Program Administrators and the Association of Local Air Pollution Control Officials. Letter to the U.S. Environmental Protection Agency. Docket No. OAR-2002-0030. December 15, 2003. 150 Ibid.
151 Ibid. 152 Ribeiro, K.; Kobayashi, S.; Beuthe, M.; Gasca, J.; Greene, D; Lee, D.S.; Muromachi, Y.; Newton, P.J.; Piotkin, S.; Sperling, D.; Wit, R.; Zhou, P.J. ―Transport and its Infrastructure.‖ 2007. In ―Climate Change 2007: Mitigation.‖ Contribution of Working Group III to the Fourth Assessment Report of the Intergovernmental Panel on Climate Change [B. Metz, O.R. Davidson, P.R. Bosch, R. Dave, L.A. Meyer )eds)], Cambridge University Press, Cambridge, United Kingdom and New Yorlk, NY, USA. 153 Ibid.

110 | P a g e
154 U.S. House of Representatives, Committee on Transportation and Infrastructure, Subcommittee on Aviation staff. U.S. House of Representatives hearing on ―Aviation and the Environment: Emissions.‖ May 5, 2008. 155 Ibid. 156 U.S. House of Representatives, Committee on Transportation and Infrastructure, Subcommittee on Aviation staff. U.S. House of Representatives hearing on ―Aviation and the Environment: Emissions.‖ May 5, 2008. 157 Ibid. 158 Brueckner, J. ―Airport Congestion Management: Prices or Quantities?‖ Access. 35: Fall 2009; 10-15. 159 Ibid. 160 Brueckner, J. ―Airport Congestion Management: Prices or Quantities?‖ Access. 35:
Fall 2009; 10-15. 161 Ibid. 162 U.S. House of Representatives, Committee on Transportation and Infrastructure, Subcommittee on Aviation staff. U.S. House of Representatives hearing on ―Aviation and the Environment: Emissions.‖ May 5, 2008. 163 Maurice, L., U.S. Federal Aviation Administration. ―The Commercial Aviation Fuels Initiative.‖ Presentation to the Aviation Alternative Fuels Side Event, Bonn, Germany. June 3, 2009. http://www.icao.int/icao/en/atb/meetings/2009/Env_SideEvent_Bonn/5_CAAFI.pdf. 164 Demergjian, D. ―Boeing Says that Aviation Biofuels Just Three Years Away.‖ Wired. Nov 6, 2008. http://www.wired.com/autopia/2008/11/boeing-says-thr/. 165 Ibid.
166 Ibid. 167 Solarzyme. http://www.solazyme.com/market/fuels. Viewed on May 8, 2010. 168 Ibid. 169 U.S. Environmental Protection Agency. ―Advance Notice of Proposed Rulemaking on Lead Emission from Piston-Engine Aircraft Using Leaded Aviation Gasoline.‖ Federal Registry. Vol. 75, No 81, April 38, 2010. 170 Visser, Ben. ―Visser‘s Voice: ‗Knock, Knock: Who‘s there? Unleaded avgas.‘‖
General Aviation. August 29, 2003.

111 | P a g e
http://www.generalaviationnews.com/editorial/articledetail.lasso?-token.key=7813&-
token.src=column&-nothing.
171 At Last, A Low-Cost Aviation Gasoline That Gets the Lead Out.‖ University of North
Dakota, Energy & Environmental Research Center. July, 20, 1999.
www.sciencedaily.com/releases/1999/07/990720083151.htm
172 Fulton, S. ―Alternative Fuel: Your Next Engine Upgrade.‖ Aviator‘s Guide. 2005. http://www.aviatorsguide.com/planetalk/0906/index.htm. 173 Federal Aviation Administration, Office of Energy and Environment. ―Aviation and Emissions: A Primer.‖ January, 2005. http://www.faa.gov/regulations_policies/policy_guidance/envir_policy/media/aeprimer.pdf. 174 Federal Aviation Administration, Office of Energy and Environment. ―Aviation and Emissions: A Primer.‖ January, 2005. http://www.faa.gov/regulations_policies/policy_guidance/envir_policy/media/aeprimer.pdf. 175 United Airlines. ―Our Environment.‖ http://www.united.com/page/article/0,6867,53165,00.html?jumpLink=%2Fenvironment. Viewed on February 20, 2010. 176 California Air Resources Board. ―Ground Service Equipment.‖ http://www.arb.ca.gov/msprog/offroad/gse/gse.htm. Viewed on February 20, 2010. 177 California Air Resources Board. ―In-Use Off-Road Diesel Vehicle Regulation.‖ http://www.arb.ca.gov/msprog/ordiesel/ordiesel.htm. Viewed on February 20, 2010. 178 Lo s Angeles World Airports. ―Los Angeles World Airport Sustainability Plan.‖ 2008 179 Ibid. 180 Los Angeles World Airports. ―Los Angeles World Airport Sustainability Plan.‖ 2008. 181 Ibid. 182 Business Wire. Dec. 9, 2008.
http://www.businesswire.com/portal/site/home/permalink/?ndmViewId=news_view&news
Id=20081209005491&newsLang=en.
183 Shangri-LA Construction. Website of Hanger 25. http://3030nclybournavenue.com/ 184 Ibid. 185 Los Angeles World Airports. ―Los Angeles World Airport Sustainability Plan.‖ 2008.

112 | P a g e
186 State and Territorial Air Pollution Program Administrators and the Association of Local Air Pollution Control Officials. Letter to the U.S. Environmental Protection Agency. Docket No. OAR-2002-0030. December 15, 2003. 187 Ibid. 188 Natural Resources Defense Council. ―Flying Off Course: Environmental Impacts of America's Airports.‖ October, 1996. http://www.rcaanews.org/nrdc_FOC.pdf. 189 Johnson, Roger, ―LAX Emissions by Source Category.‖ Presentation by the Deputy Executive Director of the Los Angeles World Airports. Feb.13, 2008. 190 Holzman, D. ―Plane Pollution.‖ Environmental Health Perspectives. Volume 105, Number 12, December 1997. http://ehp.niehs.nih.gov/qa/105-12focus/focus.html. 191 U.S. Department of Transportation, Research and Innovative Technology Administration. ―Airport Ground Access Planning Guide.‖ Lead author: Lee, Chimini. 1995. http://ntl.bts.gov/DOCS/AGAPP.html. 192 Orange County Transportation Authority. http://www.91expresslanes.com/. 193 Los Angeles World Airports. LAX Airport General Description. http://www.lawa.org/welcome_lax.aspx?id=40. 194 Hastings, Norene. Communication with Environmental Specialists at the Los Angeles World Airports. Nov. 9, 2009. 195 Port of Los Angeles and Port of Long Beach. http://www.cleanairactionplan.org/about_caap/clean_trucks.asp. 196 U.S. Environmental Protection Agency Electronic Report on the Environment. Updated in December 2009 using the 2005 National Emissions Inventory. http://cfpub.epa.gov/eroe. 197 Advisory Committee on Childhood Lead Poisoning Prevention (ACCLPP) (2007) Interpreting and managing blood lead levels <10 ug/dL in children and reducing childhood exposures to lead: Recommendations of CDC's Advisory Committee on Childhood Lead Poisoning Prevention. Morbidity and Mortality Weekly Report. 56(RR-8). November 2, 2007. 198 U.S. Environmental Protection Agency. ―Advance Notice of Proposed Rulemaking on Lead Emission from Piston-Engine Aircraft Using Leaded Aviation Gasoline.‖ Federal Registry. Vol. 75, No 81, April 38, 2010. 199 Natural Resources Defense Council. ―Flying Off Course: Environmental Impacts of America's Airports.‖ October, 1996. http://www.rcaanews.org/nrdc_FOC.pdf. 200 Los Angeles World Airports. ―Los Angeles World Airport Sustainability Plan.‖ 2008.

113 | P a g e
201 California Air Resources Board. ―In-Use Off-Road Diesel Vehicle Regulation.‖ http://www.arb.ca.gov/msprog/ordiesel/ordiesel.htm. Viewed on February 20, 2010. 202 Broines, C. and Myers, Holly. ―Shortchanged: How Airlines Can Repay Taxpayers for Billions in Subsides by Improving Jobs, Security, and Services.‖ Los Angeles Alliance for a New Economy, July, 2008, pg iii. 203 Trottman, M. and Carey S., ―Unfriendly Skies: As Pay Falls, Airlines Struggle to Fill Jobs,‖ Wall Street Journal, May 16, 2007, p. A1.
204 Ibid. 205 Broines, C. and Myers, Holly. ―Shortchanged: How Airlines Can Repay Taxpayers for Billions in Subsides by Improving Jobs, Security, and Services.‖ Los Angeles Alliance for a New Economy, July, 2008. 206 LAX Community Benefits Agreement. 2005. http://www.ourlax.org/cb_CBA_Exhibits.cfm. 207 Natural Resources Defense Council. ―Flying Off Course: Environmental Impacts of America's Airports.‖ October, 1996. http://www.rcaanews.org/nrdc_FOC.pdf. 208 Ibid. 209 Ibid. 210 Kaltenbach M, Maschke C, Klinke R. ―Health consequences of aircraft noise.‖ Dtsch Arbetl Int. 2008; 105(31-32): 548-556. http://www.ncbi.nlm.nih.gov/pmc/articles/PMC2696954/. 211 Rosenlund M, Berglund N, Pershagen G, Järup L, Bluhm G. ―Increased prevalence of hypertension in a population exposed to aircraft noise.‖ Occup. Environ Med. 2001; 58: 769–773. 212 Eriksson C, Rosenlund M, Pershagen G, Hilding A, Ostenson C-G, Bluhm G. ―Aircraft noise and incidence of hypertension.‖ Epidemiology. 2007; 18: 716–77. 213 Jarup L, Babisch W, Houthuijs D, et al. ―Hypertension and exposure to noise near airports - the HYENA study.‖ Environmental Health Perspectives. 2008; 116: 329–333. 214 Kaltenbach M, Maschke C, Klinke R. ―Health consequences of aircraft noise.‖ Dtsch Arbetl Int. 2008; 105(31-32): 548-556.
http://www.ncbi.nlm.nih.gov/pmc/articles/PMC2696954/. 215 Moore, T. ―Study: Airport Noise Increases Risk of Strokes.‖ Time, Dec. 15, 2009. http://www.time.com/time/specials/packages/article/0,28804,1929071_1929070_1947782,00.html#ixzz0ZsznAk62.

114 | P a g e
216 Ibid.
217 Ibid. 218 Natural Resources Defense Council. ―Flying Off Course: Environmental Impacts of America's Airports.‖ October, 1996. http://www.rcaanews.org/nrdc_FOC.pdf. 219 Ibid. 220 Ibid. 221 Paragraph taken from: Natural Resources Defense Council. ―Flying Off Course: Environmental Impacts of America's Airports.‖ October, 1996. http://www.rcaanews.org/nrdc_FOC.pdf. 222 Ibid. 223 Ibid. 224 Ibid. 225 Johnson, R. March 4, 2009. ―Los Angeles World Airports‘ Sustainability and Environmental Initiatives.‖ PowerPoint presentation.‖ 226 Los Angeles World Airports. 2008. ―Environmental Overview.‖