the physical dimension of - opus 4 · the physical dimension of international trade part 2:...
TRANSCRIPT

Monika Dittrich, Stefan Bringezu, Helmut Schütz
The physical dimension of international trade Part 2: Indirect global resource flows between 1962 and 2005
Originally published as:
Monika Dittrich, Stefan Bringezu, Helmut Schütz (2012): The physical dimension of international trade. Part 2: Indirect global resource flows between 1962 and 2005 In: Ecological economics, 79, 1, 32-43 DOI: 10.1016/j.ecolecon.2012.04.014
Monika Dittricha,*, Stefan Bringezub, Helmut Schützb
The physical dimension of international trade Part 2: Indirect global resource flows between 1962 and 2005
a Independent scientist, Heidelberg, Germany
b Wuppertal Institute for Climate, Environment and Energy, Research Group Material Flows and Resource Management, Wuppertal Institute, P.B. 100480, 42004 Wuppertal, Germany
* Corresponding author. Tel. +49 6221 71 99 725; e-mail: [email protected]
1
The Physical Dimension of International Trade, Part 2: Indirect Global Resource Flows between 1962 and 2005
Keywords: Global Trade, Material Flow Analysis (MFA), Indirect Flows, Burden Shifting
Abstract
Global trade is increasingly being challenged by observations of growing burden shifting, in particular of environmental problems. This paper presents the first worldwide calculations of shifted burden based on material flow indicators, in particular direct and indirect physical trade balances. This study covers the period between 1962 and 2005 and includes between 82 and 173 countries per year. The results show that indirect trade flow volumes have increased since 1962 to around 41 billion tonnes in 2005.The increase in the ecological rucksacks of traded goods was higher than the growth of the traded goods themselves. The traded resources with the highest share of associated indirect flows are iron, hard coal, copper, tin and increasingly palm oil. With regard to regions, Europe is the biggest shifter whereas Australia and Latin America are the largest takers of environmental burden. Australia is identified as the country which has taken the highest environmental burden since 1962 and Japan as the country which has shifted the most to other regions. To evaluate the findings from a global perspective, the results are analyzed in terms of resource flow induced environmental pressure related to a country's land area in terms of total and per capita area.
1. Introduction
Global trade, although largely acknowledged with regard to its economic returns, is increasingly being challenged by observations of growing burden shifting, in particular of environmental problems. At the heart of the matter is the growing distance between consumption and production, which results in some countries being able to enjoy the consumption of imported goods, while the exporting countries carry the environmental burden caused by the production of those goods. Shifted environmental burden could be understood as part of the so-‐called externalities, which are not, or are only insufficiently, included in the price. Thus, for assessing trade in the sustainability context, information about burden shifting is crucial. To mention just two relevant aspects: first, if national environmental monitoring excludes environmental burden shifting through trade, national environmental indicators could give misleading information for governance; it could result in a “rich country illusion effect” (Andersson and Lindroth, 2001). Second, if some countries or country groups are continuously or even increasingly carrying more burden than others, international disparities tend to grow, a circumstance which contradicts the principle of international equity.
Nowadays, when measuring shifts of environmental burden between countries, the focus has often been on emissions, in particular greenhouse gas emissions caused by the production of the traded goods (e.g. Destatis, 2007; Machado et al., 2001; Muradian et al., 2002; Pan et al., 2008; Peters and
2
Hertwich, 2006 and 2008; Wiedmann et al., 2007). Another, complementary focus, which we will apply here, is on the input side of the physical economy, in particular considering the primary material resource requirements on a cradle-‐to-‐product basis for internationally traded goods. Indirect flows show how much encroachment on the natural environment is caused by the production of traded goods. Other approaches considering resource use more comprehensively put emphasis on the land area. One example is the calculation of deficits and surpluses of (partially virtual) land use based on ecological footprint accountings (Wackernagel and Rees 2005, WWF, different years). Another example is global land-‐use accounting (GLUA), combining resource flows and associated land use of national economies (Bringezu et al., 2009a and b).
Until now, few studies have focused on or included indirect material flows caused by trade on a national or regional level. One of the first studies to do so showed that Europe has increasingly shifted the burden of resource extraction and refining to poorer countries (Schütz et al., 2004). For developing countries, a pioneer study indicated the growing environmental burden taken by Chile (Giljum, 2004). More recently, a regional study for five Latin American countries plus the United States for the year 2003 was carried out (Muñoz et al., 2009) and a global study about physical trade covering 9 years for 80 to 160 countries was undertaken (Dittrich, 2010); central aspects of this study will be included below, based on an improved and updated data set. Other studies focusing on material flows at the country-‐level that include indirect trade flows or estimations of them are Estrada (2007), Schütz and Bringezu (2008), and Weisz (2007). The lack of empirical studies which include indirect flows is mainly caused by problems of data availability and methodological questions. The OECD ( 2008a: 96) pointed out that „indicators covering indirect flows associated with imports and export require further development in terms of data availability and quality and from a methodological point of view”.
In this article, we present indirect trade flows on a global level between 1962 and 2005 using the method of calculating indirect resource flows with "cradle-‐to-‐product" coefficients. The central aim is to provide information on the empirical findings based on this state-‐of-‐the-‐art methodology and current data availability. In addition, with regard to the highly normative discourse within this field, we would like to present a way to appraise the findings from a global perspective.
2. The concept of indirect resource flows associated with trade
During the 1990s, the concept of the so-‐called ecological rucksack was originally developed to quantify the magnitude of resources directly or indirectly used during the life-‐cycle of a product or a service without entering the product itself. The basic idea is rather simple: the heavier the ecological rucksack, the more the natural environment is stressed during the life-‐cycle of the product or service (e.g. Schmidt-‐Bleek, 2004). One critical precondition for interpreting mass flows per time unit as environmental pressure is the accounting of primary resource extraction, in other words flows crossing the system boundary between the socio-‐industrial and the environmental systems (Bringezu, 1992). At the same time, national material flow analysis (MFA) started to surge. Economy-‐wide material flow analysis provided a framework to describe and monitor the socio-‐industrial

3
metabolism of national or regional economies in a comprehensive manner consistent with economic accounts (OECD, 2008a and b; Bringezu et al., 2003, 2009b). The development of MFA was rooted in various scientific disciplines (Fischer-‐Kowalski 1998).
Physical trade balances are an integrated part of economy-‐wide MFA. The trade flows are conceptually distinguished as direct or indirect flows. Direct trade flows are the imported or exported raw materials, semi-‐manufactured and final goods measured in their physical form—usually weight in kilograms or tonnes (which translates into a flow when considered as mass moved per unit of time, which is usually one year according to trade statistics). Indirect resource flows associated with imports are the upstream material input flows extracted or harvested from the natural environment abroad and required (on a life-‐cycle-‐wide basis) to produce the imported good. They include both used extractions (so-‐called raw material equivalents) and unused extractions (Bringezu et al., 2003: 46). Indirect flows associated with exports include analogously the upstream (life-‐cycle-‐wide) material input flows required to produce the exported goods.
While direct trade flows and especially the trade balances of direct flows give an impression towards the extent that an economy depends on foreign resources or provides resources for other world regions, indirect trade flows allow the upstream aspects to be considered: to what extent does a country provide directly or indirectly additional resources for exports or to what extent does a country resort to additional resource use from the rest of the world? If a country’s exports and their indirect flows are higher than the country’s imports and their indirect flows, the difference equals a net resource extraction due to foreign trade in that country, which can be interpreted as a net shifting of environmental burden to that country. If, in the contrasting case, imports including their indirect flows exceed exports including indirect flows, other countries must carry the (net) burden. Thus, the trade balance of the direct plus indirect flows could be interpreted as the extent that a country is shifting environmental burden to other countries or taking it (Bringezu, 2000).
Indirect resource flows do not portray a specific environmental impact like e.g. CO2-‐emissions "embodied" in goods; instead mass turnover based indicators are designed to indicate a general system’s-‐based potential pressure on the natural environment, provided they measure the flow between nature and the socio-‐economic system (e.g. primary resource extraction). They are complementary to impact specific indicators and can be understood as ‘early warning indicators’ (OECD, 2008a and b; Bringezu et al., 2003).
In the rest of this paper we will also use the term ‘ecological rucksack’ instead of just indirect (resource) flows; this we do to improve legibility and because we like the metaphor of ecological rucksacks.
3. Method and data sources
4
In general, the indirect flows of traded products can be calculated in different ways, e.g. based on "cradle-‐to-‐product" coefficients for various commodities (e.g. Schütz et al., 2004; Dittrich, 2010), based on input-‐output calculations for product groups (e.g. Giljum, 2004, Muñoz et al., 2009) or based on a combination of both (OECD 2008a). In this study, indirect resource flows are calculated using the first approach: the physical quantity of each product is multiplied with the coefficient of ecological rucksacks which are caused on average by the production of that commodity.
Input-‐output (IO) based studies usually differentiate between different economic sectors along the monetary input-‐output tables, but mostly lack differentiation on a disaggregated resource level. This is particularly relevant with regards to the metal and agricultural sector, where the indirect flows associated with extraction are rather diverse; e.g. indirect flows associated with the extraction of different metals may vary by up to a factor of more than thousand. The coefficient or life-‐cycle-‐assessment (LCA) method has the advantage of considering and covering these highly differentiated differences. When differentiated information of traded materials and products as well as differentiated coefficients are available, the method is furthermore a pragmatic way to estimate indirect flows of traded products of countries where input-‐output calculations are not available. But the method is limited when regional distinctions are high, in particular for the differences of indirect flows caused by deep mining versus open pit mining, it is further restricted by low data availability for finished products. Over the medium-‐term it seems to be advisable to combine both methodologies in a systematic way on the global level. In this way the advantages of both approaches – for instance using the coefficient approach for raw materials and semi manufactures and addressing indirect flows of more finished products and services through IO – could be capitalized on. In the long-‐term, a global data base comprising used and unused domestic extraction of all countries with an interlinked trade and IO model might provide a much more comprehensive and consistent picture. However, the data availability for building a sufficiently complete global model might remain limited for the near future. Thus, we consider this study as both necessary and important, but not a concluding step for improving global data about indirect physical trade flows.
We calculated the physical quantity of all traded commodities as explained in Part I (Dittrich and Bringezu, 2010) or Dittrich (2010). Using data from the UN Comtrade database, the missing physical values of trade flows where calculated with the average price per kilogram for each commodity group and each year, starting with the most differentiated level. This was done for nine years between 1962 and 2005, for all products groups and for all countries which reported to UN Comtrade. Completeness, quality and level of disaggregation of course still depend on the data that countries reported to UN-‐Comtrade. We corrected values of direct trade flows of outliers by adjusting the concerned values with regard to global prices, amount of global imports and exports and – as far as available – bilateral trade data1.
1 With regard to ecological rucksacks, the most relevant and corrected outliers are: South Korea’s exports of distilled alcoholic beverages (S1-1124) in 1985, Kazakhstan’s imports of gold (S3-97101) in 1995, diverse trade values of Mexico in 2000 (in particular vegetables, fruits and semi-manufactured products), trade with uranium and thorium (S3-286) in 1980 and 1990 as well as trade with precious metals (S3-89731) in 2000. In UNComtrade, re-imports and re-exports are included in import and export data, respectively; they are not considered separately in this study.

5
The data for (used) imports are multiplied with coefficients to derive estimates for associated indirect flows. These coefficients account for up-‐stream flows of both used and unused resource extraction. They represent the process chain from delivery of the imports backwards to primary production (used extraction) and the associated unused extraction of primary resources, comprising (a) abiotic resources (such as unused extraction of mining), (b) biotic resources (such as cuttings left in the forest), and (c) soil erosion from agricultural land (which is linked to the crop harvest). This allows differentiation of the Total Material Requirement associated with imported commodities by the above-‐mentioned three major types of material flows linked to resource extraction and harvest. The coefficients applied have been continuously updated and supplemented over several years, especially with coefficients (material intensity factors) from the life-‐cycle orientated MIPS-‐online database (http://www.wupperinst.org/uploads/tx_wibeitrag/MIT_v2.pdf, Ritthoff et al., 2002, and personal communications) and the database of the Research Group Material Flows and Resource Management (managed by Helmut Schütz) at the Wuppertal Institute. Updates of coefficients are made whenever new product or technology related studies become available, like e.g. for different types of passenger cars according to van de Sand et al. (2007).
To calculate the indirect resource flows of trade we used basically the coefficients which were used to account for TMR and TMC of Germany (Schütz and Bringezu, 2008) and included all available updates until June 2010. This is reasonable because they are the most differentiated coefficients available and furthermore, because Germany is one of the biggest trading nations, even measured in physical units. As measured by the amount of global indirect flows, we checked the most relevant coefficients (especially tin and hard coal); whereas the coefficient of tin remained the same (Germany is trading tin with almost all tin-‐exporting and processing countries), in the case of hard coal we re-‐calculated the coefficient based on the share of global direct trade of the exporting countries and the average indirect flows caused by the extraction of hard coal within those countries. Changes over time are included as far as they are known for all coefficients.
The utilized coefficients for the indirect flows cover around 80 % of all commodity groups of the trade statistics and 99.5 % of traded mass. For the highly resource intensive products like agricultural products, metals or semi-‐manufactured products, differentiated coefficients are available. But for other product groups, especially for final products, the data represent rather minimum estimates of average coefficients, e. g. for industrial machines or transportation equipment. In trade statistics based on SITC-‐classification even the most differentiated groups (basic headings) of manufactured goods often cover a variety of different machines. For example, there is only one group for all passenger cars (SITC 3 -‐ 7812). As far as it is known, coefficients of passenger cars vary between around 17 (tonnes ecological rucksacks per tonne car) for a Seat Ibiza and around 41 for a Mercedes S-‐Class (van de Sand et al. 2007). Thus, the coefficient for the group of traded passenger cars is an average of all known coefficients of passenger car types, weighted by the share of produced numbers of the respective car types. The remaining product groups without coefficients are mainly composed of non-‐specified materials (antiques, not classified transactions, etc.) or complex apparatuses like scientific equipment (e.g. measurement or medical devices). We excluded the indirect flows

6
associated with diamonds; a large part of the original data about the diamond trade is highly disputable, resulting in a questionable estimation of global direct flows of diamonds. Because diamonds have the highest resource coefficient each incorrectly reported carat of direct trade flow would bias the results significantly.
In sum, data for several million direct trade flows, combined with around 2400 different coefficients (1667 abiotic, 271 biotic, 459 erosion) are included in the calculations presented below. It is important to note that the results presented below are based on the best available data and current knowledge. As OECD (2008a and b) pointed out, further research in coefficients and efficient methods to calculate indirect flows is needed.
4. Volume of the indirect resource flows of the traded goods
Direct trade flows increased during the past 50 years and indirect resource flows grew at an even higher rate (figure 1). The indirect flows of traded goods increased from 8.6 billion tonnes in 1970 to around 41 billion tonnes in 20052. On average, each country shifted and / or overtook around 241 million tonnes in 2005. Due to the fact that around 25 countries dominate trade, it is important to note that the median of shifted and / or taken ecological rucksacks is much lower, around 35 million tonnes in 2005. The increase in the ecological rucksacks of traded goods was higher than the growth of the traded goods themselves: Whereas direct flows grew 3.5-‐fold between 1970 and 2005, the ecological rucksacks multiplied by a factor of nearly 4.8. On average, one kilogram of traded product carried an ecological rucksack of 4.3 kilograms in 2005.
2 Against the tradition in monetary trade statistics to calculate the trade volume imports plus exports, we calculated the volume of ecological rucksacks as the sum of the rucksacks of imports and the rucksacks of exports divided by two. The reason is simple: As the rucksacks of the imports of one land correspond to the rucksacks of the exports of other lands into the first one, it is more straightforward to only count the rucksacks once. Nevertheless, it is important to note that the ecological rucksack of a good which is passing more than one border in one or different process stages is counted more than one time within the volume.

7
0
10.000
20.000
30.000
40.000
50.000
60.000
1962 82
1970 112
1975 132
1980 130
1985 110
1990 111
1995 125
2000 161
2005 173
0
50
100
150
200
250
300
sum direct flows ((im+ex)/2), left scale sum ecological rucksacks ((er-im + er-ex)/2), left scaleaverage direct flows per country, right scale average ecological rucksacks per country, right scale
[million tonnes] [million tonnes]
Number of countries
Sources: own calculation based on various sources, see section 3.
Figure 1: Global direct trade flows, ecological rucksacks and averages per country, 1962 – 2005
In all investigated years the abiotic rucksack was the dominant factor of all traded goods; it always amounted to around 80 % (figure 2). In 2005, the abiotic rucksack of all traded goods accounted for 33 billion tonnes (80.2 %), the erosion rucksack for 4.7 billion tonnes (11.5 %) and the biotic rucksack for the remaining 3.4 billion tonnes (8.3 %).

8
Sources: own calculation based on various sources, see section 3.
Figure 2: Composition of ecological rucksacks of all traded goods, 1962 -‐ 2005
The ecological rucksacks of the traded metals in the form of ores, semi-‐manufactured or manufactured goods (including vehicles, generators, etc.) has accounted for around 50 % of the rucksacks of all traded goods since 1962 (figure 3); it is important to note that indirect flows of a certain material category may comprise also different primary resources. In 2005 these reached almost 20 billion tonnes or 47 % of the ecological rucksacks of all traded goods. The second largest contributor was formed by the indirect flows associated with traded biomass (including food, beverages, paper, etc.). In 2005 the ecological rucksacks of traded biomass accounted for 10.2 billion tonnes, or 20 % of all rucksacks, in which erosion was the dominant factor with nearly 4.5 billion tonnes. Although fossil fuels formed the biggest part of the direct trade flows (around 50 % in all years, dominated by petroleum) their ecological rucksacks accounted for only 8 – 20 % of all ecological rucksacks. In 2005 the ‘fossil-‐rucksacks’ reached 6.8 billion tonnes, or nearly 17 %, mainly caused by traded hard coal.

9
Sources: own calculation based on various sources, see section 3.
Figure 3: Direct and indirect flows by material categories of traded goods, 1962 – 2005
The resources with the highest shares of associated indirect flows are iron (as ores, concentrates and steel), hard coal, copper and tin (figure 4). Traded iron was always associated with the largest indirect flows during the investigated period; but the absolute amount of direct traded iron increased below-‐average from 392 to 1062 million tonnes, associated with 765 to 4933 million tonnes rucksacks between 1970 and 2005. Thus, its share in both direct and indirect flows has declined since 1970, from around 15 % to 12 % in 2005. In contrast, trade with hard coal increased above-‐average, by a factor of 6.1; in 2005, the indirect flows associated with traded hard coal nearly equalled the ecological rucksacks of traded iron (4,853 million tonnes). Also trade with copper (as ore or concentrate as well as in processed forms3) increased above-‐average, by a factor of 6, during this period. In 2005, copper trade accounted for only 0.5 % of direct trade but for 10.0 % of all indirect trade flows. In addition to the mentioned resources, trade with products mainly from biomass and products mainly from metal materials were the two groups associated with major ecological rucksacks. Within the group of products mainly from biomass, trade with vegetable fats and oils, in particular palm oil, was most responsible for the high amount of indirect flows4. Direct trade with palm oil (including all different process stages) increased by a factor of 30 between 1970 and 2005, resulting in nearly 24 million tonnes of direct flows and around 1,344 billion tonnes ecological rucksacks in 2005. Most notably, the above average increase of trade with those goods associated with high ecological rucksacks (copper, hard coal, oil bearing fruits and vegetable oils, and 3 Please note: Shares of recycled metals are considered in the coefficients of ecological rucksacks in line with the MIPS concept (e.g. Ritthoff et al. 2002). 4 It is estimated that erosion contributes to about half of the indirect flows of palmoil; although erosion can be significant, in particular in the growth phase of plantations, the available data used are not specific for palm plantations but represent country specific averages for all types of cropping systems, so that this data is associated with some uncertainty.

10
furthermore but to a lesser share, fruits including juices, silver and platinum, bauxite and aluminium) were responsible for the higher increase of the indirect flows compared to the lesser increase of the direct flows.
Sources: own calculation based on various sources, see section 3.
Figure 4: Direct and indirect trade flows of major resources, 1962 -‐ 2005
The framework of the UN (UN, Department of Economic and Social Affairs1998) assigns all traded products of the statistical groups ‘food and live animals’, ‘beverages and tobacco’, ‘crude materials’, ‘mineral fuels’ and ‘vegetable and animal fats’ to raw materials. ‘Chemicals’, ‘manufactured goods classified chiefly by material’, ‘machinery and transport equipment’, ‘Miscellaneous manufactured articles’ and ‘non classified commodities and transactions’ are classified as manufactured goods. Following this arrangement, it can be clearly observed that trade with raw materials was declining in favour of processed materials between 1970 and 2000 and has stabilized around 80 % (figure 5). In contrast, the associated indirect trade flows are more or less fluctuating around 50 %; that means trade with raw materials and manufactured materials are more or less equally responsible for the indirect flows. Partly, the fluctuations within the figure reflect the fluctuating assignments of especially semi-‐processed metals (including precious metals) as ‘crude materials’ or ‘manufactured articles’. Assessing these results one has to consider that the ecological rucksack of manufactured goods is rather underestimated compared to raw materials. Further investigation is needed to appraise the mentioned constraints; for the present, the result seems to reflect the more or less equally rising amount of ecological rucksacks caused by increasing trade with both manufactured products and raw materials.

11
Sources: own calculation based on various sources, see section 3.
Figure 5: Share of raw and manufactured materials, 1962 -‐ 2005
The share of indirect flows associated with traded goods to and from Asia increased between 1970 and 2005; they accounted for nearly 35 % of global indirect trade flows in 2005 (see figure 6). This reflects the growing volumes of Asia’s direct trade, and especially the expanding trade of China, Malaysia and Indonesia. Japan’s indirect trade flows constituted a constant relevant proportion of global indirect trade flows (5 % in 2005). The declining shares of Europe’s and North America’s trade rucksacks reflect the diminishing share of direct trade of these regions.
Sources: own calculation based on various sources, see section 3.

12
Figure 6: Regional proportion of volumes of ecological rucksacks, 1962 -‐ 2005
5. Trade balances of direct trade and their ecological rucksacks
Focusing on the balances of the indirect flows associated with trade, there is an apparent difference between regions with higher direct and indirect trade flows of imports than exports and vice versa (i.e. net importers compared to net exporters). As explained above, this can be interpreted as some regions shifting their environmental burden abroad while others are overloaded with a heavier environmental burden. It is important to note that the term “shifting” does not make any kind of implication as to whether a country is consciously or intentionally shifting their environmental burden or not. The shifting regions have a positive physical trade balance: direct and indirect flows associated with imports are higher than those associated with exports. In contrast, burdened regions have a negative physical trade balance (direct plus indirect flows). During all the years examined, Europe had the highest positive trade balance of direct and indirect physical trade flows (see figure 7); it is shifting the most and increasingly more environmental burden to other countries. In 2005, Europe’s direct and indirect imports exceeded its direct and indirect exports by almost 5.8 billion tonnes. Thus, our result clearly confirms existing studies which already point out the increasing burden shifting of the EU or European Countries (in particular Schütz et al., 2004). Equally, but with a lower share, Asia’s direct and indirect imports surpass their exports. The Middle East is the only region whose direct exports are higher than its imports, but whose indirect trade balance is positive. This can be explained by the fact that the ecological rucksacks of their imports (mainly composed of biomass and metals) are higher than the ones of their exports (mainly petroleum and non-‐metallic minerals).
On the other side, South America, Australia and (in most of the years, depending whether South Africa reported its trade or not) Africa exhibit an increasingly negative trade balance of direct and indirect flows; direct exports as well as the ecological rucksacks of their exports outweigh direct imports and their ecological rucksacks. This can be interpreted as these regions taking on environmental burden.
North America (Canada and the US) changed its position: between 1970 and 1995 it took environmental burden, since 2000 it is shifting it. This is mainly caused by the rising imports of the US combined with stagnating and partly declining direct and indirect exports of both Canada and the US.

13
Sources: own calculation based on various sources, see section 3.
Figure 7: Regional trade balances of direct and indirect trade flows, 1962 -‐ 20055
Physical trade balances, with and without indirect flows, have often been analyzed to prove that developing countries are taking environmental burdens from the north or that richer countries burden increasingly poorer countries (for example Eisenmenger and Giljum, 2007; Gillium, 2003; Giljum et al. 2008; Pérez-‐Rincon, 2006; Schütz et al., 2004; an analysis of discourse and arguments is given by Dittrich, 2010). But the studies so far remained regional or national studies or – as in the case of Giljum et al. 2008 – four world regions are covered but only in an one year comparison. Here we analyze -‐ for the first time -‐ direct and indirect flows worldwide, including around 200 countries over a period of 42 years, to verify whether the existing studies have shown the correct picture. On the whole, we can corroborate the findings (figure 8): as already demonstrated for the year 2000 (Giljum et al. 2008), we show now that physical trade balances (direct and indirect flows) of developed countries as a group were positive and the respective trade balances of developing countries were negative during all the investigated years. Between 1970 and 2005 even a growing tendency towards increased imbalances, especially between developing and developed countries, can be observed. The imbalances remain even if traded petroleum is excluded: in 2005 e.g., developed countries still had a positive physical (direct and indirect) trade balance of 5.7 billion tonnes while the physical trade balance of developing countries was around minus 4 billion tonnes when petroleum is excluded. The results for the group of ‘transition countries’ are uncertain until 5 Theoretically, the trade balances should sum to zero. The main reason why the result is different is the missing number of countries, especially Australia in 1962, African, Asian and East Europe countries during all the years.

14
1990 due to the fact that only a few countries reported their trade to UN Comtrade. After the fall of the Iron Curtain, more countries from Central Asia and almost all Eastern European countries were included.
To estimate the volume which was shifted directly and indirectly between 1962 and 2005 between country groups, we extrapolated the values for the missing years and countries. This results in an amount of around 185 billion tonnes (75 direct plus 110 indirect) shifted by developed countries burdening developing and transition countries. Nevertheless, it is important to note the differences between the countries within these groups.
-6.000
-4.000
-2.000
0
2.000
4.000
6.000
8.000
1962 1970 1975 1980 1985 1990 1995 2000 2005
Developed countriesDeveloping countriesTransformation countries
[million tonnes]
Sources: own calculation based on various sources, see section 3.
Figure 8: Trade balances of direct and indirect trade flows by developing category of countries, 1962 -‐ 2005
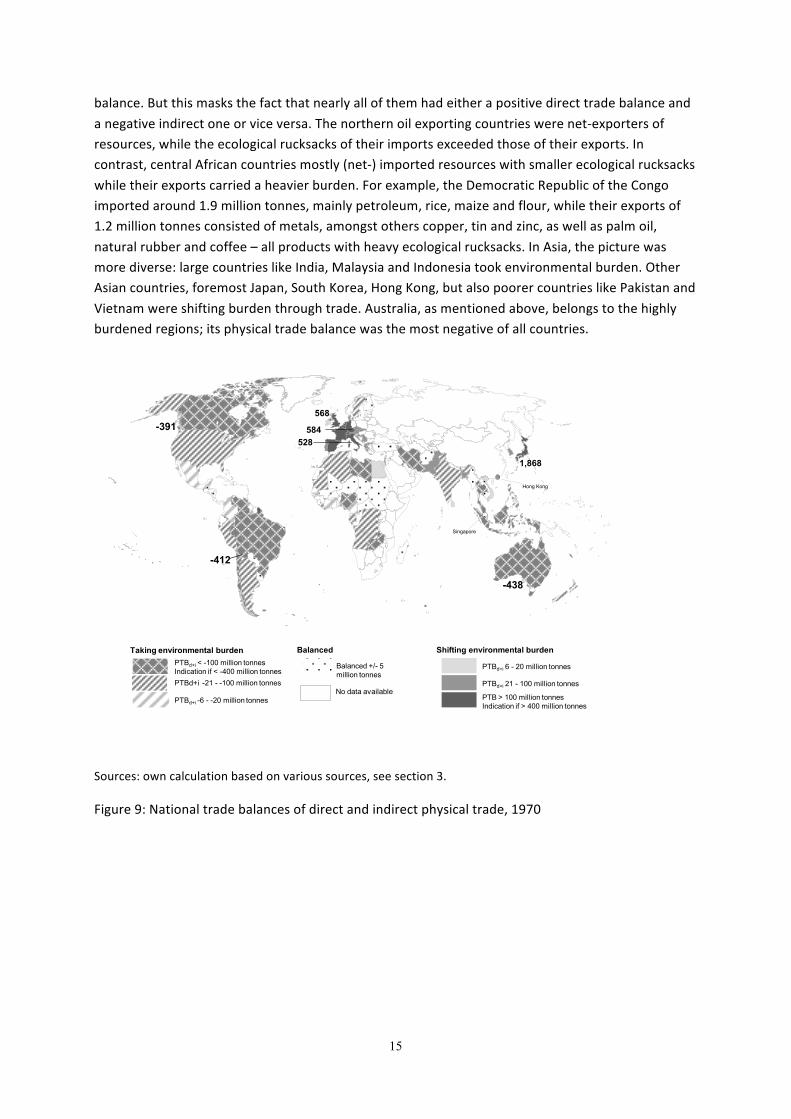
In 1970, the majority of the North and South American countries took environmental burden on their territory. Many of them had to bear an amount of more than 100 million tonnes. Bolivia, for example, was burdened with flows of around 412 million tonnes (figure 9). Even the United States had a negative direct and indirect physical trade balance, although they were net-‐importing resources directly (Dittrich and Bringezu 2010: 1844). The physical trade balances of smaller countries with a minor trade volume, especially in Central America and South America, were balanced in 1970. In Europe, only the Scandinavian states had either a balanced physical trade or were taking environmental burden on their territory. The majority of the European countries, in particular the United Kingdom, Germany, France and Italy were shifting environmental burden on a large scale. In contrast, most of the African countries had a negative or balanced physical trade
15
balance. But this masks the fact that nearly all of them had either a positive direct trade balance and a negative indirect one or vice versa. The northern oil exporting countries were net-‐exporters of resources, while the ecological rucksacks of their imports exceeded those of their exports. In contrast, central African countries mostly (net-‐) imported resources with smaller ecological rucksacks while their exports carried a heavier burden. For example, the Democratic Republic of the Congo imported around 1.9 million tonnes, mainly petroleum, rice, maize and flour, while their exports of 1.2 million tonnes consisted of metals, amongst others copper, tin and zinc, as well as palm oil, natural rubber and coffee – all products with heavy ecological rucksacks. In Asia, the picture was more diverse: large countries like India, Malaysia and Indonesia took environmental burden. Other Asian countries, foremost Japan, South Korea, Hong Kong, but also poorer countries like Pakistan and Vietnam were shifting burden through trade. Australia, as mentioned above, belongs to the highly burdened regions; its physical trade balance was the most negative of all countries.
-438
-391
PTBd+i < -100 million tonnes Indication if < -400 million tonnesPTBd+i -21 - -100 million tonnes
PTBd+i -6 - -20 million tonnes
Balanced +/- 5 million tonnes
PTB > 100 million tonnesIndication if > 400 million tonnes
PTBd+i 6 - 20 million tonnes
PTBd+i 21 - 100 million tonnes
BalancedTaking environmental burden Shifting environmental burden
-412
528
568
584
1,868
Hong Kong
Singapore
No data available
Sources: own calculation based on various sources, see section 3.
Figure 9: National trade balances of direct and indirect physical trade, 1970

16
-3,332
-1,078
-3,225
-1,634
-1,569
-1,135 942-701
-582
-442-436
New Caledonia
PTBd+i < -100 million tonnes Indication if < -400 million tonnesPTBd+i -21 - -100 million tonnes
PTBd+i -6 - -20 million tonnes
Balanced +/- 5 million tonnes
PTB > 100 million tonnesIndication if > 400 million tonnes
PTBd+i 6 - 20 million tonnes
PTBd+i 21 - 100 million tonnes
BalancedTaking burden Shifting Burden
478497
510595
837
856
1,073
1,417
1,327
1,408/2,301*
3,3672,635
No data available
Sources: own calculation based on various sources, see section 3.
Figure 10: National trade balances of direct and indirect physical trade, 2005; *China excluding water exports
Thirty-‐five years later, the most important change has been the growth of the imbalances, while the basic geographical pattern remains rather constant: South America, Canada, Australia and the East Asian Islands remain burdened regions, now on a much bigger scale. Australia is again the country with the most negative direct and indirect physical trade balance; it increased 7.6-‐fold between 1970 and 2005. Australia has an export structure which depends mainly on raw materials, amongst others its exports of coal, iron, copper, uranium, aluminium, gold, tin, wheat, bovine meat, wool and barley are responsible for this negative amount. Australia is followed by Indonesia, mainly caused by its exports of tin, coal, palm oil, nickel, cocoa and coffee. West, South and Southeast European Countries remain regions shifting environmental burden; some of them increased their trade balances only moderately, such as France, Germany and Italy (by around 50 %), while other countries increased their balances considerably, such as Spain (by a factor of 10). Norway and Sweden are still bearing environmental burden, as are some of the Eastern European Countries, in particular Poland, Ukraine and Belarus. In Africa and Asia the picture changed somewhat between 1970 and 2006: most of the east African countries are shifting environmental burden (some with a minor quantity of less than 5 million tonnes, thus they are categorised as balanced in figure 10). In Asia, Central Asian countries are now included in the picture, most of them, in particular Russia and Kazakhstan, are taking a large amount of the global shifted environmental burden. The most fundamental change can be observed with the emerging countries like India, China, Singapore, South Korea, Turkey and Mexico. Until 1980, most of them had a balanced or even negative physical trade balance. This changed, in 2005 they had highly positive trade balances; the absolute amount is comparable or even
17
exceeding the amounts of the European Countries’ trade balances. But still and by far, Japan is the country displacing the most environmental burden followed by the United States. China, Spain and South Korea are the third, fourth and fifth highest shifting countries. Not visible within the map, but clearly notable, islands such as the Bahamas or the Cayman Islands as well as city-‐states, specialized in tourism or international financial services, have been increasingly displacing burden as well.
In order to rank all countries according to net burden or relief of resource extraction since 1962 all direct and indirect trade balances in the observation period were summed up. Missing years were compensated for by interpolating the data. The results show that in absolute terms Australia carries the heaviest burden, followed by Canada, Indonesia and Malaysia (table 1). Japan, followed by Germany, the United States (which was taking environmental burden until 1980) and the United Kingdom displaced the burden of resource extraction to the highest degree during this period. The fact that the most burdened countries are developed and rich and three developing or emerging countries belong to the most discharging countries show that the general picture presented in figure 8 needs to be reflected by a more differentiated view.
Until now, explanations for the level of physical trade volume and the classification of different countries as net-‐exporters or net-‐importers have been missing. Based on current empirical knowledge, different factors seem to determine the various levels. Political stability and integration in world markets are important pre-‐conditions to reach a noteworthy physical trade volume. Physical trade balances of countries with a minor trade volume generally fluctuate more; some amplitude can be explained by singular events, e.g. an island imports cruise ships, or by changing circumstances, e.g. droughts and the resulting decline in the production of exports and consequently increasing imports of food. In countries with a noteworthy physical trade volume the general economic orientation of the country – whether its dominant exports are raw materials or manufactured goods – mainly determines whether the country is physically a net-‐exporter or net-‐importer of materials, and whether the country is burdened or relieved. In general, exporters of raw materials are burdened (negative physical trade balances). In contrast, exporters of manufactured goods are generally resource importers in physical terms and these countries are shifting environmental burden (positive physical trade balances). The main influencing factors for the level of net-‐imports or net-‐exports seems to be the country’s resource endowment in relation to its population size (characterized by area, natural capital per capita and population density, see table 1 for the denoted countries), as well as the amount and composition of domestic extractions and of national resource demand for production and consumption, often denominated as affluence (Giljum, 2003, Krausmann et al., 2008, Schütz et al., 2004). It is important to note, whether a country is environmentally burdened or relieved because of trade is more related to natural resource endowment and population density, rather than to economic affluence (Table 1). The ten most burdened and the ten most relieved countries do not differ regarding the mean level of GDP/cap and its variation over time. However, apart from some exceptions countries accepting burden have a higher natural endowment per capita and a lower population density, whereas countries shifting burden abroad have fewer domestic resources and a higher population density. The latter finding is in accordance with the non-‐linear inverse relationship of total domestic resource extraction per capita and population density (Bringezu et al., 2009b).

18
But until now, there has been no systematic analysis of the influence and interrelations of these factors with regard to the physical trade balance. It is important to note that only a medium correlation between direct and indirect trade flows exists (Dittrich, 2010). Generally speaking, the higher the direct net-‐exports or net-‐imports the higher the associated indirect flows are and vice versa. This is especially true for countries with a noteworthy and widespread trade-‐spectrum, which means imports and exports of a wide range of different raw-‐materials and manufactured goods. The narrower the trade-‐spectrum the weaker the correlation between direct and indirect trade flows is, which is most obvious for the oil-‐exporting countries.

19
Table 1: The ten countries most burdened with and relieved of resource extraction since 1962 until 2005
Burdened Countries
Estimated sum,
billion tons1
Area, sq km
(country comparison
to the world)5
Natural Capital / cap,
US$, 20004
Population density,
cap / sq km,
1960 and 2005³
GDP per Capita,
US$ppp/cap, 1974/75 and
2005²
Relieved countries
Estimated sum, billion tons1
Area, sq km
(country comparison
to the world)5
Natural Capital / cap, US$,
2004
Population density,
cap / sq km,
1960 and 2005³
GDP per Capita,
US$ppp/cap, 1974/75 and
2005²
Australia 68,2 7.741.220 (6)
24.167
1 -‐ 3 6.444 -‐ 33.993 Japan 114,8 337.915
(61)
1.513 259 -‐ 337 5.350 -‐ 30.736
Canada 45,3 9.984.670
(2)
34.771
2 -‐3 6.607 -‐ 33.370 Germany***
27,6 357.022
(62)
4.445 213 -‐ 231 5.632 -‐ 29.980
Indonesia 39,1 1.904.569
(16)
3.472
55 -‐ 115 418 -‐ 3.847 USA 25,0 9.826.675
(3)
14.752 21 -‐ 31 7.519 -‐ 41.890
Malaysia 25,5 329.847
(66)
9.103 29 -‐ 78 1.142 -‐ 10.887 United Kingdom
23,4 243.610
(79)
7.167 224 -‐ 248 5.908 -‐ 33.135
Brazil 24,0 8.514.877
(5)
6.752 10 -‐ 22 2.111 -‐ 8.254 South Korea 23,3 99.720
(108)
2.020 285 -‐ 478 1.403 -‐ 22.080
Russian Federation*
18,4 17.098.242 (1)
17.217 7 -‐ 8 n.s. -‐ 10.846 Spain 21,8 505.70
(51)
4.374 63 -‐ 85 4.884 -‐ 26.792
Chile 16,7 756.102
(38)
10.944 11 -‐ 22 1.343 -‐ 11.940 France 15,9 551.500
(42)
6.335 88 -‐ 111 6.248 -‐ 31.908

20
Saudi Arabia 12,6 2.149.690
(14)
n.s. 2 -‐ 11 8.586 -‐ 16.601 Netherlands 13,0 41.543
(134)
6.739 296 -‐ 393 7.026 -‐ 34.305
Argentina 11,8 2.780.400
(8)
10.312 8 -‐ 14 4.227 -‐ 14.286 China**** 11,7 9.596.961
(4)
2.223 75 -‐ 137 229 -‐ 6.760
South Africa**
11,1 1.219.090
(25)
3.400 16 -‐ 39 3.655 -‐ 11.187 Mexico 7,5 1.964.375 (15)
8.493 23 -‐ 54 2.458 -‐ 10.811
Average
(standard deviation)
9.988 (9.350) 7 (15) -‐
14 (39)
2.280 (2.599) –
19.930 (9.265)
4.465 (3.585)
51 (105) -‐
91 (129)
2.542 (2.306) -‐
16.612 (10.227)
Source: 1 Sources: own calculation based on various sources, see section 3; ²United Nations Statistics Devision [Sept. 2, 2010], 1974/75 is the first available year; ³United Nationss population Division [Sept. 2,2010]; 4World Bank, 2006; 5 CIA, 2010; * Russian Federation since 1995; **South Africa 1970-‐1985 and 1995-‐2005; *** West Germany before 1990; **** China since 1985 excluding water exports.
21
6. Towards an evaluation of ecological pressure of trade
From the perspective of single countries, a positive physical trade balance (direct and indirect) is generally advantageous in environmental terms because their inhabitants may consume goods without bearing the burdens of resource extraction: effects like landscape change (by mining), soil degradation (by farming), depleted or deteriorated rivers and groundwater, noise, pollution, etc.. Moreover, a negative physical trade balance is generally unfavourable for the country because their inhabitants typically consume fewer goods while their country is exposed to more environmental stress. Especially from the point of view of the burdened regions, the growing imbalances may be regarded as unjust or unfair, particularly because they are not exceptional cases but instead part of a continuous and partly intensifying trend. However, whether the people living in burdened countries indeed experience this additional stress depends – among other factors – on the level of overall extraction and population density. In sparsely populated countries like Australia and Canada, mining can devastate landscapes in remote areas without compromising the life quality of citizens (the resource flows remain literally "hidden").
To evaluate the ecological pressure of trade, one has to consider the physical endowment of the countries. For example, Venezuela and New Caledonia were burdened with nearly the same amount in 2005. But one may assume that the environmental impact on New Caledonia is higher than on Venezuela: the average intensity of the export related environmental pressure is certainly higher on a small island than in a larger country like Venezuela. Or taking a converse example, the positive trade balances of Barbados and Bulgaria in 2005 were nearly equal in absolute terms; both countries were shifting the same amount of environmental burden. However, measured in relation to the available territory (incl. all inventories of eco-‐systems, cities, etc.) the load relief on the environment in Barbados is certainly higher than in Bulgaria. For this reason, to assess the environmental impact of trade we analyzed the intensity of environmental burden, or load relief, by calculating the average physical trade balance (direct and indirect) per surface area of the countries examined. Of course, this indicator considers neither ecosystem differences between or within countries nor does it take into account any condition of those ecosystems. As we mentioned above, material flow indicators do not reveal a specific impact, but instead a potential environmental impact. Thus, the physical trade balance (direct and indirect) per area provides a first estimate of the international shift of potential average environmental pressure via trade.
The results for 2005 are shown in figure 11. Within the burdened regions we can identify four country groups. First, countries mainly in West Africa and Central America with a small trade volume and a minor negative trade balance. These countries are burdened with low intensity, most of them with 10 – 45 tonnes per square kilometre. Second, large countries with the highest amounts of absolute burden taking, mainly in South America, North and Eastern Europe, Central Asia as well as Australia, Canada and Saudi Arabia. They are taking an environmental pressure between 100 and 500 tonnes per km², most of them within the range of 100 and 300 tonnes per km². Third, medium large

22
countries, namely Chile, South Africa, Malaysia and Chile take pressures of around 1000 tonnes per km² through trade. The fourth group are islands and peninsulas which are exporting material intensive products or raw materials like New Caledonia. They are burdened very intensively, with more than 1000 tonnes per km². Malta with more than 540 000 tonnes/km² “suffers” the highest (potential) environmental pressure through trade, whereby the data of Malta are very exceptional in 2005 mainly due to high exports of jewellery of precious metals and gold which had been partly imported the years before.
PTBd+i/area > 500 tonnes / km²Numbers if > 10,000 tonnes / km² (in 1,000 t)
PTBd+i /area 0 to 75 tonnes / km²
PTBd+i /area 76 to 500 tonnes / km²
Intensity of load reliefPTBd+i/ /area < -501 tonnes / km²Numbers if < -1.000 tonnes / km² (in 1,000 tonnes)PTBd+i/area -76 to -500 tonnes / km²
PTBd+i /area 0 to -75 tonnes / km²
Intensity of burden
-2
-2
-11 New Caledonia
-540Malta
-9 Qatar
-6Cyprus
-5 Trinidad and Tobago -1
11
11 Aruba 13 Maldives
Luxembourg 21
59 Barbados
59 Bermuda
177 Hong Kong
273 Singapore
Source: own calculation based on various sources, see section 3. Area-‐data based on CIA world fact book.
Figure 11: Average intensity of shifted environmental pressure respectively relief via trade
With regard to the countries which are shifting environmental burden, a wider range of the average load relief can be observed. The intensity of load relief of almost all African and Middle East countries with a positive trade balance of indirect flows is low. The majority of the emerging countries, the United States, some Eastern-‐European countries and a wide range of islands like Sri Lanka, Kiribati or Jamaica shifted burden abroad within the range of 100 to 1000 tonnes per km². The West-‐European countries, Japan, South Korea and also Islands like Antigua and Barbuda, Maldives or Aruba discharged 1000 to 10 000 tonnes per km² to other regions. The highest intensity of load relief can be observed for Luxembourg (around 21 000 tonnes per km²), Barbados and Bermuda (each 59 000 tonnes per km²), Hong Kong (177 000 tonnes per km²) and Singapore (273 000 tonnes per km²).
23
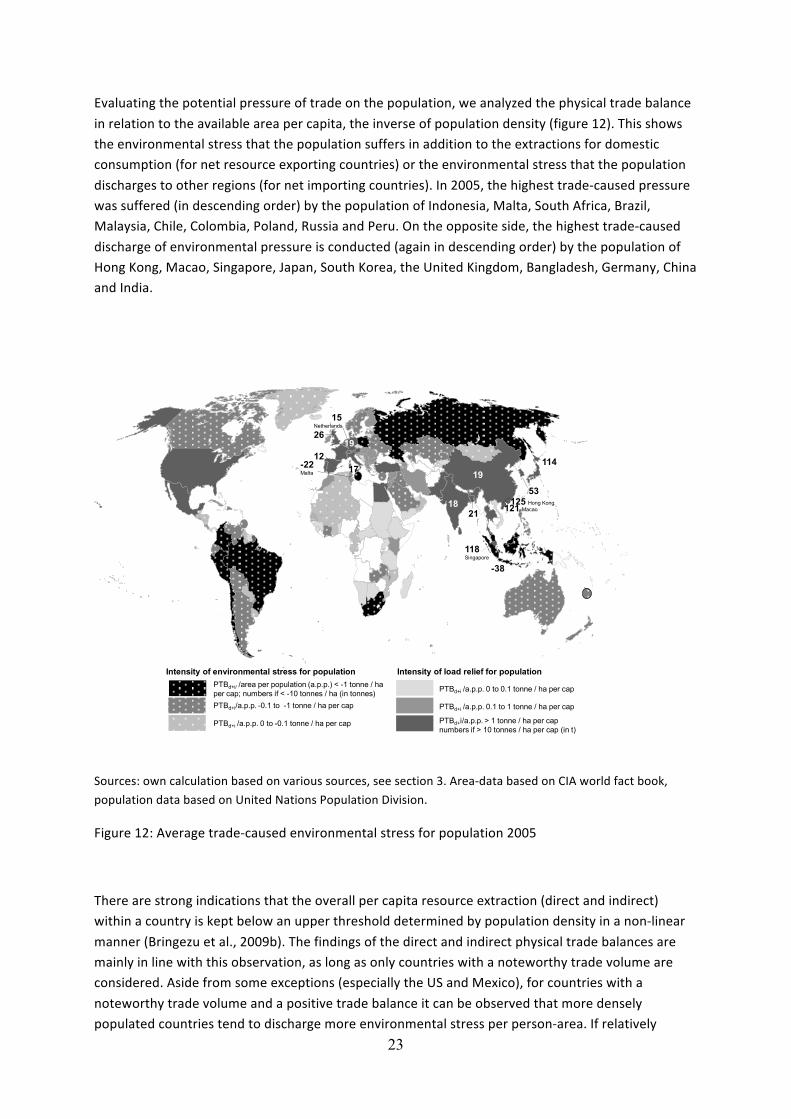
Evaluating the potential pressure of trade on the population, we analyzed the physical trade balance in relation to the available area per capita, the inverse of population density (figure 12). This shows the environmental stress that the population suffers in addition to the extractions for domestic consumption (for net resource exporting countries) or the environmental stress that the population discharges to other regions (for net importing countries). In 2005, the highest trade-‐caused pressure was suffered (in descending order) by the population of Indonesia, Malta, South Africa, Brazil, Malaysia, Chile, Colombia, Poland, Russia and Peru. On the opposite side, the highest trade-‐caused discharge of environmental pressure is conducted (again in descending order) by the population of Hong Kong, Macao, Singapore, Japan, South Korea, the United Kingdom, Bangladesh, Germany, China and India.
-38
-22Malta
53125 Hong Kong
118Singapore
PTBd+i/a.p.p. > 1 tonne / ha per capnumbers if > 10 tonnes / ha per cap (in t)
PTBd+i /a.p.p. 0 to 0.1 tonne / ha per cap
PTBd+i /a.p.p. 0.1 to 1 tonne / ha per cap
Intensity of load relief for populationPTBd+i/ /area per population (a.p.p.) < -1 tonne / ha per cap; numbers if < -10 tonnes / ha (in tonnes)PTBd+i/a.p.p. -0.1 to -1 tonne / ha per cap
PTBd+i /a.p.p. 0 to -0.1 tonne / ha per cap
Intensity of environmental stress for population
12
15Netherlands
17
18
19
19
21
26
114
121 Macao
Sources: own calculation based on various sources, see section 3. Area-‐data based on CIA world fact book, population data based on United Nations Population Division.
Figure 12: Average trade-‐caused environmental stress for population 2005
There are strong indications that the overall per capita resource extraction (direct and indirect) within a country is kept below an upper threshold determined by population density in a non-‐linear manner (Bringezu et al., 2009b). The findings of the direct and indirect physical trade balances are mainly in line with this observation, as long as only countries with a noteworthy trade volume are considered. Aside from some exceptions (especially the US and Mexico), for countries with a noteworthy trade volume and a positive trade balance it can be observed that more densely populated countries tend to discharge more environmental stress per person-‐area. If relatively

24
densely populated countries like China, Germany and India were to extract the resources which they import from other regions from within their own territory, the additional burden of around 20 tonnes per person-‐hectare each year could possibly lead to unbearable living conditions (irrespective of the current availability of specific resources).
Focusing on the burdened countries with a noteworthy trade volume it can be observed that with few exceptions (in 2005 Malta and Indonesia) the trade-‐caused additional stress can be found within a narrow range and hardly exceeded 3.5 tonnes per person-‐hectare in 2005. This supports the observation that higher resource extraction seems to be socially more acceptable in areas of lower population density and trade is a means to balance the environmental stress to some extent on a global level.
7. Summary
In this paper we presented the empirical findings of global indirect flows associated with trade between 1962 and 2005. To calculate the indirect flows we used physical quantities based on UN Comtrade for the direct trade flows combined with coefficients mainly developed for Germany. We consider this study as both necessary and important step for improving global data about indirect physical trade flows but we recommend investigating further the potential integration of LCA-‐based and IO-‐based approaches in the near future.
According to current knowledge, global indirect flows associated with trade grew up to a total of 41 billion tonnes in 2005. Trade with iron ores and concentrates, steel, hard coal, copper and tin are most responsible for the amount of indirect flows associated with trade. Since 1962 indirect flows have increased more than direct trade flows. This resulted from the over-‐average increase in trade of products which are associated with higher indirect flows, most importantly iron, hard coal, palm oil and fruits, as well as copper.
The imbalances of direct and indirect physical trade flows show more or less a continuous global pattern, which has become more pronounced over time: South America, Australia, the large Asian Islands and Central Asian countries are regions whose exports are increasingly associated with more indirect flows than their imports; they are taking environmental burden from the rest of the world. On the other hand Western Europe, Japan and increasingly the United States as well as emerging countries like China, India and Mexico are shifting environmental burden to other regions of the world. Though it is true that developing countries as a group are burdened by industrial countries through trade, it is important to note that the most burdened countries within the last 45 years are Australia and Canada. Natural resource endowment and population density seem to be more relevant than the level of GDP in determining the acceptance or shift of resource related environmental pressure.

25
The environmental intensity per territorial unit of the additional burden accepted by net resource exporting countries is within a relatively small range when the most burdened countries are compared. On the other hand, the range of the intensity of load-‐relief is wider; especially Islands, city-‐states and densely populated larger countries are shifting burden through trade which would – without trade and assuming they would have extracted the needed resources within their own territory – highly pressure their environment.
Acknowledgements
We are grateful to our colleague Meghan O'Brien for checking the English, and to two anonymous reviewers for constructive and helpful comments. This study was mainly financed by Heinrich Boell Foundation within the scope of a PHD grant.
References
Andersson, J.O., Lindroth, M., 2001. Ecologically unsustainable trade. Ecological Economics 3, 113 – 122.
Bringezu, S., 1992. Where does the cradle really stand? System Boundaries for Ecobalancing Procedures could be Harmonized. Fres. Env. Bull. 2, 419-‐424.
Bringezu, S., 2000. Ressourcennutzung in Wirtschaftsräumen. Stoffstromanalysen für eine nachhaltige Raumentwicklung. Springer, Berlin
Bringezu, S., Schütz, H., Moll, S., 2003. Rationale for and Interpretation of Economy-‐Wide Materials Flow Analysis and Derived Indicators. Journal of Industrial Ecology 7, 43 – 64.
Bringezu, S., Schütz, H., Arnold, K., Merten, F., Kabasci, S., Borelbach, P., Michels, C., Reinhardt, G.A., Rettenmaier, N., 2009a. Global implications of biomass and biofuel use in Germany – Recent trends and future scenarios for domestic and foreign agricultural land use and resulting GHG emissions. Journal of Cleaner Production 17, 57 – 68.
Bringezu, S., van de Sand, I., Schütz, H., Bleischwitz, R., Moll, S., 2009b. Analysing global resource use of the national and regional economies across various levels, in: Bringezu, S., Bleischwitz, R. (Eds.), Sustainable Resource Management. Global Trends, Visions and Policies, Sheffield, pp. 10 – 51.
Bringezu, S., Schütz, H., Saurat, M., Moll, S., Acosta-‐Fernádez, J., Steger, S., 2009c. Europe´s resource use: basic trends, global and sectoral patterns, environmental and socio-‐economic impacts, in: Bringezu, S., Bleischwitz, R. (Eds.), Sustainable Resource Management. Global Trends, Visions and Policies, Sheffield, pp. 52 – 155.
Central Intelligence Agency (CIA). The World Factbook. https://www.cia.gov/library/publications/the-‐world-‐factbook/ [July, 20th 2010]

26
Destatis (Statistisches Bundesamt Deutschland), 2007. CO2-‐ Emissionen – Ursachen in Entstehung, Verbrauch und Verwendung. http://www.destatis.de/jetspeed/portal/cms/Sites/destatis/Internet/DE/Navigation/Publikationen/STATmagazin/Umwelt2007__12,templateId=renderPrint.psml__nnn=true [August, 25 th 2009].
Dittrich, M., 2010. Physische Handelsbilanzen. Verlagert der Norden Umweltbelastungen in den Süden? Kölner Geographische Arbeiten 91, Köln.
Dittrich. M., Bringezu, S., 2010. The Physical Dimension of International Trade, Part 1: Direct Global Flows between 1962 and 2005. Ecological Economics 69, 1838 – 1847.
Eisenmenger, N., Giljum, S., 2007. Evidence from Social Metabolism Studies for Ecological Unequal Trade, in: Hornborg, A., Crumley, C. (Eds.), The World System and the Earth System. Global Socio-‐environmental Change and Sustainability since the Neolithic, Walnut Creek, CA, pp. 288 – 302.
Fischer-‐Kowalski, M. 1998. Society's Metabolism. The Intellectual History of Materials Flow Analysis, Part I, 1860-‐1970. Industrial Ecology 2 (1), 61-‐78.
Giljum, S., 2003. Biophysical dimension of North-‐South trade: material flows and land use. Dissertation University of Wien, Wien.
Giljum, S., 2004. Trade, material flows and economic development in the South: the example of Chile. Journal of Industrial Ecology 8 (1-‐2), 241 – 261.
Giljum, S., Lutz, C., Jungnitz, A., Bruckner, M., Hinterberger, F., 2008. Global dimensions of European natural resource use. First results from the Global Resource Accounting Model (GRAM), SERI Working Paper, No. 7. Sustainable Europe Research Institute, Vienna.
Krausmann, F., Fischer-‐Kowalski, M., Schandl, H., Eisenmenger, N., 2008. The Global Socio-‐metabolic Transition. Past and Present Metabolic Profiles and Their Future Trajectories. Journal of Industrial Ecology 12 (5-‐6), 637 – 656.
Machado, G., Schaeffer, R., Worrell, E., 2001. Energy and carbon embodied in the international trade of Brazil: an input-‐output approach. Ecological Economics, 39, 409 – 424.
Muñoz, P., Giljum, S., Roca, J., 2009. The Raw Material Equivalents of International Trade. Empirical Evidence for Latin America. Journal of Industrial Ecology 13 (6), 881 – 897.
Muradian, R., O’Connor, M., Martinez-‐Alier, J., 2002. Embodied pollution in trade: estimating the ‘environmental load displacement’ of industrialised countries. Ecological Economics 41, 54 – 67.
OECD, 2008a. Measuring Material Flows and Resource Productivity. Vol. I and II. The OECD Guide and The Accounting framework. OECD, Paris.
OECD, 2008b. Measuring Material Flows and Resource Productivity. Vol. III. Inventory of Country Activities. OECD, Paris.

27
Pan, J., Phillips, J., Chen, Y. 2008. China’s balance of emissions embodied in trade: approaches to measurement and allocating international responsibility. Oxford Review of Economic Policy, 24 (2), 354 – 376.
Pérez-‐Rincón, M. A., 2005. Colombian international trade from a physical perspective: Towards an ecological „Prebisch thesis“. Ecological Economics 59, 519 – 529.
Peters, G. P., Hertwich, E.G., 2006. Pollution embodied in trade: The Norwegian case. Global Environmental Change 16 (4), 379 – 387.
Peters, G. P., Hertwich, E.G., 2008. CO2 Embodied in International Trade with Implications for Global Cimate Policy. Environmental Science and Technology 42 (5), 1401 – 1407.
Ritthoff, M., Rohn, H., Liedtke, C., 2002. Calculating MIPS – Resource productivity of products and services. Wuppertal Spezial 27e, Wuppertal, and „material intensity of materials, fuels, transport services“, pdf-‐download from www.wupperinst.org: “MIT_v2.pdf”.
Schmidt-‐Bleek, F. 1994. Wieviel Umwelt braucht der Mensch? Berlin.
Schütz, H., Moll, S., Bringezu, S., 2004. Globalisation and the shifting environmental burden: material trade flows of the European Union. Wuppertal Papers No. 134e, Wuppertal.
Schütz, H., Bringezu, S., 2008. Ressourcenverbrauch von Deutschland – aktuelle Kennzahlen und Begriffsbestimmungen. Erstellung eines Glossars zum „Ressourcenbegriff“ und Berechnung von fehlenden Kennzahlen des Ressourcenverbrauchs für die weitere politische Analyse. Forschungsbericht 363 01 134, UBA-‐FB 001103, im Auftrag des Bundesministeriums für Umwelt, Naturschutz und Reaktorsicherheit.
Van de Sand, I., Acosta-‐Fernández, J., Bringezu, S., 2007. Abschätzung von Potenzialen zur Verringerung des Ressourcenverbrauchs im Automobilsektor: Ergebnisse des BMBF-‐Projekts ‚Erhöhung der Ressourcenproduktivität als Kernstrategie nachhaltiger Entwicklung’. Wuppertal.
United Nations, Department of Economic and Social Affairs, 1998. International Merchandise Trade Statistics. Concepts and Definitions, New York.
United Nations Population Division. World Population Prospects: The 2008 Revision. http://data.un.org/Data.aspx?q=population+density&d=PopDiv&f=variableID%3a14 [Sept. 2nd, 2010]
United Nations Statistics Division. Key Global Indicators. http://data.un.org/Data.aspx?q=GDP&d=CDB&f=srID%3a29922 [Sept. 2nd, 2010]
Van de Sand, I., Acosta-‐Fernandez, J., Bringezu, S., 2007. Abschätzung von Potenzialen zur Verringerung des Ressourcenverbrauchs im Automobilsektor. Projektergebnisse „Steigerung der Ressourcenproduktivität als Kernstrategie einer nachhaltigen Entwicklung“. Projekt im Auftrag des BMBF. Wuppertal.
28
Weisz, H., 2007. Combining social metabolism and input-‐output analysis to account for ecologically unequal trade, in: Hornborg et al. (Eds.), Rethinking environmental history: World-‐system history and global environmental change, Plymouth.
Wiedmann, T., Lenzen, M., Turner, K., Barrett, J., 2007. Examining the Global Environmental Impact of Regional Consumption Activities – Part 2: Review of input-‐output models for the assessment of environmental impacts embodied in trade. Ecological Economics 61 (1), 15 – 26.
Worldbank, 2006. Where is the Wealth of Nations? Washington, D.C.
WWF, World Wide Fund for Nature, several years. Living Planet Report. http://assets.panda.org/downloads/living_planet_report_2008.pdf [August, 25th 2009)