the phylogenetic pattern of speciation and wing …
TRANSCRIPT

1454
� 2006 The Society for the Study of Evolution. All rights reserved.
Evolution, 60(7), 2006, pp. 1454–1466
THE PHYLOGENETIC PATTERN OF SPECIATION AND WING PATTERN CHANGE INNEOTROPICAL ITHOMIA BUTTERFLIES (LEPIDOPTERA: NYMPHALIDAE)
CHRIS D. JIGGINS,1,2 RICARDO MALLARINO,3,4 KEITH R. WILLMOTT,5 AND ELDREDGE BERMINGHAM3
1Institute of Evolutionary Biology, School of Biology, University of Edinburgh, Edinburgh EH9 3JT, United Kingdom2E-mail: [email protected]
3Smithsonian Tropical Research Institute, Apartado 2072, Balboa, Republic of Panama4Department of Organismic and Evolutionary Biology, Harvard University, 26 Oxford Street, Cambridge, Massachussets 02138
5McGuire Center for Lepidoptera Research, Florida Museum of Natural History, University of Florida,Gainesville, Florida 32611-2710
Abstract. Species level phylogenetic hypotheses can be used to explore patterns of divergence and speciation. In thetropics, speciation is commonly attributed to either vicariance, perhaps within climate-induced forest refugia, orecological speciation caused by niche adaptation. Mimetic butterflies have been used to identify forest refugia as wellas in studies of ecological speciation, so they are ideal for discriminating between these two models. The genusIthomia contains 24 species of warningly colored mimetic butterflies found in South and Central America, and herewe use a phylogenetic hypothesis based on seven genes for 23 species to investigate speciation in this group. Thehistory of wing color pattern evolution in the genus was reconstructed using both parsimony and likelihood. Theancestral pattern for the group was almost certainly a transparent butterfly, and there is strong evidence for convergentevolution due to mimicry. A punctuationist model of pattern evolution was a significantly better fit to the data thana gradualist model, demonstrating that pattern changes above the species level were associated with cladogenesis andsupporting a model of ecological speciation driven by mimicry adaptation. However, there was only one case of sisterspecies unambiguously differing in pattern, suggesting that some recent speciation events have occurred withoutpattern shifts. The pattern of geographic overlap between clades over time shows that closely related species aremostly sympatric or, in one case, parapatric. This is consistent with modes of speciation with ongoing gene flow,although rapid range changes following allopatric speciation could give a similar pattern. Patterns of lineage accu-mulation through time differed significantly from that expected at random, and show that most of the extant specieswere present by the beginning of the Pleistocene at the latest. Hence Pleistocene refugia are unlikely to have playeda major role in Ithomia diversification.
Key words. Comparative analysis, Lepidoptera, mimicry, Pleistocene refugia, speciation.
Received August 23, 2005. Accepted May 1, 2006.
Speciation in the tropics remains especially poorly under-stood, despite the fact that the world’s most diverse ecosys-tems are tropical (Moritz et al. 2000). One long-standinghypothesis is that diversification occurred due to vicariancein Pleistocene forest refugia (Brown 1982; Haffer 1977). Analternative is that ecological adaptation to novel ecotopes orniches drives diversification, without a necessary requirementfor allopatry (Benson 1982; Endler 1977; Fjeldsa 1994; Gra-ham et al. 2004; Schneider et al. 1999). Such ecological shiftsmight occur more readily in tropical ecosystems, if ecologicalniche diversity were greater in more diverse communities,such that species richness could promote further speciation(Emerson and Kolm 2005). Thus, the relative importance ofdifferent modes of speciation needs to be tested empirically,especially in tropical regions.
Molecular sequence data can be used to investigate thetempo and mode of speciation (Nee et al. 1992). Phylogeniesprovide information on the timing and pattern of diversifi-cation, and concordant area cladograms in sympatric but un-related taxa are seen as good evidence for vicariant diver-sification (Cracraft and Prum 1988; Hall and Harvey 2002).However, in the tropics, recent evidence has suggested thatmany taxa diverged before the Pleistocene, casting doubt onthe Pleistocene refugia hypothesis (Moritz et al. 2000). Fur-thermore, many butterfly taxa occurring across a concordanthybrid zone in eastern Peru showed very different degreesof molecular divergence, arguing against a common vicariantevent having caused their diversification (Whinnett et al.
2005). Species-level phylogenetic hypotheses have also beenused to investigate whether ecological shifts are associatedwith speciation events (Barraclough et al. 1999) and whetherparticular traits tend to be associated with clades of greaterspecies diversity (Isaac et al. 2005). Nevertheless, the ma-jority of ecological speciation studies focus on closely relatedgroups of species or incipient species (Schluter 2000); thus,it is often difficult to gauge the broader role of adaptation inthe diversification of entire clades.
Here we use molecular phylogenetic data to investigatewhether ecological adaptation is likely to have been impor-tant in the diversification of a genus of mimetic Neotropicalbutterflies. Mimetic butterflies have been used both in theidentification of putative forest refugia (Brown 1979) wherevicariant speciation might have occurred, as well as in studiesof ecological speciation (Jiggins et al. 2004a). Butterfly wingpatterns are obvious phenotypic traits that show rapid evo-lution and play a role in reproductive isolation (Vane-Wright1978; Jiggins et al. 2001; Lukhtanov et al. 2005), being usedin sexual signaling and mate choice (Stride 1957, 1958;Brower 1959; Lederhouse and Scriber 1996; Deering andScriber 2002; Fordyce et al. 2002), as well as in predatordefence. A number of butterflies in Neotropical forests areunpalatable to predators and bear warning color patterns, andsympatric species tend to converge in pattern through mim-icry to facilitate predator recognition (Muller 1879). In thegenus Heliconius, it has long been known that rather distantlyrelated species tend to mimic one another, whereas closely
1455BUTTERFLY SPECIATION
related species commonly have very different color patterns(Turner 1976). These pattern differences between closely re-lated species contribute to reproductive isolation and there-fore play a direct role in speciation (Jiggins et al. 2004b).Furthermore, hybrid individuals with intermediate wing pat-terns are commonly nonmimetic, causing selection againsthybrids (Naisbit et al. 2003). Phylogenetic analysis of theheliconiines shows that sister species almost invariably differin mimetic pattern (Brower and Egan 1997) and demonstratesa correlation between color pattern and species diversity (M.S. Beltran, N. Isaak, J. Mallet, and C. D. Jiggins, unpubl.ms.). Mimicry is therefore an excellent example of the kindof adaptation that is likely to promote speciation in tropicalorganisms. However, to investigate the generality of colorpattern as a causal factor in speciation it is necessary to testthese hypotheses in other mimetic butterflies.
Here we use a recent and taxonomically almost completemolecular phylogeny for the genus Ithomia to investigatewhether ecological speciation is likely to have been importantin diversification. Ithomia are abundant, widespread speciesoften involved in mimicry with other genera of ithomiines(Beccaloni 1997). We investigate three aspects of Ithomiaevolution that might provide support for ecological versusvicariant speciation. First, we investigate whether changes incolor pattern are associated with speciation events. Second,since speciation driven by adaptation is not so strongly re-tarded by gene flow and is thus likely to occur in parapatryand perhaps also sympatry (Maynard Smith 1966; Endler1977), we also investigate the geographical context of speciesdivergence using a plot of geographic overlap against cladeage. Finally, we use the phylogeny to investigate the timecourse of diversification during the history of the genus, totest the prediction of the Pleistocene refugia hypothesis thatmost speciation has occurred in the recent past.
MATERIALS AND METHODS
Study Group and Phylogeny
Butterflies in the nymphalid subfamily Ithomiinae are dis-tasteful to predators and often brightly colored. Similar toHeliconius, they are involved in mimicry and show extremeintraspecific geographic diversity of wing patterns. Howeverthe group is far more diverse (360 spp.) than the heliconiines,offering greater opportunity for comparative analysis (Fox1940; Lamas 2004). Our analysis is based on a phylogenyobtained for the genus Ithomia based on seven genes, themitochondrial CoI, CoII and the tRNA-leucine, and the nu-clear genes Ef1 �, Tektin, Wg, and RpL5 (Mallarino et al.2005). The phylogeny derived from a Bayesian analysis ofthe concatenated sequences of six of these genes (all exceptRpL5) was consistent with the separate analysis of the in-dividual gene trees and was proposed as a most likely phy-logenetic hypothesis for the genus. Likelihood ratio tests im-plied that both individual gene alignments and the completedataset were consistent with the assumption of a strict mo-lecular clock (Mallarino et al. 2005). The phylogeny is gen-erally well resolved, with the exception of the relationshipsof four species in the I. agnosia clade and two branches inthe I. eleonora and I. iphianassa clades that lacked strongsupport. The implications of phylogenetic uncertainty on our
results are discussed where appropriate. The original datasetincluded two or more individuals for each species, and theconsensus phylogeny (Mallarino et al. 2005) is presented hereas Figure 1. Since variation within species was minimal, in-dividuals were randomly excluded so as to include just onerepresentative of each species for all analyses presented inthis article. Phylogenetic hypotheses were then recalculatedwith these reduced data using MrBayes to generate a species-level phylogeny (methods as described in Mallarino et al.2005).
The phylogeny includes 23 of the 24 known species ofIthomia. This species total takes into account some revisionsof the most recent alpha taxonomy (Lamas 2004) based ongenetic and field data (Mallarino et al. 2005). For the purposesof the present analysis we split I. terra into two geneticallydivergent species. We refer to I. (terra) sp. nov as the easternform of I. terra, although we note that at this stage it is notclear whether the name terra should correctly apply to theeastern or western form, or even whether the two are trulydistinct species (Mallarino et al. 2005). The authors favoreither the biological species concept or the genotypic clusterspecies definition, both of which lead us to recognize thesame species in Ithomia.
Testing for Diversification Associated with Mimicry Change
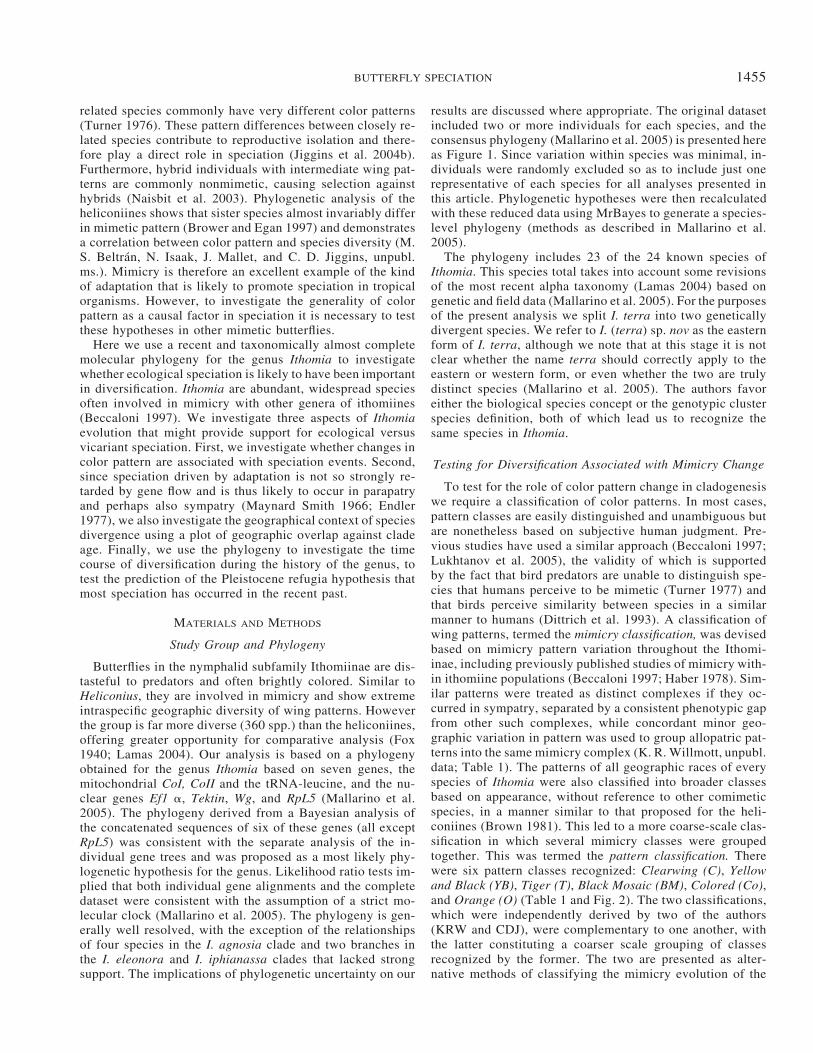
To test for the role of color pattern change in cladogenesiswe require a classification of color patterns. In most cases,pattern classes are easily distinguished and unambiguous butare nonetheless based on subjective human judgment. Pre-vious studies have used a similar approach (Beccaloni 1997;Lukhtanov et al. 2005), the validity of which is supportedby the fact that bird predators are unable to distinguish spe-cies that humans perceive to be mimetic (Turner 1977) andthat birds perceive similarity between species in a similarmanner to humans (Dittrich et al. 1993). A classification ofwing patterns, termed the mimicry classification, was devisedbased on mimicry pattern variation throughout the Ithomi-inae, including previously published studies of mimicry with-in ithomiine populations (Beccaloni 1997; Haber 1978). Sim-ilar patterns were treated as distinct complexes if they oc-curred in sympatry, separated by a consistent phenotypic gapfrom other such complexes, while concordant minor geo-graphic variation in pattern was used to group allopatric pat-terns into the same mimicry complex (K. R. Willmott, unpubl.data; Table 1). The patterns of all geographic races of everyspecies of Ithomia were also classified into broader classesbased on appearance, without reference to other comimeticspecies, in a manner similar to that proposed for the heli-coniines (Brown 1981). This led to a more coarse-scale clas-sification in which several mimicry classes were groupedtogether. This was termed the pattern classification. Therewere six pattern classes recognized: Clearwing (C), Yellowand Black (YB), Tiger (T), Black Mosaic (BM), Colored (Co),and Orange (O) (Table 1 and Fig. 2). The two classifications,which were independently derived by two of the authors(KRW and CDJ), were complementary to one another, withthe latter constituting a coarser scale grouping of classesrecognized by the former. The two are presented as alter-native methods of classifying the mimicry evolution of the

1456 CHRIS D. JIGGINS ET AL.
FIG. 1. Combined evidence phylogeny of the genus Ithomia. Biogeographic regions are shown for each species: CA, Central America;NEA, northeastern Andes; SEA, southeastern Andes; WA, western slopes of the Andes; AB, Amazon Basin; SEB, southeastern Brazil.Methods used in tree reconstruction are as described by Mallarino et al. (2005). Numbers above branches represent Bayesian supportvalues, while numbers below are parsimony bootstrap support for the same node. Absence of a value indicates either that the node wasabsent in the parsimony tree, or that suppport was less than 0.5 (Bayesian analysis) or 50 (boostrap analysis).
butterflies and to demonstrate that the results are not stronglydependent on the degree to which pattern classes are ‘‘split’’.The classes recognized were used as character states for thespecies in all subsequent analyses, with divergent geographicraces included as within-species polymorphisms. The onlyspecies whose classification was somewhat ambiguous was
I. pseudoagalla, which has a smoky brown pattern that issomewhat intermediate between classes. This species wasinitially classified in the Clearwing pattern class by CJ, butin the Dilucida (Colored) mimicry class by KRW. The pat-tern, although largely transparent, is more closely mimeticto darker species found sympatrically in western Ecuador

1457BUTTERFLY SPECIATION
such as I. iphianassa than to other clearwing species. Hencethe change in pattern is slight, but arguably sufficient to rep-resent a change in mimicry ring. This uncertainty is takeninto account by repeating all analyses with both possibleclassifications of I. pseudoagalla (Clearwing or Colored; seebelow).
In butterfly mate recognition, color patterns are primarilyused as a means by which males recognize females as po-tential mates (Fordyce et al. 2002; Jiggins et al. 2004b).Hence, where there is sexual dimorphism it is the femalecolor patterns that will most likely generate reproductive iso-lation. Therefore, in cases of sexual dimorphism, results werecompared both using male and female patterns classified asa polymorphism, and also including just the female patterns.This only affected the classifications for the two species I.ellara and I. eleonora. To visualize the distribution of patternchanges on the tree, color pattern change was reconstructedby parsimony using MacClade 4.0 (Maddison and Maddison1997).
We focused on testing the hypothesis that changes in colorpattern are associated with speciation events. Likelihoodmodels of ancestral character state reconstruction can be usedto compare alternative evolutionary scenarios, such as grad-ual evolution along branches of a phylogeny versus punc-tuationist evolution in which character states change at nodes.If color pattern change is associated with speciation, then weexpect the punctuationist model to be a better fit to the data.We therefore used likelihood to compare punctuationist ver-sus gradualist models of color pattern evolution using theprogram Bayes-MultiState version 1.0 (Pagel 1994; Pagel etal. 2004). This program has the advantage that multiple char-acter states can be used, such that species polymorphismscan be scored as polymorphic character states on terminalbranches. Under a gradualist evolutionary model, the prob-ability of color pattern change is expected to be in directproportion to branch length. For the purpose of this analysisit is assumed that genetic distance measured from our se-quence data is representative of the opportunity for pheno-typic change along any particular branch. In contrast, undera punctuationist model, color pattern changes occur duringcladogenesis. A simple likelihood model of character evo-lution can be used to test between these hypotheses by al-tering the branch length scaling parameter, � (Pagel 1994).A gradualist model is represented by a � value of one, where-by pattern change occurs in direct proportion to genetic dis-tance. Here we compare this simple model with a more com-plex model in which � is allowed to vary. Under this scenario,as � tends to zero the model becomes more punctuationist.The significance of alternative hypotheses can be investigatedusing likelihood ratio tests (LRT), where the model in which� is allowed to vary has one extra parameter, such that theLRT (�2�ln L, equivalent to G) has one degree of freedom(Edwards 1972). The effect of phylogenetic uncertainty onour results was investigated by calculating the likelihoodratio for every tree sampled in our Bayesian Markov chainMonte Carlo (MCMC) reconstruction of the species-level treeusing the program MrBayes (Huelsenbeck and Ronguist2001). The first 10,000 iterations of the chain were discardedand stationarity of the remaining samples confirmed by plot-ting the log-likelihood values of the remaining trees (data
not shown). After stationarity had been achieved, 9900 treeswere sampled, which should be representative of uncertaintyin the phylogenetic hypothesis. The difference in log like-lihood between the puntuationist and gradualist model wascalculated for all 9900 trees.
Determining the Geographic Pattern of Speciation
We investigated the relative importance of allopatric andsympatric speciation using the methodology of Barracloughand Vogler (2000). The degree of range overlap was plottedagainst node age for all nodes in the tree. If speciation isallopatric, recently diverged sister species are expected todisplay little or no overlap in geographic ranges. If speciationis predominantly sympatric, recently diverged sister speciesare expected to display a high degree of range overlap.
Locality data were obtained from specimens in the NaturalHistory Museum (NHM), London, the Museo de HistoriaNatural, Universidad Nacional Mayor de San Marcos, Lima(MUSM), and unpublished Ecuadorian records of K. R. Will-mott and J. Hall (unpubl. data). Localities were georeferencedusing a variety of sources, but mainly (Brown 1979), theNational Imagery and Mapping Agency (http://www.nima.mil) and G. Lamas (pers. comm.). Species ranges were in-ferred from dot map coordinates on equal-area maps usingArcView 3.2 (ESRI, Redlands, CA). A sinusoidal projectionwith a central meridian of 75�W was used. For each species,circles of 350 km diameter were drawn around each dot togenerate a single continuous distribution. This diameter isarbitrary and was chosen based on the density of collectionsites, aiming to generate continuous distribution areas. In ourexperience in the field, gaps between collecting sites almostinvariably represent information gaps rather than genuinelydisjunct distributions so it is more likely to be correct to infera continuous distribution from such disjunct points. Altitu-dinal range information was incorporated by excluding re-gions above and below the altitudinal limits of each species,as estimated from reliable collection locality data. An areamap was generated for each 500-m contour, and these werethen used to subtract the upper and, in the case of montanespecies, also the lower altitudinal limit from each speciesrange. Range maps were then trimmed by hand according toknown geographic barriers—most notably where circles hadcrossed known barriers such as the Andes. These range mapsare crude, but are likely to be the best achievable with therelatively sparse collection data available for many speciesand are consistent with our field experience.
The degree of range overlap was then calculated for eachnode in the tree (Barraclough and Vogler 2000; Fitzpatrickand Turelli 2006). For terminal species pairs, the area of rangeoverlap was calculated and this value divided by the area ofthe smallest species range. For deeper nodes in the tree wepresent various alternative methods. The method originallyproposed was to sum ranges for each clade and use thesetotal clade ranges for calculating overlaps at each node(Lynch 1989; Barraclough and Vogler 2000). As has beenhighlighted by Berlocher and Feder (2002), this method isproblematic because range areas are necessarily larger atdeeper nodes in the tree, thus the absolute size of rangesbeing compared is larger at older nodes. This means that there

1458 CHRIS D. JIGGINS ET AL.
TABLE 1. Classification of color patterns of Ithomia species. Brackets indicate sexually dimorphic characters, with braces showingpatterns restricted to males, and parentheses those restricted to females. The mimicry classification shown is based on groups of co-occurring mimetic species separated by phenotypic gaps from other co-occurring species. The names for the different classes are derivedfrom ithomiine species or races. The pattern classification shown has only six classes that represent a grouping of similar mimicry classes:Clearwing (C), Yellow and Black (YB), Tiger (T), Black Mosaic (BM), Colored (Co), and Orange (O).
Mimicry classification
AGNOSIA AMALDA BANJANA-M CONFUSA DERASA DILUCIDA EURIMEDIA EXCELSA HERMIAS HEWITSONI
Pattern group C O C C YB Co YB Co T CIthomia speciesagnosia Xamarilla Xarduinna X Xavella X Xcelemia X Xcleora (X)diasia Xdrymoeleonora {X}ellara {X}heraldicahyala Xhymettia Xiphianassa X Xjucunda Xlagusa {X} Xleilalichyi Xpatillapraeithomia Xpseudoagalla Xsalapia X X Xsp. nov. Xterra X Xxenos X X
is a higher probability of sympatry in comparisons deeper inthe tree topology. Thus an increase in the degree of sympatrythrough time (i.e., older nodes are more likely to be sym-patric) is generated in part as an artifact of the way the methodtreats sister clades (Berlocher and Feder 2002). Hence, wealso present an alternative method that has recently beenproposed, using independent contrasts between pairs of taxa(Fitzpatrick and Turelli 2006). Average pairwise overlaps arecalculated using a method developed for the study of repro-ductive isolation (Fitzpatrick 2002). Third, we present max-imum pairwise overlap between any pair of species in thetwo clades (Fitzpatrick and Turelli 2006). Changes in averageoverlap could simply be an artifact of increasing variance inoverlap as ranges move over time, so maximum pairwiseoverlap might overcome this problem. Maximum overlapsmight be expected to start low and gradually increase forallopatric speciation, but start high and remain high undersympatric speciation. The overlap values calculated using allthree methods described above were plotted against node age,estimated from a tree reconstructed under the assumption ofa strict molecular clock.
Estimating significance of such plots is problematic. Thedistribution of overlap values is clearly different at deepernodes compared to recent splits, so parametric methods arehard to justify (Barraclough and Vogler 2000). Alternativessuch as permuting ranges among species are also problematic,since there is a clear phylogenetic signal in geographic rangesacross our phylogeny (Fitzpatrick and Turelli 2006). In other
words, closely related species are more likely to share a bio-geographic region than expected at random. For descriptivepurposes and for comparison with previous results, we usedlinear regression on overlap values to estimate intercepts andslopes (Barraclough and Vogler 2000) and nonparametricSpearman’s rank tests to investigate the significance of theslope.
Speciation Rates
We also focused on the time course of speciation. ThePleistocene refugia hypothesis would predict high speciationrates during the Pleistocene and perhaps a significant increasein speciation rates during this period. We therefore investi-gated patterns of lineage accumulation during the history ofthe genus and then related this to geological epochs by com-parison with published insect molecular clocks (see Discus-sion). The accumulation of species in Ithomia was investi-gated by plotting the log of the number of lineages againstthe scaled branch-length distances of the clock-constrainedmaximum-likelihood tree. Log(diversity) is expected to showa straight line relationship with time under a constant netspeciation model. Deviation from a constant speciation model(Barraclough and Vogler 2002) was tested using the �-sta-tistic of Pybus and Harvey (2000). A positive value of �indicates that the speciation rate increases toward the tips ofthe cladogram, whereas a negative value is expected if thespeciation rate decreases through time. The hypothesis of a

1459BUTTERFLY SPECIATION
TABLE 1. Extended.
Mimicry classification
IDAE LERIDA MAMERCUS MANTINEUS MESTRA PANTHYALE PARALLELIS PRAXILLA TICIDA-M SUSIANAPattern
classification
T C Co Co C C T C C BM
CYBC/YB
X X CX X X Co/T
X CoX C/OX C
(X) C/BM(X) C/BM
X CoX C
CX Co/T
X C/OX X X C/Co
X CX CX C
(X) C/BMCC/YBC
X CCo
constant speciation rate is rejected if � is less than �1.645or greater than �1.645 (Pybus and Harvey 2000). Pybus andHarvey (2000) proposed a method of correcting for incom-plete sampling, which results in lower � values as internalnodes tend to leave more descendants than terminal nodes.We therefore used the Monte Carlo constant rates (MCCR)test of Pybus and Harvey (2000) to adjust our expected val-ues, taking into account the proportion of sampled taxa. Thistest simulates the distribution of � under the pure birth pro-cess when only a specified proportion of the extant speciesare sampled. The program APE (E. Paradis; available viahttp://www.isem.univ-montp2.fr//ppp/pppphylogenie/paradishome.php) was used to run the simulations (10,000simulations, 23 sampled taxa of 24 extant taxa) and obtainthe �-statistic (Paradis et al. 2004).
RESULTS
Color Pattern Change
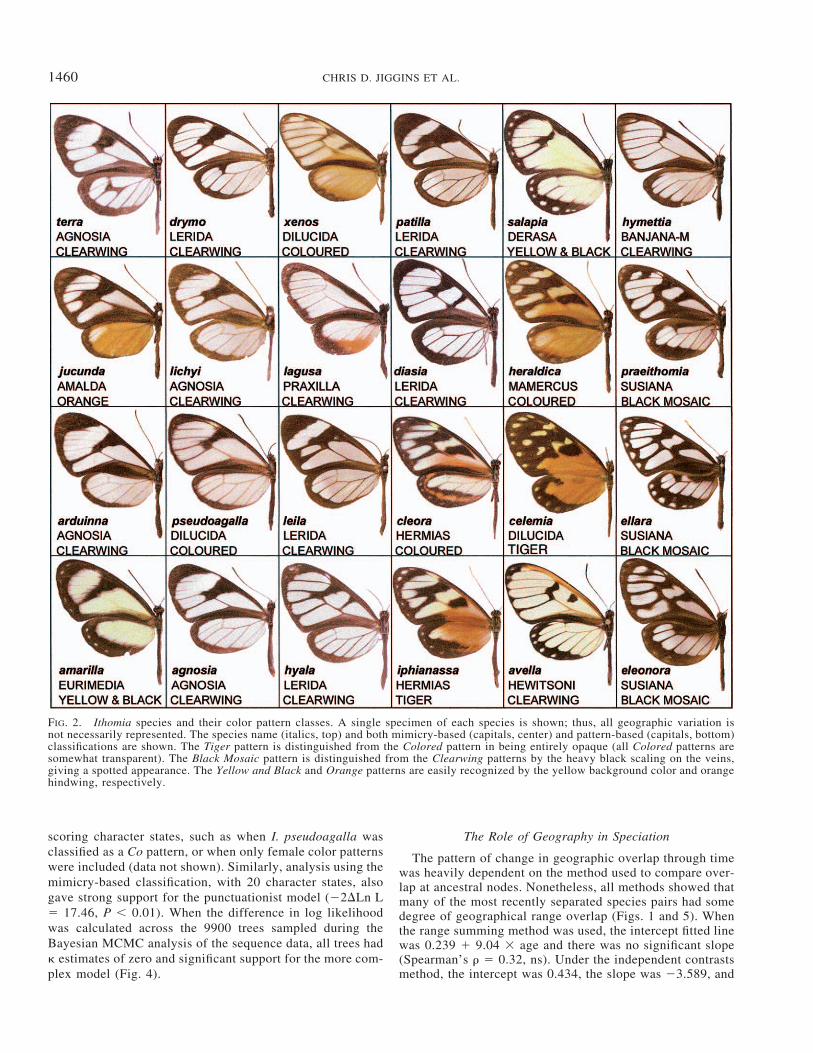
Parsimony reconstruction of color patterns in Ithomia usingthe pattern-based classification showed that the ancestral pat-tern was most likely to have been a clearwing butterfly (Fig.3). This pattern is found in species distributed widely acrossthe Ithomia tree and is shared with the closely related genusPagyris, although Placidina, which is probably sister to Pa-gyris (K. R. Willmott and A. Freitas pers. comm..) has aTiger pattern. The reconstruction of color pattern change wasgenerally unambiguous under the accelerated changes meth-
od. A reconstruction using decelerated changes showed farmore ambiguous character states on internal branches (notshown), but showed the same ancestral state for the genusas a whole. However, whichever method was used, there wererelatively few switches in color pattern between closely re-lated species (Fig. 3). There was an unambiguous switchbetween the sister species, I. salapia and I. iphianassa, andpossibly another between I. pseudoagalla and its sister I.lichyi. A reconstruction using the second, mimicry-basedclassification was virtually identical, with the added mimicryclasses mostly representing polymorphisms within speciesrather than switches between species (Table 1; reconstructionnot shown). These reconstructions were not affected by phy-logenetic uncertainty, because poorly supported brancheswere not in regions of the tree that would affect reconstructionof ancestral patterns.
Likelihood analysis showed an association of color patternchange with cladogenesis. Using the pattern classification toassign character states, the gradualist model gave a proba-bility of a clearwing ancestor of 0.95, and a rate parameterfor pattern change of 2.76 (Ln L �25.07). In contrast,when � was estimated, the most likely model had a rateparameter two orders of magnitude lower of 0.026, a � valueof 0.000, and a probability for a clearwing ancestor of 0.99and was a better fit to the data (LnL �20.71; comparisonof the two hypotheses gives �2�Ln L 8.72, P 0.01).Thus, the punctuationist model with � 0 was the best fitto the data. This result was robust to different methods of
1460 CHRIS D. JIGGINS ET AL.
FIG. 2. Ithomia species and their color pattern classes. A single specimen of each species is shown; thus, all geographic variation isnot necessarily represented. The species name (italics, top) and both mimicry-based (capitals, center) and pattern-based (capitals, bottom)classifications are shown. The Tiger pattern is distinguished from the Colored pattern in being entirely opaque (all Colored patterns aresomewhat transparent). The Black Mosaic pattern is distinguished from the Clearwing patterns by the heavy black scaling on the veins,giving a spotted appearance. The Yellow and Black and Orange patterns are easily recognized by the yellow background color and orangehindwing, respectively.
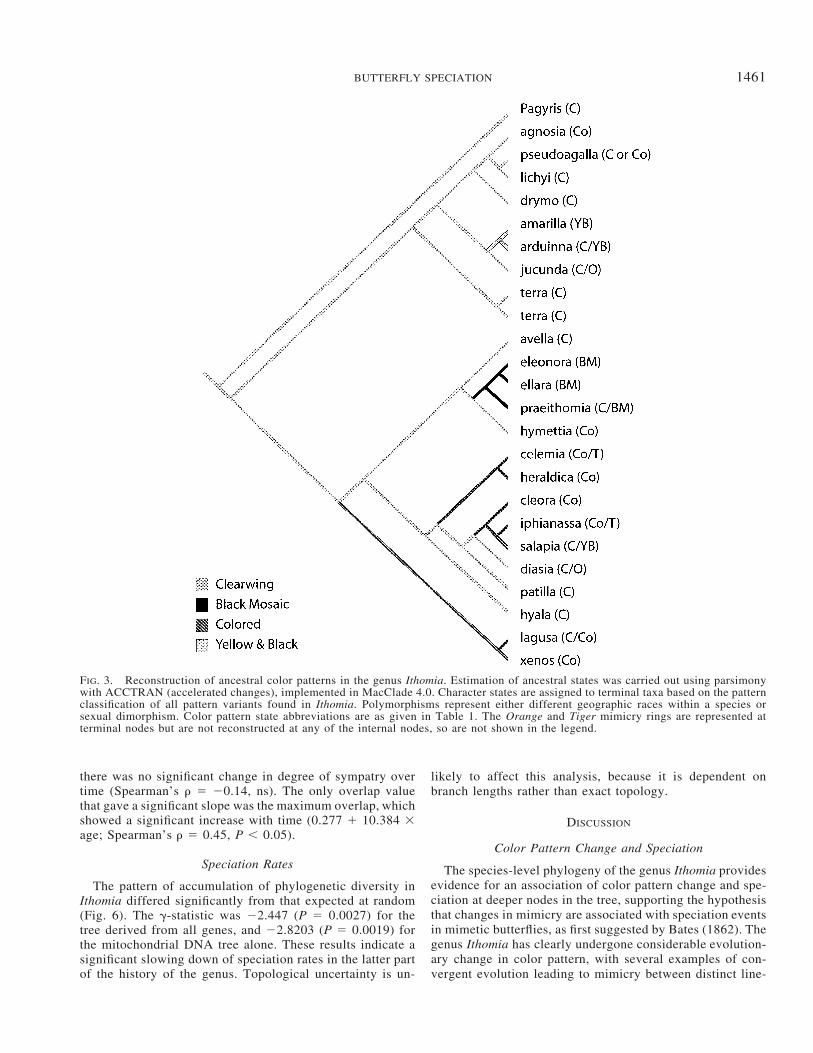
scoring character states, such as when I. pseudoagalla wasclassified as a Co pattern, or when only female color patternswere included (data not shown). Similarly, analysis using themimicry-based classification, with 20 character states, alsogave strong support for the punctuationist model (�2�Ln L 17.46, P 0.01). When the difference in log likelihoodwas calculated across the 9900 trees sampled during theBayesian MCMC analysis of the sequence data, all trees had� estimates of zero and significant support for the more com-plex model (Fig. 4).
The Role of Geography in Speciation
The pattern of change in geographic overlap through timewas heavily dependent on the method used to compare over-lap at ancestral nodes. Nonetheless, all methods showed thatmany of the most recently separated species pairs had somedegree of geographical range overlap (Figs. 1 and 5). Whenthe range summing method was used, the intercept fitted linewas 0.239 � 9.04 � age and there was no significant slope(Spearman’s � 0.32, ns). Under the independent contrastsmethod, the intercept was 0.434, the slope was �3.589, and
1461BUTTERFLY SPECIATION
FIG. 3. Reconstruction of ancestral color patterns in the genus Ithomia. Estimation of ancestral states was carried out using parsimonywith ACCTRAN (accelerated changes), implemented in MacClade 4.0. Character states are assigned to terminal taxa based on the patternclassification of all pattern variants found in Ithomia. Polymorphisms represent either different geographic races within a species orsexual dimorphism. Color pattern state abbreviations are as given in Table 1. The Orange and Tiger mimicry rings are represented atterminal nodes but are not reconstructed at any of the internal nodes, so are not shown in the legend.
there was no significant change in degree of sympatry overtime (Spearman’s � �0.14, ns). The only overlap valuethat gave a significant slope was the maximum overlap, whichshowed a significant increase with time (0.277 � 10.384 �age; Spearman’s � 0.45, P 0.05).
Speciation Rates
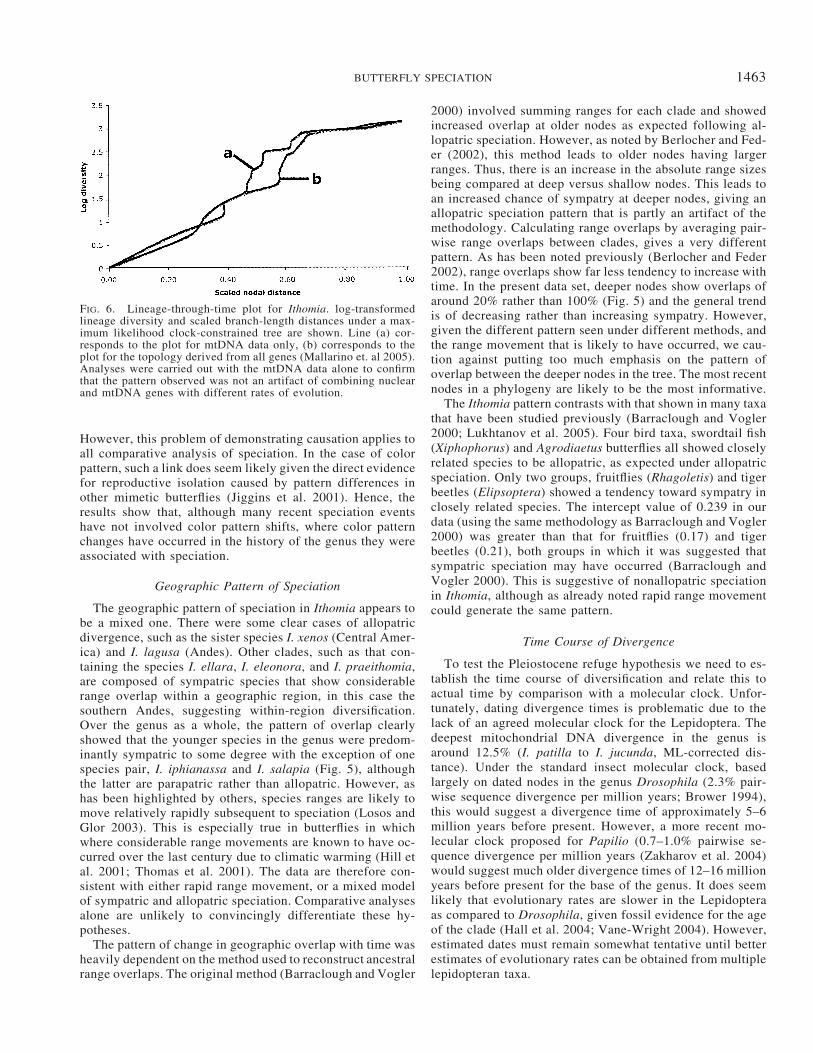
The pattern of accumulation of phylogenetic diversity inIthomia differed significantly from that expected at random(Fig. 6). The �-statistic was �2.447 (P 0.0027) for thetree derived from all genes, and �2.8203 (P 0.0019) forthe mitochondrial DNA tree alone. These results indicate asignificant slowing down of speciation rates in the latter partof the history of the genus. Topological uncertainty is un-
likely to affect this analysis, because it is dependent onbranch lengths rather than exact topology.
DISCUSSION
Color Pattern Change and Speciation
The species-level phylogeny of the genus Ithomia providesevidence for an association of color pattern change and spe-ciation at deeper nodes in the tree, supporting the hypothesisthat changes in mimicry are associated with speciation eventsin mimetic butterflies, as first suggested by Bates (1862). Thegenus Ithomia has clearly undergone considerable evolution-ary change in color pattern, with several examples of con-vergent evolution leading to mimicry between distinct line-
1462 CHRIS D. JIGGINS ET AL.
FIG. 4. Difference in log-likelihood values between punctuationistand gradualist hypotheses in Ithomia. Data shown are for 9900 treessampled during Bayesian MCMC analysis of combined sequencedata. The G-value was calculated for each tree by comparing thepunctuationist (� allowed to vary) and gradualist models (� 1).The observation that all values are significant indicates that thereis support for the punctuationist model across all of the plausibletree space suggested by our sequence data. The right hand tail ofthe distribution is truncated for clarity.
FIG. 5. Degree of sympatry plotted against relative node age,shown as substitutions per site, in Ithomia. Three methods of cal-culating range overlap are shown (see Materials and Methods formore details). (A) Species ranges are merged for each clade beforecalculating overlap, (B) overlaps are averaged across species pairsusing independent contrasts, and (C) the maximum pairwise overlapbetween each pair of clades is shown. Lines shown are simple linearregressions.
ages in the genus. For example the Yellow and Black pattern(I. salapia and I. amarilla), the Tiger pattern (I. iphianassaand I. celemia) and the colored pattern (I. heraldica, I. cleora/iphianassa, and I. xenos/lagusa) have all evolved at leasttwice in the history of the genus. In spite of this, however,there is little evidence that the most recent speciation eventshave involved switches in color pattern. Several polymorphicspecies share at least one pattern with their closest relative.Thus, I. iphianassa shares the Colored pattern with I. cleora,I. xenos similarly shares this pattern with I. lagusa, and I.jucunda shares the Clearwing pattern with I. arduinna. Inthese cases, the most parsimonious hypothesis is that thenovel derived patterns found in I. iphianassa, I. lagusa, andI. jucunda have evolved subsequent to speciation, althoughit is also likely that in some cases the shared putative ancestralpattern actually represents recent convergence. Only one sis-ter species pair, I. salapia and I. iphianassa, has unambig-uously diverged in color pattern and is therefore a candidatefor color pattern change having occurred at a recent speci-ation event. Furthermore, there are some clades in whichspeciation has definitely occurred without any significant col-or pattern switches, leading to groups of related and sym-patric species with similar patterns. Examples include I. el-lara and I. eleonora and the group of I. agnosia, I. lichyi, andI. drymo. This pattern contrasts with that seen in Heliconius,in which most sister species differ in pattern. Clearly, theIthomia have undergone speciation via mechanisms that donot involve changes in color pattern.
However, across the genus as a whole there was strongevidence that shifts in color pattern occurred in associationwith cladogenesis. A punctuationist model was a significantlybetter fit to the data than a gradualist model, a result thatwas robust to different color pattern classifications and to
uncertainty in the phylogeny reconstruction. The implicationof this result is that the rate of pattern change increases whererates of speciation are higher, rather than being correlatedwith branch lengths. This accords with our observation thatthe rate of speciation was higher in the earlier part of thehistory of the genus and that most pattern shifts were notfound at the tips of the tree, but rather on internal branches.Of course we cannot directly infer a causal link betweenpattern shifts and speciation from these comparative data.
1463BUTTERFLY SPECIATION
FIG. 6. Lineage-through-time plot for Ithomia. log-transformedlineage diversity and scaled branch-length distances under a max-imum likelihood clock-constrained tree are shown. Line (a) cor-responds to the plot for mtDNA data only, (b) corresponds to theplot for the topology derived from all genes (Mallarino et. al 2005).Analyses were carried out with the mtDNA data alone to confirmthat the pattern observed was not an artifact of combining nuclearand mtDNA genes with different rates of evolution.
However, this problem of demonstrating causation applies toall comparative analysis of speciation. In the case of colorpattern, such a link does seem likely given the direct evidencefor reproductive isolation caused by pattern differences inother mimetic butterflies (Jiggins et al. 2001). Hence, theresults show that, although many recent speciation eventshave not involved color pattern shifts, where color patternchanges have occurred in the history of the genus they wereassociated with speciation.
Geographic Pattern of Speciation
The geographic pattern of speciation in Ithomia appears tobe a mixed one. There were some clear cases of allopatricdivergence, such as the sister species I. xenos (Central Amer-ica) and I. lagusa (Andes). Other clades, such as that con-taining the species I. ellara, I. eleonora, and I. praeithomia,are composed of sympatric species that show considerablerange overlap within a geographic region, in this case thesouthern Andes, suggesting within-region diversification.Over the genus as a whole, the pattern of overlap clearlyshowed that the younger species in the genus were predom-inantly sympatric to some degree with the exception of onespecies pair, I. iphianassa and I. salapia (Fig. 5), althoughthe latter are parapatric rather than allopatric. However, ashas been highlighted by others, species ranges are likely tomove relatively rapidly subsequent to speciation (Losos andGlor 2003). This is especially true in butterflies in whichwhere considerable range movements are known to have oc-curred over the last century due to climatic warming (Hill etal. 2001; Thomas et al. 2001). The data are therefore con-sistent with either rapid range movement, or a mixed modelof sympatric and allopatric speciation. Comparative analysesalone are unlikely to convincingly differentiate these hy-potheses.
The pattern of change in geographic overlap with time washeavily dependent on the method used to reconstruct ancestralrange overlaps. The original method (Barraclough and Vogler
2000) involved summing ranges for each clade and showedincreased overlap at older nodes as expected following al-lopatric speciation. However, as noted by Berlocher and Fed-er (2002), this method leads to older nodes having largerranges. Thus, there is an increase in the absolute range sizesbeing compared at deep versus shallow nodes. This leads toan increased chance of sympatry at deeper nodes, giving anallopatric speciation pattern that is partly an artifact of themethodology. Calculating range overlaps by averaging pair-wise range overlaps between clades, gives a very differentpattern. As has been noted previously (Berlocher and Feder2002), range overlaps show far less tendency to increase withtime. In the present data set, deeper nodes show overlaps ofaround 20% rather than 100% (Fig. 5) and the general trendis of decreasing rather than increasing sympatry. However,given the different pattern seen under different methods, andthe range movement that is likely to have occurred, we cau-tion against putting too much emphasis on the pattern ofoverlap between the deeper nodes in the tree. The most recentnodes in a phylogeny are likely to be the most informative.
The Ithomia pattern contrasts with that shown in many taxathat have been studied previously (Barraclough and Vogler2000; Lukhtanov et al. 2005). Four bird taxa, swordtail fish(Xiphophorus) and Agrodiaetus butterflies all showed closelyrelated species to be allopatric, as expected under allopatricspeciation. Only two groups, fruitflies (Rhagoletis) and tigerbeetles (Elipsoptera) showed a tendency toward sympatry inclosely related species. The intercept value of 0.239 in ourdata (using the same methodology as Barraclough and Vogler2000) was greater than that for fruitflies (0.17) and tigerbeetles (0.21), both groups in which it was suggested thatsympatric speciation may have occurred (Barraclough andVogler 2000). This is suggestive of nonallopatric speciationin Ithomia, although as already noted rapid range movementcould generate the same pattern.
Time Course of Divergence
To test the Pleiostocene refuge hypothesis we need to es-tablish the time course of diversification and relate this toactual time by comparison with a molecular clock. Unfor-tunately, dating divergence times is problematic due to thelack of an agreed molecular clock for the Lepidoptera. Thedeepest mitochondrial DNA divergence in the genus isaround 12.5% (I. patilla to I. jucunda, ML-corrected dis-tance). Under the standard insect molecular clock, basedlargely on dated nodes in the genus Drosophila (2.3% pair-wise sequence divergence per million years; Brower 1994),this would suggest a divergence time of approximately 5–6million years before present. However, a more recent mo-lecular clock proposed for Papilio (0.7–1.0% pairwise se-quence divergence per million years (Zakharov et al. 2004)would suggest much older divergence times of 12–16 millionyears before present for the base of the genus. It does seemlikely that evolutionary rates are slower in the Lepidopteraas compared to Drosophila, given fossil evidence for the ageof the clade (Hall et al. 2004; Vane-Wright 2004). However,estimated dates must remain somewhat tentative until betterestimates of evolutionary rates can be obtained from multiplelepidopteran taxa.

1464 CHRIS D. JIGGINS ET AL.
Nonetheless, analysis of lineage accumulation throughtime clearly shows a significant slowing of diversification inthe most recent history of the genus, which argues stronglyagainst any Pleistocene speciation model. Most of the extantspecies were already present throughout the last 30% of thetime since the most recent common ancestor. As describedabove, different molecular clock estimates give dates of either5–6 or 12–16 million years before present for the most recentcommon ancestor of the whole clade. Thus, depending onthe molecular clock used, most speciation was complete bybetween 1.5 and 5 million years before present, and certainlyby the very early Pleistocene at the latest. The data thereforesuggest that forest fragmentation during the Pleistocene hasnot played a major role in species diversification and are inagreement with results from other tropical and temperatestudies, which have similarly shown that most extant speciesformed significantly before this period (Hewitt 2000; Moritzet al. 2000; Taberlet and Cheddadi 2002). It seems moreprobable that diversification is associated with the latter stag-es of the uplift of the Andes and the rise of Central America.In particular, it is thought that the northern and central Andeswere only half their present height at 10 million years ago,such that the diversification of these butterflies most likelycorresponds to a period of rapid uplift of the Andes (Gregory-Wodzicki 2000). The diversification of microclimates andhabitats that must have resulted from this geological activitymay have triggered the diversification of the Ithomia.
Conclusions
We aimed to investigate the hypothesis that mimicry ad-aptation has caused speciation in Ithomia butterflies, and con-trast this with the Pleistocene refuge hypothesis, which hasbeen commonly cited as an explanation for recent diversi-fication in the neotropics. A likelihood analysis of color pat-tern clearly shows an association between pattern change andcladogenesis. However, there are two caveats to this. First,speciation has also occurred without changes in pattern, es-pecially between the most recent sympatric species, showingthat color pattern does not explain all speciation events. Sec-ond, these comparative data show only an association and donot provide direct evidence for a causal relationship betweenpattern change and speciation. Nonetheless, color pattern waschosen a priori as a trait with a known role in reproductiveisolation in butterflies, so a causal relationship seems likely.This would imply a direct role for adaptive change in spe-ciation in Ithomia. Analysis of geographic overlaps throughtime show that the most closely related species are sympatricor parapatric, consistent with divergence driven by ecologicalchange with ongoing gene flow, although again an alternativeexplanation is that range movements have been very rapidsubsequent to speciation, obscuring the speciation signal. Fi-nally, the temporal pattern of diversification shows that mostspeciation happened before the Pleiostocene, thus ruling outa strict Pleistocene refuge model. In summary, the data pro-vide support for a model of speciation involving ecologicaladaptation, with most diversification having occurred signif-icantly before the Pleistocene.
ACKNOWLEDGMENTS
We thank S. Nee, N. Isaac, M. Beltran, M. Joron, M. Elias,and J. Mallet for comments and discussion of phylogenetictests for mimicry and speciation; G. Concheiro for help withthe geographic analysis; B. Fitzpatrick and J. Johnson forsharing their ArcView scripts for calculating range overlaps;and; A. Meade for alterations to the Bayes-MultiState pro-gram. We are also indebted to A. Brower, S. Muriel, L. Men-doza Cuenca, and J. Mallet for donation of specimens foranalysis; G. Lamas for access to the MUSM collection andinformation on Peruvian localities; P. Ackery for access tothe NHM collections; and F. Simpson for databasing NHMspecimen data. Permits for fieldwork were obtained from theMuseo Ecuatoriano de Ciencias Naturales and Ministerio delAmbiente, Quito, Ecuador, and Autoridad Nacionol del Am-biente in Panama. This work was funded by the SmithsonianTropical Research Institute, the Royal Society, the Lever-hulme Trust (KW and CJ), the National Geographic Society(KW) (Research and Exploration Grant 5751-96) and Na-tional Science Foundation (KW) (DEB 0103746).
LITERATURE CITED
Barraclough, T. G., and A. P. Vogler. 2000. Detecting the geo-graphical pattern of speciation from species- level phylogenies.Am. Nat. 155:419–434.
———. 2002. Recent diversification rates in North American tigerbeetles estimated from a dated mtDNA phylogenetic tree. Mol.Bio. Evol. 19:1706–1716.
Barraclough, T. G., J. E. Hogan, and A. P. Vogler. 1999. Testingwhether ecological factors promote cladogenesis in a group oftiger beetles (Coleoptera: Cicindelidae). Proc. R. Soc. Lond. B266:1061–1067.
Bates, H. W. 1862. Contributions to an insect fauna of the Amazonvalley. Lepidoptera: Heliconidae. Trans. Linn. Soc. Lond. 23:495–566.
Beccaloni, G. W. 1997. Ecology, behaviour and natural history ofithomiine butterflies (Lepidoptera: Nymphalidae) and their mim-ics in Ecuador. Trop. Lepid. 8:103–124.
Benson, W. W. 1982. Alternative models for infrageneric diversi-fication in the humid tropics: tests with passion vine butterflies.Pp. 608–640 in G. T. Prance, ed. Biological diversification inthe tropics. Columbia Univ. Press, New York.
Berlocher, S. H., and J. L. Feder. 2002. Sympatric speciation inphytophagous insects: moving beyond controversy? Annu. Rev.Entomol. 47:773–815.
Brower, A. V. Z. 1994. Rapid morphological radiation and con-vergence among races of the butterfly Heliconius erato inferredfrom patterns of mitochondrial DNA evolution. Proc. Nat. Acad.Sci USA 91:6491–6495.
Brower, A. V. Z., and E. G. Egan. 1997. Cladistic analysis of Hel-iconius butterflies and relatives (Nymphalidae: Heliconiiti): arevised phylogenetic position for Eueides based on sequencesfrom mtDNA and a nuclear gene. Proc. R. Soc. Lond B 264:969–977.
Brower, L. P. 1959. Speciation in butterflies of the Papilio glaucusgroup. II. Ecological relationships and interspecific sexual be-havior. Evolution 13:212–228.
Brown, K. S. 1979. Ecologia Geografica e Evolucao nas FlorestasNeotropicais. Universidade Estadual de Campinas, Campinas,Brazil.
———. 1981. The biology of Heliconius and related genera. Annu.Rev. Entomol. 26:427–456.
———. 1982. Historical and ecological factors in the biogeographyof aposematic Neotropical butterflies. Am. Zool. 22:453–471.
Cracraft, J., and R. O. Prum. 1988. Patterns and processes of di-versification: speciation and historical congruence in some neo-tropical birds. Evolution 42:603–620.

1465BUTTERFLY SPECIATION
Deering, M. D., and J. M. Scriber. 2002. Field bioassays showheterospecific mating preference asymmetry between hybridiz-ing North American Papilio butterfly species (Lepidoptera: Pap-illonidae). J. Ethol. 20:25–33.
Dittrich, W., F. Gilbert, P. Green, P. McGregor, and D. Grewcock.1993. Imperfect mimicry: a pigeons perspective. Proc. Roy. Soc.Lond. B 251:195–200.
Edwards, A. W. F. 1972. Likelihood. Cambridge Univ. Press, Cam-bridge, U.K.
Emerson, B. C., and N. Kolm. 2005. Species diversity can drivespeciation. Nature 434:1015–1017.
Endler, J. A. 1977. Geographic variation, speciation, and clines.Princeton Univ. Press, Princeton, NJ.
Fitzpatrick, B. M. 2002. Molecular correlates of reproductive iso-lation. Evolution 56:191–198.
Fitzpatrick, B. M., and M. Turelli. 2006. The geography of mam-malian speciation: mixed signals from phylogenies and rangemaps. Evolution 60:601–615.
Fjeldsa, J. 1994. Geographical patterns for relict and young speciesof birds in Africa and South America and implications for con-servation priorities. Biodiv. Conserv. 3:207–226.
Fordyce, J. A., C. C. Nice, M. L. Forister, and A. M. Shapiro. 2002.The significance of wing pattern diversity in the Lycaenidae:mate discrimination by two recently diverged species. J. Evol.Biol. 15:871–879.
Fox, R. M. 1940. A generic review of the Ithomiinae (Lepidoptera:Nymphalidae). Trans. Am. Entomol. Soc. 66:161–207.
Graham, C. H., S. R. Ron, J. C. Santos, C. J. Schneider, and C.Moritz. 2004. Integrating phylogenetics and environmental nichemodels to explore speciation mchanisms in dendrobatid frogs.Evolution 58:1781–1793.
Gregory-Wodzicki, K. M. 2000. Uplift history of the Central andNorthern Andes: a review. Geol. Soc. Am. Bull. 112:1091–1105.
Haber, W. A. 1978. Evolutionary ecology of tropical mimetic but-terflies (Lepidoptera: Ithomiinae). Ph.D. diss. Univ. of Minne-sota, Minneapolis, MN.
Haffer, J. 1977. Pleistocene speciation in Amazonian birds. Ama-zoniana 6:161–191.
Hall, J. P. W., and D. J. Harvey. 2002. The phylogeography ofAmazonia revisited: new evidence from riodinid butterflies. Evo-lution 56:1489–1497.
Hall, J. P. W., R. K. Robbins, and D. J. Harvey. 2004. Extinctionand biogeography in the Caribbean: new evidence from a fossilriodinid butterfly in Dominican amber. Proc. R. Soc. Lond. B271:797–801.
Hewitt, G. 2000. The genetic legacy of the Quaternary ice ages.Nature 405:907–913.
Hill, J. K., Y. C. Collingham, C. D. Thomas, D. S. Blakeley, R.Fox, D. Moss, and B. Huntley. 2001. Impacts of landscape struc-ture on butterfly range expansion. Ecol. Lett. 4:313–321.
Huelsenbeck, J. P., and F. Ronquist. 2001. MrBayes: Bayesian in-ference of phylogeny. Bioinformatics 17:754–755.
Isaac, N. J. B., K. E. Jones, J. L. Gittleman, and A. Purvis. 2005.Correlates of diversity in mammals: body size, life history andecology. Am. Nat. 165:600–607.
Jiggins, C. D., R. E. Naisbit, R. L. Coe, and J. Mallet. 2001. Re-productive isolation caused by colour pattern mimicry. Nature411:302–305.
Jiggins, C. D., I. Emelianov, and J. Mallet. 2004a. Pleiotropy pro-motes speciation: examples from phytophagous moths and mi-metic butterflies. Pp. 451–473 in M. Fellowes, G. Holloway, andJ. Rolff, eds. Insect evolutionary ecology. Royal EntomologicalSociety, London.
Jiggins, C. D., C. Estrada, and A. Rodrigues. 2004b. Mimicry andthe evolution of pre-mating isolation in Heliconius melpomene.J. Evol. Biol. 17:680–691.
Lamas, G. 2004. Ithomiinae. Pp. 172–191 in J. B. Heppner, ed.Atlas of Neotropical Lepidoptera. Checklist: Part 4A. Hesper-ioidea: Papilionoidea. Association for Tropical Lepidoptera/Sci-entific Publishers, Gainseville, FL.
Lederhouse, R. C., and J. M. Scriber. 1996. Intrasexual selectionconstrains the evolution of the dorsal color pattern of male black
swallowtail butterflies, Papilio polyxenes. Evolution 50:717–722.
Losos, J. B., and R. E. Glor. 2003. Phylogenetic comparative meth-ods and the geography of speciation. Trends Ecol. Evol. 18:220–227.
Lukhtanov, V. A., N. P. Kandul, J. B. Plotkin, A. V. Dantchenko,D. Haig, and N. E. Pierce. 2005. Reinforcement of pre-zygoticisolation and karyotype evolution in Agrodiaetus butterflies. Na-ture 436:385–389.
Lynch, J. D. 1989. The guage of speciation: on the frequency ofmodes of speciation. Pp. 527–553 in D. Otte and J. A. Endler,eds. Speciation and its consequences. Sinauer Associates, Sun-derland, MA.
Maddison, W. P., and D. R. Maddison. 1997. MacClade: analysisof phylogeny and character evolution. Sinauer Associates, Sun-derland, MA.
Mallarino, R., E. Bermingham, K. R. Willmott, A. Whinnett, andC. D. Jiggins. 2005. Molecular systematics of the butterfly genusIthomia (Lepidoptera: Ithomiinae): a composite phylogenetic hy-pothesis based on seven genes. Mol. Phylogenet. Evol. 34:625–644.
Maynard Smith, J. 1966. Sympatric speciation. Am. Nat. 100:637–650.
Moritz, C., J. L. Patton, C. J. Schneider, and T. B. Smith. 2000.Diversification of rainforest faunas: an integrated molecular ap-proach. Annu. Rev. Ecol. Syst. 31:533–563.
Muller, F. 1879. Ituna and Thyridia: a remarkable case of mimicryin butterflies. Trans. Entomol. Soc. Lond. 1879:xx–xxix.
Naisbit, R. E., C. D. Jiggins, and J. Mallet. 2003. Mimicry: devel-opmental genes that contribute to speciation. Evol. Dev. 5:269–280.
Nee, S., A. O. Mooers, and P. H. Harvey. 1992. Tempo and modeof evolution revealed from molecular phylogenies. Proc. Natl.Acad. Sci. USA. 89:8322–8326.
Pagel, M. 1994. Detecting correlated evolution on phylogenies: ageneral method for the comparative analysis of discrete char-acters. Proc. R. Soc. Lond. B 255:37–45.
Pagel, M., A. Meade, and D. Barker. 2004. Bayesian estimation ofancestral states on phylogenies. Syst. Biol. 53:673–684.
Paradis, E., J. Claude, and K. Strimmer. 2004. APE: analyses ofphylogenetics and evolution in R language. Bioinformatics 20:289–290.
Pybus, O. G., and P. H. Harvey. 2000. Testing macro-evolutionarymodels using incomplete molecular phylogenies. Proc. R. Soc.Lond. B 267:2267–2272.
Schluter, D. 2000. The ecology of adaptive radiation. Oxford Univ.Press, New York.
Schneider, C. J., T. B. Smith, B. Larison, and C. Moritz. 1999. Atest of alternative models of diversification in tropical rainfo-rests: ecological gradients versus rainforest refugia. Proc. Natl.Acad. Sci. USA 96:13869–13873.
Stride, G. O. 1957. Investigations into the courtship behaviour ofthe male of Hypolimnas misippus L. (Lepidoptera: Nymphalidae)with special reference to the role of visual stimuli. Bri. J. Anim.Behav. 5:153–167.
———. 1958. Further studies on the courtship behaviour of Africanmimetic butterflies. Anim. Behav. 6:224–230.
Taberlet, P., and R. Cheddadi. 2002. Quaternary refugia and per-sistence of biodiversity. Science 297:2009–2010.
Thomas, C. D., E. J. Bodsworth, R. J. Wilson, A. D. Simmons, Z.G. Davies, M. Musche, and L. Conradt. 2001. Ecological andevolutionary processes at expanding range margins. Nature 411:577–581.
Turner, J. R. G. 1976. Adaptive radiation and convergence in sub-divisions of the butterfly genus Heliconius (Lepidoptera: Nym-phalidae). Zool. J. Linn. Soc. 58:297–308.
———. 1977. Butterfly mimicry: genetical evolution of an adap-tation. Evol. Biol. 10:163–206.
Vane-Wright, R. I. 1978. Ecological and behavioural origins ofdiversity in butterflies. Pp. 56–70 in L. A. Mound and N. Waloff,eds. Diversity of insect faunas. Blackwell Scientific, Oxford,U.K.

1466 CHRIS D. JIGGINS ET AL.
———. 2004. Butterflies at that awkward age. Nature 428:477–478.Whinnett, A., M. Zimmermann, K. R. Willmott, N. Herrera, R.
Mallarino, F. Simpson, M. Joron, G. Lamas, and J. Mallet. 2005.Strikingly variable divergence times inferred across an Ama-zonian butterfly ‘‘suture zone.’’ Proc. R. Soc. Lond. B 272:2525–2533.
Zakharov, E. V., M. S. Caterino, and F. A. H. Sperling. 2004.Molecular phylogeny, historical biogeography, and divergencetime estimates for swallowtail butterflies of the genus Papilio(Lepidoptera: Papilionidae). Sys. Biol. 53:193–215.
Corresponding Editor: D. Funk