the performance of natural ventilation … · windcatcher over a wide range of geometries and wind...
TRANSCRIPT

1
THE PERFORMANCE OF NATURAL VENTILATION WINDCATCHERS IN
SCHOOLS: A COMPARISON BETWEEN PREDICTION AND MEASUREMENT
Benjamin M. Jones and Ray Kirby*
School of Engineering and Design,
Mechanical Engineering,
Brunel University, Uxbridge, Middlesex, UB8 3PH, UK.
* Corresponding author.
Address for correspondence:
Dr. Ray Kirby,
School of Engineering and Design,
Mechanical Engineering,
Brunel University,
Uxbridge,
Middlesex, UB8 3PH.
Email: [email protected]
Tel: +44 (0)1895 266687
Fax: +44 (0)1895 256392

2
ABSTRACT
Windcatchers are roof mounted devices that use the action of the wind to provide top down
natural ventilation to a room. Here, fresh air is channelled into a room whilst at the same
time stale air is drawn out of air room, providing a simple but attractive natural ventilation
methodology that is increasing in popularity in U.K. schools. However, an analysis of the
performance of Windcatchers has largely been limited to laboratory based measurements and
the use of CFD to generate predictions. Moreover, analysis is normally restricted to the
operation of an autonomous Windcatcher, whereas in reality a Windcatcher is likely to
operate in a building in which other sources of ventilation are present, an open window for
example, and this can significantly alter the performance of the Windcatcher. The aim of this
article is to provide a tool for estimating the performance of a Windcatcher from basic data
that is typically available to the engineer in the building design phase. Accordingly, the
methodology uses data that one could reasonably be expected to have for a building’s
performance prior to estimating the behaviour of the Windcatcher. This article also reviews
the ventilation performance of Windcatchers operating in situ by measuring their
performance in U.K. schools both with and without open windows. Predictions generated by
a semi-empirical model are then compared against measurement data and this is shown to
deliver generally good agreement between the two, both with and without open windows,
provided the theoretical predictions are presented in terms of an upper and lower performance
limit. Furthermore, both experiment and theory clearly demonstrate that a large increase in
the Windcatcher ventilation rate is possible if one combines the operation of a Windcatcher
with, say, an open window, and that this ventilation rate is greater than that which would be
achievable from a window operating on its own.

3
1. INTRODUCTION
A Windcatcher1 is a roof mounted device that is used to channel fresh air into a room whilst
simultaneously drawing stale air out of the room. The Windcatcher works through the action
of the wind generating a high pressure on a windward face, forcing fresh air into the room,
and turbulence creating a low pressure region on the leeward face, drawing air out of the
room. Thus, Windcatchers provide an alternative natural ventilation strategy when compared
to more usual methods such as opening windows, or passive stacks. Of course,
understanding the performance of a Windcatcher is very important if one is to successfully
integrate a Windcatcher into the ventilation strategy for a building; however, very little data
currently exists in the literature that quantifies the performance of these devices when
operating in situ. Furthermore, whilst it is possible for a Windcatcher to operate
autonomously, it is common in the summer months for them to be used in conjunction with
other methods of ventilation, such as open windows. Accordingly, this article will address
both of these issues by reporting new experimental data that quantifies the performance of a
Windcatcher operating in situ, both with and without open windows. To better understand
the measured behaviour, the semi-empirical model of Jones and Kirby (2009) is also
extended here to include the effects of openable windows.
A review of Windcatcher operation and performance was recently provided by Jones and
Kirby (2009). Here, Jones and Kirby note that the majority of the work on Windcatchers
published in the literature centres on theoretical and experimental studies under laboratory
conditions. For example, Elmualim and Awbi (2002) used a wind tunnel to measure
important Windcatcher parameters such as the coefficient of pressure (��) for each face and
the losses incurred within the Windcatcher itself. Elmualim (2006), and Li and Mak (2007)
1 Windcatcher™ is a proprietary product of Monodraught Ltd.

4
discuss the use of CFD models to predict �� values, as well as quantifying ventilation rates
delivered by a Windcatcher as a function of the incident wind speed. Clearly, it is desirable
to be able to predict the performance of a Windcatcher at the design stage of a building.
Accordingly, Jones and Kirby (2009) proposed the use of a single semi-empirical model that
avoids the use of complex and time consuming CFD calculations by utilising laboratory
based measurements of the loss coefficients and ��. This empirical data is then combined
with analytic expressions that enforce conservation of energy and mass in order to deliver a
simple set of equations for estimating Windcatcher ventilation rates. However, a
disadvantage of this approach is that it is based on empirical data measured under laboratory
conditions and so any errors in these measurements will be transferred into the model.
Moreover, the parameters measured under laboratory conditions may not accurately reflect
the actual values encountered when the Windcatcher operates in situ. Therefore, it is
important to validate theoretical predictions against in situ measurements and here Jones and
Kirby (2009) noted that very little experimental data exists in the literature that quantifies in
situ Windcatcher performance: the only data identified as suitable for comparison with their
semi-empirical model were the measurements obtained by Kirk and Kolokotroni (2004) for
office buildings. Jones and Kirby note generally good agreement between prediction and
measurement provided the predictions for ventilation rates were expressed in terms of
limiting values so that wind travelling normal to the Windcatcher generates the maximum
predicted ventilation rates and wind travelling at an angle of 45° generates a minimum
ventilation rate. However, Kirk and Kolokotroni (2004) only measured a small number of
ventilation rates and it is clear that further in situ measurements are necessary in order to
build up a more accurate and reliable picture of the true ventilation performance of a
Windcatcher over a wide range of geometries and wind speeds. Accordingly, this article
delivers new experimental data that quantifies the ventilation rates generated by a

5
Windcatcher in four different buildings. The test buildings chosen here are schools, primarily
because schools currently represent a large part of the U.K. Windcatcher market, but they
also provide excellent case studies because of their predictable occupancy patterns, long
vacation periods allowing for more detailed analysis, and clearly defined indoor air quality
(IAQ) benchmarks against which performance may be judged.
An investigation into the use of Windcatchers operating in situ also requires one to take
account of normal custom and practice within the building. Here, it is common for windows
also to be left open in a room that contains a Windcatcher, especially in the summer months.
Kolokotroni et al. (2002a), and later Kirk and Kolokotroni (2004) note that opening windows
increases ventilation rates by up to 87% when compared to those rates provided by a
Windcatcher on its own. This increase in performance was also observed by Su et al. (2008),
who use CFD predictions to demonstrate a significant increase in net ventilation rates when
combining a single opening in a façade with a circular Windcatcher. This represents a
significant improvement in ventilation performance and also offers the potential to improve
on rates achieved by alternative natural ventilation strategies. For example, the reliance on
manually opening windows in school classrooms often fails to deliver required ventilation
rates, see Beisteiner and Coley (2002) and Coley and Beisteiner (2002). In addition,
Mumovic et al. (2009) monitored 18 classrooms in nine schools over five days during the
winter time, with ventilation strategies that included natural, mechanical, and mixed mode;
results show that six classrooms exceeded the required mean CO2 levels (an indicator of poor
ventilation rates) and all of these used a natural ventilation strategy based upon windows
only. Clearly, Mumovic et al. and others have identified problems with a natural ventilation
strategy based solely on opening windows and that such a strategy is unlikely to suffice for
modern school designs. However, the combination of a passive stack with windows is shown

6
by Kolokotroni et al. (2002b) to provide more consistent ventilation rates for a range of
environmental and meteorological conditions. Accordingly, the combination of a
Windcatcher and open windows appears capable of significantly improving ventilation rates
and delivering those rates typically required by building regulations in the U.K., and so this
article will examine this effect in detail through the use of theoretical predictions and
experimental measurements.
This article begins by extending the semi-empirical model of Jones and Kirby (2009) to
include the effects of an opening (nominally a window) in a single façade of a room that also
employs a Windcatcher. In Section 3, the empirical constants necessary for the model will be
discussed and a preliminary parametric investigation into the behaviour of the system will be
undertaken. In Section 4 the experimental methodology is introduced and in Section 5 the
semi-empirical model is validated against measured data.
2. THEORY
The semi analytic model used here is a development of the one described by Jones and Kirby
(2009) and so is restricted to Windcatchers with a rectangular cross-section divided up into
four quadrants. Here, the Windcatcher is subjected to a wind of velocity of wu incident at an
angle of θ degrees to the front face, see Fig. 1a. Each quadrant contains louvers at the top,
with dampers and a grill placed at the bottom, see Fig. 1b. The Windcatcher has cross-
sectional dimensions 21 dd × , the length of the louver section is IL and the length of the duct
from the louvers to the grill is L. For a quadrant that faces into the wind (an “inlet”
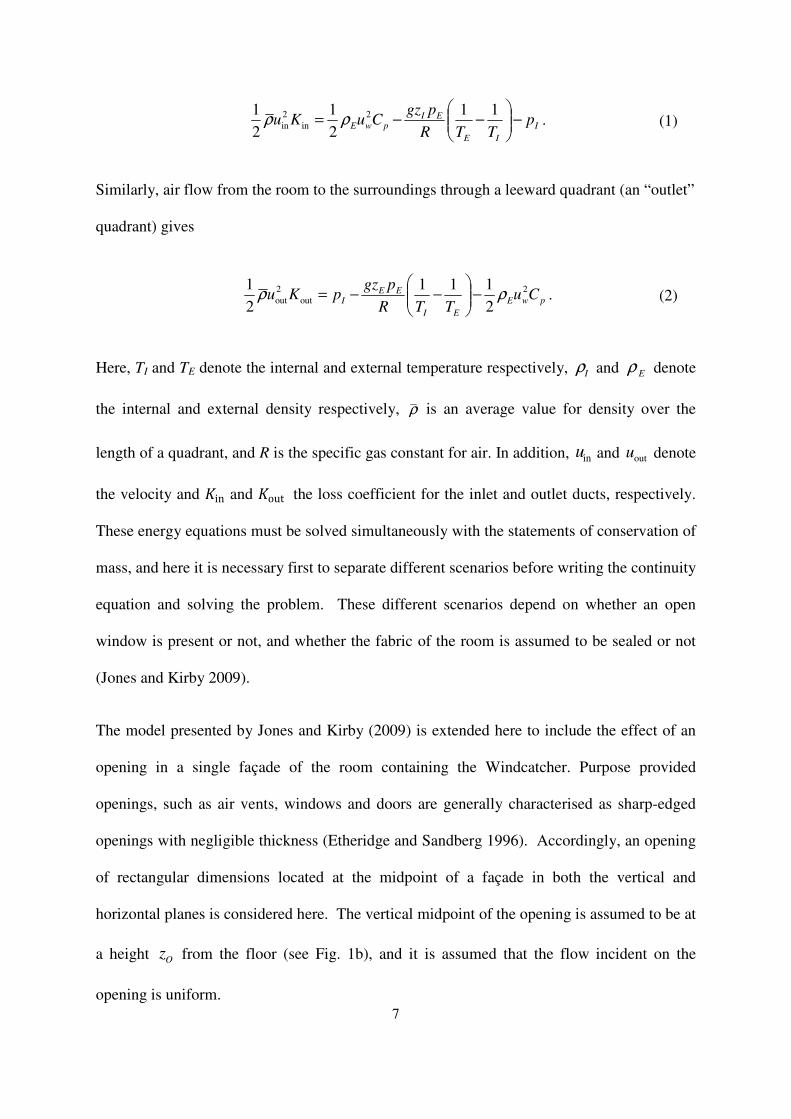
quadrant), air flows from the surroundings into the room and conservation of energy gives
7
I
IE
EIpwE p
TTR
pgzCuKu −
−−=
11
2
1
2
1 2
in
2
in ρρ . (1)
Similarly, air flow from the room to the surroundings through a leeward quadrant (an “outlet”
quadrant) gives
pwE
EI
EEI Cu
TTR
pgzpKu
2
out
2
out2
111
2
1ρρ −
−−= . (2)
Here, TI and TE denote the internal and external temperature respectively, Iρ and Eρ denote
the internal and external density respectively, ρ is an average value for density over the
length of a quadrant, and R is the specific gas constant for air. In addition, inu and outu denote
the velocity and �in and �out the loss coefficient for the inlet and outlet ducts, respectively.
These energy equations must be solved simultaneously with the statements of conservation of
mass, and here it is necessary first to separate different scenarios before writing the continuity
equation and solving the problem. These different scenarios depend on whether an open
window is present or not, and whether the fabric of the room is assumed to be sealed or not
(Jones and Kirby 2009).
The model presented by Jones and Kirby (2009) is extended here to include the effect of an
opening in a single façade of the room containing the Windcatcher. Purpose provided
openings, such as air vents, windows and doors are generally characterised as sharp-edged
openings with negligible thickness (Etheridge and Sandberg 1996). Accordingly, an opening
of rectangular dimensions located at the midpoint of a façade in both the vertical and
horizontal planes is considered here. The vertical midpoint of the opening is assumed to be at
a height Oz from the floor (see Fig. 1b), and it is assumed that the flow incident on the
opening is uniform.

8
For the opening, the flow of air around the building induces a change in pressure on each
façade so that those openings with wind incident on them will have a pressure higher than the
room, whilst those in the wake/leeward regions will have a lower pressure because of energy
dissipation through flow separation and turbulence. If the façade opening (designated the 5th
opening in Fig. 1b) is in an area of positive pressure then conservation of energy gives
2 2
5 5 5
1 1 1 1
2 2
O EE E w p I
E I
gz pu K u C p
R T Tρ ρ
= − − −
% . (3)
It is convenient here to refer the incident wind velocity at the opening back to the wind
velocity at room level that is used for the Windcatcher computations. This may readily be
achieved using the correction equation of Liddament (1996), and writing
��� = ������ ��⁄ ���, (4)
where a is a topographically dependent constant. If the opening is in an area of negative
pressure, then
5
2 2
5 5
1 1 1 1
2 2
O EI I E w p
E I
gz pu K p u C
R T Tρ ρ
= + − −
% . (5)
The continuity equation is given by
� ��� = 0�
���, (6)
where �� is the volume flow rate. The equations reduce to a series of simultaneous equations
that must be solved iteratively, which has been discussed previously by Jones and Kirby

9
(2009). This semi-empirical model now allows quick estimations to be made of the
ventilation rate through a room ventilated by a Windcatcher with and without façade
openings. This makes it a very useful iterative design tool when considered against
alternative prediction methods such as CFD. The time taken to generate and solve CFD
models can be prohibitive for some applications if one needs a quick, easy, and reliable
indication of Windcatcher performance; for example, fast calculations are often required in
commercial applications.
3. SEMI-EMPIRICAL MODEL
The theoretical model developed in the previous section depends on a knowledge of the loss
coefficients for each inlet and outlet quadrant, which we shall call here Kin and Kout, as well as
the coefficient of pressure for each face of the Windcatcher and the coefficient of pressure for
the façade where the opening is located. Once these factors have been identified they may be
substituted back into the theoretical model to form the semi-empirical approach. Loss factors
for the Windcatcher were identified as �in = 4.30 + �frict , and �out = 8.85 + �frict by Jones
and Kirby (2009), where Kfrict represents the frictional losses imparted by the walls of each
quadrant, such that 0.06frict H
K L d= with Hd being the hydraulic diameter of the duct.
Losses through a sharp-edged façade opening are shown by Karava et al. (2004) to be a
function of its shape and location within the façade, the wind angle of incidence, and a
Reynolds Number Re (based on Hd for the opening). Etheridge and Sandberg (1996) show
that if Re is high (>>100) losses for a sharp-edged opening can be represented by a single
discharge coefficient, which may be shown to vary from 0.60dC = to 0.65dC = (Karava et
al. 2004). Alternatively, CIBSE (2006) suggests a discharge coefficient of 0.61dC = , which

10
correlates to a loss factor of 5 2.69K = . Accordingly, this latter value will be used in the
semi-empirical model that follows as it fits both sets of data, although it is likely that this
value is only an approximation of the actual in-situ loss factor.
The pC values used for each face of the Windcatcher, and for
o0θ = and o45θ = , are
summarised in Table 1. These have been obtained from measurements made using a 500 mm
square Windcatcher in a wind-tunnel and verified using CFD, see Jones and Kirby (2009) for
further discussion. The magnitude of 5pC for the façade of a building is a function of the
geometry of the building, the angle of the wind incident to the façade, and the topography
surrounding the building. Estimations of 5pC are commonly made from wind tunnel analysis,
but can also be made using predictive software, see for example Sawachi et al (2006). Values
of 5pC covering
o0θ = to o315θ = , for intervals of
o45θ = , are given in several sources and
Liddament (1996), Orme and Leksmono (2002), and Santamouris and Asimakopoulos (1996)
all quote similar values for buildings with an aspect ratio (length to width) of 1:1 and 2:1.
Here, a range of 5pC values may be obtained depending on the location of the façade and so
limiting values appropriate to the facades in the buildings studied here are chosen as -0.38
and 0.06. These values are for a building with an aspect ratio of 2:1 and are based upon the
assumptions that the opening is located within the longest wall of the building and that the
angle of incidence of the wind to the façade varies from 0° to 315°. The value of ��� = 0.06
corresponds to a façade placed on a windward wall; ��� = −0.38 corresponds to a leeward
wall. Although the school buildings measured here have aspect ratios greater than 2:1, these
5pC values are for the maximum aspect ratio covered in the literature. Furthermore, those
values chosen also take into account that the school buildings in Table 2 are surrounded by
11
obstacles equivalent to their full height, such that aerodynamic flow fields from them and any
surrounding buildings or obstacles will interact.
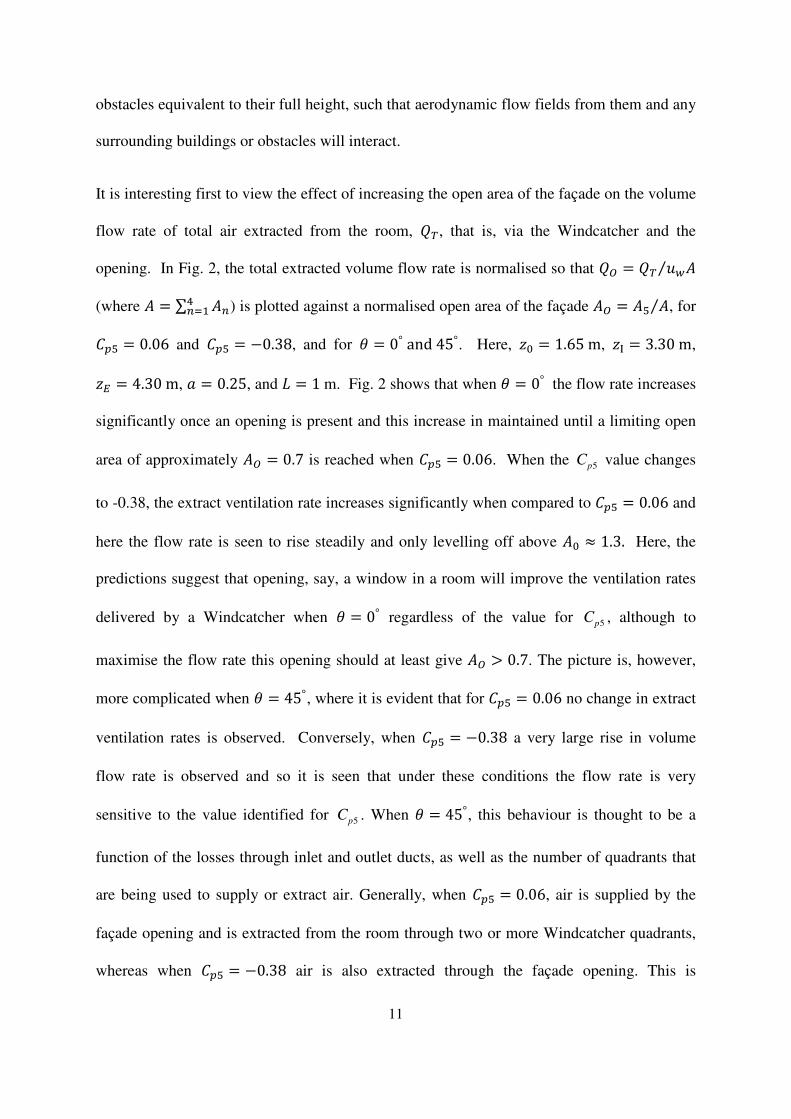
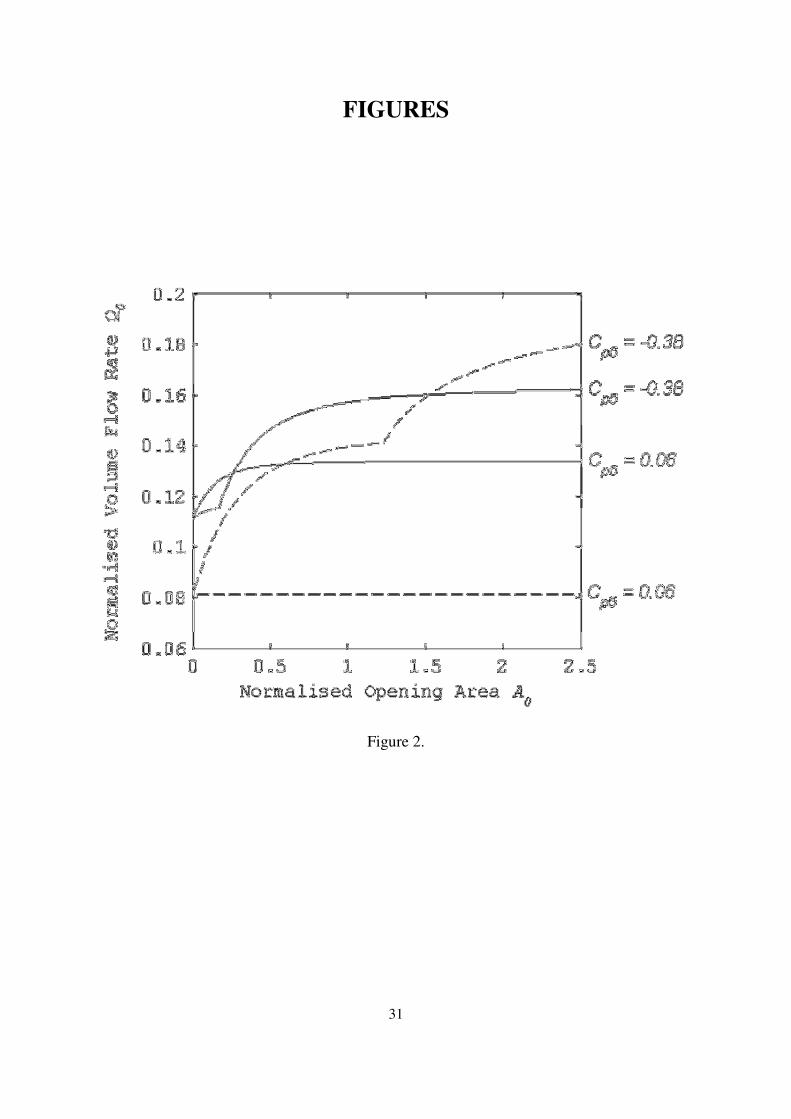
It is interesting first to view the effect of increasing the open area of the façade on the volume
flow rate of total air extracted from the room, �*, that is, via the Windcatcher and the
opening. In Fig. 2, the total extracted volume flow rate is normalised so that �� = �* +,-⁄
(where - = ∑ -�/��� ) is plotted against a normalised open area of the façade -� = -� -⁄ , for
��� = 0.06 and ��� = −0.38, and for 0 = 0° and 45°. Here, �4 = 1.65 m, �7 = 3.30 m,
�� = 4.30 m, 8 = 0.25, and : = 1 m. Fig. 2 shows that when 0 = 0° the flow rate increases
significantly once an opening is present and this increase in maintained until a limiting open
area of approximately -� = 0.7 is reached when ��� = 0.06. When the 5pC value changes
to -0.38, the extract ventilation rate increases significantly when compared to ��� = 0.06 and
here the flow rate is seen to rise steadily and only levelling off above -4 ≈ 1.3. Here, the
predictions suggest that opening, say, a window in a room will improve the ventilation rates
delivered by a Windcatcher when 0 = 0° regardless of the value for 5pC , although to
maximise the flow rate this opening should at least give -� > 0.7. The picture is, however,
more complicated when 0 = 45°, where it is evident that for ��� = 0.06 no change in extract
ventilation rates is observed. Conversely, when ��� = −0.38 a very large rise in volume
flow rate is observed and so it is seen that under these conditions the flow rate is very
sensitive to the value identified for 5pC . When 0 = 45°, this behaviour is thought to be a
function of the losses through inlet and outlet ducts, as well as the number of quadrants that
are being used to supply or extract air. Generally, when ��� = 0.06, air is supplied by the
façade opening and is extracted from the room through two or more Windcatcher quadrants,
whereas when ��� = −0.38 air is also extracted through the façade opening. This is

12
significant because the losses through a Windcatcher are greater when flow is from the room
to the surrounding than when flow is from the surroundings into the room (�>?@ ≫ �B�), and
because losses are significantly less through the opening (�>?@ > �B� ≫ ��) than through any
Windcatcher quadrant. Therefore, when 0 = 0° and ��� = 0.06, the façade opening supplies
air and three Windcatcher quadrants extract air from the room, but when 0 = 45° only two
quadrants extract air, thus reducing the overall area of the extract quadrants and significantly
reducing the extracted volume flow rate. When ��� = −0.38 and 0 = 45° all of the
Windcatcher quadrants supply air into the room and this effectively overrides the normal
function of the Windcatcher reducing overall losses and maximising the ventilation rate.
The influence of internal and external temperatures on the extracted volume flow rate is
presented in Fig. 3 for a 1000 mm square Windcatcher, where -� = 1 m�, ∆C = C>?@ −
CB� = 5℃, and 45θ = o
(all other data is the same as for Fig. 2). Figure 3 shows that as the
wind speed increases, the buoyancy forces are less significant. When +, < 1.3 m/s, Fig. 3
shows that the estimates of volume flow rate with and without buoyancy forces diverge,
suggesting that the buoyancy forces are an important consideration at low incident wind
velocity for any value of Cp5. This is similar to the findings of Jones and Kirby (2009) for an
autonomous Windcatcher, where the effect of buoyancy is found only to be significant for
2wu m s< . However, Fig. 3 shows that as the magnitude of Cp5 increases the predictions of
volume flow rate with and without buoyancy forces cannot be said to be similar, and so
should be considered whatever the wind velocity.
The accuracy of the ventilation rate predictions for a room containing both a Windcatcher and
an opening depends on the constants used for the opening, namely 5K and 5pC% . Here,
varying 5K by 10% had no discernable effect on the predicted ventilation rates, suggesting

13
that any inaccuracies in the value used will not significantly affect the behaviour observed
here. The variable 5pC% contains two constants, a and 5p
C . Of these, 5pC is the most
problematic and Fig. 4 shows the affect of varying this parameter for three different values of
-� when 0 = 45°. Note that the plot is not symmetric because the losses in the inlet and
outlet ducts of the Windcatcher are dissimilar (as discussed earlier), and this is why the model
predicts greater ventilation rates when the opening is placed in an area of negative pressure.
This observation does not agree with the CFD predictions of Su et al. (2008), who show that
when a circular Windcatcher is mounted on the apex of a 30° pitched roof on a square
exposed building, the opening located on the windward façade delivers the greatest
ventilation rates. However, the crucial factor here is that Su et al. (2008) examine an exposed
building and Liddament (1996) reports that a windward façade of an exposed building has the
greatest magnitude of ���, and the value one would expect under these conditions is ��� =
0.7. Accordingly, running the model developed here with data for an exposed building does
deliver a greater extract volume flow rate for the windward face (results not shown here), in
accordance with the findings of Su et al. (2008). It is evident in Fig. 4, however, that the
volume flow rate is sensitive to the values chosen for 5pC , for example if 5 0.38
pC = − is
varied by 10%± when -� = 1.5 m�, the predicted ventilation rate changes by approximately
7%± . Thus, the model is sensitive to the values chosen for 5pC and so the accuracy of the
semi-empirical predictions that follow in Section 4 will depend on the suitability of the value
chosen for 5pC for the particular building that is being measured. Of course, accurately
identifying this value for individual buildings and for different climatic conditions presents a
considerable challenge and this represents a limitation of the semi-empirical approach.

14
4. EXPERIMENT
Four schools and twelve classrooms are chosen here to investigate the performance of a
Windcatcher. Within each school a number of classrooms ventilated by a single roof-
mounted Windcatcher have been identified. At roof level each Windcatcher is free from
obvious shielding caused by external obstacles or architectural features and each Windcatcher
element measured has a square cross-section. In addition, none of the classrooms contain
supplementary mechanical supply or extract ventilation. The relevant parameters of the
Windcatchers used in this study are given in Table 2. Values quoted in this table for the cross
sectional area (CSA) of each Windcatcher quadrant takes into account the presence of an
acoustic lining, which is normally made from foam and covers the duct walls and the
diagonal dividers (see Fig. 1a). Each school is assigned an alphabetical prefix in Table 2 and
each classroom monitored within a school is given a numerical suffix. All of the school
buildings have been completed since 2003 and are located in urban areas in the south of
England. At school F all of the windows are sealed, but at the other schools some or all of the
windows may be opened manually and the estimated maximum openable area ( 5A ) for these
windows is calculated using CIBSE guidelines (CIBSE, 2005).
A total of 56 measurements were made with the Windcatcher open and all windows closed,
and 19 measurements were made with both the Windcatcher and windows open. These
measurements were undertaken in empty classrooms during normal occupied hours and
throughout the year in order to test a range of different environmental conditions. Ventilation
rates were measured using the standard single-zone tracer gas decay method, see for example
Etheridge and Sandberg (1996), and Liddament (1996). Sulphur hexafluoride (SF6) was used
as the tracer gas and was only applied to the classroom, and not any adjacent rooms or

15
corridors. Mixing fans were used to ensure an even distribution of SF6 throughout the room,
but were not used during the measurements because they are thought to initiate artificial flow
paths (Liddament 1996). The SF6 was measured every 45 seconds by an Innova 1312 dual
gas analyser that has a reading repeatability of 1%. Measurements were taken from the centre
of the room for periods of no less than 20 minutes and an estimation of the air change rate
(ACR) was made by plotting the tracer gas concentration against time in accordance with
Liddament (1996), see Figure 5. Note that the single zone gas decay method used here does
not measure the rate of air flow though the Windcatcher, rather it measures the ventilation
rate for the room and may also include airflow between the room and corridors. Here,
Sherman (1990) suggests that ±10% is a reasonable assumption of the overall error in the
measured ventilation rate, whilst Persily (2006) finds that typical field measurements have
uncertainties of at least ±20%. Accordingly, the error bars in Figs. 6–8 show a 20% margin
of error. The wind direction and speed were obtained from the Met Office (2009) for the
weather station closest to each school and converted to an estimated velocity, uw at a
Windcatcher height of zE with terrain coefficients of 0.35k = and 0.25a = .
5. RESULTS AND DISCUSSION
The semi-empirical model is now compared against the experimental measurements to
determine its suitability for use in the design of a natural ventilation strategy that incorporates
a Windcatcher. Two cases are considered: the first is for a Windcatcher functioning
autonomously since very little data currently appears in the literature for this device, and the
second is for a Windcatcher in coordination with a single façade opening. For a Windcatcher
operating autonomously the predicted and measured room ventilation rates are presented for
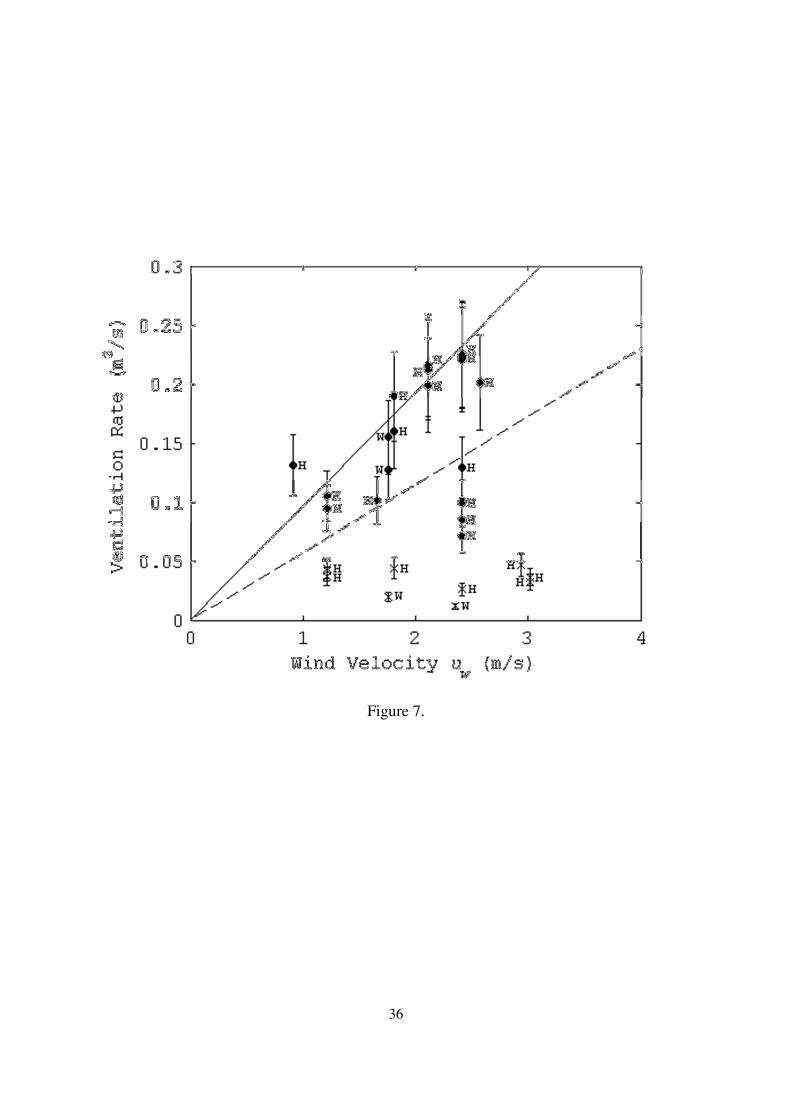
800 mm and 1000 mm square Windcatchers in Figs. 6 and 7, respectively. Here, the duct

16
length is set to : = 1 m in the model because Jones and Kirby (2009) show that an increase
in duct length from 1 m to 10 m has a minimal effect on the predictions. However, the
measured ventilation rates are separated in Figs. 6 and 7 into dots for : = 1 m and crosses for
: > 1 m. Here, it is immediately obvious that the measured ventilation rates for those
Windcatchers with : > 1 m are much lower than the rates measured when : = 1 m. One
possible explanation for this behaviour is that for Windcatchers with 1 mL > the diagonal
partition extends from the upper louvered element only to about 1m below it, and not for the
whole length of the duct. Thus, the model does not fully replicate the geometry of this type of
Windcatcher, but more importantly it is possible that so-called “short circuiting” is taking
place here, whereby a mixing of air is taking place in the lower half of the Windcatcher and
that this is restricting the flow of air from the room through the outlet quadrants. Further
evidence for this is provided by the CFD analysis of Hughes and Ghani (2008, Figs. 10 and
13).
The predictions presented in Figs 6 and 7 follow the method of Jones and Kirby (2009) and
so two lines are drawn, one for 0 = 0° and one for 0 = 45°. This forms a “wedge” that is
intended to encompass two extremes of operation for the Windcatcher, depending on the
incident wind conditions: 0 = 0° represents the maximum ventilation rate and 0 = 45° the
minimum. In Fig. 6, 40% of the measured data lies within this wedge if one ignores data for
: > 1m, whereas in Fig. 7 this figure is 60%. Here, it is noted that the predictions are
generally reasonable correlation with the experimental data given the complexity of the
problem and support the observations of Jones and Kirby (2009), who compared their results
against data supplied by Kirk and Kolokotroni (2004); however, some of the measured data
clearly shows that the Windcatcher is under-performing when compared to the predictions,
especially for the 800 mm square Windcatcher. The reasons for this are not fully understood,

17
although it is possible that the external wind conditions estimated from the Met. Office data
did not accurately represent the true local conditions when the measurements took place.
Alternatively, it is possible that some operational issues with the Windcatcher have occurred
and that further investigation is necessary. Nevertheless, the action of the Windcatcher and
its ability to act autonomously in the generation of ventilation in a room is clearly evident in
Figures 6 and 7.
Predicted ventilation rates are now compared against measured data for a Windcatcher
operating in combination with open windows. In this case, the number of variables in the
semi-empirical model is greater than seen for an autonomous Windcatcher and so in order to
quantify the predicted limits of Windcatcher performance in the form of the “wedge” seen in
Figs. 6 and 7, it is necessary to make the following (limiting) assumptions: (i) for 5A the
maximum openable window area is used, (ii) the maximum ventilation rate is predicted when
0 = 45° and 5 0.38p
C = − , and the minimum ventilation rate is when 0 = 45° and 5 0.06p
C =
(see Fig. 2), and (iii) the effects of buoyancy are not included because of the wide variation of
the difference between measured internal and external temperatures (mean difference of
0.84°C with a standard deviation σ = 5°C). Furthermore, a statistical analysis (not detailed
here) showed no link between the measured ventilation rates and the difference between
internal and external temperatures. In contrast, the measured ventilation rates were obtained
with openable window areas ranging from 2
5 = 0.4 mA to 2
5 0.9 mA = for a classroom
containing a 1000 mm square Windcatcher, and from 2
5 = 0.3 mA to 2
5 1.8 mA = for a
classroom containing a 800 mm square Windcatcher. Accordingly, the “wedge” is used to
identify the predicted operating envelope for the Windcatcher with the expectation that the
measurements should lie within the wedge.

18
In Fig. 8, measured and predicted ventilation rates are presented for 800 mm and 1000 mm
square Windcatchers operating in combination with open windows. It is evident here that the
predictions for the 800 mm and 1000 mm Windcatchers are similar, although it is not
surprising to see the 1000 mm Windcatcher delivering a higher ventilation rate. For the
experimental data, Fig. 7 shows that the 13 measurements for a 800 mm Windcatcher are
more widely dispersed than the 6 measurements for a 1000 mm Windcatcher. It is, however,
evident that when the windows are open the predictions are less successful and here it is
common for the theory to under-predict the ventilation rates. This is in contrast to the
previous example in which the over-prediction of ventilation rates was common for an
autonomous Windcatcher. It is, therefore, likely that the under-prediction seen in Fig. 8 is
caused by an under-estimation of the ��� values used in the model. What is clear, however,
is that opening a window, or windows, has the potential to significantly increase the
ventilation rate in the classrooms studied here and the under-performance seen in Figs. 6 and
7 has largely been eliminated.
To further illustrate the influence of opening windows it is constructive to compare the
measurements with and without the open windows. Accordingly, in Fig. 9 all of the
measured ventilation rates are compared on a single plot. Here, ventilation rates are seen to
increase significantly when a Windcatcher is used in combination with an open window.
Interestingly, the measured volume flow rates for a Windcatcher with closed windows do not
exceed 0.23 m� , and appear to plateau when +, ≥ 2 m s⁄ . This is not predicted by the model
and the cause of this is unclear, but it may be a function of the internal dynamics of the
Windcatcher or an environmental problem such as roof level turbulence.
Figures 8 and 9 clearly demonstrate that opening a window as well as the Windcatcher
significantly increases the ventilation rates in a classroom, however it is important to be sure

19
that this is caused by the action of the window and Windcatcher working together and cannot
be obtained with a window acting on its own. Accordingly, to investigate this further,
specific tests were conducted in classrooms C1, D1, and G1 whereby the ventilation rate
through the maximum openable window area was measured with the Windcatcher ducts
closed. Results obtained indicate that volume flow rates were, on average, 32% less than
those ventilation rates obtained with the windows and Windcatcher operating together. They
show that the ventilation rates provided by these windows on their own were greater than
those measured by Beisteiner and Coley (2002), Coley and Beisteiner (2002), and Mumovic
et al. (2009), and this may be a function of their type, see Table 2. However, the results
indicate that, despite the improved individual performance of these windows, Windcatchers
are still capable of significantly increasing ventilation rates when combined with the
windows. Therefore it is evident that this configuration could be used to achieve high levels
of ventilation through a room in order to deliver good IAQ levels, as well as dissipate large
heat gains and provide purge ventilation. For example, the purge ventilation requirement for a
U.K. school classroom with 30 occupants is 0.24 mI s⁄ (DfES 2006). In order to meet this
flow rate using an 800 mm square Windcatcher, then if we choose, for example, +, = 3 m s⁄ ,
Fig. 2 indicates that an opening of area -� = 0.09 m� is necessary. Therefore, this suggests
that the requirement can be met with a relatively small open area. Ventilation performance
can be improved if the building is located in a terrain with few obstacles or surrounding
buildings, and Fig. 4 shows that for a given ��� value the windows should be located so that
their orientation is normal or leeward to the prevailing wind, and are, therefore, in an area of
negative pressure; however what is important here is the magnitude of ��� and so it is
preferable to open windows that maximise this value and here the appropriate window will
depend on the topography of the building as well as the prevailing wind conditions.
20
5. CONCLUSIONS
This paper has detailed a tool for estimating the performance of a Windcatcher from basic
data that is typically available to the engineer in the building design phase. The methodology
uses only data that one could reasonably be expected to have for a building’s performance
prior to estimating the behaviour of the Windcatcher.
The theoretical predictions and experimental measurements presented here demonstrate that a
Windcatcher is capable of delivering ventilation for a room when acting autonomously
provided that a number of design criteria are met. The semi-empirical predictions generally
show good agreement with the in situ measurements. This further supports the observations
in a previous paper by Jones and Kirby (2009) that this semi-empirical model is capable of
capturing the performance of a Windcatcher. However, when operating autonomously
Windcatcher ventilation rates are sometimes over-predicted and significant scatter in the
experimental data is observed. Accordingly, it appears sensible to view the semi-empirical
model as an estimation of Windcatcher performance over a period of time rather than
expecting these predictions to accurately replicate ventilation rates for a particular day. The
relatively poor performance of Windcatchers with long duct sections was, however, not
predicted and here some further investigation into the operation of these devices appears to be
necessary.
Both theory and experiment clearly demonstrate that Windcatcher ventilation rates can be
significantly improved by the addition of open windows. Here, results indicate that
ventilation rates are increased by an average of 47% with the addition of open windows. This
effect is likely to help rooms with Windcatchers to meet ventilation standards for buildings,
for example BB101 in the U.K. (DfES 2006). Of course, the opening of windows is only

21
practicable in the summer months and one must be careful that “drafts” do not annoy the
building’s occupants, however the findings presented here clearly demonstrate the potential
of a properly designed top-down natural ventilation system to deliver the ventilation
requirements for a school classroom.
ACKNOWLEDGEMENTS
This research was carried out with financial support from the Engineering and Physical
Sciences Research Council (EPSRC) and Monodraught Ltd.

22
REFERENCES
Beisteiner A and Coley DA (2002). Carbon Dioxide Levels and Summertime Ventilation
Rates in UK Schools. International Journal of Ventilation 1(3): 181-187.
Coley DA and Beisteiner A (2002). Carbon Dioxide Levels and Ventilation Rates in Schools.
International Journal of Ventilation 1(1): 45-52.
CIBSE (2006). Guide A - Environmental Design. CIBSE Publications, London.
CIBSE (2005). AM10 - Natural Ventilation in Non-Domestic Buildings. CIBSE Publications,
London.
DfES (2006). Building Bulletin 101 - Ventilation of School Buildings. Department for
Education and Skills, London.
Elmualim AA (2006). Dynamic Modelling of a Wind Catcher/Tower Turret for Natural
Ventilation. Building Services Engineering Research and Technology 27(3): 165-182.
Elmualim AA and Awbi HB (2002). Wind Tunnel and CFD Investigation of the Performance
of Windcatcher Ventilation Systems. International Journal of Ventilation 1(1): 53-64.
Etheridge D and Sandberg M (1996). Building Ventilation: Theory and Measurement. John
Wiley and Sons.
Hughes BR and Ghani SAAA (2008). Investigation of a Windvent Passive Ventilation
Device Against Current Fresh Air Supply Recommendations. Energy and Buildings
40(9): 1651-1659.

23
Jones BM and Kirby R (2009). Quantifying the Performance of a Top-Down Natural
Ventilation Windcatcher™. Building and Environment 44(9): 1925-1934.
Karava P, Stathopoulos T and Athienitis AK (2004). Wind Driven Flow through Openings –
A Review of Discharge Coefficients. International Journal of Ventilation 3(3): 255-
266.
Kirk S and Kolokotroni M (2004). Windcatchers in Modern UK Buildings: Experimental
Study. International Journal of Ventilation 3(1): 67-78.
Kolokotroni M, Ayiomamitis A and Ge YT (2002a). The Suitability of Wind Driven Natural
Ventilation Towers for Modern Offices in the UK: A Case Study. World Renewable
Energy Congress, Cologne, Germany.
Kolokotroni M, Ge YT and Katsoulas D (2002b). Monitoring and Modelling Indoor Air
Quality and Ventilation in Classrooms within a Purpose-Designed Naturally
Ventilated School. Indoor and Built Environment 11: 316-326.
Li L and Mak CM (2007). The assessment of the Performance of a Windcatcher System
Using Computational Fluid Dynamics. Building and Environment 42(3): 1135-1141.
Liddament MW (1996). AIVC: A Guide to Energy Efficient Ventilation. Oscar Faber.
Met Office (2000). Weather Data and Historic Weather Data. Met Office, Exeter, UK.
http://www.metoffice.gov.uk/education/teachers/weather_data_order_form.html
Mumovic D, Palmer J, Davies M, Orme M, Ridley I, Oreszczyn T, Judd C, Critchlow R,
Medina HA, Pilmoor G, Pearson C and Way P (2009). Winter Indoor Air Quality,

24
Thermal Comfort and Acoustic Performance of Newly Built Secondary Schools in
England. Building and Environment 44(7): 1466-1477.
Orme M and Leksmono N (2002). Ventilation Modelling Data Guide - GU05. Air Infiltration
and Ventilation Centre. Brussels, Belgium.
Persily A (2006). What We Think We Know About Ventilation. International Journal of
Ventilation 5(3): 275-290.
Santamouris M and Asimakopoulos D (1996). Passive Cooling of Buildings. James & James
(Science Publishers) Ltd., London.
Sawachi T, Maruta E, Takahashi Y and Sato KI (2006). Wind Pressure Coefficients for
Different Building Configurations With and Without an Adjacent Building.
International Journal of Ventilation 5(1): 21-30.
Sherman MH (1990). Tracer-Gas Techniques for Measuring Ventilation in a Single Zone.
Building and Environment 25(4): 365-374.
Su Y, Riffat SB, Lin Y-L and Khan N (2008). Experimental and CFD Study of Ventilation
Flow Rate of a Monodraught Windcatcher. Energy and Buildings 40(6): 1110-1116.

25
FIGURE CAPTIONS
Figure 1 (a) Plan view of Windcatcher (b) Side view of Windcatcher
Figure 2 Prediction of the effect of the area of a façade opening on Windcatcher
ventilation rates. ———, 0θ =o ; — — —, 45θ =
o .
Figure 3 Prediction of ventilation rates for a 1000 mm square Windcatcher with
2
5 1 mA = and . ———, and 5 0.38p
C = − ; — — — ,
and 5 0.06p
C = ; - - - - - - -, 5 CT∆ =o and 5 0.38
pC = − ; — - — -
— , 5 CT∆ =o and 5 0.06
pC = .
Figure 4 Prediction of ventilation rate from a room with varying 5pC for façade
opening. ——— , 2
5 1.5 mA = , — — — , 2
5 1.0 mA = , - - - - - - -,
2
5 0.5 mA = .
Figure 5 Example tracer gas tests. Natural log of tracer gas concentration C(t) at time t,
equation of line of best fit, and coefficient of determination.
Figure 6 Ventilation rates for an autonomous 800 mm square Windcatcher. ——— ,
prediction 0θ =o ; — — — , prediction 45θ =
o ; �, measurement 1 mL≤ ; ×,
measurement L > 1 m; A, Andrews Field weather station; P, Portland weather
station.
Figure 7 Ventilation rates for an autonomous 1000 mm square Windcatcher. ——— ,
prediction 0θ =o ; — — — , prediction 45θ =
o ; �, measurement 1 mL≤ ; ×,
measurement L > 1 m; H, Heathrow weather station; W, Wisley weather
station.
45θ = o C0o=∆T
C0o=∆T

26
Figure 8 Ventilation rates for Windcatcher with open windows. ——— , prediction
(upper and lower bounds) for 1000 mm square Windcatcher with 2
5 0.9mA = ;
— — — , prediction (upper and lower bounds) for 800 mm square
Windcatcher with 2
5 1.8mA = ; �, measurement 800 mm square Windcatcher,
×, measurement 1000 mm Windcatcher; A, Andrews Field weather station; H,
Heathrow weather station; P, Portland weather station; W, Wisley weather
station.
Figure 9 Measured ventilation rates for Windcatchers with and without open windows.
� , 800 mm square Windcatcher with windows closed; �, 1000 mm square
Windcatcher with windows closed; × , 800 mm square Windcatcher with
windows open; � , 1000 mm square Windcatcher with windows open.

27
TABLES
Table 1
Cp values used
in semi-empirical model
o0=θ o
45=θ
1pC 0.84 0.31
2pC -0.34 0.31
3pC -0.34 -0.2
4pC -0.11 -0.2

28
Table 2
Classroom parameters
Room Volume
(m3)
Actual
Windcatcher Side
(mm)
Actual Quadrant
CSA*,
A1-4 (m2)
Duct length,
L (m)
Openable Window
Type
Maximum
Openable Window
Area, A5 (m2)
Weather station
[distance]
(km)
C1 148 1000 0.193 4.8 6×Top Hung 0.9 Wisley [10.0]
C2 172 1000 0.193 1.0 6×Top Hung 0.9 Heathrow [21.6]
C3 148 1000 0.193 4.8 6×Top Hung 0.9
C4 172 1000 0.193 1.0 6×Top Hung 0.9
D1 272 800 0.160 1.0 5×Top Hung 1.5 Portland [41.6]
D2 272 800 0.160 1.0 5×Top Hung 1.5
D3 272 800 0.160 1.0 5×Top Hung 1.5
F2 549 800 0.145 1.0 None n/a Andrews Field
F4 498 800 0.145 1.0 None n/a [12.8]
G1 203 800 0.160 5.5 4×Sash 1.8 Andrews Field
G2 185 800 0.160 5.8 2×Sash 1.8 [22.4]
G3 203 800 0.160 5.5 2×Sash 1.8
*CSA Cross sectional area

29
Figure 1a.

30
Figure 1b.
31
FIGURES
Figure 2.

32
Figure 3.

33
Figure 4.

34
Figure 5.

35
Figure 6.
36
Figure 7.

37
Figure 8.

38
Figure 9.