the performance of automatic weather station (aws) on ... · pdf filethe performance of...
TRANSCRIPT

The Performance of Automatic Weather Station (AWS) on
Measurement of Meteorological Parameters during a Total
Solar Eclipse of 9 March 2016 in Indonesia
Kadarsah, Ratnasatyaningsih
Center for Research and Development,
Indonesian Agency for Meteorology Climatology and Geophysics (BMKG),
Jl. Angkasa I No. 2 Kemayoran, Jakarta 10720, Indonesia
Abstract. The performance analysis of Automatic Weather Station (AWS) on measuring meteorological
parameter of a Total Solar Eclipse (TSE) of 9 March 2016 in Indonesia is conducted by comparing three
groups AWS locations during 7-10 March 2016. The first group consists of AWS located in total solar
eclipse path (sampling rate of 10 minutes) and plugged in 12 observation stations of Indonesian Mett-
office (BMKG). The second group AWS (sampling rate of 1 minute, 6.30 S, 106.85 0 E), and the third
group AWS (sampling rate of 20 seconds, 05117.5 N, 127 E) in special settings for observation
TSE. Observed meteorological parameters are temperature, humidity, pressure, wind speed and solar
radiation. The analysis showed that the third group of TSE able to analyze the events in detail. The AWS
has net radiation parameter dropped from 356.4 Wm-2 at 9:12:10 LT to -42.23 Wm-2 at 09:52:50 LT.
The condition occurs because the event lasted only a very short TSE especially when it reaches its peak
with duration of less than 4 minutes. Therefore, for special events such as TSE, measurements of
meteorological parameters in the meteorological station should use a shorter sampling rate in order to be
better analysis of meteorological parameters and accurate.
Keyword: Automatic Weather Station (AWS), solar radiation, Total Solar Eclipse (TSE),
Introduction
The total solar eclipse of March 9, 2016, occurred over the southern Pacific Ocean. A solar
eclipse occurs when the Moon passes between Earth and the Sun, thereby totally or partly
obscuring the image of the Sun for a viewer on Earth. On 9 March 2016 a total solar eclipse was
visible along a narrow corridor which traversed half the Earth, starting in Indian Ocean,
extending across the Indonesia (Sumatra, Kalimantan, Sulawesi, North Maluku), and then ended
near the Hawaiian islands. The umbra traversed the Indonesia passing directly over the Ternate
Island (05117.5 N, 127 E). A total solar eclipse occurs when the Moon's apparent diameter is
larger than the Sun's, blocking all direct sunlight, turning day into darkness. Totality occurs in a
narrow path across Earth's surface, with the partial solar eclipse visible over a surrounding region
thousands of kilometers wide. A solar eclipse occurs when the Moon passes between the Earth
and the Sun, casting shadows upon the Earth. It can only take place during new moon. During a
total solar eclipse the Moon fully covers face of the Sun. Although eclipses are astronomical
phenomena, they also draw considerable interest from atmospheric scientists because solar
radiation is the main source of energy to atmosphere. In view of that, solar eclipses provide a
natural ‘laboratory’ for studying Earth’s environment response to the abrupt disturbances in
radiation. The study results may provide potential benefit to radiative transfer model evaluation
or satellite data validation (Maturilli and Ritter, 2016). Variability of surface radiation during
solar eclipses has been extensively studied (e.g. Fernandez et al., 1996; Foken et al., 2001;

Zerefos et al., 2001; Aplin and Harrison, 2003; Kazadzis et al, 2007; Gerasopoulos et al., 2008;
Nymphas et al. 2012; Maturilli and Ritter, 2016). The greatest eclipse, the instant when the axis
of the Moon's shadow cone passes closest to Earth's center, occurred over Pacific Oceans.
Although there are a number of studies and observations carried out during a solar eclipse over
Indonesia, most of them are related to solar physics such as corona (Tanabe et al., 1985; Hiei et
al., 198; Pasachoff and Ladd, 1987) and circumsolar dust (Mizutani et al., 1984; Isobe et al.,
1985). Evidence of atmospheric gravity waves were also reported (Seykora et al., 1985). The
temperature drop reported on other solar eclipse events (e.g. Segal et al., 1996; Anderson, 1999;
Hanna, 2000; Founda et al., 2007, Fernandez et al. 1996). The temperature decline induced by
the eclipses occurred during the hours of the normal temperature increase should be even larger
(Founda et al., 2007). Probably this is caused by the fact that our site was located in a small
island surrounded by sea, similar to Kasteloriza in Greece. According to Founda et al. (2007),
sea surrounded the island minimizes the temperature response due to its larger heat capacity. We
realized the presence of buildings in the vicinity of our measurement site, which may have
affected the wind and temperature profiles (Winkler et al., 2001; Nymphas et al., 2009).
Therefore, if the measurements are conducted under undisturbed conditions, the temperature may
still have been lower. Time lag between mid-eclipse and the time when air temperature reach its
minimum is different from one location to the other and is linked to the thermal inertia of the air
and the ground (Fernandez et al., 1996; Aplin and Harrison, 2003; Founda et al., 2007).
2. Site and Instrumentation
We carried out field campaign on meteorological measurements in Indonesia region (Fig.1,
Table 1) from 7 - 11 March 2016 for the first site. The first site consists of AWS located in total solar
eclipse path (sampling rate of 10 minutes) and plugged in 12 observation stations of Indonesian Mett-
office (BMKG). The second site AWS (sampling rate of 1 minute, 6.30 S, 106.85 0 E) located in the
Jakarta region (Fig 2, Table 2). And the third site AWS (sampling rate of 10 seconds, 0.780N, 127 380 E)
in special settings for observation TSE (Fig.3, Table 3). Similar campaign has been performed during
the 26 January 2009 annular solar eclipse (Hanggoro, 2011). The 9 March 2016 total solar
eclipse has given a unique opportunity to assess impacts of the eclipse on various meteorological
parameters in Ternate, Jakarta and other site in over the Indonesia region. The eclipse duration in
Ternate is relatively longer compared to other sites in Indonesia. Ternate is one of islands in
Maluku, where mean annual rainfall cycle peak in June to July with rainfall amount about 300
mm/month during the peak (Aldrian and Susanto, 2003). Ternate lies close to totality path of the
solar eclipse of 9 March 2016 and experienced 100% obscuration during the solar eclipse. The
eclipse at this location started at 08:36:3.9 LT, with mid-eclipse at 09:52:59.8 LT, and ended at
11:20:50.3 LT. The Local Time is UT+9h (Table 3). We focus for field experiments at the north-
east part of Ternate island (05117.5 N, 127 E). Our measurement site was located in an open
area in a neighborhood. An AWS was installed at this site, equipped with instruments capable of
measuring temperature, relative humidity, pressure, wind speed and net radiation.
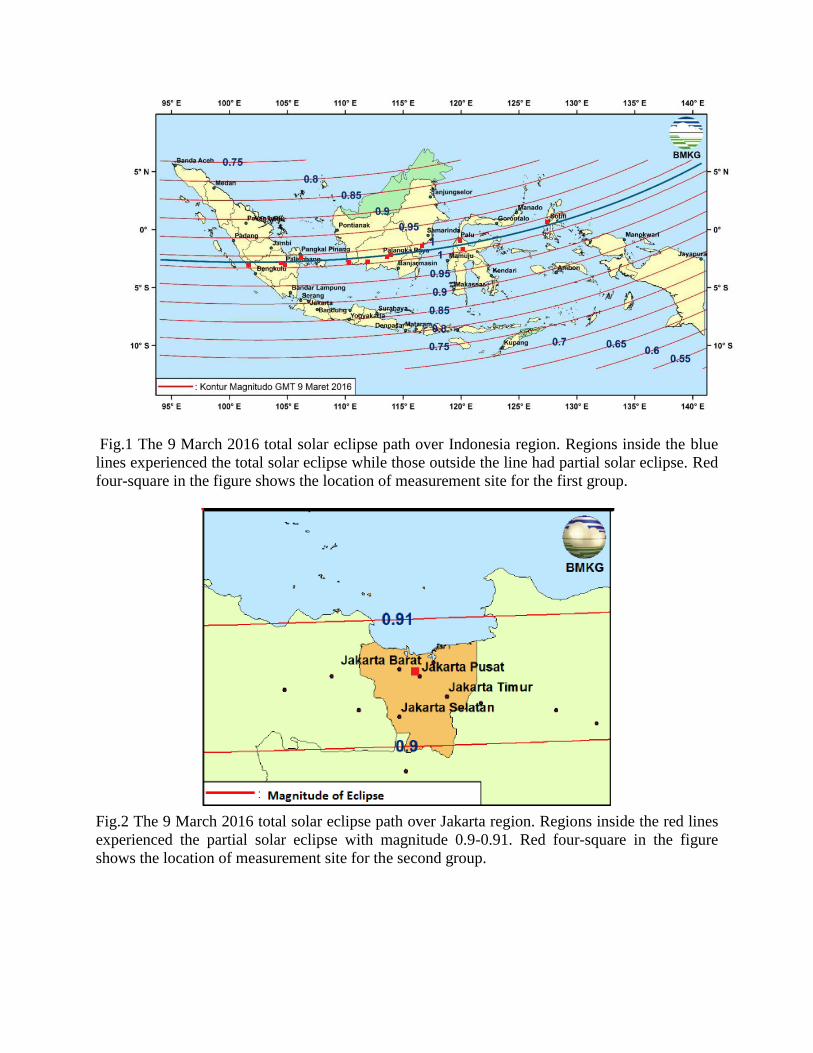
Fig.1 The 9 March 2016 total solar eclipse path over Indonesia region. Regions inside the blue
lines experienced the total solar eclipse while those outside the line had partial solar eclipse. Red
four-square in the figure shows the location of measurement site for the first group.
Fig.2 The 9 March 2016 total solar eclipse path over Jakarta region. Regions inside the red lines
experienced the partial solar eclipse with magnitude 0.9-0.91. Red four-square in the figure
shows the location of measurement site for the second group.
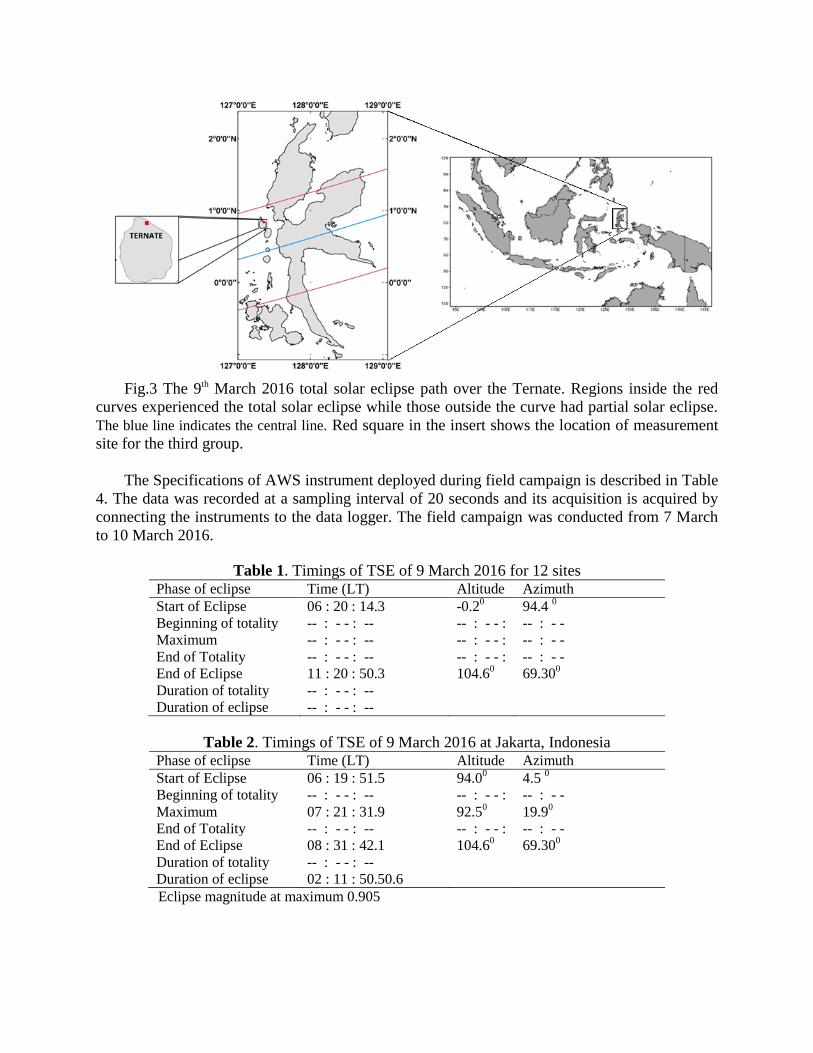
Fig.3 The 9th March 2016 total solar eclipse path over the Ternate. Regions inside the red
curves experienced the total solar eclipse while those outside the curve had partial solar eclipse.
The blue line indicates the central line. Red square in the insert shows the location of measurement
site for the third group.
The Specifications of AWS instrument deployed during field campaign is described in Table
4. The data was recorded at a sampling interval of 20 seconds and its acquisition is acquired by
connecting the instruments to the data logger. The field campaign was conducted from 7 March
to 10 March 2016.
Table 1. Timings of TSE of 9 March 2016 for 12 sites Phase of eclipse Time (LT) Altitude Azimuth
Start of Eclipse 06 : 20 : 14.3 -0.20
94.4 0
Beginning of totality -- : - - : -- -- : - - : -- : - -
Maximum -- : - - : -- -- : - - : -- : - -
End of Totality -- : - - : -- -- : - - : -- : - -
End of Eclipse 11 : 20 : 50.3 104.60 69.30
0
Duration of totality -- : - - : --
Duration of eclipse -- : - - : --
Table 2. Timings of TSE of 9 March 2016 at Jakarta, Indonesia Phase of eclipse Time (LT) Altitude Azimuth
Start of Eclipse 06 : 19 : 51.5 94.00
4.5 0
Beginning of totality -- : - - : -- -- : - - : -- : - -
Maximum 07 : 21 : 31.9 92.50 19.9
0
End of Totality -- : - - : -- -- : - - : -- : - -
End of Eclipse 08 : 31 : 42.1 104.60 69.30
0
Duration of totality -- : - - : --
Duration of eclipse 02 : 11 : 50.50.6
Eclipse magnitude at maximum 0.905

Table 3. Timings of TSE of 9 March 2016 at Ternate, Indonesia Phase of eclipse Time (LT) Altitude Azimuth
Start of Eclipse 08 : 36 : 3.90 95.50
28.6 0
Beginning of totality 09 : 51 : 41.6 97.40 47.4
0
Maximum 09 : 52 : 59.8 97.40 47.7
0
End of Totality 09 : 54 : 17.9 97.50 48.0
0
End of Eclipse 11 : 20 : 50.3 104.60 69.30
0
Duration of totality 00 : 02 : 36.30
Duration of eclipse 02 : 44 : 46.40
Eclipse magnitude at maximum 1,008
Table 4. List of instruments deployed during field campaign. Parameter Device Manufacturers Accuracy
Air Temperature Weather Transmitter
WXT520
Vaisala ±0.3 °C
Relative humidity ±3 %RH at 0-90 %RH
±5 %RH at 90-100 %RH
Barometric pressure ±0.5 hPa at 0- 30 °C
±1 hPa at -52 - +60 °C
Wind speed ±3 % at 10 m/s
Net radiation NR-Lite 2 Kipp & Zonen 10 V/Wm-²
3. Summary and Discussion
3.1 Temperature
Generally, the 12 sites show that the temperatures are not clear affected by the eclipse
because sampling rate too long (10 minutes) (Fig.4). The sampling rate can’t to detect the
decreasing of temperature due to eclipse. On the second site at Meteorology Station 745,
Kemayoran Jakarta (Fig.5), the temperature shows affected by the eclipse. The air temperature at
1.5 m decline about 1.94C. A significant drop in diurnal pattern of air temperature during the
solar eclipse of 9 March 2016 is clearly seen. The temperature started decreasing from 27.04 C
at the mid of the eclipse and this cooling during 20 minutes with the lowest temperature 26.74
C. Therefore the total temperature decrease is 0.3 C, which is within the range already reported
on other solar eclipse events (e.g. Segal et al., 1996; Anderson, 1999; Hanna, 2000; Founda et
al., 2007). Hanggoro (2011) reported a temperature decrease of about 4 – 5 C in Lampung
during the annular solar eclipse of 26 January 2009 as observed using AWS. The temperature
decline induced by the eclipses occurred during the hours of the normal temperature increase
should be even larger (Founda et al., 2007). Probably this is caused by the fact that our site was
located in a big city surrounded by building od urban area. We realized the presence of buildings
in the vicinity of our measurement site, which may have affected the wind and temperature
profiles (Winkler et al., 2001; Nymphas et al., 2009). Therefore, if the measurements are
conducted under undisturbed conditions, the temperature may still have been lower. Time lag
between mid-eclipse and the time when air temperature reach its minimum is different from one
location to the other and is linked to the thermal inertia of the air and the ground (Fernandez et
al., 1996; Aplin and Harrison, 2003; Founda et al., 2007).
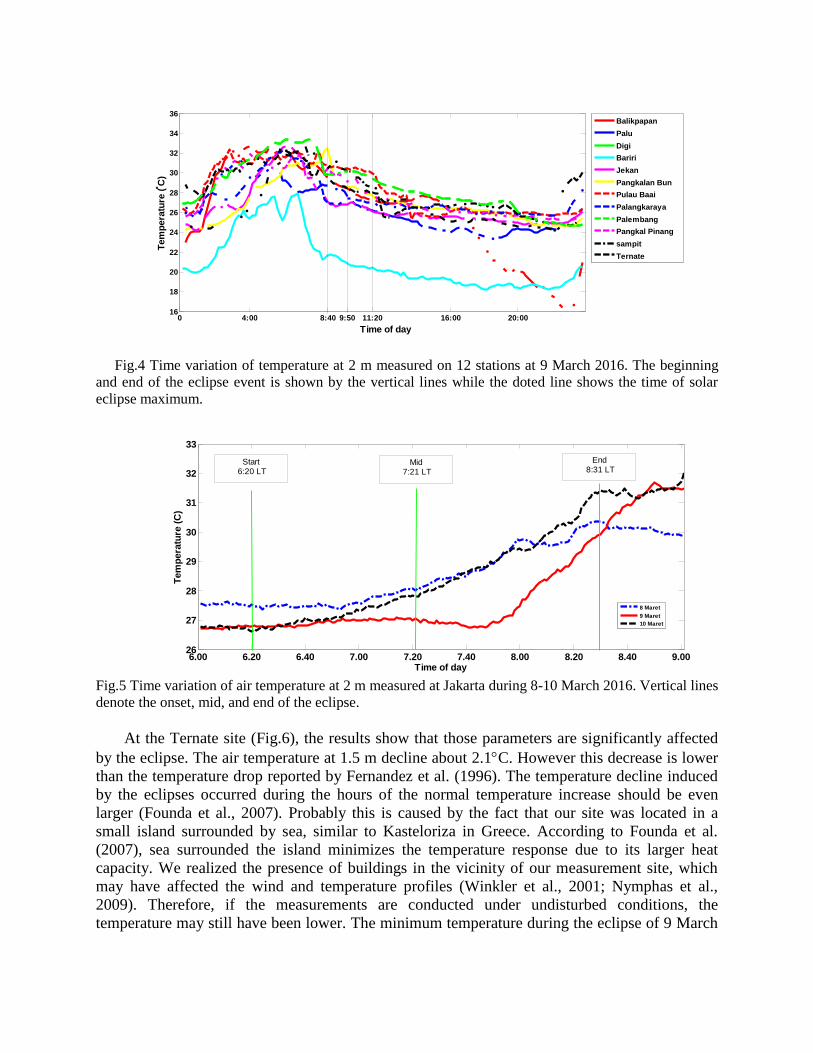
Fig.4 Time variation of temperature at 2 m measured on 12 stations at 9 March 2016. The beginning
and end of the eclipse event is shown by the vertical lines while the doted line shows the time of solar
eclipse maximum.
Fig.5 Time variation of air temperature at 2 m measured at Jakarta during 8-10 March 2016. Vertical lines
denote the onset, mid, and end of the eclipse.
At the Ternate site (Fig.6), the results show that those parameters are significantly affected
by the eclipse. The air temperature at 1.5 m decline about 2.1C. However this decrease is lower
than the temperature drop reported by Fernandez et al. (1996). The temperature decline induced
by the eclipses occurred during the hours of the normal temperature increase should be even
larger (Founda et al., 2007). Probably this is caused by the fact that our site was located in a
small island surrounded by sea, similar to Kasteloriza in Greece. According to Founda et al.
(2007), sea surrounded the island minimizes the temperature response due to its larger heat
capacity. We realized the presence of buildings in the vicinity of our measurement site, which
may have affected the wind and temperature profiles (Winkler et al., 2001; Nymphas et al.,
2009). Therefore, if the measurements are conducted under undisturbed conditions, the
temperature may still have been lower. The minimum temperature during the eclipse of 9 March
0 4:00 8:40 9:50 11:20 16:00 20:0016
18
20
22
24
26
28
30
32
34
36
Time of day
Tem
pera
ture
( C
)
Balikpapan
Palu
Digi
Bariri
Jekan
Pangkalan Bun
Pulau Baai
Palangkaraya
Palembang
Pangkal Pinang
sampit
Ternate
6.00 6.20 6.40 7.00 7.20 7.40 8.00 8.20 8.40 9.0026
27
28
29
30
31
32
33
Time of day
Tem
pera
ture
(C
)
8 Maret
9 Maret
10 Maret
End 8:31 LT
Mid 7:21 LT
Start 6:20 LT

2016 is lagging to mid-eclipse by about 20 minutes. Time lag between mid-eclipse and the time
when air temperature reach its minimum is different from one location to the other and is linked
to the thermal inertia of the air and the ground (Fernandez et al., 1996; Aplin and Harrison, 2003;
Founda et al., 2007). This result is within the temperature drop reported on other solar eclipse
events (e.g. Segal et al., 1996; Anderson, 1999; Hanna, 2000; Founda et al., 2007). However this
decrease is lower than the temperature drop reported by Fernandez et al. (1996) although both
eclipses are the total solar eclipse and occurred at similar hour of day.
Fig.6 Time variation of temperature at 2 m measured at Ternate 7-9 March 2016. The beginning and
end of the eclipse event is shown by the vertical lines while the dotted line shows the time of solar eclipse
maximum.
3.2. Humidity
Humidity depends on water vaporization and condensation, which, in turn, mainly depends on
temperature. There are quite a number of studies and observations made during solar eclipses.
They include observations of meteorological parameters, such as wind speed and direction, air
temperature, atmospheric pressure, humidity (Anderson etal.,1972; Foken et al.,2001;
Sza"owski,2002; Aplin and Harrison,2003). There are large numbers of previous reported studies
during the earlier solar eclipses which includes observations of meteorological variables, such as
wind speed and direction, humidity, (Nymphas et al., 2009; Krishnan et al., 2004). Their
majority observations show the net reduction in temperature, wind speed, water vapour, while
RH increases in proportion to obscuration of the sun disc. Observation of humidity at 12 sites
(Fig.7) Meteorology Station 745 Kemayoran Jakarta (Fig.8) and Ternate (Fig.9). Increasing
humidity in the 12 sites is not as clearly happened in the Meteorology Station 745 and Ternate.
This happens because the sampling rate at the 12 sites is too large so it cannot capture the
phenomenon of TSE. Humidity at Meteorology Station took about 29 minutes to increase from
85.8 % after the mid-eclipse started and the increase continued until it reached its maximum at
87.2 %. At Ternate, humidity also took about about 13 minutes to increase from 73.1 % to 73.9
%.
0 4:00 6:00 8:36 9:53 11:20 16:00 18:00 20:00 24:0025
26
27
28
29
30
31
32
33
34
Time of day
Tem
pera
ture
( C
)
10 March
9 March
7 March

Fig.7 Time variation of humidity at 2 m measured on 12 stations at 9 March 2016. The beginning and
end of the eclipse event is shown by the vertical lines while the doted line shows the time of solar eclipse
maximum.
Fig.8 Time variation of humidity at Jakarta during 8-10 March 2016. Vertical lines denote the onset,
mid, and end of the eclipse.
Fig.9 Time variation of humidity at 2 m measured at Ternate 7-9 March 2016. The beginning and end
of the eclipse event is shown by the vertical lines while the dotted line shows the time of solar eclipse
maximum.
0 4:00 8:40 9:50 11:20 16:00 20:00 24:0050
55
60
65
70
75
80
85
90
95
100
Time of day
Hu
mid
ity (
%)
Balikpapan
Palu
Digi
Bariri
Jekan
Pangkalan Bun
Pulau Baai
Palangkaraya
Palembang
Pangkal Pinang
sampit
Ternate
6.00 6.20 6.40 7.00 7.20 7.40 8.00 8.20 8.40 9.0065
70
75
80
85
90
95
100
Time of day
Hu
mid
ity (
%)
8 March
9 March
10 March
Start 6:20 LT
Mid 7:21 LT
End 8:31 LT
0 4:00 6:00 8:36 9:53 11:20 16:00 18:00 20:00 24:0045
50
55
60
65
70
75
80
85
90
95
Time of day
Hu
mid
ity(%
)
10 March
9 March
7 March
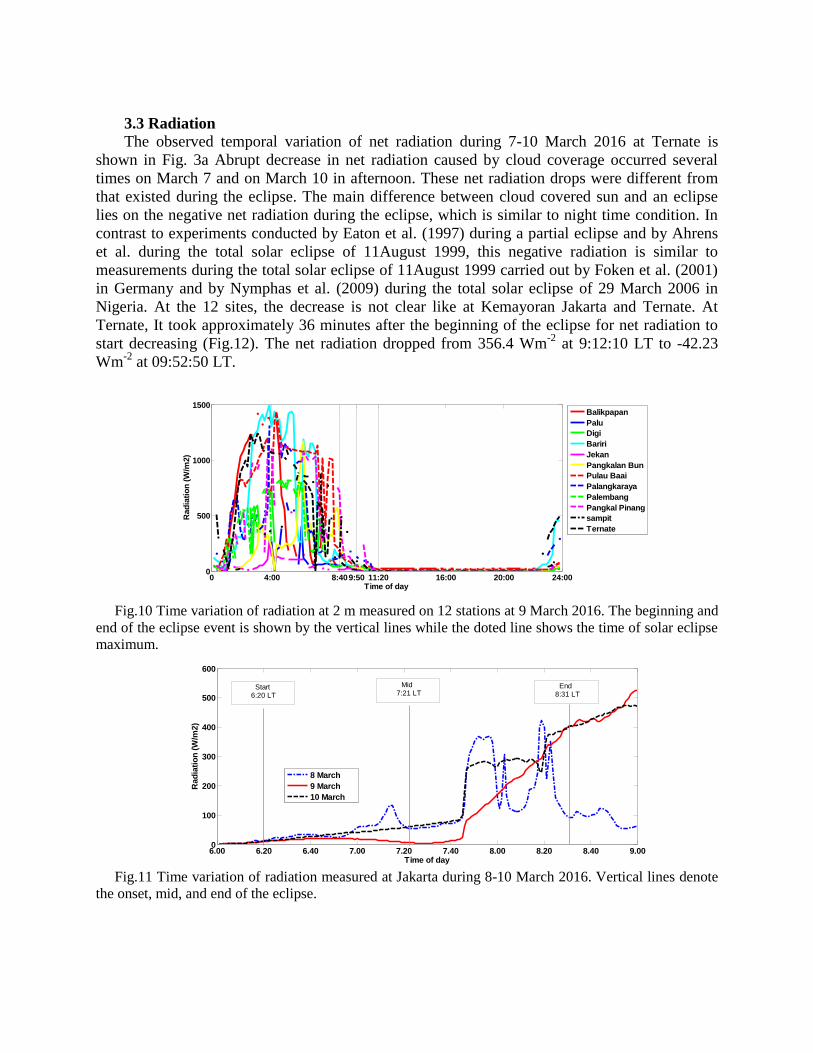
3.3 Radiation
The observed temporal variation of net radiation during 7-10 March 2016 at Ternate is
shown in Fig. 3a Abrupt decrease in net radiation caused by cloud coverage occurred several
times on March 7 and on March 10 in afternoon. These net radiation drops were different from
that existed during the eclipse. The main difference between cloud covered sun and an eclipse
lies on the negative net radiation during the eclipse, which is similar to night time condition. In
contrast to experiments conducted by Eaton et al. (1997) during a partial eclipse and by Ahrens
et al. during the total solar eclipse of 11August 1999, this negative radiation is similar to
measurements during the total solar eclipse of 11August 1999 carried out by Foken et al. (2001)
in Germany and by Nymphas et al. (2009) during the total solar eclipse of 29 March 2006 in
Nigeria. At the 12 sites, the decrease is not clear like at Kemayoran Jakarta and Ternate. At
Ternate, It took approximately 36 minutes after the beginning of the eclipse for net radiation to
start decreasing (Fig.12). The net radiation dropped from 356.4 Wm-2
at 9:12:10 LT to -42.23
Wm-2
at 09:52:50 LT.
Fig.10 Time variation of radiation at 2 m measured on 12 stations at 9 March 2016. The beginning and
end of the eclipse event is shown by the vertical lines while the doted line shows the time of solar eclipse
maximum.
Fig.11 Time variation of radiation measured at Jakarta during 8-10 March 2016. Vertical lines denote
the onset, mid, and end of the eclipse.
0 4:00 8:409:50 11:20 16:00 20:00 24:000
500
1000
1500
Time of day
Rad
iati
on
(W
/m2)
Balikpapan
Palu
Digi
Bariri
Jekan
Pangkalan Bun
Pulau Baai
Palangkaraya
Palembang
Pangkal Pinang
sampit
Ternate
6.00 6.20 6.40 7.00 7.20 7.40 8.00 8.20 8.40 9.000
100
200
300
400
500
600
Time of day
Rad
iati
on
(W
/m2)
8 March
9 March
10 March
Start 6:20 LT
End 8:31 LT
Mid 7:21 LT

Fig.12 Time variation of radiation at 2 m measured at Ternate 7-9 March 2016. The beginning and end
of the eclipse event is shown by the vertical lines while the doted line shows the time of solar eclipse
maximum.
3.4 Wind Speed
The observation wind speed at the three locations does not indicate the significant (Fig.13
and Fig.14), even the wind speed at the 12 stations (not shown in the figure).
Fig.13 Time variation of wind speed at 2 m measured at Jakarta during 8-10 March 2016. Vertical
lines denote the onset, mid, and end of the eclipse.
Fig.14 Time variation of wind speed at 2 m measured at Ternate 7-9 March 2016. The beginning and
end of the eclipse event is shown by the vertical lines while the doted line shows the time of solar eclipse
maximum.
0 4:00 6:00 8:36 9:53 11:20 16:00 18:00 20:00 24:00-200
0
200
400
600
800
1000
Time of day
Net
Rad
iati
on
(W
/m2)
10 March
9 March
7 March
6.00 6.20 6.40 7.00 7.20 7.40 8.00 8.20 8.40 9.000
0.5
1
1.5
2
2.5
3
Time of day
Win
d S
peed
(m
/s)
8 March
9 March
10 March
Start6:20 LT
Mid7:21 LT
End 8:31 LT
0 4:00 6:00 8:36 9:53 11:20 16:00 18:00 20:00 24:000
2
4
6
8
10
Time of day
Win
d S
peed
(m/s
)
10 March
9 March
7 March

3.5 Pressure
The TSE impact on pressure at 12 locations (Fig.15), Jakarta (Fig.16) and in the Ternate
(Fig.17) showed no significant effect.
Fig.15 Time variation of pressure at 2 m measured on 12 stations at 9 March 2016. The beginning and
end of the eclipse event is shown by the vertical lines while the dotted line shows the time of solar eclipse
maximum.
Fig. 16 Time variation of pressure at 2 m measured at Jakarta during 8-10 March 2016. Vertical lines
denote the onset, mid, and end of the eclipse.
Fig.17 Time variation of pressure at 2 m measured at Ternate 7-9 March 2016. The beginning and end
of the eclipse event is shown by the vertical lines while the doted line shows the time of solar eclipse
maximum.
0 4:00 8:40 9:50 11:20 16:00 20:001003
1004
1005
1006
1007
1008
1009
1010
1011
1012
1013
Time of day
Pre
ssu
re (
mB
ar)
Balikpapan
Palu
Digi
Bariri
Jekan
Pangkalan Bun
Pulau Baai
Palangkaraya
Palembang
Pangkal Pinang
sampit
Ternate
6.00 6.20 6.40 7.00 7.20 7.40 8.00 8.20 8.40 9.001008
1008.5
1009
1009.5
1010
1010.5
1011
1011.5
1012
1012.5
1013
Time of day
Pre
ssu
re (
mB
ar)
8 March
9 March
10 March
Start 6:20 LT
Mid 7:21 LT
End 8:31 LT
0 4:00 6:00 8:36 9:53 11:20 16:00 18:00 20:00 24:001003
1004
1005
1006
1007
1008
1009
1010
1011
1012
Time of day
Pre
ssu
re(m
Bar)
10 March
9 March
7 March
ACKNOWLEDGMENTS
The authors thank to Prof.Edvin Aldrian and our colleagues from Division of Research and
Development for Meteorology Jose Rizal, Eko Heriyanto, Tri Astuti Nuraini and Sultan
Babullah Weather Station in Ternate for their support during surveying for the observation site
and installing the instruments.
REFERENCES
Ahrens, D., Iziomon, M. G., Jaeger, L., Matzarakis, A., & Mayer, H. (2001). Impacts of the solar eclipse
of 11 August 1999 on routinely recorded meteorological and air quality data in south-west Germany.
Meteorologische Zeitschrift , 10 (3), 215-223.
Aldrian, E., & Susanto, D. (2003). Identification of Three Dominant Rainfall Regions Within Indonesia
and Their Relationship to Sea Surface Temperature. International Journal of Climatology , 23, 1435-
1452.
Anderson, J. (1999). Meteorological changes during a solar eclipse. Weather , 54, 207-215.
Aplin, K. L., & Harrison, R. G. (2003). Meteorological effects of the eclipse of 11 August 1999 in cloudy
and clear conditions. Proceedings of the Royal Society A: Mathematical, Physical and Engineering
Sciences, 459, pp. 353-371.
Eaton, F. D., Hines, J. R., Hatch, W. H., Cionco, R. M., Byers, J., Garvey, D., et al. (1997). Solar Eclipse
Effects bserved in the Planetary Boundary Layer Over a Desert. Boundary-Layer Meteorology , 83
(2), 331-346.
Fabian, P., Winterhalter, M., Rappengluck, B., Reitmayer, H., Stohl, A., Koepke, P., et al. (2001). The
BAYSOFI Campaign – Measurements carried out during the total solar eclipse of August 11, 1999.
Meteorologische Zeitschrift , 10 (3), 165-170 .
Fernandez, W., Hidalgo, H., Coronel, G., & Morales, E. (1996). Changes in Meteorological Variables in
Coronel Ovedo, Paraguay, During the Total Solar Eclipse of 3 November 1994. Earth, Moon and
Planets , 74, 49-59.
Foken, T., Wichura, B., Klemm, O., Gerchau, J., Winterhaller, M., & Weidinger, T. (2001).
Micrometeorological measurements during the total solar eclipse of August 11, 1999.
Meteorologische Zeitschrift , 10 (3), 171-178.
Founda, D., Melas, D., Lykoudis, S., Lisaridis, L., Gerasopoulos, E., Kouvarakis, G., et al. (2007). The
effect of the total solar eclipse of 29 March 2006 on meteorological variables in Greece. Atmos.
Chem. Phys. , 7, 5543–5553.
Gerasopoulos, E., Zerefos, C. S., Tsagouri, I., Founda, D., Amiridis, V., Bais, A. F., et al. (2008). The
total solar eclipse of March 2006: overview. Atmos. Chem. Phys. , 8, 5205–5220.
Hanggoro, W. (2011). Pengaruh Intensitas Radiasi Saat Gerhana Matahari Cincin terhadap Beberapa
Parameter Cuaca. Jurnal Meteorologi dan Geofisika , 12 (2), 137-144.
Hanna, & Hanna, E. (2000). Meteorological effects of the solar eclipse of 11 August 1999. Weather , 55,
430-446.
Hiei, E., Shimizu, Y., Miyazaki, H., Imai, H., Sato, K., Kuji, S., et al. (1983). Coronal Structure Observed
at the Total Solar Eclipse of 11 June, 1983 in Indonesia. In M. Kitamura, & E. Budding (Eds.), Third
Asian-Pacific Regional Meeting of the International Astronomical Union (pp. 9-15). Springer
Netherlands.
Isobe, S., Hirayama, T., Baba, N., & Miura, N. (1985). Optical polarization observations of circumsolar
dust during the 1983 solar eclipse. Nature , 318, 644-646.
Kazadzis, S., Bais, A., Blumthaler, M., Webb, A., Kouremeti, N., Kift, R., et al. (2007). Effects of total
solar eclipse of 29 March 2006 on surface radiation. Atmos. Chem. Phys. , 7, 5775–5783.
Krishnan, P., Kunhikrishnan, P. K., Nair, S. M., Ravindran, S., Ramachandran, R., Subrahamanyam, D.
B., et al. (2004). Observations of the atmospheric surface layer parameters over a semi arid region
during the solar eclipse of August 11th, 1999. Proc. Indian Acad. Sci. (Earth Planet. Sci.), 113, pp.
353-363.
Maturilli, M., & Ritter, C. (2016). Surface Radiation during the Total Solar Eclipse over Ny-Ålesund,
Svalbard, on 20 March 2015. Earth Syst. Sci. Data Discuss. , doi:10.5194/essd-2016-2.
Mizutani, K., Maihara, T., Hiromoto, N., & Takami, H. (1984). Near-infrared observation of the
circumsolar dust emission during the 1983 solar eclipse. Nature , 312, 134-136.
Nymphas, E. F., Adeniyi, M. O., Ayoda, M. A., & Oladiran, E. O. (2009). Micrometeorological
measurements in Nigeria during the total solar eclipse of 29 March, 2006. Journal ofAtmospheric
and Solar-Terrestrial Physics , 71, 1245–1253.
Nymphas, E. F., Otunia, T. A., Adeniyi, M. O., & Oladiran, E. O. (2012). Impact
ofthetotalsolareclipseof29March2006onthesurfaceenergy fluxes atIbadan,Nigeria. Journal of
Atmospheric and Solar-Terrestrial Physics , 80, 28-36.
Pasachoff, J. M., & Ladd, E. F. (1987). High-frequency oscillations in the corona observed at the 1983
eclipse. Solar Physics , 109 (2), 365-372.
Ratnam, M. V., Kumar, M. S., Basha, G., Anandan, V. K., & Jayaraman, A. (2010). Effect of the annular
solar eclipse of 15 January 2010 on the lower atmospheric boundary layer over a tropical rural
station. Journal of Atmospheric and Solar-Terrestrial Physics , doi:10.1016/j.jastp.2010.10.009.
Segal, M., Turner, R. W., Prusa, J., Bitzer, R. J., & Finley, S. V. (1996). Solar Eclipse Effect on Shelter
Air Temperature. Bulletin of the American Meteorological Society , 77 (1), 89-99.
Seykora, E. J., Bhatnagar, A., Jain, R. M., & Streete, J. L. (1985). Evidence of atmospheric gravity waves
produced during the 11 June 1983 total solar eclipse. Nature , 313 (5998), 124-125.
Szałowski, K. (2002). The effect of the solar eclipse on the air temperature near the ground. Journal of
Atmospheric and Solar-Terrestrial Physics , 64 (15), 1589–1600.
Tanabe, H., Isobe, S., Akiyama, H., Koma, Y., Okabe, T., Nishimura, J., et al. (1985). Balloon
observation of the 1983 solar eclipse in Indonesia. Advances in Space Research , 5 (1), 69-72.
Winkler, P., Kaminski, U., Kohler, U., Riedl, J., Schroers, H., & Anwender, D. (2001). Development of
meteorological parameters and total ozone during the total solar eclipse of August 11, 1999.
Meteorologische Zeitschrift , 10 (3), 193-199.
Zerefos, C. S., Balis, D., Zanis, P., Meleti, C., Bais, A. F., Tourpali, K., et al. (2001). Changes in Surface
UV Solar Irradiance and Ozone over the Balkans during the Eclipse of August 11, 1999. Adv. Space
Res. , 27 (12), 1955-1963.