the performance data contained in this presentation represents past performance, which does not...
TRANSCRIPT
The performance data contained in this presentation represents past performance, which does not guarantee future results.Performance, especially for short time periods, should not be the sole factor in making your investment decisions.
NOT FDIC INSURED. MAY LOSE VALUE. NO BANK GUARANTEE. NOT INSURED BY ANY GOVERNMENT AGENCY.
Patrick L. McFawn CFP®, CPA & Dale L. White CFP®, CPA
Lessons Learned
5 investing principlesfor today and beyond
22
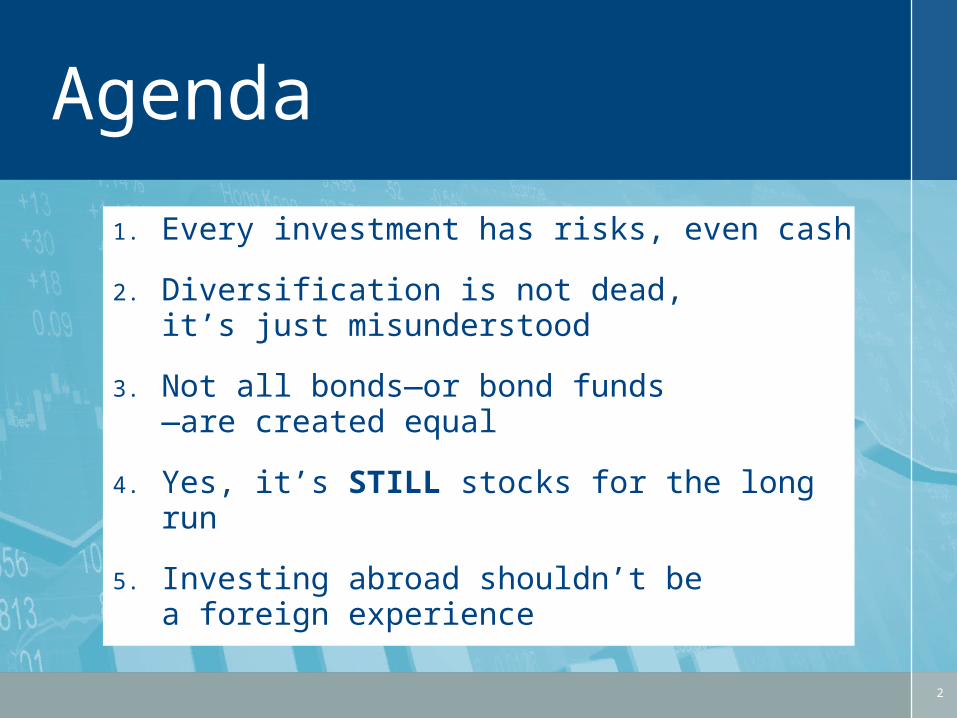
Agenda
1. Every investment has risks, even cash
2. Diversification is not dead, it’s just misunderstood
3. Not all bonds—or bond funds —are created equal
4. Yes, it’s STILL stocks for the long run
5. Investing abroad shouldn’t be a foreign experience

33
1Principle
Every investmenthas risks ― even
cash
4
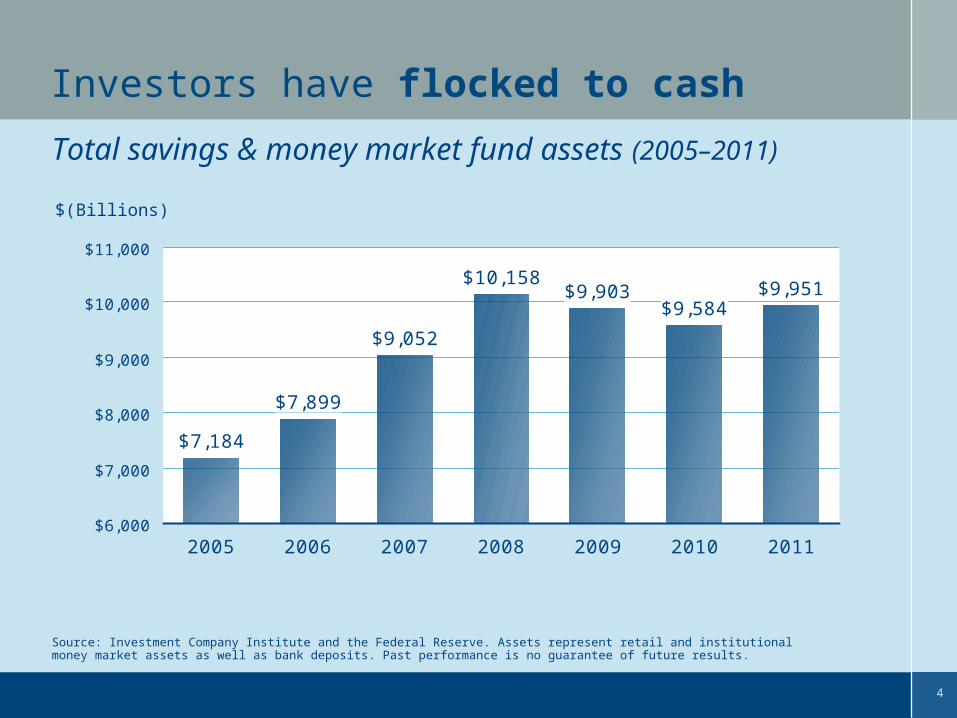
Investors have flocked to cash
Total savings & money market fund assets (2005–2011)
$7,184
$7,899
$9,052
$10,158$9,903
$9,584$9,951
$6,000
$7,000
$8,000
$9,000
$10,000
$11,000
2005 2006 2007 2008 2009 2010 2011
Source: Investment Company Institute and the Federal Reserve. Assets represent retail and institutional money market assets as well as bank deposits. Past performance is no guarantee of future results.
$(Billions)
5
0
10
20
30
40
50
60
Jan’05
May’05
Sep’05
Jan’06
May’06
Sep’06
Jan’07
May’07
Sep’07
Jan’08
May’08
Sep’08
Jan’09
May’09
Sep’09
Jan’10
May’10
Sep’10
Jan’11
May’11
Sep’11
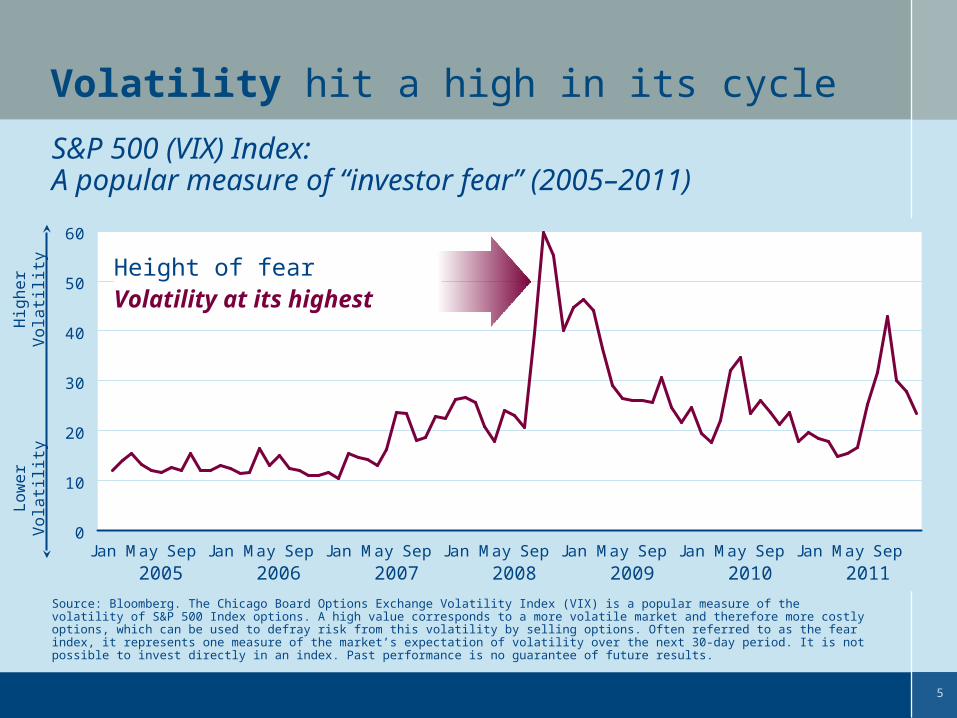
Volatility hit a high in its cycle
S&P 500 (VIX) Index: A popular measure of “investor fear” (2005–2011)
Source: Bloomberg. The Chicago Board Options Exchange Volatility Index (VIX) is a popular measure of the volatility of S&P 500 Index options. A high value corresponds to a more volatile market and therefore more costly options, which can be used to defray risk from this volatility by selling options. Often referred to as the fear index, it represents one measure of the market’s expectation of volatility over the next 30-day period. It is not possible to invest directly in an index. Past performance is no guarantee of future results.
Height of fearVolatility at its highest
Hig
her
Vola
tilit
yLo
wer
Vola
tilit
y
2005 2006 2007 2008 2009 2010 2011
6
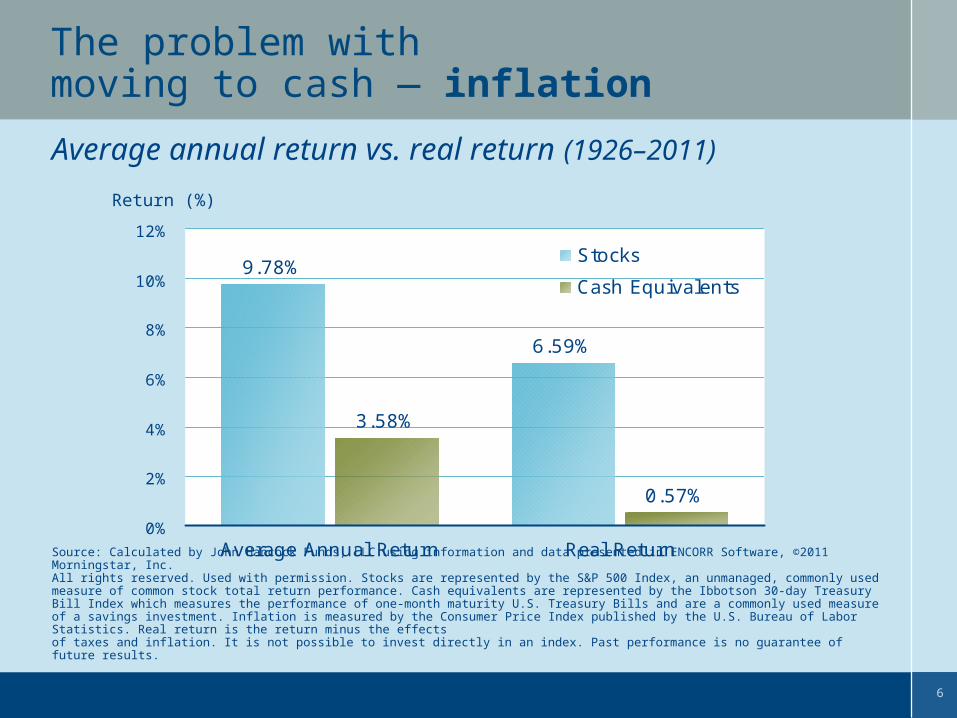
The problem with moving to cash — inflation
Source: Calculated by John Hancock Funds, LLC using information and data presented in ENCORR Software, ©2011 Morningstar, Inc. All rights reserved. Used with permission. Stocks are represented by the S&P 500 Index, an unmanaged, commonly used measure of common stock total return performance. Cash equivalents are represented by the Ibbotson 30-day Treasury Bill Index which measures the performance of one-month maturity U.S. Treasury Bills and are a commonly used measure of a savings investment. Inflation is measured by the Consumer Price Index published by the U.S. Bureau of Labor Statistics. Real return is the return minus the effects of taxes and inflation. It is not possible to invest directly in an index. Past performance is no guarantee of future results.
Average annual return vs. real return (1926–2011)
Return (%)
9.78%
6.59%
3.58%
0.57%
0%
2%
4%
6%
8%
10%
12%
Average Annual Return Real Return
Stocks
Cash Equivalents
7
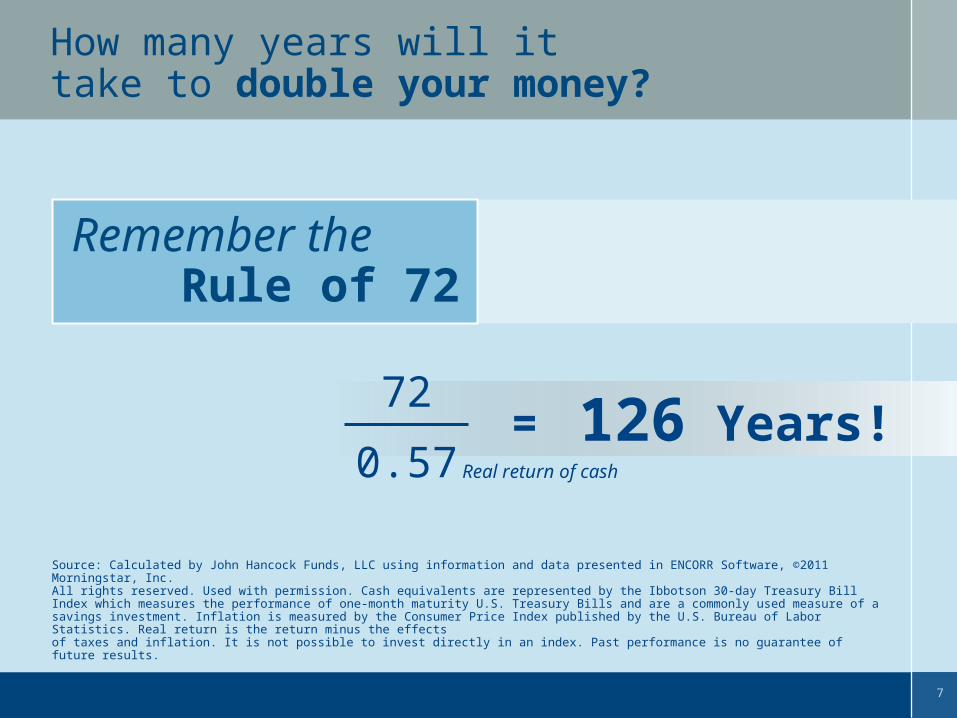
Source: Calculated by John Hancock Funds, LLC using information and data presented in ENCORR Software, ©2011 Morningstar, Inc. All rights reserved. Used with permission. Cash equivalents are represented by the Ibbotson 30-day Treasury Bill Index which measures the performance of one-month maturity U.S. Treasury Bills and are a commonly used measure of a savings investment. Inflation is measured by the Consumer Price Index published by the U.S. Bureau of Labor Statistics. Real return is the return minus the effects of taxes and inflation. It is not possible to invest directly in an index. Past performance is no guarantee of future results.
Remember the Rule of 72
How many years will it take to double your money?
126 Years!=0.57
72
Real return of cash
8
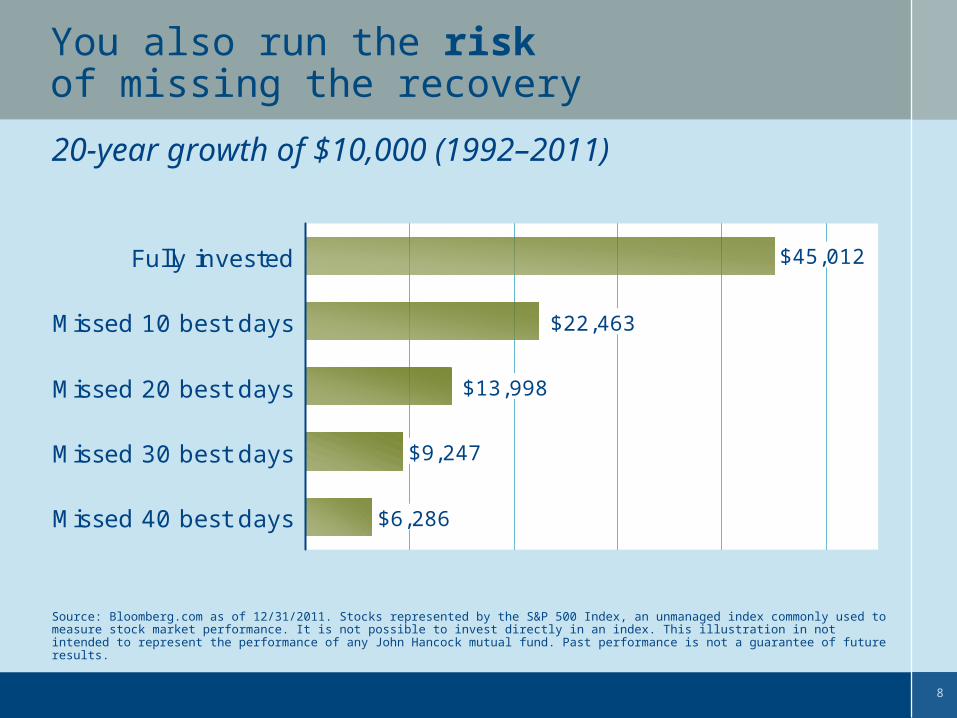
20-year growth of $10,000 (1992–2011)
You also run the risk of missing the recovery
Source: Bloomberg.com as of 12/31/2011. Stocks represented by the S&P 500 Index, an unmanaged index commonly used to measure stock market performance. It is not possible to invest directly in an index. This illustration in not intended to represent the performance of any John Hancock mutual fund. Past performance is not a guarantee of future results.
$9,247
$6,286
$45,012
$22,463
$13,998
Fully invested
Missed 10 best days
Missed 20 best days
Missed 30 best days
Missed 40 best days
9
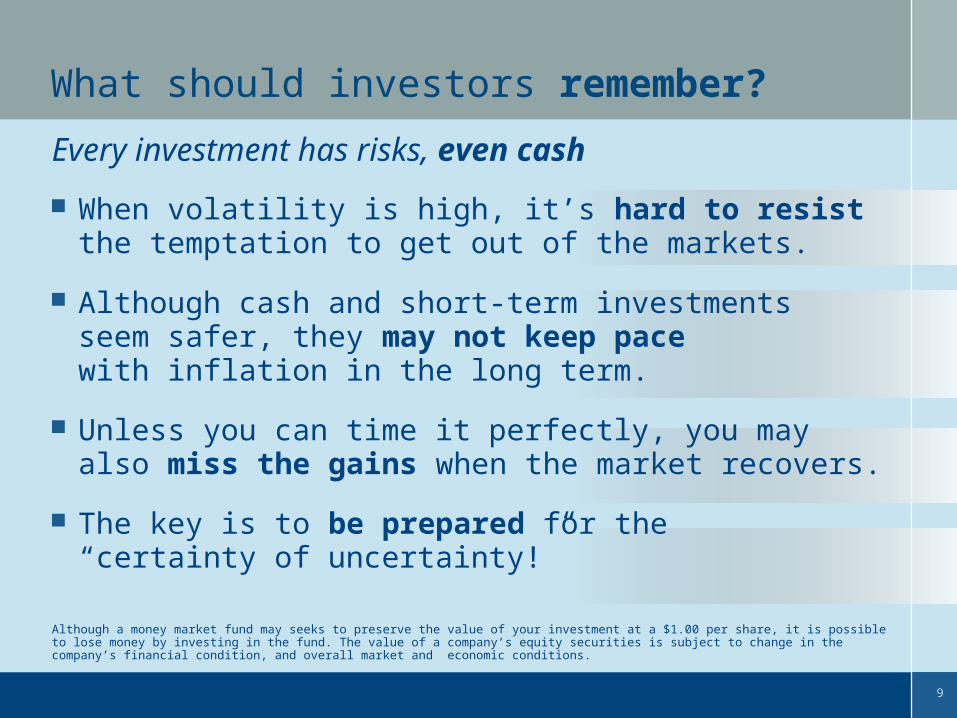
What should investors remember?
When volatility is high, it’s hard to resist the temptation to get out of the markets.
Although cash and short-term investments seem safer, they may not keep pace with inflation in the long term.
Unless you can time it perfectly, you may also miss the gains when the market recovers.
The key is to be prepared for the “certainty of uncertainty!”
Every investment has risks, even cash
Although a money market fund may seeks to preserve the value of your investment at a $1.00 per share, it is possible to lose money by investing in the fund. The value of a company’s equity securities is subject to change in the company’s financial condition, and overall market and economic conditions.

1010
2Principle
Diversification is not dead,it’s just
misunderstood
11
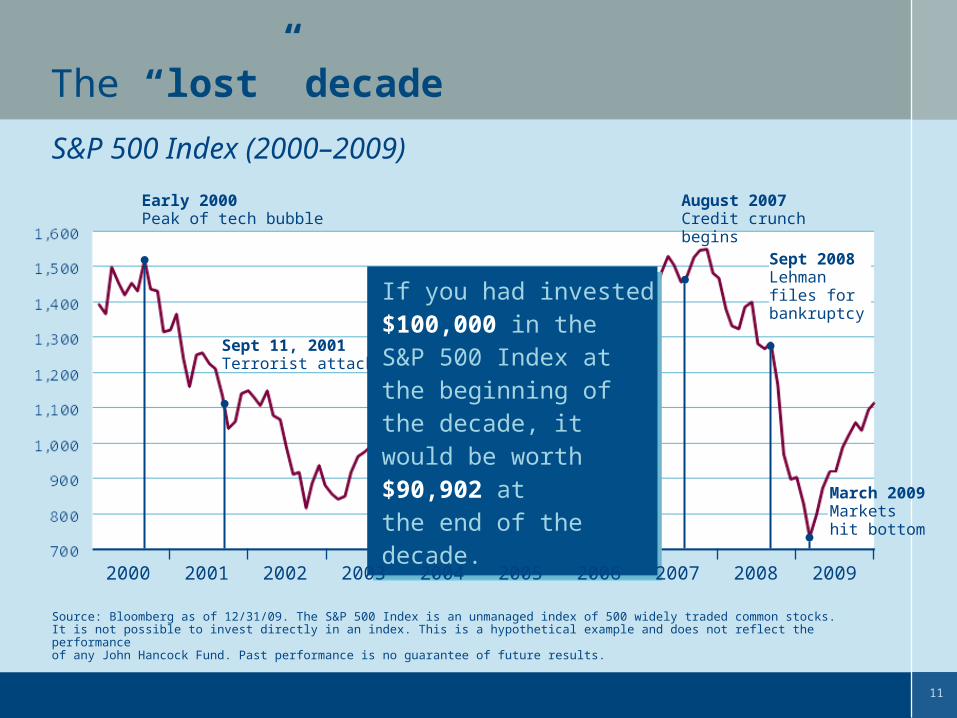
The “lost” decade
Source: Bloomberg as of 12/31/09. The S&P 500 Index is an unmanaged index of 500 widely traded common stocks. It is not possible to invest directly in an index. This is a hypothetical example and does not reflect the performance of any John Hancock Fund. Past performance is no guarantee of future results.
Sept 11, 2001Terrorist attack
Early 2000Peak of tech bubble
August 2007Credit crunch begins
Sept 2008Lehmanfiles forbankruptcy
If you had invested $100,000 in the S&P 500 Index at the beginning of the decade, it would be worth $90,902 at the end of the decade.
If you had invested $100,000 in the S&P 500 Index at the beginning of the decade, it would be worth $90,902 at the end of the decade.
S&P 500 Index (2000–2009)
March 2009Markets hit bottom
2001 2002 2003 2004 2005 2006 2007 2008 20092000
12
73.8
49.2
37.0
48.5
31.3
41.8
46.7
10.9
13.1
-17.5
31.8
26.5
Emerging Markets
International Small
Global Real Estate
Natural Resources
U.S. Real Estate
Loans
High Yield
TIPS
Global Bonds
Long-Term Govt.
Intl (MSCI EAFE)
Lg Cap (S&P 500)Large Cap (S&P 500)
Emerging Markets
International Small
Global Real Estate
Natural Resources
International (MSCI EAFE)
U.S. Real Estate
Loans
High Yield
TIPS
Global Bonds
Long-Term Government
-54.4
-49.0
-46.6
-48.8
-39.6
-29.7
-26.4
-4.1
-1.6
27.7
-43.4
-37.0
Emerging Markets
International Small
Global Real Estate
Natural Resources
U.S. Real Estate
Loans
High Yield
TIPS
Global Bonds
Long-Term Govt.
Intl (MSCI EAFE)
Lg Cap (S&P 500)
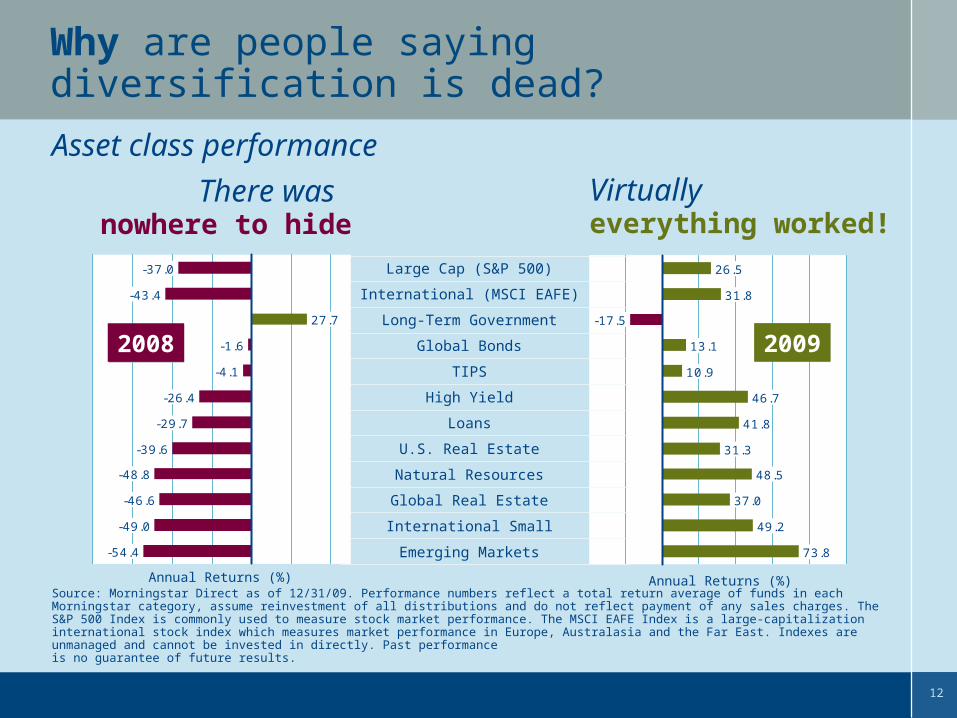
Why are people saying diversification is dead?
Source: Morningstar Direct as of 12/31/09. Performance numbers reflect a total return average of funds in each Morningstar category, assume reinvestment of all distributions and do not reflect payment of any sales charges. The S&P 500 Index is commonly used to measure stock market performance. The MSCI EAFE Index is a large-capitalization international stock index which measures market performance in Europe, Australasia and the Far East. Indexes are unmanaged and cannot be invested in directly. Past performance is no guarantee of future results.
Asset class performance
Virtually everything worked!
There was nowhere to hide
2009200920082008
Annual Returns (%) Annual Returns (%)

13
However, even over the lost decade, diversification worked
Average annual returns by category (2000–2009)
-1.0
1.2
6.1 6.2 6.6
4.73.5
10.512.2
10.6
3.6
8.7
- 5
0
5
10
15
Larg
e C
ap
(S&
P 5
00)
Inte
rnational
(MS
CI
EA
FE)
Long-T
erm
Govern
ment
Glo
bal
Bonds
TIP
S
Hig
h Y
ield
Loans
U.S
. R
eal
Est
ate
Natu
ral
Reso
uce
s
Glo
bal R
eal
Est
ate
Inte
rnational
Sm
all
Em
erg
ing
Mark
ets
Annual Returns (%)
Source: Morningstar Direct as of 12/31/09. Performance numbers reflect a total return average of funds in each Morningstar category, assume reinvestment of all distributions and do not reflect payment of any sales charges. The S&P 500 Index is commonly used to measure stock market performance. The MSCI EAFE Index is a large-capitalization international stock index which measures market performance in Europe, Australasia and the Far East. Indexes are unmanaged and cannot be invested in directly. Past performance is no guarantee of future results.

14
Understand investment cycles ― a tale of three fundsWhich of these funds would you invest in?
Source: Morningstar Direct and John Hancock Funds. Large-Cap Growth Fund 1 (John Hancock Large Cap Equity Fund) was ranked 1564 of 1683, 1297 of 1478, 164 of 1279 and 312 of 804 against large growth funds for the 1-, 3-, 5- and 10-year time periods respectively. Large-Cap Growth Fund 2 (John Hancock Rainier Growth Fund) was ranked 77 of 1683, 178 of 1478, 255 of 1279 and 319 of 804 against large growth funds for the 1-, 3-, 5- and 10-year time periods respectively. Large-Cap Growth Fund 3 (John Hancock U.S. Global Leaders Growth Fund) was ranked 1164 of 1683, 1016 of 1478, 830 of 1279 and 310 of 804 against large growth funds for the 1-, 3- 5- and 10-year time periods respectively. Performance is for Class A shares as of 12/31/2011. Rankings are based on total return and do not include sales charges.John Hancock Large Cap Equity Fund’s total annual operating expense ratio as of the current prospectus is 1.22%. John Hancock Rainier Fund’s net annual operating expense ratio as of the current prospectus is 1.35%. The gross annual operating expense ratio of 1.39% is reduced due to a contractual expense reimbursement, which is in effect until at least 7/31/11 and may be terminated by the Adviser any time after this date. John Hancock U.S. Global Leaders Growth Fund’s net annual operating expense ratio as of the current prospectus is 1.30%. The gross annual operating expense ratio of 1.73% is reduced due to a contractual expense reimbursement, which is in effect until at least 2/28/11 and may be terminated by the Adviser any time after this date. Expenses for other share classes will vary, which will affect returns. Performance figures assume that all distributions are reinvested. For performance data current to the most recent month end, contact your financial professional or call John Hancock Funds at 1-800-225-5291. The performance data contained within this material represents past performance, which does not guarantee future results. The return and principal value of an investment will fluctuate, so that shares, when redeemed, may be worth more or less than the original cost. The Fund’s current performance may be higher or lower and is subject to substantial changes. *On 4/28/08 John Hancock Rainier Growth Fund acquired all of the assets of the Rainier Large Cap Growth Equity portfolio, the Fund’s predecessor, pursuant to reorganization. Performance prior to 4/28/08 reflects the performance of the Fund’s predecessor and does not include sales charges.
Morningstar Peer Group Rankings and Average Annual Returns, as of 12/31/11Morningstar Peer Group Rankings and Average Annual Returns, as of 12/31/11
Fund Name 1-Year 3-Year 5-Year 10-Year
Large-Cap Growth Fund 1 % Rank 92 87 13 39(Average Annual Return with 5% sales charge) 8.50% -2.85% 8.07% 2.83%
Large-Cap Growth Fund 2* % Rank 69 69 65 39(Average Annual Return with 5% sales charge) 10.78% -6.46% 1.13% -0.49%
Large-Cap Growth Fund 3 % Rank 5 12 10 40(Average Annual Return with 5% sales charge) 6.56% 0.10% 1.07% 1.05%
Top Quartile 2nd Quartile 3rd Quartile 4th Quartile

15
Same category, very different performance
Full market cycle coverage (2002–2011)
Fund 1
Fund 2
20112005200420032002 2009200820072006 2010
Fund 3
Large Growth CategoryLarge Growth Category
Source: Morningstar Direct and Bloomberg. Rankings for each Fund within Morningstar Large Growth category are based on total return and do not include sales charges. Past performance is no guarantee of future results.
Large Growth CategoryLarge Growth Category
Top Quartile 2nd Quartile 3rd Quartile 4th Quartile
% Rank99
Total Ret (37.84%)
% Rank81
Total Ret23.29%
% Rank96
Total Ret 4.14%
% Rank59
Total Ret 14.20%
% Rank54
Total Ret 33.73%
% Rank91
Total Ret 3.67%
% Rank44
Total Ret 8.51%
% Rank86
Total Ret2.16%
% Rank90
Total Ret1.44%
% Rank78
Total Ret 12.16%
% Rank40
Total Ret (26.16%)
% Rank49
Total Ret7.24%
% Rank77
Total Ret (43.89%)
% Rank66
Total Ret 31.68%
% Rank38
Total Ret 16.59%
% Rank69
Total Ret -4.45%
% Rank92
Total Ret -9.03%
% Rank2
Total Ret 33.77%
% Rank1
Total Ret16.26%
% Rank3
Total Ret20.22%
% Rank19
Total Ret (36.82%)
% Rank16
Total Ret33.88%
% Rank18
Total Ret 11.60%
% Rank16
Total Ret11.61%
% Rank3
Total Ret (14.51%)
% Rank14
Total Ret 44.32%
% Rank94
Total Ret19.24%
% Rank5
Total Ret 3.85%
% Rank17
Total Ret 20.57%
% Rank10
Total Ret (34.77%)
16
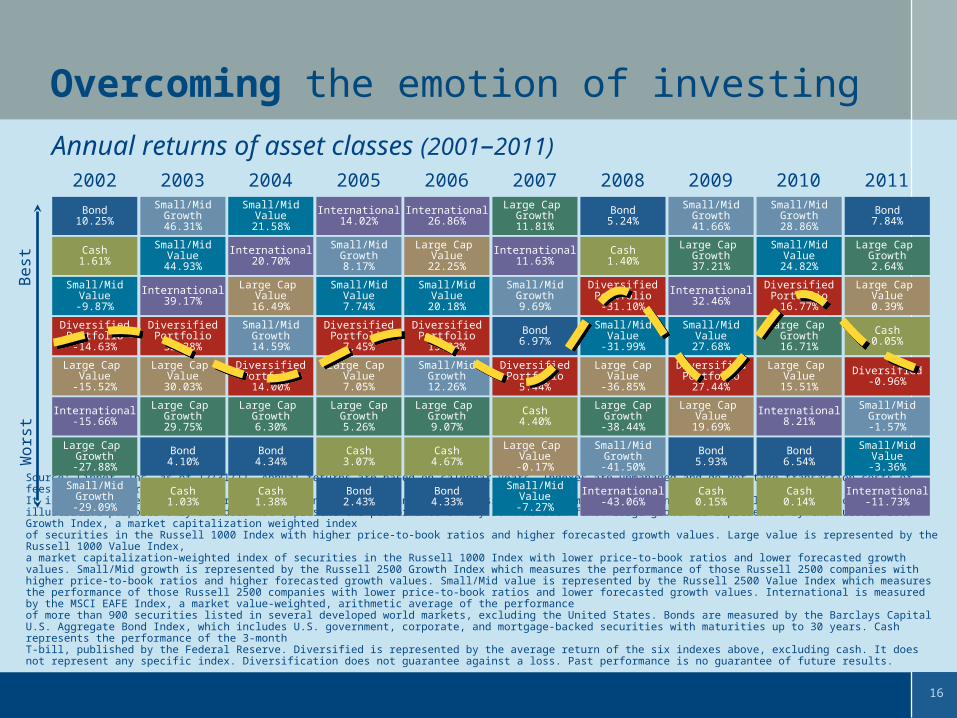
Source: Lipper, Inc. as of 12/31/11. Annual returns are based on calendar years. Indexes are unmanaged and do not take transaction costs or fees into consideration. It is not possible to invest directly in an index. Performance figures assume reinvestment of dividends and capital gains. This chart is for illustrative purposes only and does not represent the performance of any John Hancock fund. Large growth is represented by the Russell 1000 Growth Index, a market capitalization weighted index of securities in the Russell 1000 Index with higher price-to-book ratios and higher forecasted growth values. Large value is represented by the Russell 1000 Value Index, a market capitalization-weighted index of securities in the Russell 1000 Index with lower price-to-book ratios and lower forecasted growth values. Small/Mid growth is represented by the Russell 2500 Growth Index which measures the performance of those Russell 2500 companies with higher price-to-book ratios and higher forecasted growth values. Small/Mid value is represented by the Russell 2500 Value Index which measures the performance of those Russell 2500 companies with lower price-to-book ratios and lower forecasted growth values. International is measured by the MSCI EAFE Index, a market value-weighted, arithmetic average of the performance of more than 900 securities listed in several developed world markets, excluding the United States. Bonds are measured by the Barclays Capital U.S. Aggregate Bond Index, which includes U.S. government, corporate, and mortgage-backed securities with maturities up to 30 years. Cash represents the performance of the 3-month T-bill, published by the Federal Reserve. Diversified is represented by the average return of the six indexes above, excluding cash. It does not represent any specific index. Diversification does not guarantee against a loss. Past performance is no guarantee of future results.
Overcoming the emotion of investing
Annual returns of asset classes (2001–2011)
Small/MidValue
-3.36%
Cash0.05%
Large Cap Value0.39%
Small/MidGrowth-1.57%
Large Cap Growth2.64%
International-11.73%
Bond7.84%
Bond6.97%
Large Cap Growth11.81%
Small/MidGrowth12.26%
Large Cap Value
19.69%
Large Cap Value
-15.52%
Large Cap Value
30.03%
Large Cap Value7.05%
Small/MidGrowth41.66%
Small/MidValue
24.82%
Bond10.25%
Small/MidGrowth46.31%
Small/MidValue
21.58%
International14.02%
International26.86%
International32.46%
Large Cap Value
15.51%
Small/MidValue
-9.87%
International39.17%
Large Cap Value
16.49%
Small/MidValue7.74%
Small/MidValue
20.18%
Cash0.14%
Small/MidGrowth14.59%
Cash0.15%
International8.21%
International-15.66%
Large Cap Growth29.75%
Large Cap Growth6.30%
Large CapGrowth5.26%
Large Cap Growth9.07%
Small/MidValue
27.68%
Small/MidGrowth28.86%
Large Cap Growth-27.88%
Bond4.10%
Bond4.34%
Cash3.07%
Cash4.67%
Bond5.93%
Large Cap Growth16.71%
Small/MidGrowth-29.09%
Cash1.03%
Cash1.38%
Bond2.43%
Bond4.33%
Large Cap Growth37.21%
Bond6.54%
Cash1.61%
Small/MidValue
44.93%
International20.70%
Small/MidGrowth8.17%
Large Cap Value
22.25%
Small/MidGrowth9.69%
Large Cap Value
-0.17%
Cash4.40%
International11.63%
Small/MidValue
-7.27%
Large CapValue
-36.85%
Bond5.24%
Small/MidValue
-31.99%
Large CapGrowth-38.44%
Small/MidGrowth-41.50%
International-43.06%
Cash1.40%
Best
Wors
t
Diversified-0.96%
DiversifiedPortfolio16.77%
DiversifiedPortfolio14.00%
DiversifiedPortfolio27.44%
DiversifiedPortfolio-14.63%
DiversifiedPortfolio32.38%
DiversifiedPortfolio7.45%
DiversifiedPortfolio15.83%
DiversifiedPortfolio5.44%
DiversifiedPortfolio-31.10%
20092002 2003 2004 2005 2006 2007 2008 2010 2011
17
What should investors remember?
Judging the entire market by the performance of the S&P 500 Index is not diversifying.
Asset allocation and diversification are long-term strategies — they may appear not to work over short periods, but they do work long term.
Go deeper with diversification and include more asset classes, styles and managers.
Asset allocation is not dead, but it is misunderstood
Asset allocation and diversification do not guarantee a profit nor protect against a loss. The value of a company’s equity securities is subject to change in the company’s financial condition, and overall market and economic conditions. Fixed-income investments are subject to interest rate and credit risk; their value will normally decline as interest rates rise or if the creditor is unable or unwilling to make principal or interest payments. Foreign investing, especially in emerging markets, has additional risks such as currency and market volatility and political and social instability.

1818
3Principle
Not all bonds ―or bond funds ―
are created equal
19
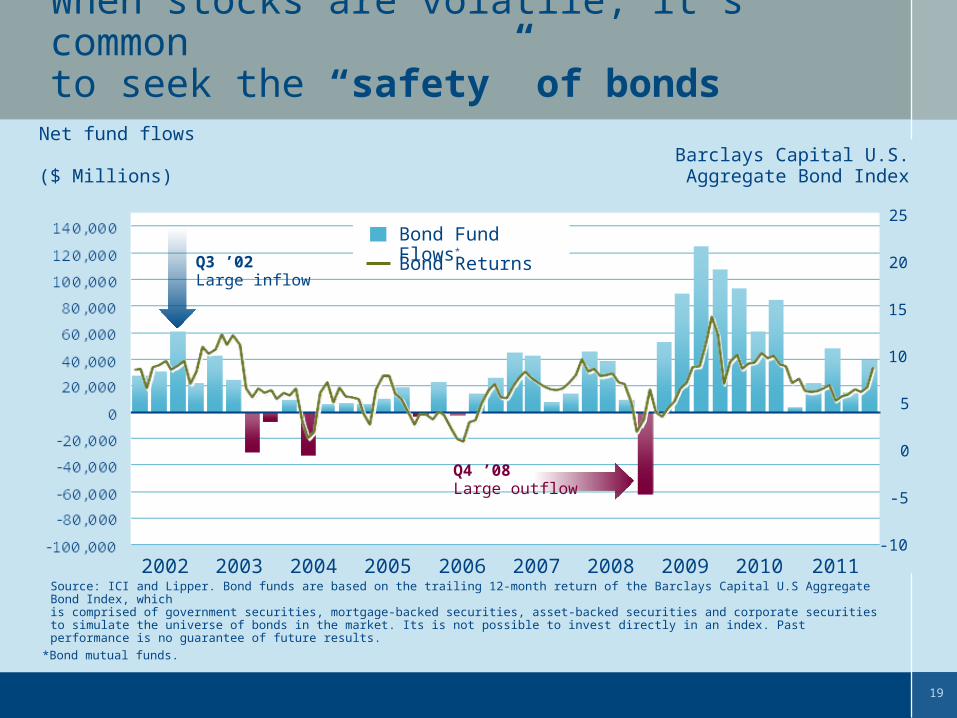
Source: ICI and Lipper. Bond funds are based on the trailing 12-month return of the Barclays Capital U.S Aggregate Bond Index, which is comprised of government securities, mortgage-backed securities, asset-backed securities and corporate securities to simulate the universe of bonds in the market. Its is not possible to invest directly in an index. Past performance is no guarantee of future results.
*Bond mutual funds.
When stocks are volatile, it’s common to seek the “safety” of bonds
Barclays Capital U.S. Aggregate Bond Index
Net fund flows ($ Millions)
Q4 ’08Large outflow
-10
-5
0
5
10
15
20
25
Bond Returns
Bond Fund Flows*
2004 2005 2010 2011200820072006 200920032002
Q3 ’02Large inflow
20
0123456
01/0
2/20
0202
/01/
2002
03/0
1/20
0204
/01/
2002
05/0
1/20
0206
/03/
2002
07/0
1/20
0208
/01/
2002
09/0
3/20
0210
/01/
2002
11/0
1/20
0212
/02/
2002
01/0
2/20
0302
/03/
2003
03/0
3/20
0304
/01/
2003
05/0
1/20
0306
/02/
2003
07/0
1/20
0308
/01/
2003
09/0
2/20
0310
/01/
2003
11/0
3/20
0312
/01/
2003
01/0
2/20
0402
/02/
2004
03/0
1/20
0404
/01/
2004
05/0
3/20
0406
/01/
2004
07/0
1/20
0408
/02/
2004
09/0
1/20
0410
/01/
2004
11/0
1/20
0412
/01/
2004
01/0
3/20
0502
/01/
2005
03/0
1/20
0504
/01/
2005
05/0
2/20
0506
/01/
2005
07/0
1/20
0508
/01/
2005
09/0
1/20
0510
/03/
2005
11/0
1/20
0512
/01/
2005
01/0
3/20
0602
/01/
2006
03/0
1/20
0604
/03/
2006
05/0
1/20
0606
/01/
2006
07/0
3/20
0608
/01/
2006
09/0
1/20
0610
/02/
2006
11/0
1/20
0612
/01/
2006
01/0
3/20
0702
/01/
2007
03/0
1/20
0704
/02/
2007
05/0
1/20
0706
/01/
2007
07/0
2/20
0708
/01/
2007
09/0
4/20
0710
/01/
2007
11/0
1/20
0712
/03/
2007
01/0
2/20
0802
/01/
2008
03/0
3/20
0804
/01/
2008
05/0
1/20
0806
/02/
2008
07/0
1/20
0808
/01/
2008
09/0
2/20
0810
/01/
2008
11/0
3/20
0812
/01/
2008
01/0
2/20
0902
/02/
2009
03/0
2/20
0904
/01/
2009
05/0
1/20
0906
/01/
2009
07/0
1/20
0908
/03/
2009
09/0
1/20
0910
/01/
2009
11/0
2/20
0912
/01/
2009
01/0
1/20
1002
/01/
2010
03/0
1/20
1004
/01/
2010
05/0
1/20
1006
/01/
2010
07/0
1/20
1008
/01/
2010
09/0
1/20
1010
/01/
2010
11/0
1/20
1012
/01/
2010
2011
-01
2011
-02
2011
-03
2011
-04
2011
-05
2011
-06
2011
-07
2011
-08
2011
-09
2011
-10
2011
-11
2011
-12
(%)
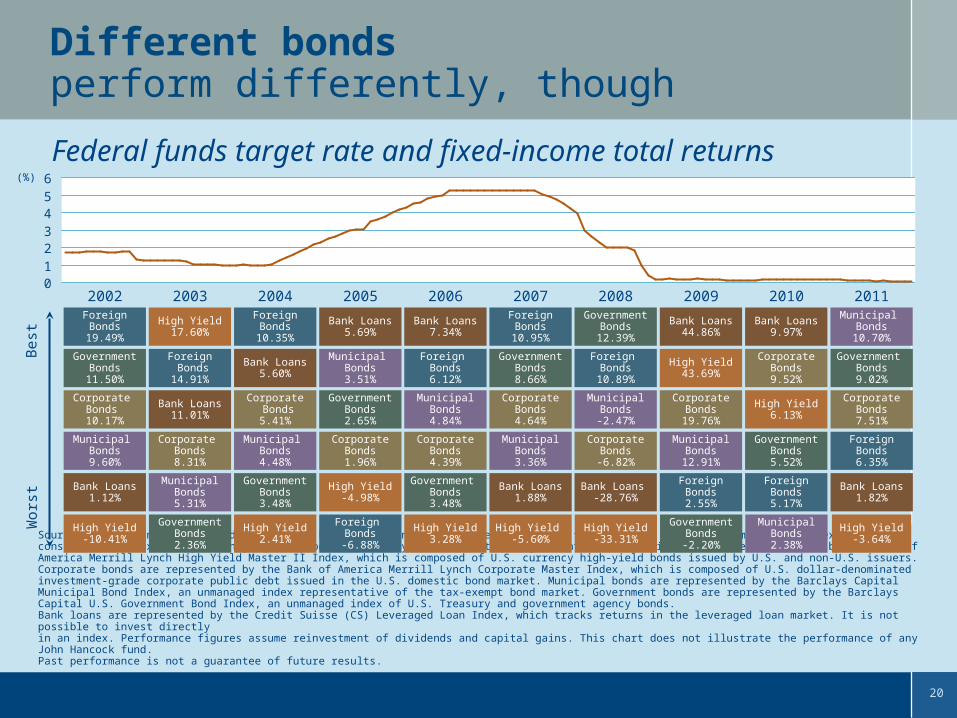
Different bonds perform differently, though
Source: Lipper, Inc and the Federal Reserve Board. Foreign bonds are represented by the Citigroup World Government Bond Index, which consists of approximately 600 high-quality bonds issued by 17 different foreign countries. High-yield bonds are represented by the Bank of America Merrill Lynch High Yield Master II Index, which is composed of U.S. currency high-yield bonds issued by U.S. and non-U.S. issuers. Corporate bonds are represented by the Bank of America Merrill Lynch Corporate Master Index, which is composed of U.S. dollar-denominated investment-grade corporate public debt issued in the U.S. domestic bond market. Municipal bonds are represented by the Barclays Capital Municipal Bond Index, an unmanaged index representative of the tax-exempt bond market. Government bonds are represented by the Barclays Capital U.S. Government Bond Index, an unmanaged index of U.S. Treasury and government agency bonds. Bank loans are represented by the Credit Suisse (CS) Leveraged Loan Index, which tracks returns in the leveraged loan market. It is not possible to invest directly in an index. Performance figures assume reinvestment of dividends and capital gains. This chart does not illustrate the performance of any John Hancock fund. Past performance is not a guarantee of future results.
Federal funds target rate and fixed-income total returns
Best
Wors
t
MunicipalBonds
12.91%
High Yield43.69%
CorporateBonds
19.76%
ForeignBonds2.55%
GovernmentBonds-2.20%
Bank Loans44.86%
Bank Loans1.12%
ForeignBonds
19.49%
Corporate Bonds 10.17%
Municipal Bonds9.60%
High Yield-10.41%
GovernmentBonds
11.50%
MunicipalBonds5.31%
High Yield17.60%
Bank Loans11.01%
Corporate Bonds8.31%
GovernmentBonds2.36%
Foreign Bonds14.91%
Municipal Bonds4.48%
ForeignBonds
10.35%
Bank Loans5.60%
Corporate Bonds5.41%
GovernmentBonds3.48%
High Yield2.41%
CorporateBonds1.96%
Bank Loans5.69%
High Yield-4.98%
GovernmentBonds2.65%
Foreign Bonds-6.88%
Municipal Bonds3.51%
CorporateBonds4.39%
High Yield3.28%
Foreign Bonds6.12%
MunicipalBonds4.84%
Government Bonds3.48%
Bank Loans7.34%
High Yield -5.60%
ForeignBonds
10.95%
CorporateBonds4.64%
MunicipalBonds3.36%
Bank Loans1.88%
GovernmentBonds8.66%
High Yield-33.31%
GovernmentBonds
12.39%
MunicipalBonds-2.47%
CorporateBonds-6.82%
Bank Loans -28.76%
Foreign Bonds
10.89%
GovernmentBonds5.52%
High Yield6.13%
CorporateBonds9.52%
ForeignBonds5.17%
MunicipalBonds2.38%
Bank Loans9.97%
Bank Loans1.82%
CorporateBonds7.51%
Municipal Bonds
10.70%
High Yield-3.64%
ForeignBonds6.35%
Government Bonds9.02%
20092002 2003 2004 2005 2006 2007 2008 2010 2011
21
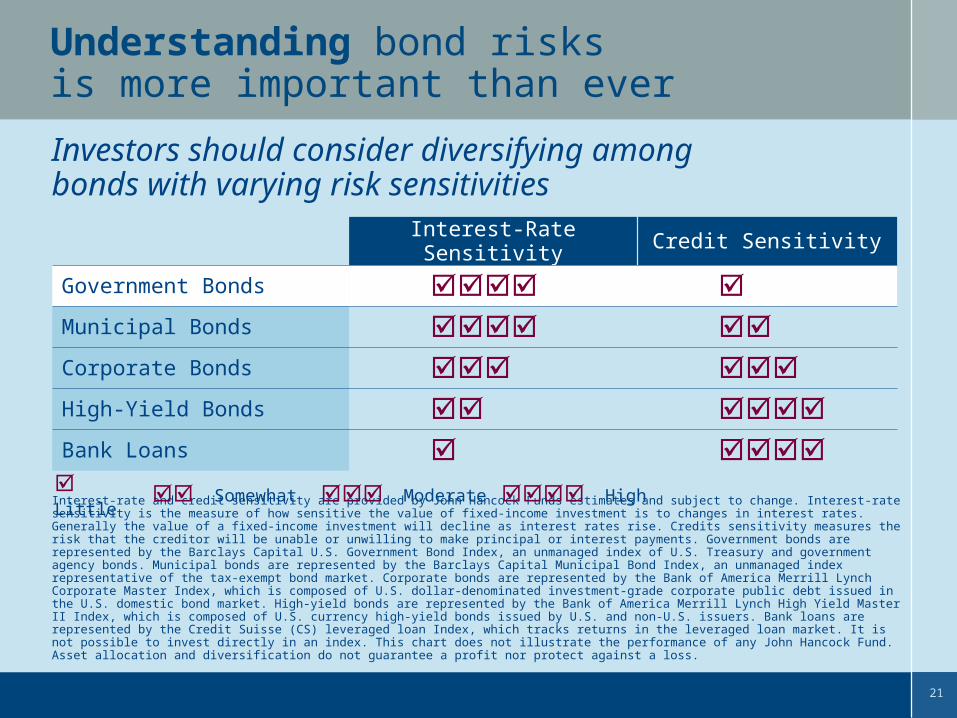
Understanding bond risks is more important than ever
Investors should consider diversifying among bonds with varying risk sensitivities
Interest-rate and credit sensitivity are provided by John Hancock Funds estimates and subject to change. Interest-rate sensitivity is the measure of how sensitive the value of fixed-income investment is to changes in interest rates. Generally the value of a fixed-income investment will decline as interest rates rise. Credits sensitivity measures the risk that the creditor will be unable or unwilling to make principal or interest payments. Government bonds are represented by the Barclays Capital U.S. Government Bond Index, an unmanaged index of U.S. Treasury and government agency bonds. Municipal bonds are represented by the Barclays Capital Municipal Bond Index, an unmanaged index representative of the tax-exempt bond market. Corporate bonds are represented by the Bank of America Merrill Lynch Corporate Master Index, which is composed of U.S. dollar-denominated investment-grade corporate public debt issued in the U.S. domestic bond market. High-yield bonds are represented by the Bank of America Merrill Lynch High Yield Master II Index, which is composed of U.S. currency high-yield bonds issued by U.S. and non-U.S. issuers. Bank loans are represented by the Credit Suisse (CS) leveraged loan Index, which tracks returns in the leveraged loan market. It is not possible to invest directly in an index. This chart does not illustrate the performance of any John Hancock Fund. Asset allocation and diversification do not guarantee a profit nor protect against a loss.
Interest-Rate Sensitivity Credit Sensitivity
Government Bonds Municipal Bonds Corporate Bonds High-Yield Bonds Bank Loans
Little Somewhat Moderate High

22
Balancing risk with yield
Fixed income yields (2006–2011)
0
4
8
12
16
20
2006 2007 2008 2009 2010 2011
High Yield Bonds
Corporate Bonds
Government Bonds
Inflation
3.88%
8.29%
1.05%Inflation 2.99%
Yie
ld (
%)
Source: Bloomberg as of 12/31/11. High-yield bonds are represented by the Bank of America Merrill Lynch High Yield Master II Index, which is composed of U.S. currency high-yield bonds issued by U.S. and non-U.S. issuers. Corporate bonds are represented by the Bank of America Merrill Lynch Corporate Master Index, which is composed of U.S. dollar-denominated investment-grade corporate public debt issued in the U.S. domestic bond market. Government bonds are represented by the Bank of America U.S. Treasury Master Index, an unmanaged index of U.S. Treasury and government agency bonds. Inflation is measured by the Consumer Price Index published by the U.S. Bureau of Labor Statistics. It is not possible to invest directly in an index. Performance figures assume reinvestment of dividends and capital gains. This chart does not illustrate the performance of any John Hancock fund. Past performance is not a guarantee of future results.
2006 2007 2008 2009 2010 2011
23
What should investors remember?
Holding bonds in your portfolio may provide the income you need with less volatility than stocks.
Different types of bonds perform well in different economic environments.
Bond funds should be diversified too.
Not all bonds — or bond funds — are created equal
Fixed-income investments are subject to interest rate and credit risk; their value will normally decline as interest rates rise or if the creditor is unable or unwilling to make principal or interest payments. Investments in higher-yielding, lower-rated securities involve additional risks as these securities include a higher risk of default and loss of principal. Asset allocation and diversification do not guarantee a profit nor protect against a loss.

2424
4Principle
Yes, it’s STILL stocksfor the long run
25
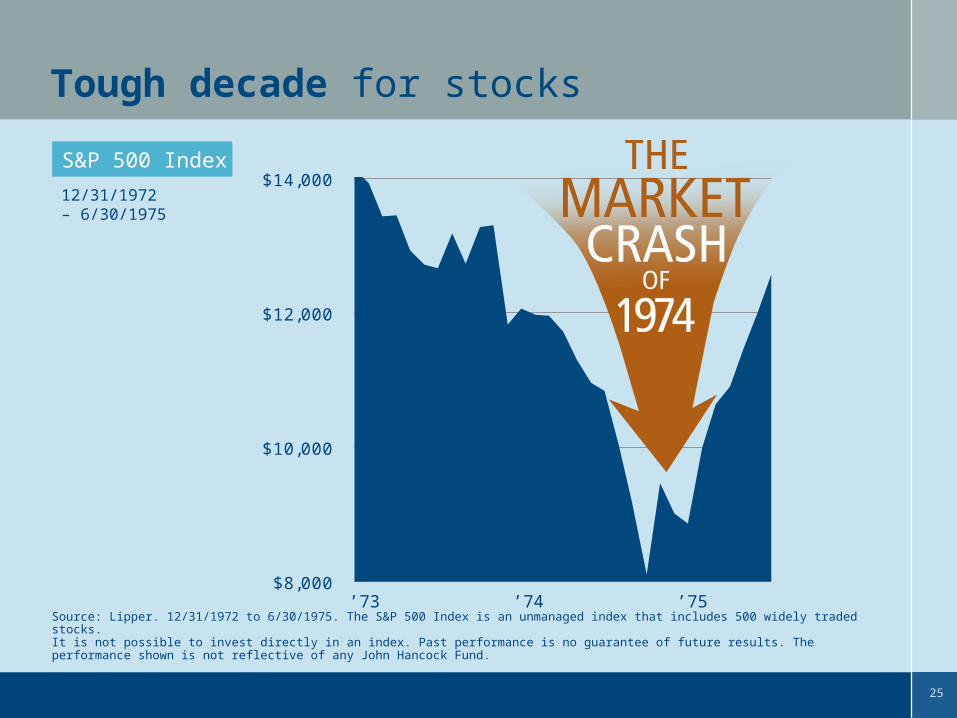
$8,000
$10,000
$12,000
$14,000
Tough decade for stocks
Source: Lipper. 12/31/1972 to 6/30/1975. The S&P 500 Index is an unmanaged index that includes 500 widely traded stocks.It is not possible to invest directly in an index. Past performance is no guarantee of future results. The performance shown is not reflective of any John Hancock Fund.
S&P 500 Index S&P 500 Index
12/31/1972 – 6/30/1975
’73 ’74 ’75

26
$0
$200
$400
$600
1970
1972
1974
1976
1978
1980
1982
1984
1986
1988
1990
1992
1994
1996
1998
2000
2002
2004
2006
2008
2010
Thousands
Put the market in perspective
Source: Lipper. 1/1/1970 to 12/31/2011. The S&P 500 Index is an unmanaged index that includes 500 widely traded stocks.It is not possible to invest directly in an index. Past performance is no guarantee of future results. The performance shown is not reflective of any John Hancock fund.
S&P 500 Index (1970–2011)

27
Stocks outperform over the long term
Average annual returns (1926–2011)
Source: Calculated by John Hancock Funds, LLC using information and data presented in ENCORR Software, ©2011 Morningstar, Inc. All rights reserved. Used with permission. Stocks are represented by the S&P 500 Index, an unmanaged, commonly used measure of common stock total return performance. Corporate bonds are represented by the Ibbotson U.S. Aggregate Index which is comprised of government securities, mortgage-backed securities, asset-backed securities and corporate securities to simulate the universe of bonds in the market. U.S. government bonds are represented by the Ibbotson Government Bond Index which is an unmanaged index of U.S. Treasury and government agency bonds. Cash equivalents are represented by the Ibbotson 30-day Treasury Bill Index which measures the performance of one-month maturity U.S. Treasury Bills and are a commonly used measure of a savings investment. Inflation is measured by the Consumer Price Index published by the U.S. Bureau of Labor Statistics. It is not possible to invest directly in an index. Past performance is no guarantee of future results.
Stocks 9.78%
Corporate Bonds 6.06%
Long-Term Government Bonds 5.72%
Cash Equivalents 3.58%
Inflation (CPI) 2.99%

28
4 4 4 4
10
12
4
89
12
6
< 0 0 to2%
2 to4%
4 to6%
6 to8%
8 to10%
10 to12%
12 to14%
14 to16%
16 to18%
> 18%
Rolling 10-year stock market returns
For calendar year-end periods (1926–2011)
Source: Calculated by John Hancock Funds, LLC using information and data presented in ENCORR Software, ©2011 Morningstar, Inc. All rights reserved. Used with permission. Stocks are represented by the S&P 500 Index, an unmanaged, commonly used measure of common stock total return performance. It is not possible to invest directly in an index. Past performance is no guarantee of future results.
Number of OccurrencesNumber of Occurrences
200620052002
19801972
1970
1966194919471945
1944
1942
2000
1992199119891988
19611960
19571955
1954
1952
1951
2007
19791946
1935
2003
19831968
1965
19821981
1976
1973
1971196919481943
19411936
2004
20011990
1986
196719641962
1950
199619951994
199319871985
1984
1963
1953
1999199819971959
19581956
2008
1939
1938
2009
19741940
1937
201019781977
1975
2011

29
$0
$100,000
$200,000
$300,000
$400,000
$500,000
$600,000
'70 '75 '80 '85 '90 '95 '00 '05 '10
Without dividends
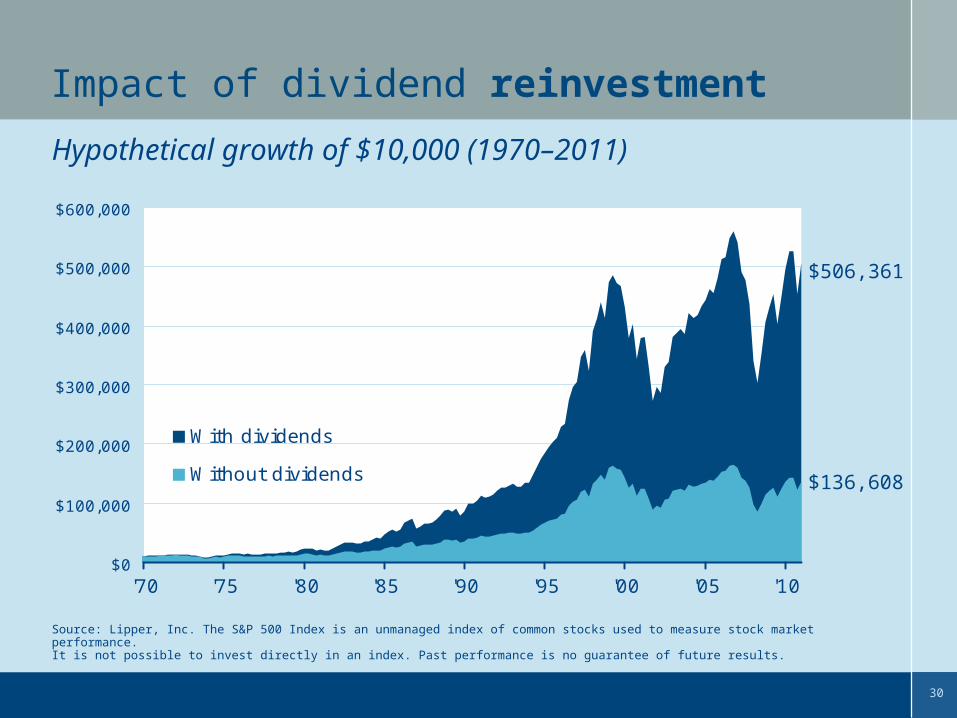
Impact of dividend reinvestment
Source: Lipper, Inc. The S&P 500 Index is an unmanaged index of common stocks used to measure stock market performance. It is not possible to invest directly in an index. Past performance is no guarantee of future results.
Hypothetical growth of $10,000 (1970–2011)
Are Dividends Important?
$136,608
30
$0
$100,000
$200,000
$300,000
$400,000
$500,000
$600,000
'70 '75 '80 '85 '90 '95 '00 '05 '10
With dividends
Without dividends
Impact of dividend reinvestment
Source: Lipper, Inc. The S&P 500 Index is an unmanaged index of common stocks used to measure stock market performance. It is not possible to invest directly in an index. Past performance is no guarantee of future results.
Hypothetical growth of $10,000 (1970–2011)
$136,608
$506,361
31
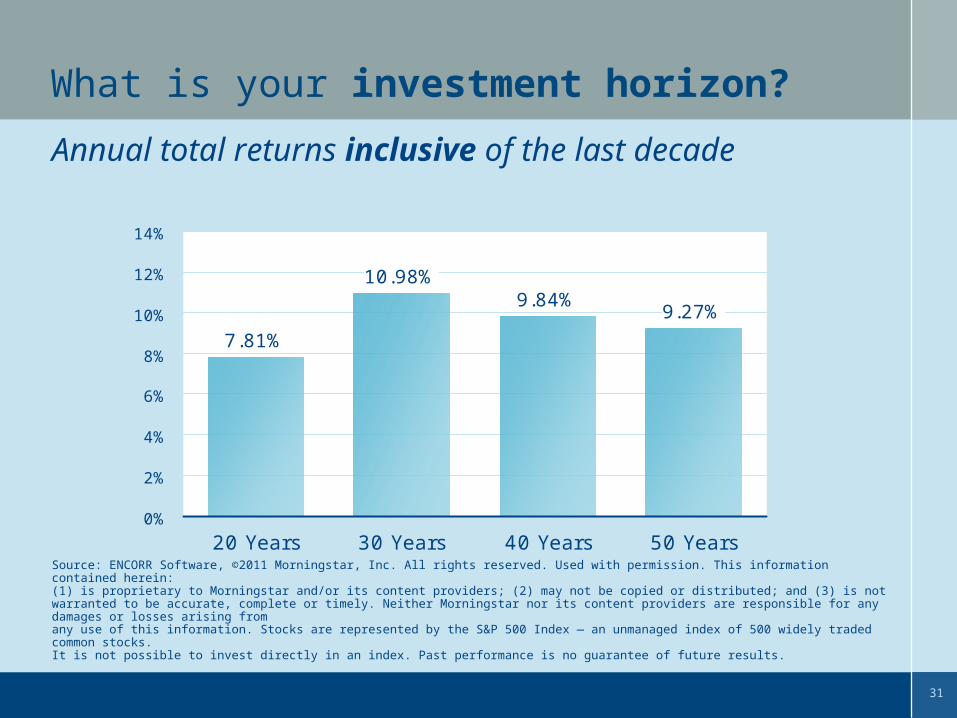
7.81%
10.98%9.84%
9.27%
0%
2%
4%
6%
8%
10%
12%
14%
20 Years 30 Years 40 Years 50 Years
What is your investment horizon?
Annual total returns inclusive of the last decade
Source: ENCORR Software, ©2011 Morningstar, Inc. All rights reserved. Used with permission. This information contained herein: (1) is proprietary to Morningstar and/or its content providers; (2) may not be copied or distributed; and (3) is not warranted to be accurate, complete or timely. Neither Morningstar nor its content providers are responsible for any damages or losses arising from any use of this information. Stocks are represented by the S&P 500 Index — an unmanaged index of 500 widely traded common stocks. It is not possible to invest directly in an index. Past performance is no guarantee of future results.

32
What should investors remember?
Equities remain a great way to fight inflation over the long term.
By maintaining a long-term perspective, you will be better positioned to maintain arationale mindset during periods of volatility.
Reinvesting dividends can enhance total return.
Yes, it’s STILL stocks for the long run!
The value of a company’s equity securities is subject to change in the company’s financial condition, and overall market and economic conditions. Past performance is no guarantee of future results.

3333
5Principle
Investing abroadshouldn’t be a
foreign experience
Patrick L. McFawn CFP®, CPA & Dale L. White CFP®, CPA
34
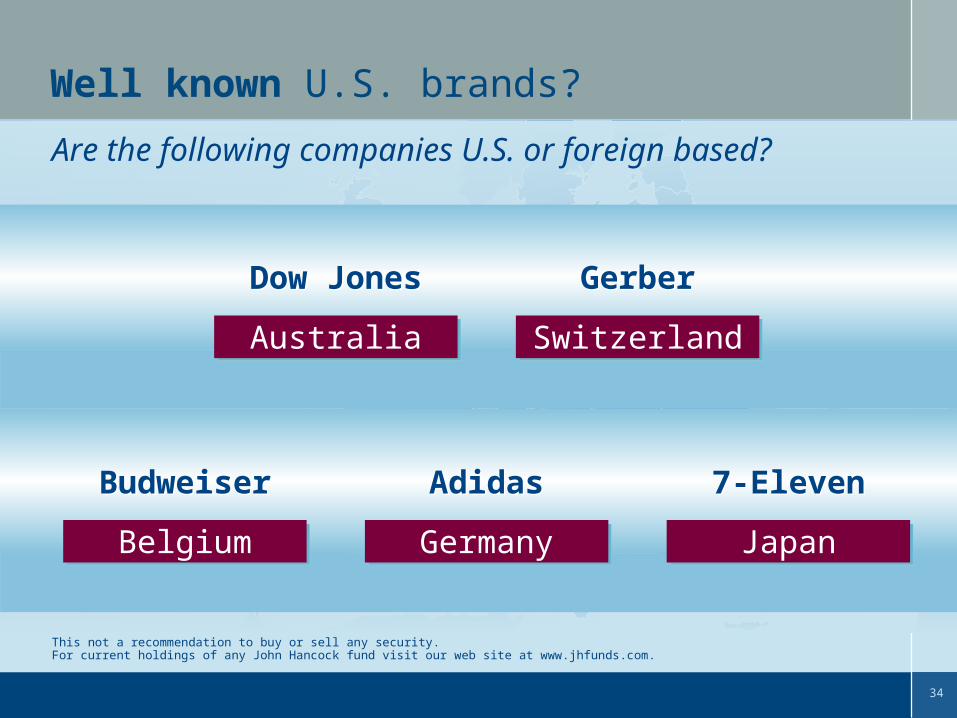
Well known U.S. brands?
Are the following companies U.S. or foreign based?
This not a recommendation to buy or sell any security.For current holdings of any John Hancock fund visit our web site at www.jhfunds.com.
BelgiumBelgium
SwitzerlandSwitzerlandAustraliaAustralia
GermanyGermany JapanJapan
Dow JonesDow Jones GerberGerber
BudweiserBudweiser AdidasAdidas 7-Eleven7-Eleven
35
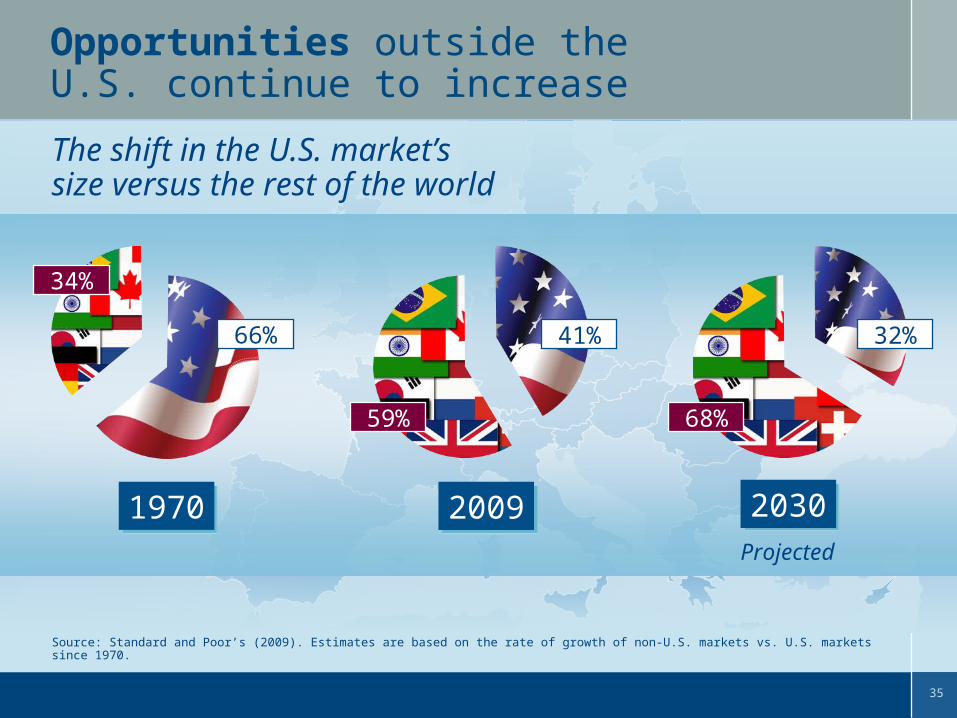
Opportunities outside the U.S. continue to increase
Source: Standard and Poor’s (2009). Estimates are based on the rate of growth of non-U.S. markets vs. U.S. markets since 1970.
The shift in the U.S. market’s size versus the rest of the world
66%
19701970
34%
20092009
41%
59%
Projected
20302030
32%
68%
36
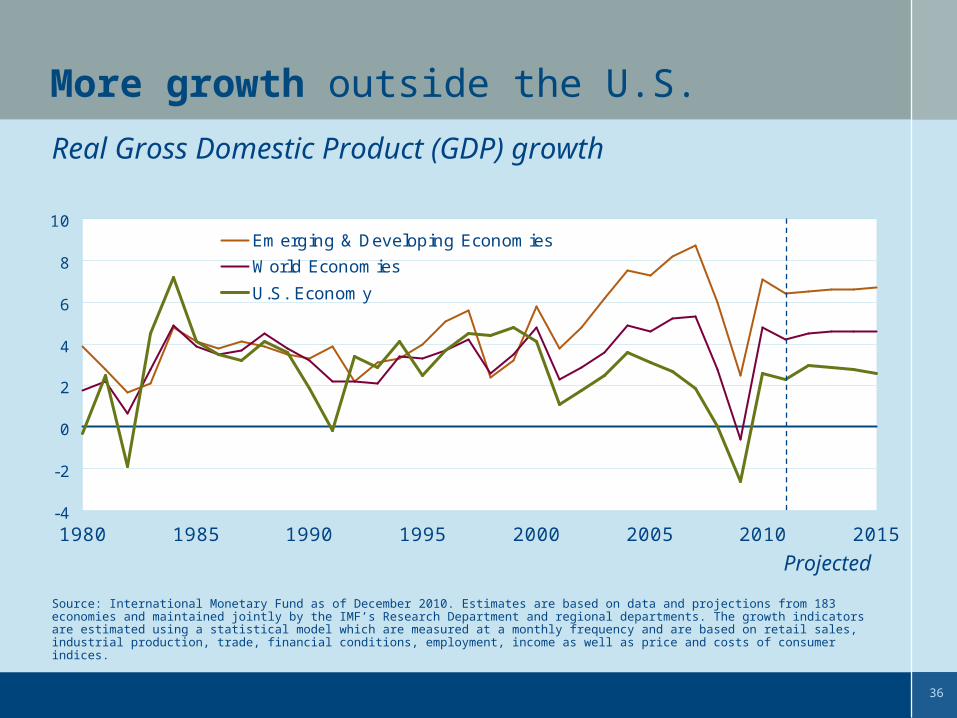
Source: International Monetary Fund as of December 2010. Estimates are based on data and projections from 183 economies and maintained jointly by the IMF’s Research Department and regional departments. The growth indicators are estimated using a statistical model which are measured at a monthly frequency and are based on retail sales, industrial production, trade, financial conditions, employment, income as well as price and costs of consumer indices.
More growth outside the U.S.
Real Gross Domestic Product (GDP) growth
-4
-2
0
2
4
6
8
10
1980 1985 1990 1995 2000 2005 2010 2015
Emerging & Developing Economies
World Economies
U.S. Economy
Projected
37
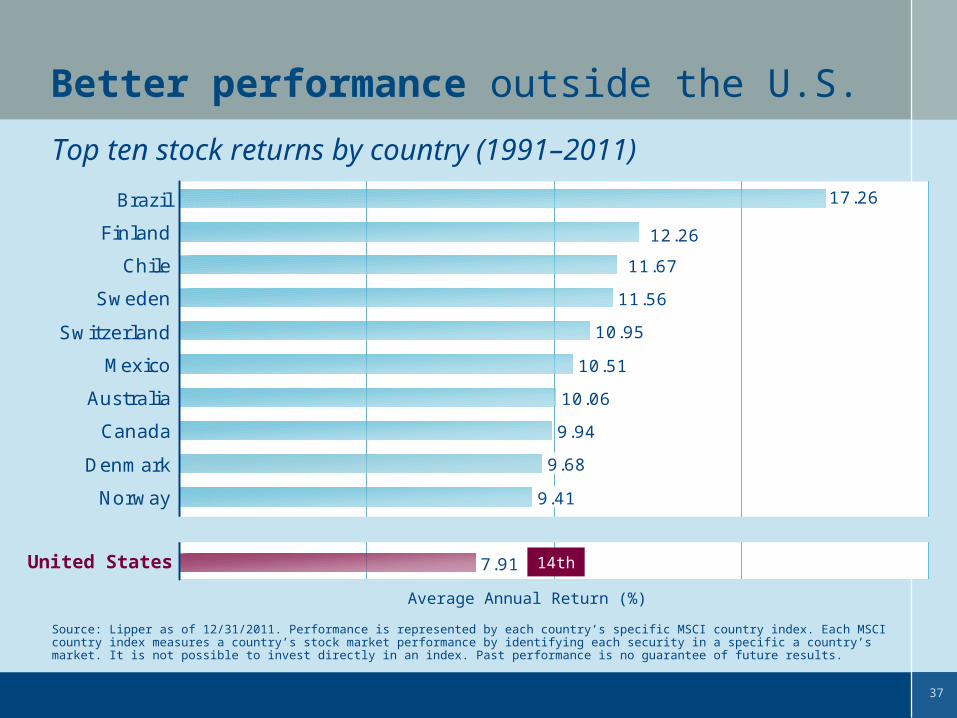
Top ten stock returns by country (1991–2011)
Better performance outside the U.S.
Source: Lipper as of 12/31/2011. Performance is represented by each country’s specific MSCI country index. Each MSCI country index measures a country’s stock market performance by identifying each security in a specific a country’s market. It is not possible to invest directly in an index. Past performance is no guarantee of future results.
11.56
10.95
10.51
9.94
9.68
9.41
7.91
10.06
17.26
12.26
11.67
Brazil
Finland
Chile
Sweden
Switzerland
Mexico
Australia
Canada
Denmark
Norway
United States 14thUnited States
Average Annual Return (%)

38
What should investors remember?
Foreign companies offer some of the best opportunities for growth.
Diversifying with foreign companies may actually improve returns while also reducing overall portfolio volatility.
Investing abroad shouldn’t be a foreign experience
Foreign investing, especially in emerging markets, has additional risks such as currency and market volatility and political and social instability.

3939
Where do wego from here?

40
24
3032
< -0.2% -0.2 to 19.8% >19.8%
Stocks are a market of extremes — investors should expect volatility in the short term
Source: Calculated by John Hancock Funds, LLC using information and data presented in ENCORR Software, ©2011 Morningstar, Inc. All rights reserved. Used with permission. Based on average annual percentage returns for the S&P 500 Index over 85 one-year periods from 1926–2011, assuming reinvestment of dividends and capital gains. The S&P 500 Index is an unmanaged index of 500 widely traded common stocks. It is not possible to invest directly in an index. Past performance is no guarantee of future results.
What’s the most common occurrence in the stock market in a calendar year?What’s the most common occurrence in the stock market in a calendar year?
Calendar year returns of 8–12% have occurred ONLY 5 TIMES IN THE 86 YEARS SINCE 1926
37.2%34.9%
27.9%
1926–2011
# of Occurrences /% of Occurrences
< 0% 0 to 20% > 20%

41
Market performance
Positive
Negative
But invest for the long term
This hypothetical scenario is for illustration purposes only and is not a prediction of future market conditions.
Riskiesttime
Best opportunityto make money
EUPHORIC“I should quit my job and do this full-time!
Look at the money I’m making!”
Confident“I’ve already
made money. This is great.”
Nervous“What happened? What is going on?”
Desperate“There’s no
point in selling now, I’ve lost
too much.”
DEFEATED“There go my dreams of
an early retirement.”
Hopeful“Things seem like they’re
turning around.”
42
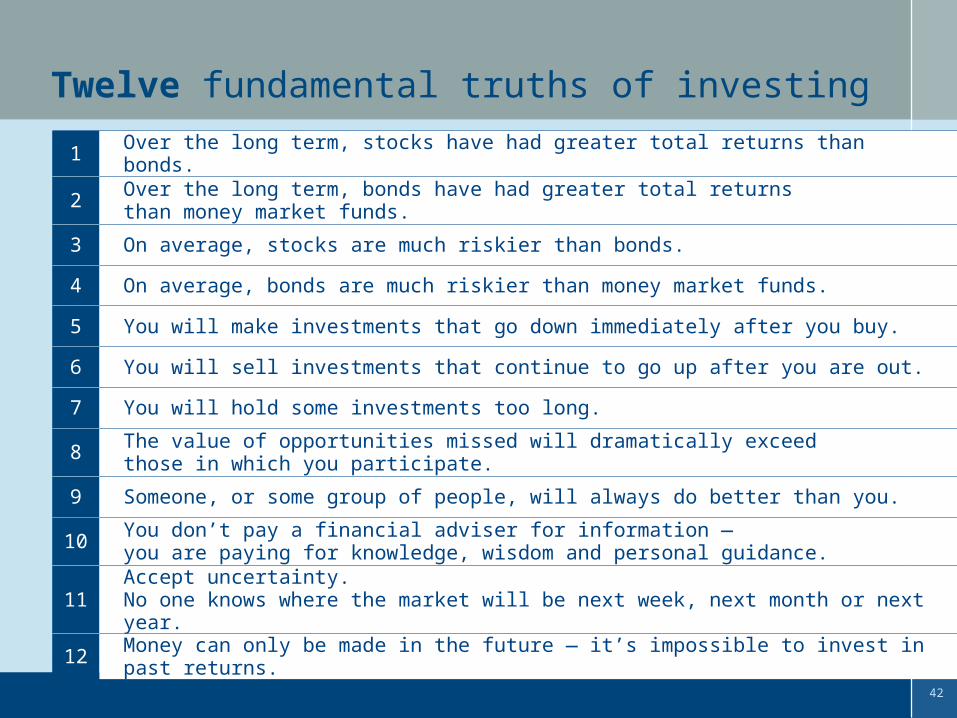
Twelve fundamental truths of investing
Source: Horsesmouth LLC.
1 Over the long term, stocks have had greater total returns than bonds.
2 Over the long term, bonds have had greater total returns than money market funds.
3 On average, stocks are much riskier than bonds.
4 On average, bonds are much riskier than money market funds.
5 You will make investments that go down immediately after you buy.
6 You will sell investments that continue to go up after you are out.
7 You will hold some investments too long.
8 The value of opportunities missed will dramatically exceed those in which you participate.
9 Someone, or some group of people, will always do better than you.
10 You don’t pay a financial adviser for information ― you are paying for knowledge, wisdom and personal guidance.
11 Accept uncertainty. No one knows where the market will be next week, next month or next year.
12 Money can only be made in the future ― it’s impossible to invest in past returns.
43
A fund’s investment objectives, risks, charges and expenses should be considered before investing. The prospectus contains this and other important information about the fund. To obtain a prospectus, call your financial professional or John Hancock Funds at 1-800-225-5291 or visit our Web site at www.jhfunds.com. Please read the prospectus carefully before investing or sending money.
A word about risk
The performance data contained in this presentation represents past performance, which does not guarantee future results. Performance, especially for short time periods, should not be the sole factor in making your investment decisions.
LLCP 8/12
John Hancock Funds, LLC • MEMBER FINRA/SIPC • 601 Congress Street, Boston, MA 02210-2805 • www.jhfunds.com
NOT FDIC INSURED. MAY LOSE VALUE. NO BANK GUARANTEE. NOT INSURED BY ANY GOVERNMENT AGENCY.