the pepsi bottling group, inc
TRANSCRIPT
The Pepsi Bottling Group, Inc. Our first annual report
1999
The Pepsi Bottling Group, Inc.1 Pepsi WaySomers, New York 10589
Th
e P
ep
si B
ottlin
g G
rou
p, In
c. An
nu
al R
ep
ort 19
99

Board of Directors
The Pepsi Bottling Group is extremely proud of the nine diverse, seasoned leaders serving on its Board of Directors. They
represent a wide variety of industries and areas of expertise. Recognizing that the heart of PBG’s business lies in the com-
pany’s “up and down the street” transactions and in the hands of our frontline employees, the Board spent considerable time
familiarizing themselves with our plants, trucks, warehouses, marketplace strategies and the daily routine of our sales
teams. On a visit to our Denver Market Unit, they donned official PBG uniforms and accompanied our customer represen-
tatives on route rides, participated in market tours, worked with merchandising materials, and experienced plant opera-
tions first-hand. This hands-on experience gave our Board a look at just how close the PBG front line is to our bottom line.
(Left to right)
Craig E. Weatherup, 54, is Chairman and Chief Executive Officer ofThe Pepsi Bottling Group, Inc. He assumed this post in November 1998,having served as Chairman and CEO of Pepsi-Cola Company since July1996. Prior to this, he was President of PepsiCo, Inc. He is a 25-yearveteran of the Pepsi system.
Barry H. Beracha, 58, has been Chairman of the Board and ChiefExecutive Officer of The Earthgrains Company since 1993. Earthgrainswas formerly part of Anheuser-Busch Companies, where Mr. Berachaserved from 1967 to 1996.
Thomas W. Jones, 50, is Chairman and Chief Executive Officer,Global Investment Management and Private Banking Group for Citigroup.He is also Co-Chairman and CEO of SSB Citi Asset Management Group, aposition he assumed in October 1998. Mr. Jones previously was Chairmanand CEO of Salomon SmithBarney Asset Management.
Susan D. Kronick, 48, has been Chairman and Chief ExecutiveOfficer of Burdines, a division of Federated Department Stores, since June1997. Prior to that, she was President of Federated’s Rich’s/Lazarus/Goldsmith’s division from 1993 to 1997.
John T. Cahill, 42, is Executive Vice President and Chief FinancialOfficer of The Pepsi Bottling Group, Inc. He assumed this post inNovember 1998, having served as Executive Vice President and CFO ofPepsi-Cola Company since April 1998. Prior to that, Mr. Cahill wasSenior Vice President and Treasurer of PepsiCo, appointed to that posi-tion in April 1997.
(Left to right)
Linda G. Alvarado, 47, is President and Chief Executive Officer ofAlvarado Construction, Inc., a general contracting firm specializing incommercial, industrial, environmental and heavy engineering projects, aposition she has held since 1976. She is also a partner of Major LeagueBaseball’s Colorado Rockies.
Robert F. Sharpe, Jr., 48, is Senior Vice President, Public Affairs,General Counsel and Secretary of PepsiCo, Inc. Prior to joining PepsiCoin January 1998, he was Senior Vice President and General Counsel ofRJR Nabisco Holdings Corp.
Karl M. von der Heyden, 63, has been Vice Chairman of PepsiCo,Inc. since September 1996. He also served as Chief Financial Officer ofPepsiCo from 1996 until March 1998. He was Co-Chairman and ChiefExecutive Officer of RJR Nabisco from March through May 1993 andCFO from 1989 to 1993.
Thomas H. Kean, 64, has been President of Drew University since1990. Mr. Kean was Governor of the State of New Jersey from 1982 to 1990.
Financial Highlights
Net Revenues $7,505 $7,041 7%
Operating Income (1) $ 396 $ 277 43%
EBITDA(1) $ 901 $ 721 25%
EPS (1)(2) $ 0.71 $ 0.17 318%
Operating Cash Flow (3) $ 161 $ 125 29%
Capital Spending $ 560 $ 507 10%
(1) Excludes the impact of unusual impairment and other charges and credits.
(2) Reflects the initial public offering of 100 million shares of common stock on March 31, 1999 as if the shares
were outstanding during the entire periods presented. The 1999 results also reflect the impact of our share
repurchase program, which began in October.
(3) Operating Cash Flow is defined as net cash provided by operations less net cash used for investments,
excluding cash used for acquisitions of bottlers and investments in affiliates.
$ in millions, except per share data 1999 1998 Change
Table of Contents
Letter to Shareholders 1Our Mission 3Our Brands 4Our System 6Our Partnerships 12Our Growth Story 16Glossary 24Our Financial Review 25Senior Management Team 55Shareholder Information 56Board of Directors Inside Back Cover

At The Pepsi Bottling Group we have absolute clarityaround what we do…We Sell Soda! That statement is thecenterpiece of our company’s mission and of our first annualreport. Everything we do each day is linked to selling moreand more beverages. We have a laser-sharp focus on increas-ing our sales through serving our customers better thananyone. And in our first year of operation, we proved that.
There is no question that this past year was unlike anyother for all the employees of The Pepsi Bottling Group(PBG). We separated from PepsiCo in November of 1998and celebrated our official independence on March 31,1999, when we engineered one of the largest initial publicofferings in Wall Street history. Since that day, our focushas never wavered from delivering the results we said wewould deliver.
Although a record number of companies went public in1999, I think PBG was distinctive in many ways. We beganwith an established legacy of success and accomplishment.• The value of our brands. The Pepsi-Cola trademark ispriceless. The worth of that name could never really becalculated. It has been a major force in the marketplaceduring its more than 100 years of history. Our other brandsare also household names and outstanding trademarks intheir own right. • A proven business proposition built on solid cus-
tomer partnerships. We are the single largest bottler anddistributor of Pepsi brands in the world. On day one of ourexistence, we had an established base of more than 800,000customers and a revenue stream of almost $8 billion. • A powerful operating structure. Our seasoned team ofemployees and management, veterans of the cola wars, under-stand what it takes to win in their local markets. We are one ofonly a handful of packaged goods companies that controls anentire selling and delivery system – from manufacturing todistribution to selling, merchandising and service. We moveour products where our customers need them and when theyneed them for immediate sale to consumers.• Unlimited growth opportunities. The U.S. beverageindustry totals more than $70 billion, and has posted consis-tent volume growth over the past several years. There iscontinuing opportunity to serve the consumers in this mar-ket, whose “on-the-go” lifestyles create demand for easyaccess to beverages in a variety of locations. Internationalmarkets offer huge untapped potential, with per capita con-sumption levels well below the U.S. average. PBG is focusedon gaining more and more of the growth in every market weserve, and we are well equipped to do so.
We started the year riding the crest of a lot of expecta-tions. Our own and those you had for us. Expectations are
exciting. They give a sense of adventure. A sense of testingyour mettle. A desire not to disappoint. When I look backat PBG’s first year, I am more than pleased. We met orexceeded every operational goal we had set for ourselves,and in most cases, well ahead of the planned time frame.We did what we said we would do…and then some.
A Year of Outstanding Results
A key measure of success in the beverage industry isEBITDA or Earnings Before Interest, Taxes, Depreciationand Amortization. Our plan was to grow by 8–10 percent,and we beat that estimate handily, delivering 13 percentconstant territory growth year over year. If you added theresults of our acquisitions to the mix, our EBITDA was upby 25 percent.
Other annual highlights were:• Net Revenues – up almost 7 percent• Earnings Per Share – up 318 percent year over year• Operating Cash Flow – $161 million generated in 1999 • Return on Invested Capital – up a full percentage point
to 6 percent. By any and all significant business measures, we had an
outstanding year. But beyond all the financial returns weposted, I take great personal pride in a number of thingswe accomplished this year that can’t be measured solely infinancial terms.
1
Dear Fellow Shareholder,
Craig E. WeatherupChairman and Chief Executive Officer

We transformed PBG from a part of PepsiCo to an
independent public company without missing a beat.
We did not suffer through the “start-up curve” that mostnew businesses go through. We began our public life as asystem that had already stood the test of time, and nothingassociated with the separation of PepsiCo and PBG inter-rupted the work we had to get done. The move to create aseparate bottling company was a huge undertaking. Itrequired the intense focus of our senior management teamfor several months as we took our show on the road to theinvestment community, and as we dealt with the manyissues requiring resolution in the separation. All of this wasaccomplished without ever losing sight of our customers’needs and our business objectives, and that is reflected inour strong 1999 business results.
We established a powerful operating culture.
We galvanized the organization around our new mission,which is simple, clear and understandable by everyone atPBG… and we did that in record time. Only one weekafter our company “went public,” we pulled our top 400leaders together. We shared with them our sense of excite-ment about our expectations for PBG and we took time tolisten to how they felt about being owners. We talked aboutthe importance of driving local market success, always act-ing with a sense of urgency, and the mind-set of keepingscore and winning. We also talked about the respect wehave for our customers, our consumers and for each otherthat shines through in the service and support we provideand the teamwork required for success in our business.Our management team cascaded all they heard to everyemployee across our system on “Founder’s Day,” an eventheld on April 14 from Miami to Montréal, from Madrid toMoscow – just two weeks after our launch. All 37,000 of usat PBG were on the same page right from the start.
We led the Pepsi system in results.
1. Foodstore PerformanceDriving performance in foodstores is imperative for ourbusiness success. These sales make up about half of ourtotal business. Up until 1999, there had not been anyappreciable price increases in foodstores for more than adecade. This was impacting our bottom line, and it wasimpacting our customers’ bottom line. It was clear to all ofus at PBG that we had to move quickly to improve food-store profitability. In 1999, we took pricing up in most of
our markets, achieving one of our main goals of improvingour margin in foodstores. At the same time, we improvedour share versus our major competitor and we also outper-formed the rest of the Pepsi system.
2. Cold Drink GrowthSelling cold drinks for immediate consumer consumptionrepresents one third of our business, but it drives highermargins than any other segment. We had a lot of work todo in this area to compete, and we made great strides in1999. We focused much of our time, energy and resourcesto ramp up our placements of our cold drink equipment.Our goal is to substantially increase the number of loca-tions where Pepsi vending machines, coolers and coldbarrels are positioned, so consumers who are craving a coldPepsi product will always find one. Our placements wereup 34 percent over the prior year. Not only that, our capi-tal expenditures were significantly less than originallyplanned, as a result of improved and more efficient pur-chasing. These increases in cold drink placements andvolume growth represented a big win for us and were a keyreason for our overall success this past year.
3. International ProgressIn 1999, we made dramatic progress in our internationalbusinesses in Spain, Greece and Russia. Although thesecountries outside North America represent only 9 percentof our volume, they are robust businesses that had a bigimpact on our bottom line last year. These operations fig-ure very prominently in our continuing growth strategy.More than 70 percent of the volume we sell outside ofNorth America is sold in Spain, where there was vibrantvolume and profit growth in 1999, and a more than 30percent increase in EBITDA. In Russia, where a difficultpolitical and economic situation has had an impact on ourbusiness, we still exceeded our volume plan, reduced ourcosts significantly and dramatically improved our financialposition. We have also realigned our organization inGreece, and we are positioned well for growth in 2000with the right selling and cost structure for the market.
We assembled a superb team of senior managers.
The last part of our story is about the team that is leadingthis company into the 21st century. These seasoned, savvyand dedicated individuals, who have an average of 16 yearsof experience in our business, were handpicked for theirassignments. They know the ins and outs of selling soda.They know the importance of driving local market success.The most senior members of the team have the most skinin the game with personal stock ownership requirementsthat tie their continuing financial success very closely tothe financial success of PBG.
Our Board of Directors – all talented leaders who bringvaried experience and perspective to our business – are also
2
Revenues (in millions)
1998
1999
$7,041
$7,505

uniquely engaged in moving this business forward. You canread more about them and how involved they’ve been inour business on the inside back cover of this report.
I couldn’t be more pleased with what all these execu-tives, both inside and outside, bring to our company. Theyare all driving us into the future and they are all deeplycommitted to the continuing success of PBG.
2000 and Beyond – Our Goals and Direction
We have laid a great foundation for the future growth ofyour company in this, our first year of operation. We beganthe year 2000 fully engaged, and hit our stride early with aclear sense of what we needed to do and confidence in ourability to do it. At PBG, we know that the key to success isdriving our results customer by customer, store by storeand market by market. It’s what we will continue to focuson this year through: • executing the great business strategies we have in place• building our capability• aiming for flawless execution and • consistently improving our volumes, our margins and
our returns.I’m extremely confident that the positive story about
The Pepsi Bottling Group is just beginning. We’re clearlypositioned for an excellent year in 2000, both operationallyand financially. We have tremendous opportunity in frontof us. And we are going after that opportunity with everyavailable resource – great brands, a powerful operating sys-tem and the collective experience of our talented anddedicated workforce.
I began this letter talking about our mission statement,and I’d like to end with it as well. I think it captures theheart and soul of our business. In addition to the core state-ment of “We Sell Soda,” in designing our mission, wedefined our “Rules of the Road,” or the way we need to getthe job done. Across the PBG system, there are so many peo-ple who make those rules come to life every single day. Theirstrong commitment to our business success led to our out-standing results in 1999. And I have every confidence theircommitment will lead us to even greater achievements in theyear 2000. I invite you to turn the pages of our report andmeet some of them. They, and thousands of their colleagueslike them across our company, take this business very person-ally. They are dedicated to our success – and to yours. Inhundreds of thousands of transactions every day, they exceedthe expectations of our customers and our consumers, andfor the first time this year, they are trying to do the same foryou, our shareholders. They are the biggest reason I feelthere is absolutely no doubt about the value of your invest-ment in The Pepsi Bottling Group.
Craig E. WeatherupChairman and Chief Executive Officer 3
Our Mission
We have absolute clarity around what we do:
We Sell Soda.
We commit ourselves to these operating principles:
Rules of the Road
1. Drive Local Market Success.
2. Act Now. Do It Today. Get Results.
3. Set Targets. Keep Score. Win.
4. Respect Each Other.
Our success will ensure:
Customers Build Their Business
Employees Build Their Futures
Shareholders Build Their Wealth
Four frontline
employees joined
PBG executives to
ring the opening
bell on the New York
Stock Exchange on
March 31, 1999 – the
day The Pepsi
Bottling Group was
listed for public
ownership.

4
We Sell Soda...
some of the most-recognized brands in the world.
With top-selling brands in all non-alcoholic beverage categories – carbonated soft
drinks, bottled water, ready-to-drink tea and coffee, juice and isotonics – our diverse
product portfolio provides a “beverage solution” for every meal or thirst occasion.
Pepsi, Diet Pepsi, Pepsi ONE, Mountain Dew, Aquafina, Lipton Brisk and Slice are
“regulars” in this family’s kitchen.

5
As the largest manufacturer and distributor of Pepsi-Cola bever-
ages, The Pepsi Bottling Group brings some of the world’s most-
recognized and enjoyed brands to millions of consumers every
day. In homes, schools and businesses, on playgrounds and soccer
fields and at world-class sporting events in five countries, PBG is
providing a full lineup of beverage brands to meet virtually every
need, taste and lifestyle.
Our sales account for more than 55 percent of the Pepsi-Cola
beverages sold in North America, and 32 percent worldwide.
PBG has exclusive, perpetual rights to manufacture, sell and
distribute these beverages in all or a portion of 41 states, the
District of Columbia, eight Canadian provinces, Spain, Greece
and Russia.
While PBG is a new company, the flagship brand we sell,
Pepsi-Cola, is more than 100 years old, and carries the equity of
its rich history. The value of that brand is priceless. The other
brands we sell are also household words and outstanding trade-
marks in their own right. Among the many products in our
portfolio are Mountain Dew, Aquafina, Lipton Brisk and Lipton’s
Iced Tea, Starbucks Frappuccino and, outside the United States,
7Up and KAS.
Everything we do as a Pepsi bottler and distributor – every step
along the “make, sell and deliver” path – culminates at a family
meal, a social gathering or in a private moment, when a thirst
is quenched and a smile is born. What a great proposition – to
know that as this powerful organization works to grow our
business, we create pleasure and satisfaction.
North AmericanBrand Mixpercent by volume 1999
■ Pepsi 41%
■ Dr Pepper 6%
■ Lipton 4%
■ Aquafina 2%
■ Pepsi ONE 2%
■ Mountain Dew 14%
■ Diet Pepsi 15%
■ Other 16%

6
We Sell Soda...
through a powerhouse systemthat runs like clockwork.
Number of Plants 56 11 67
Number of Distribution Centers 283 37 320
Percentage of the Pepsi System 55% 94% 32%*
Percentage of PBG Volume 91% 9% 100%
North America Spain Total PBG
Greece
Russia
* Percentage of Pepsi system worldwide
The Pepsi Bottling Group, Inc. is the world’s largest manufacturer, seller and
distributor of carbonated and non-carbonated Pepsi-Cola beverages. We have
an extensive distribution system through which we deliver our products directly
to stores without using wholesalers as middlemen.

7
The Pepsi Bottling Group made, sold and delivered more than one billion physical cases of beverages to more than 800,000
customers in 1999, and we plan to build on those numbers every year. That’s a huge undertaking, and to do it profitably,
we need our system to operate like a well-oiled machine. Everything we do along the supply chain – in our plants and in our
warehouses, with the equipment we place and along our selling routes – has an impact on our bottom line.
Plant efficiencies, manufacturing and warehousing logistics, selling and delivery strategies, and optimal management of
our marketing equipment are top operational priorities for PBG – and we’ve performed well against each in 1999.
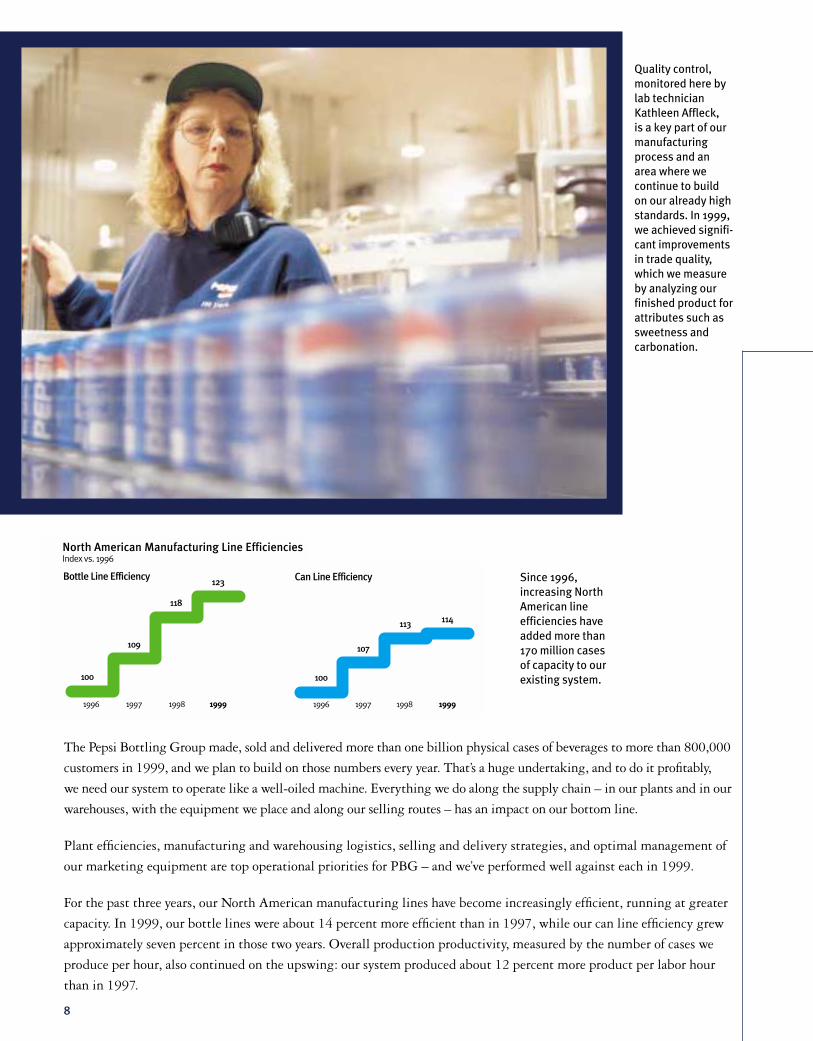
For the past three years, our North American manufacturing lines have become increasingly efficient, running at greater
capacity. In 1999, our bottle lines were about 14 percent more efficient than in 1997, while our can line efficiency grew
approximately seven percent in those two years. Overall production productivity, measured by the number of cases we
produce per hour, also continued on the upswing: our system produced about 12 percent more product per labor hour
than in 1997.
8
Quality control,
monitored here by
lab technician
Kathleen Affleck,
is a key part of our
manufacturing
process and an
area where we
continue to build
on our already high
standards. In 1999,
we achieved signifi-
cant improvements
in trade quality,
which we measure
by analyzing our
finished product for
attributes such as
sweetness and
carbonation.
Since 1996,
increasing North
American line
efficiencies have
added more than
170 million cases
of capacity to our
existing system.
1998 19971996 1999
Bottle Line Efficiency
109
100
118
123
North American Manufacturing Line EfficienciesIndex vs. 1996
1998 19971996 1999
Can Line Efficiency
107
100
113114
9
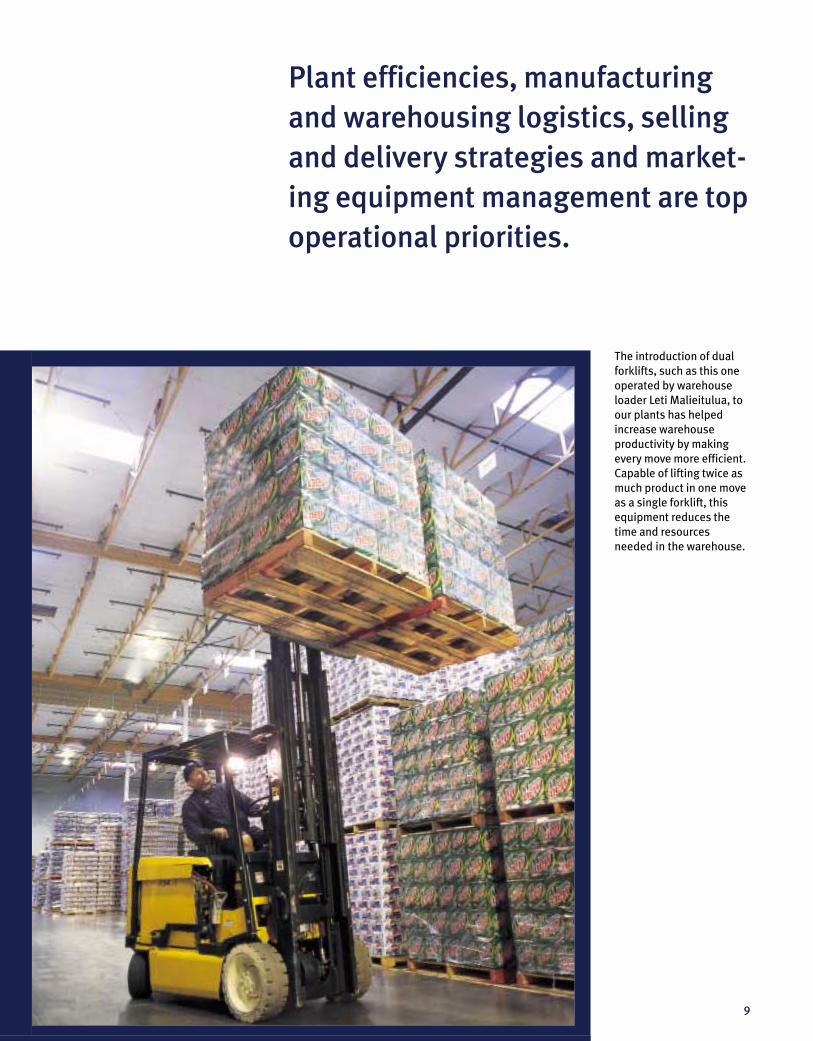
Plant efficiencies, manufacturing
and warehousing logistics, selling
and delivery strategies and market-
ing equipment management are top
operational priorities.
The introduction of dual
forklifts, such as this one
operated by warehouse
loader Leti Malieitulua, to
our plants has helped
increase warehouse
productivity by making
every move more efficient.
Capable of lifting twice as
much product in one move
as a single forklift, this
equipment reduces the
time and resources
needed in the warehouse.

Everything we do along the supply
chain – in our plants and warehouses,
with the equipment we place, and
along our selling routes – has an
impact on our bottom line.
PBG now has more than
one million pieces of cold
drink equipment in the
North American market-
place. In 1999, our
Marketing Equipment
Management technicians
received significantly
higher customer service
ratings than in the prior
year. Here, driver Paul
Kusheba restocks a full-
service vendor.
10

In North America alone, our Marketing Equipment organization, responsible for placing and per-
forming service on our cold drink equipment, made net placements of 142,000 vendors, coolers and
pieces of fountain equipment in 1999. In addition, we reduced by about 50 percent the time between
a customer’s cold drink equipment order and its installation – getting our cold products where they
need to be, in the hands of thirsty consumers, faster.
Across our supply chain, we are continuing to look for opportunities to reduce costs. In our U.S.
plants, total warehousing costs per unit declined by two percent in 1999. Our direct store delivery
labor costs were flat on a per unit basis year over year and we reduced waste by five percent. By reduc-
ing our cost per case through productivity enhancements and operational efficiencies like these, we con-
tinue to bring better value to our customers and to our shareholders.
11
When you consider the team that operates the can line in
PBG’s Hayward, California plant, it is no wonder that their
manufacturing line has been one of the smoothest-
running in our system since the day the facility opened in
the mid-1990s. The combined production experience of
this outstanding team is nearly 100 years. During the
seven years they have worked together, the can line has
consistently operated at more than 90 percent efficiency.
That exemplary efficiency rating is achieved through this
team’s technical savvy, meticulous equipment mainte-
nance, close attention to raw materials inventory and a
constant focus on efficiency targets and results. Members
of this motivated group hold frequent team meetings to
troubleshoot any potential problems, and often show up
before scheduled work begins to ensure a seamless tran-
sition between shifts.
The Hayward Can Line Team(Left to Right) Gabriel Ramos, José Cardona,
Candis Durkee, Francisco Angel, Frank Crespo,
Randy Washington
Hayward, California
But the tremendous amount of pride they take in keep-
ing their line running smoothly and their personal
ownership of the end results are probably the biggest
keys to their success. Says production manager Darryl
Moses, “I can ask any one of them what our efficiency
rate is at any moment in time – and they will know.” This
group really understands what it means to “Set Targets.
Keep Score. Win.”
12
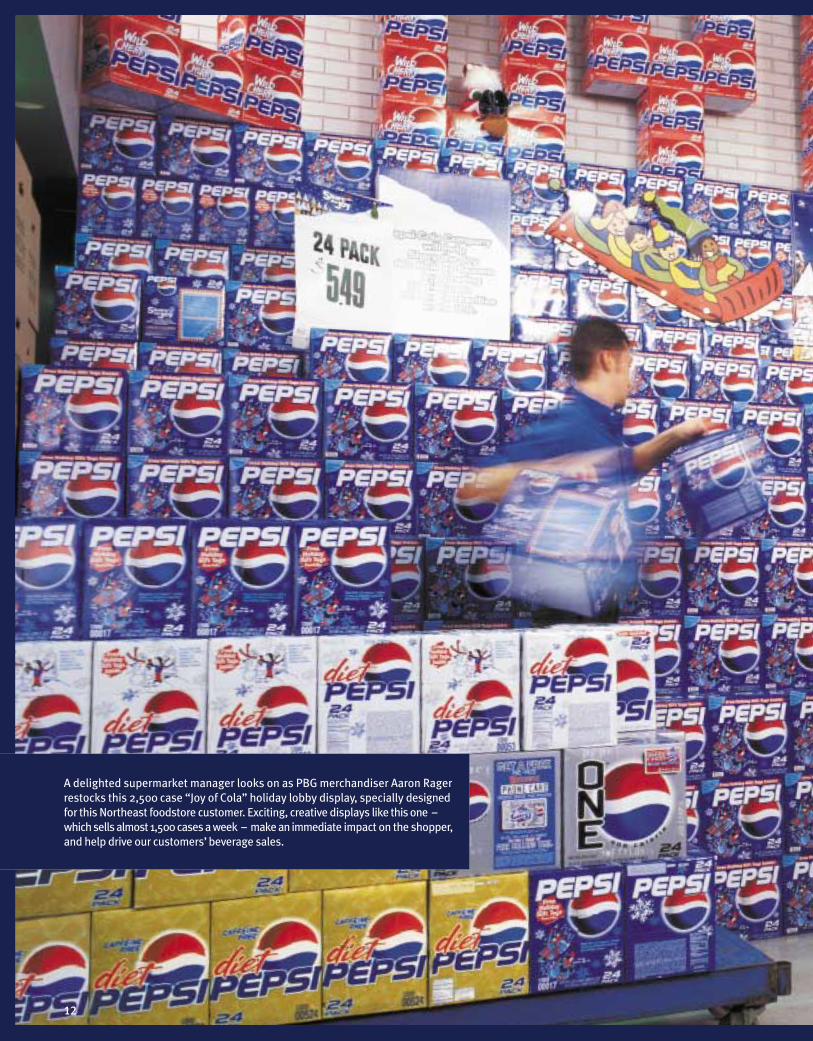
A delighted supermarket manager looks on as PBG merchandiser Aaron Rager
restocks this 2,500 case “Joy of Cola” holiday lobby display, specially designed
for this Northeast foodstore customer. Exciting, creative displays like this one –
which sells almost 1,500 cases a week – make an immediate impact on the shopper,
and help drive our customers’ beverage sales.
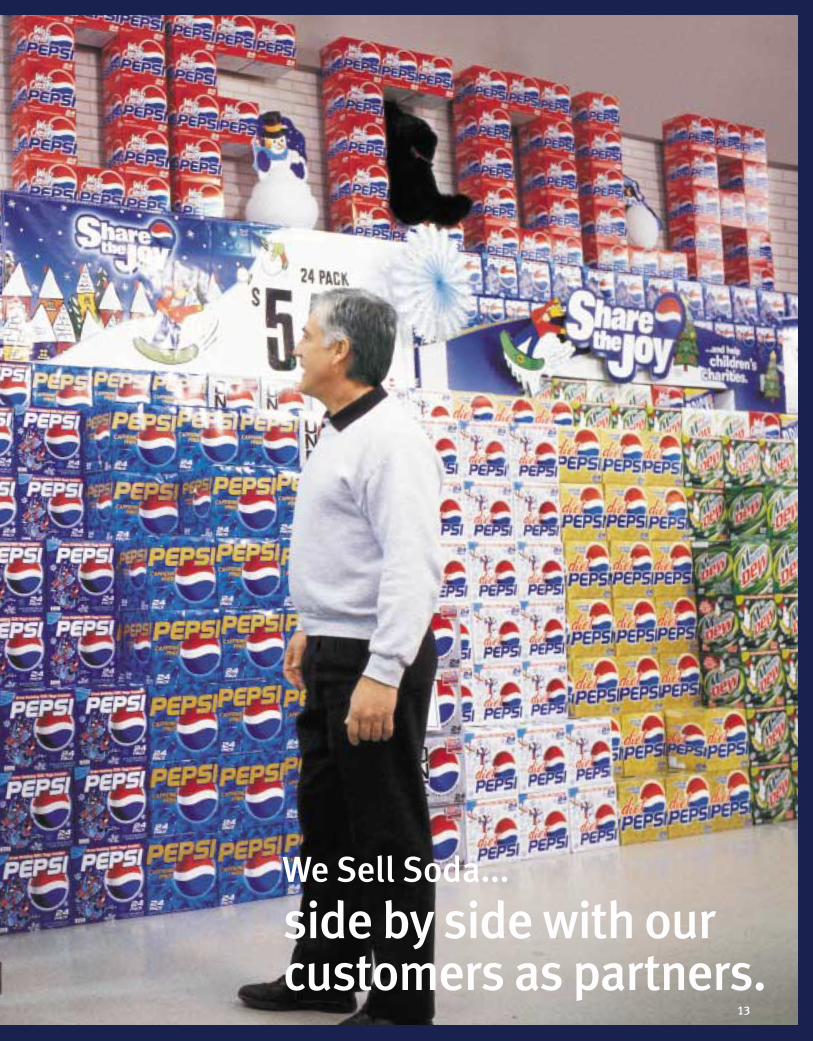
13
We Sell Soda...
side by side with our customers as partners.
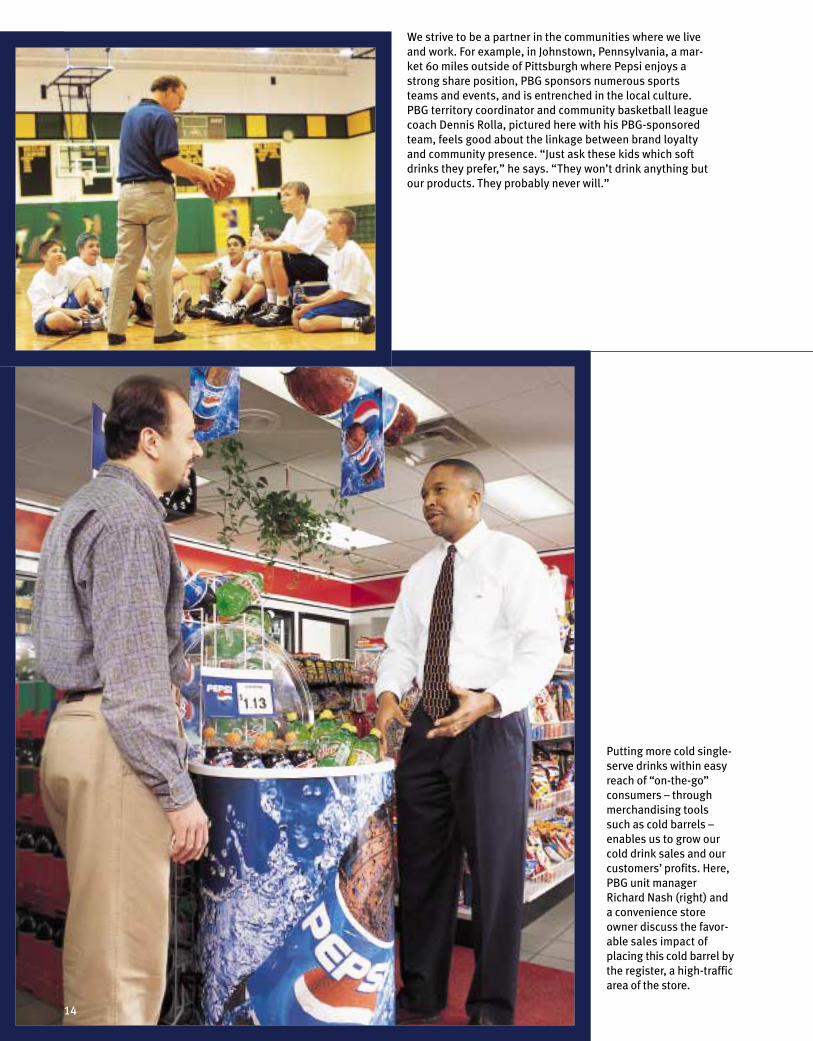
We strive to be a partner in the communities where we live
and work. For example, in Johnstown, Pennsylvania, a mar-
ket 60 miles outside of Pittsburgh where Pepsi enjoys a
strong share position, PBG sponsors numerous sports
teams and events, and is entrenched in the local culture.
PBG territory coordinator and community basketball league
coach Dennis Rolla, pictured here with his PBG-sponsored
team, feels good about the linkage between brand loyalty
and community presence. “Just ask these kids which soft
drinks they prefer,” he says. “They won’t drink anything but
our products. They probably never will.”
Putting more cold single-
serve drinks within easy
reach of “on-the-go”
consumers – through
merchandising tools
such as cold barrels –
enables us to grow our
cold drink sales and our
customers’ profits. Here,
PBG unit manager
Richard Nash (right) and
a convenience store
owner discuss the favor-
able sales impact of
placing this cold barrel by
the register, a high-traffic
area of the store.
14

PBG’s business grows most successfully when our customers’ beverage business grows. Our goal is to increase profits forboth our accounts and for PBG. To do that, we work with our customers to determine the right strategies to achievemaximum beverage sales in their stores.
Of course, there is no single formula that works for every store in every town. Our sales teams tailor merchandising andmarketing programs, store by store, to meet the individual needs of our customers, and work to not just meet, butexceed, customer expectations.
Our business is all about generating more sales by creating excitement and energy around the brands we sell. For super-markets and mass merchandisers, that means executing large, captivating lobby and end-aisle displays using world-classmerchandising – such as the Pepsi Star Wars and Share the Joy programs of 1999 – to draw the shopper’s attention. It meansfinding opportunities throughout the store to capture the shopper with strategically placed displays. In smaller outlets,such as Convenience and Gas (C&G) stores, we find creative ways to increase the high-profit, cold drink inventory intight spaces. For every account, we aim to put Pepsi products within easy – and likely – reach of every consumer.
Time and again, we gain the trust of our customers by translating our knowledge of consumer shopping patterns into cate-gory management strategies that result in significant sales growth. In fact, in supermarkets across the United States, thebrands we sell have been among the top five contributors to our retail customers’ sales growth over the last five years. Resultslike these are the real benefit of the partnership approach.
15
A 35-year Pepsi veteran, Clyde Sanchez (right) has had a
powerful impact on Pepsi’s position in the San Fernando
marketplace and on the new PBG employees he mentors,
such as pre-sell representative Tracy Cameron (left).
Clyde’s outstanding selling skills – coupled with his willing-
ness to go out of his way to help customers and
colleagues – have earned him the respect and trust of his
customers, and have yielded exceptional growth for our
brands in his small format accounts.
Over just the past two years, Clyde enlisted 83 percent of
his accounts in his Market Unit’s “Globe Membership
Program.” Membership meant that those customers gave
Pepsi brands increased cold vault space and better posi-
tioning, placed additional cold drink equipment in the
transaction area, expanded our alternative beverage space,
gave our take-home product more and better display space
and fully merchandised the store to PBG standards.
Clyde’s work did not stop at achieving dominant in-store
presence. He aggressively pursued better outdoor pres-
ence, as well. Employing his own “one a day” strategy,
Clyde committed to an aggressive plan to make at least
Clyde SanchezCustomer Representative, Small Format
San Fernando, California
one improvement in Pepsi brand presence each day –
including securing more product space and posting
more outdoor signage.
These in-store and outdoor moves resulted in Clyde grow-
ing his total business in 1998 by 32 percent over prior year,
and another 21 percent in 1999. His achievements have
made him a valued business partner for his customers and
a mentor for PBG employees. He truly illustrates the
“Respect Each Other” plank of the PBG mission.
We work with our customers to determine
the right strategies to achieve maximum
beverage sales in their stores.

16
We Sell Soda...
and we plan to sell a lot more.

17
The Old Port of Montréal, Québec, is a prestigious, exclusive PBG
account for both vending and fountain service. More than six million
people visit the Old Port each year, consuming Pepsi products as they
visit this major attraction. The City of Montréal is a stronghold for PBG
– our brands enjoy a leading market share and are linked to many other
high-profile attractions such as the Olympic Stadium.

Growth of our cold drink business – chilled, single-serve beverages for immediate consumption –
depends upon our reaching more of the increasing number of “on-the-go” consumers who desire a
quick, convenient purchase. In 1999, cold drink was about one third of our volume and the most
profitable portion of our sales. Gross margins on cold product, which is predominantly sold at
C&G outlets and Independent Business Stores, are several times that of product sold in other chan-
nels, such as supermarkets and mass merchandisers. Growth in this segment translates into substan-
tial returns for PBG and our shareholders.
Our cold drink placement goals for 1999 were aggressive and ambitious – and we achieved them.
We invested about $300 million, more than half of our capital spending, in this segment of our
business, making net placements of 142,000 pieces of cold drink equipment in the North American
market – a 34-percent increase in net placements over 1998 and double those placed in 1997.
The payoff is clear: the coolers, vendors and checklane merchandisers we placed in 1999 resulted in
double-digit cold drink volume growth across the grocery store, mass merchandiser, wholesale club
and drug store channels.
18
Caroline Leduc’s customers know they are in good
hands. This key account manager, a 10-year veteran
of the Pepsi system, reacts to her customers’ needs
with the urgency of a family emergency. To keep their
businesses on track, she coordinates unscheduled
deliveries, emergency equipment conversions and a
host of other solutions to unanticipated challenges.
It’s that kind of action and personal attention that
accounts for her outstanding results. In 1999 she
exceeded her on-premise cold drink equipment place-
ment target by nearly 230 percent. She increased her
20-ounce “bottles to go” volume in her fountain accounts
by more than 90 percent versus 1998, mainly by growing
the local accounts that comprise the majority of her total
sales volume. By ensuring that her customers received
the highest-quality service, Caroline maintained the low-
est ratio of cold drink equipment pick-ups within her
unit’s restaurant and recreation segments. She also won
several major accounts, including the Old Port of Montréal
and the Alouettes of the Canadian Football League.
Caroline LeducKey Account Manager, On-Premise
Montréal, Canada
Caroline truly embodies the plank of our mission state-
ment, “Act Now. Do It Today. Get Results.” By working
closely with sales agents, technicians and service
people, Caroline acts quickly and gets strong results.
“For me,” she says, “Pepsi is like a sports team – you
never achieve anything alone. You have to build a great
team to win, and I like to win.”
1998 1997 1999
69
106
142
North AmericanNet Cold DrinkEquipmentPlacementsIn thousands
19
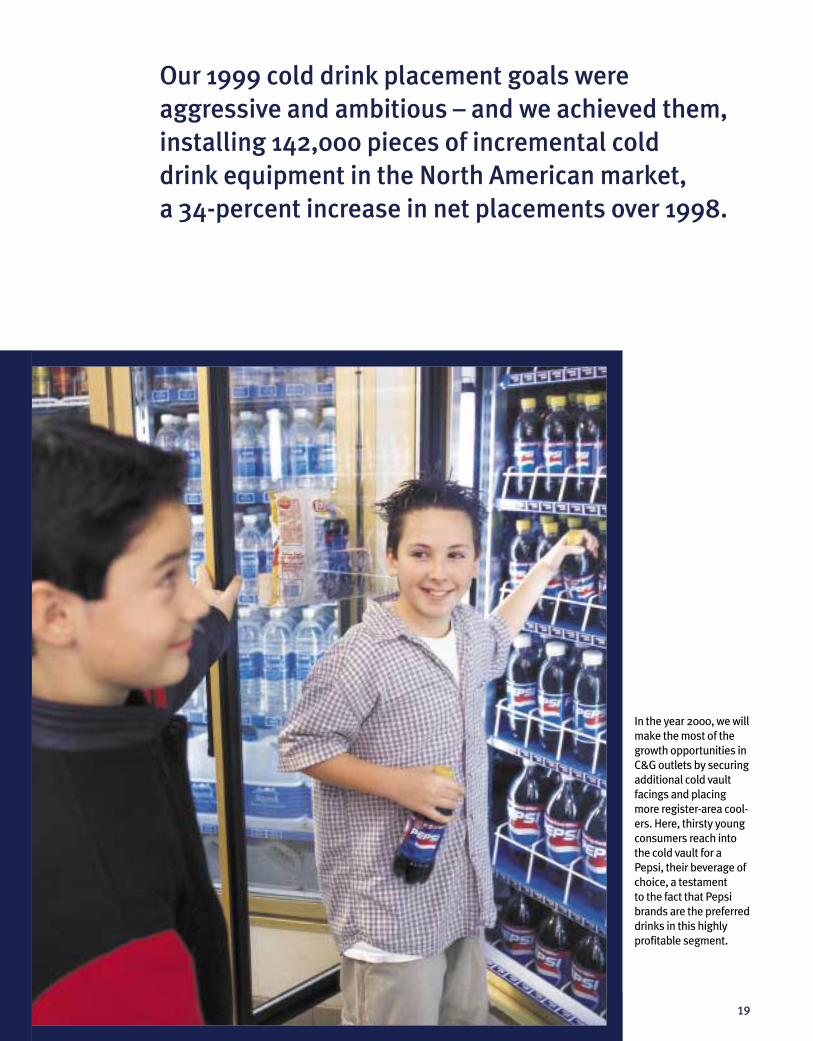
In the year 2000, we will
make the most of the
growth opportunities in
C&G outlets by securing
additional cold vault
facings and placing
more register-area cool-
ers. Here, thirsty young
consumers reach into
the cold vault for a
Pepsi, their beverage of
choice, a testament
to the fact that Pepsi
brands are the preferred
drinks in this highly
profitable segment.
Our 1999 cold drink placement goals were
aggressive and ambitious – and we achieved them,
installing 142,000 pieces of incremental cold
drink equipment in the North American market,
a 34-percent increase in net placements over 1998.

With more than one million pieces of cold drink equipment now in the North American market, we still see a great amount
of growth potential ahead of us. In the year 2000, we plan to increase net placements by more than 10 percent, with a sharp
focus on workplace locations and schools. In the U.S., nearly 40 percent of work locations and more than 25 percent of edu-
cational institutions lack any on-premise beverages, offering PBG a huge, untapped cold drink market.
Another arm of our cold drink strategy is to grow our total cold inventory inside every PBG account. We certainly have
the strong performance record, along with a better total beverage category lineup than any other beverage supplier, to
justify more space for our products. We compete in all non-alcoholic beverage categories, and, in the C&G channel, the
brands we carry are the preferred brands of consumers. In the U.S., we sell five of the 10 top-selling beverage products
in the channel, including Mountain Dew and Pepsi, the number one and two top-selling 20-ounce beverages. We supply
the leading bottled water brand, Aquafina, and both the leading ready-to-drink tea and coffee brands, Lipton and
Starbucks Frappuccino.
By allocating more cold vault space to the products with the greatest consumer demand, our customers grow their
beverage sales. About one third of U.S. C&G profits come from the cold vault and C&G consumers are among the most
brand loyal – nearly 30 percent will leave the store if their preferred product is out of stock. That’s why finding space for
more cold Pepsi products satisfies our “on-the-go” consumers and builds our customers’ profits.
20
For these high school students,
Pepsi products are a refreshing
part of the daily routine. With
more than 25 percent of educa-
tional institutions in the U.S.
lacking on-premise beverages,
making our products available
on more campuses through
vending and fountain service
is a key strategy for cold
drink growth.
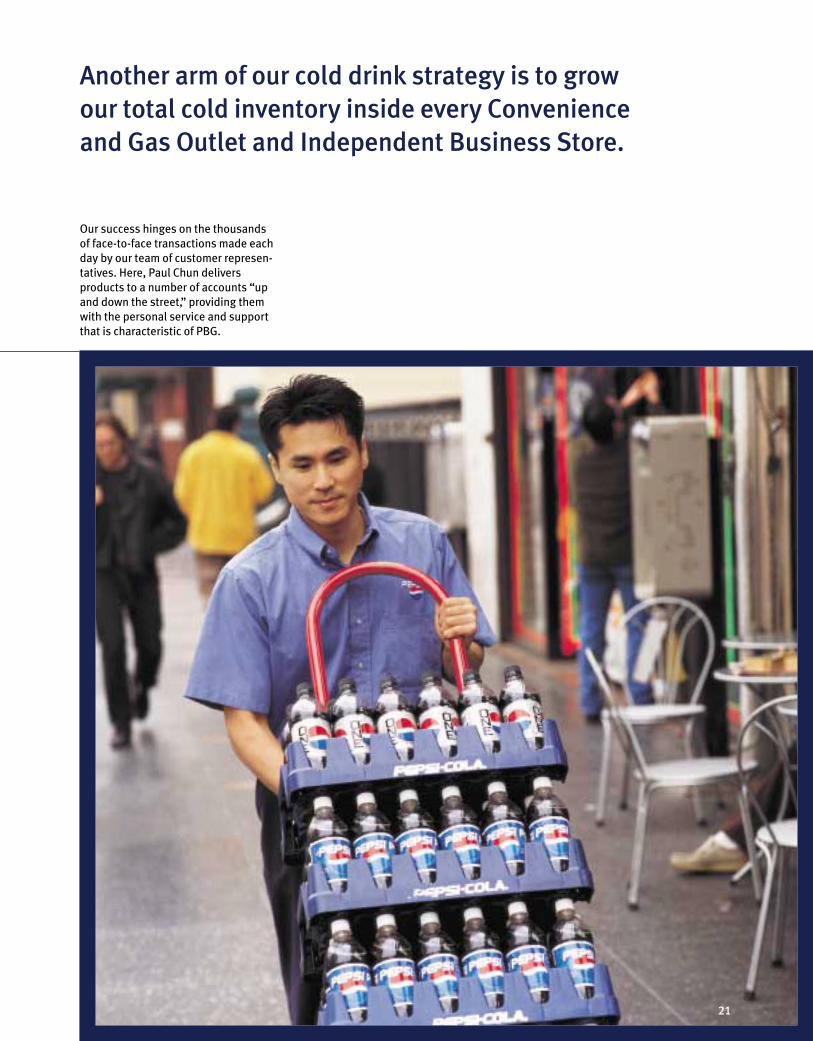
Another arm of our cold drink strategy is to grow
our total cold inventory inside every Convenience
and Gas Outlet and Independent Business Store.
Our success hinges on the thousands
of face-to-face transactions made each
day by our team of customer represen-
tatives. Here, Paul Chun delivers
products to a number of accounts “up
and down the street,” providing them
with the personal service and support
that is characteristic of PBG.
21

About two thirds of PBG’s volume is take-home product (product sold for future consumption),
making this segment of our business a critical one. Most of our take-home volume is sold in food-
stores, where historically low pricing has resulted in narrow profit margins. In this segment, success
hinges on strong and profitable volume growth. In 2000, we will continue working with our
customers to improve the profitability of their beverage sales.
One way to make gains in the take-home sector is by translating our understanding of evolving con-
sumer shopping patterns into a strategic merchandising plan designed to grow sales. Part of that
plan unfolds on the traditional “battlegrounds” of the grocery store: the beverage aisle, the lobby
and the end-aisle displays. We will continue to focus on gaining more shelf space for our entire brand
lineup, securing more and better end-aisle positioning and getting lobby displays more frequently.
22
In many international
markets, our take-
home business is
driven by the same
factors as in North
America, including
large displays and
increased visual
inventory. In Spain,
the growing number
of hypermarkets –
super-sized, ultra-
modern markets
such as this one in
Cordoba – offer
opportunities
for innovative mer-
chandising and high-
volume sales. Sold
side by side with
Spain’s popular
regional brands,
Pepsi is still a top
pick for this mother
and son.

23
Studies of consumer shopping behavior show that more than 70 percent of shoppers don’t shop the bever-
age aisle, and they are moving away from time-consuming shopping trips to quicker, more frequent vis-
its to the grocery store. As in the C&G channel, our marketing approach in the supermarket is designed
to reach the “on-the-go” consumer. In 1999, we laid the groundwork for our occasion-based marketing
(OBM) platform – the tactics for placing our beverages in the most frequently shopped areas of the
supermarket. These placements are in addition to our lobby and end-aisle displays.
In 2000, we will continue driving for a greater number of displays and rack placements on the perimeter
of the store, and more total inventory in every account. And, we will accelerate our OBM progress
with intensified efforts to pair our beverages with other “complementary” products throughout the
store, making it easier and quicker for hurried consumers to find and purchase our brands.
At PBG, our focus going forward is to continue what we started in our first year – making, selling and
delivering more soda, more profitably than ever before.
As a large format PBG pre-sell representative, Chuck’s job
is to sell his customers the product, displays and mer-
chandising tools that will reap the most beverage sales in
their stores. His approach is to keep his customers
focused on growth by carefully tracking their sales vol-
ume versus prior year, sharing those numbers and
working with the customer to build on the results.
In 1999, Chuck was able to grow case volume across his
accounts while increasing net pricing by 35 cents per case.
He grew volume and revenue by securing more frequent
feature advertisements, and by tailoring promotions to
each store. For example, one store manager wanted an
aggressive promotion to match the results generated by a
1998 beverage program linked to the video release of the
movie, Titanic. Chuck set up a successful can advertise-
ment and displays in the customer’s two stores. Those
stores sold 40,000 cases in one week, matching the Titanic
results of the previous year.
Chuck KrevelPre-Sell Representative, Large Format
Johnstown, Pennsylvania
By focusing on his customers’ specific needs and goals,
Chuck consistently drives local market success. He
knows his local market, and the individual businesses he
serves. “My customers trust me – they know that what I
do in their stores will help grow sales,” says Chuck.
“They see the numbers. Results don’t lie.”
In the take-home segment, which is
predominantly composed of supermarkets
and foodstores, success hinges on
strong and profitable volume growth.

24
Glossary
limited grocery selection, which are
generally sold at discounted prices.
On-PremiseOutlets where consumers buy soft drinks
for immediate consumption at or near the
point-of-sale.
Physical CaseThe measurement bottlers use for the
number of units that were actually
produced, distributed and sold. Each case
of product, regardless of package configu-
ration, represents one physical case.
S&DSelling and Delivery. The cost of putting
products into the marketplace for purchase.
Does not include manufacturing costs.
Shelf FacingsMeasure of retail exposure of an item based
on the number of bottles or cans visible to
the consumer at the front of the shelf.
Small FormatConvenience stores, gas stations and inde-
pendent business store accounts.
Take-Home Products sold warm and generally pur-
chased for at-home or future consumption.
DSDDirect Store Delivery. Products go from
our plant or warehouse directly to a
customer account.
End-Aisle DisplayA display of soft drink products at the
end of an aisle in a foodstore.
EBITDAEarnings Before Interest, Taxes,
Depreciation, and Amortization. A key
financial measure in the bottling industry.
Feature AdA newspaper ad offering a discounted
price that encourages consumers to visit a
particular account.
FSVFull-Service Vending. PBG places and
stocks the vending machine, paying a
commission to the account on the
machine’s sales.
IBSIndependent Business Stores. Non-chain,
small independent foodstores. Also
called “Mom & Pop” or “Up and Down
the Street.”
Large FormatLarge chain foodstores, mass merchandis-
ers, chain drug stores, club stores and mil-
itary bases.
Line EfficiencyA measure of the number of bottles or
cans filled per hour or per day as com-
pared to the manufacturer’s rated operat-
ing capacity for the filling equipment.
Mass MerchandiserA moderate-sized general merchandiser
usually having a strong selection of
health and beauty care items and a
C&GConvenience stores and gas stations.
ChannelOutlets that are similar in size, and that
buy, merchandise and sell soft drinks in
similar ways.
Cold BarrelA barrel containing beverages on ice.
Cold Drink Cold products sold in retail and
on-premise channels.
Cold VaultRefrigerated units where an assortment of
beverages are available for consumer pur-
chase. Typically found in Convenience and
Gas stores.
CoolerCompany-owned one, two and three
glass-doored refrigerated units that dis-
play cold product.
Constant Territory ResultsFinancial results adjusted to exclude the
impact of acquisitions and unusual items.
CSDCarbonated Soft Drink.

25
Management’s Financial Review
25 Management’s Financial Review
29 Consolidated Statements of Operations
32 Consolidated Statements of Cash Flows
33 Consolidated Balance Sheets
37 Consolidated Statements of
Changes in Shareholders’ Equity
38 Notes to Consolidated Financial Statements
52 Management’s Responsibility for Financial Statements
53 Report of Independent Auditors
54 Selected Financial and Operating Data
Our Financial Review – 1999
TH E PE PS I BOTTLI NG G ROUP, I NC. 1999 Annual Repor t
OVERVIEW
The Pepsi Bottling Group, Inc. (collectively referred to as
“PBG,” “we,” “our” and “us”) became a public company
through an initial public offering of 100,000,000 shares on
March 31, 1999, marking our separation from PepsiCo, Inc.
and our beginning as a company focused solely on the
bottling business. As an independent bottling company, we
set objectives aimed at profitably growing our business
and building shareholder value. We are proud to report that
we have exceeded our goals for 1999:
♦ We delivered 13% constant territory EBITDA growth
in 1999, significantly higher than the 8–10% growth
target we had set for ourselves at the time of our initial
public offering.
♦ We generated $161 million of operating cash flow in
1999, exceeding our original projections by approxi-
mately $200 million.
♦ We delivered $0.71 in earnings per share, an increase of
$0.54 over 1998 after adjusting for one-time items and
the number of shares outstanding.
♦ We made 142,000 net placements of cold drink equip-
ment in North America, approximately 36,000 pieces
ahead of the prior year.
♦ We increased our return on invested capital by 1% in 1999.
♦ We made six acquisitions during the year for approxi-
mately $185 million in cash and assumed debt, increas-
ing our share of Pepsi-Cola’s North American market
approximately 1% to more than 55%.
The following discussion and analysis covers the key drivers
behind our success in 1999 and is broken down into five
major sections. The first two sections provide an overview
and focus on items that affect the comparability of historical
or future results. The next two sections provide an analysis
of our results of operations and liquidity and financial con-
dition. The last section contains a discussion of our market
risks and cautionary statements. The discussion and analy-
sis throughout management’s financial review should be
read in conjunction with the Consolidated Financial
Statements and the related accompanying notes.
TH E PE PS I BOTTLI NG G ROUP, I NC.
26
Management’s Financial Review
CON STANT TERRITORY
We believe that constant territory performance results are
the most appropriate indicators of operating trends and
performance, particularly in light of our stated intention of
acquiring additional bottling territories, and are consistent
with industry practice. Constant territory operating results
are achieved by adjusting current year results to exclude
current year acquisitions and adjusting prior year results to
include the results of prior year acquisitions as if they had
occurred on the first day of the prior fiscal year. Constant
territory results also exclude any unusual impairment and
other charges and credits.
USE OF EBITDA
EBITDA, which is computed as operating income plus
the sum of depreciation and amortization, is a key indicator
management and the industry use to evaluate operating
performance. It is not, however, required under generally
accepted accounting principles and should not be
considered an alternative to measurements required by
GAAP such as net income or cash flows. In addition, EBITDA
for 1999 and 1998 excludes the impact of the non-cash
portion of the unusual impairment and other charges and
credits discussed below and in Note 4 of the Consolidated
Financial Statements.
ITEMS THAT AFFECT HI STORIC AL OR
FUTURE COMPAR ABILIT Y
INIT IAL PUBLIC OFFERING
PBG was incorporated in Delaware in January 1999 and,
prior to our formation, we were an operating unit
of PepsiCo. Our initial public offering consisted of
100,000,000 shares of common stock sold to the public,
equivalent to 65% of our outstanding common stock, leav-
ing PepsiCo the owner of the remaining 35% of outstanding
common stock. PepsiCo’s ownership has increased to
36.7% as a result of net repurchases of 5.3 million shares
under our share repurchase program. In addition, in con-
junction with our initial public offering, PBG and PepsiCo
contributed bottling businesses and assets used in the bot-
tling businesses to Bottling Group, LLC, our principal operat-
ing subsidiary. As a result of the contribution of these assets,
PBG owns 92.9% of Bottling Group, LLC and PepsiCo owns
the remaining 7.1%, giving PepsiCo economic ownership of
41.2% of our combined operations. We fully consolidate the
results of Bottling Group, LLC and present PepsiCo’s share as
minority interest in our Consolidated Financial Statements.
For the periods prior to our initial public offering we pre-
pared our Consolidated Financial Statements as a “carve-out”
from the financial statements of PepsiCo using the historical
results of operations and assets and liabilities of our busi-
ness. Certain costs reflected in the Consolidated Financial
Statements may not necessarily be indicative of the costs
that we would have incurred had we operated as an inde-
pendent, stand-alone entity for all periods presented. These
costs include an allocation of PepsiCo corporate overhead
and interest expense, and income taxes:
♦ We included corporate overhead related to PepsiCo’s
corporate administrative functions based on a specific
identification of PepsiCo’s administrative costs relating
to the bottling operations and, to the extent that such
identification was not practicable, based upon the per-
centage of our revenues to PepsiCo’s consolidated net
revenues. These costs are included in selling, delivery
and administrative expenses in our Consolidated
Statements of Operations.
♦ We allocated $3.3 billion of PepsiCo debt to our business
and charged interest expense on this debt using
PepsiCo’s weighted-average interest rate. Once we
issued $3.3 billion of third-party debt in the first quarter
of 1999, our actual interest rates were used to determine
interest expense for the remainder of the year.
♦ We reflected income tax expense in the Consolidated
Financial Statements as if we had actually filed a sepa-
rate income tax return.
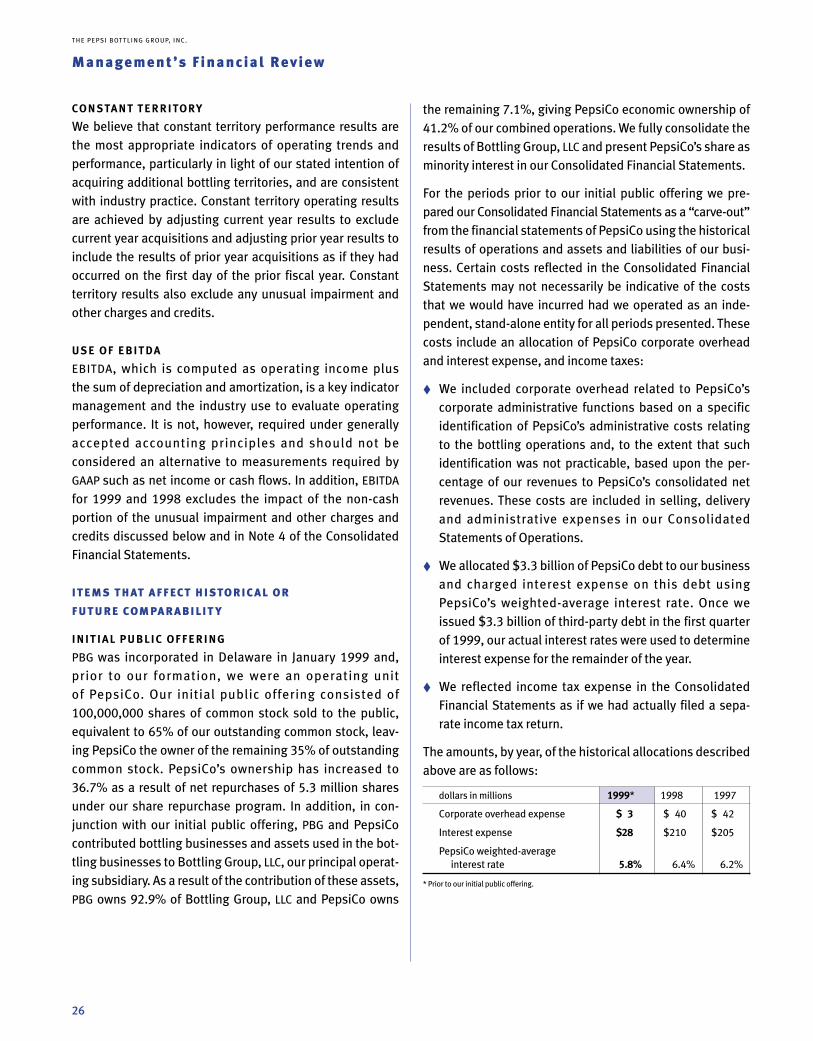
The amounts, by year, of the historical allocations described
above are as follows:
dollars in millions 1999* 1998 1997
Corporate overhead expense $ 3 $ 40 $ 42
Interest expense $28 $210 $205
PepsiCo weighted-average
interest rate 5.8% 6.4% 6.2%
* Prior to our initial public offering.

UNUSUAL IMPAIRMENT AND OTHER CHARGES
AND CREDITS
Our operating results were affected by the following
unusual charges and credits in 1999 and 1998:
dollars in millions 1999 1998*
Non-cash compensation charge $ 45 $ —
Vacation policy change (53) —
Asset impairment and restructuring charges (8) 222
$ (16) $222
After minority interest and income taxes $ (9) $218
*Does not include tax settlement with the Internal Revenue Service discussed on this page.
♦ Non-cash Compensation Charge
In connection with the completion of our initial public offer-
ing, PepsiCo vested substantially all non-vested PepsiCo
stock options held by PBG employees. As a result, we
incurred a $45 million non-cash compensation charge in the
second quarter of 1999, equal to the difference between the
market price of the PepsiCo capital stock and the exercise
price of these options at the vesting date.
♦ Vacation Policy Change
As a result of changes to our employee benefit and com-
pensation plans, employees will now earn vacation time
evenly throughout the year based upon service rendered.
Previously, employees were fully vested at the beginning of
each year. As a result of this change, we have reversed an
accrual of $53 million into income.
♦ Asset Impairment and Restructuring Charges
In the fourth quarter of 1998, we recorded $222 million of
charges relating to the following:
♦ A charge of $212 million for asset impairment of
$194 million and other charges of $18 million related
to restructuring our Russian operations.
♦ A charge of $10 million for employee-related and
other costs, mainly relocation and severance, resulting
from the separation of Pepsi-Cola bottling and concen-
trate organizations.
1999 Annual Repor t
27
In the fourth quarter of 1999, $8 million of the remaining
1998 restructuring reserves was reversed into income, as
actual costs incurred to renegotiate manufacturing and leas-
ing contracts in Russia and to reduce the number of employ-
ees were less than the amounts originally estimated.
♦ Tax Settlement with the Internal Revenue Service
In 1998, we settled a dispute with the Internal Revenue
Service regarding the deductibility of the amortization of
acquired franchise rights, resulting in a $46 million tax benefit.
Comparability of our operating results may also be affected
by the following:
CONCENTRATE SUPPLY
We buy concentrate, the critical flavor ingredient for our
products, from PepsiCo, its affiliates and other brand own-
ers who are the sole authorized suppliers. Concentrate
prices are typically determined annually.
In February 1999, PepsiCo announced an increase of
approximately 5% in the price of U.S. concentrate. The cost
of this increase was offset in substantial part with
increases in the level of marketing support and funding
we received from PepsiCo. PepsiCo has recently announced
a further increase of approximately 7%, effective
February 2000, which will be available for use by PepsiCo to
support brand-building initiatives aimed at driving volume.
Amounts paid or payable to PepsiCo and its affiliates for
concentrate were $1,418 million, $1,283 million and
$1,135 million in 1999, 1998 and 1997, respectively.
BOT TLER INCENT IVES
PepsiCo and other brand owners provide us with various
forms of marketing support. The level of this support is
negotiated annually and can be increased or decreased at
the discretion of the brand owners. This marketing support is
intended to cover a variety of programs and initiatives,
including direct marketplace support, capital equipment
funding and shared media and advertising support. Direct
marketplace support is primarily funding by PepsiCo and
other brand owners of sales discounts and similar programs,
and is recorded as an adjustment to net revenues. Capital
equipment funding is designed to support the purchase and
placement of marketing equipment and is recorded as a
reduction to selling, delivery and administrative expenses.
Shared media and advertising support is recorded as a

TH E PE PS I BOTTLI NG G ROUP, I NC.
28
Management’s Financial Review
reduction to advertising and marketing expense within sell-
ing, delivery and administrative expenses.
The total bottler incentives we received from PepsiCo and
other brand owners were $563 million, $536 million and
$463 million for 1999, 1998 and 1997, respectively. Of
these amounts, we recorded $263 million, $247 million
and $235 million for 1999, 1998 and 1997, respectively, in
net revenues, and the remainder as a reduction to selling,
delivery and administrative expenses. The amount of our
bottler incentives received from PepsiCo was more than
90% of our total bottler incentives in each of the three
years, with the balance received from the other brand own-
ers. We negotiate the level of funding with PepsiCo and
other brand owners as part of the annual planning process.
OUR INVESTMENT IN RUSSIA
In recent years, we have invested in Russia to build infra-
structure and to fund start-up manufacturing and distribu-
tion costs. During the first half of 1998, our volumes were
growing at approximately 50% over 1997 levels. However,
following the August 1998 devaluation of the ruble, we
experienced a significant drop in demand, resulting in lower
net revenues and increased operating losses. As a result of
the economic crisis and the under-utilization of assets, we
incurred a charge of $212 million in the fourth quarter of
1998 to write down our assets and reduce our fixed-cost
structure. The economic conditions in 1999 have been more
stable. However, volumes and revenues have not yet
returned to levels achieved immediately prior to the devalu-
ation as Russian consumers have switched from branded
products to lower-cost alternatives. In response to this envi-
ronment, we have focused on developing alternative means
of leveraging our existing asset base while significantly
reducing costs. Most notably, we have begun to distribute
Frito-Lay® snack products throughout all of Russia, except
Moscow. In addition, we have recently launched our own
value brand beverage products.
We anticipate that our Russian operations will continue to
incur losses and require cash to fund operations for at least
the fiscal year 2000. However, capital requirements will be
minimal because our existing infrastructure is adequate for
current operations. Cash requirements for investing activi-
ties and to fund operations were $45 million, $156 million
and $71 million in 1999, 1998 and 1997, respectively.
Volume in Russia accounted for 1%, 2% and 1% of our total
volume in 1999, 1998 and 1997, respectively. We will con-
tinue to review our Russian operations on a regular basis
and to consider changes in our distribution systems and
other operations as circumstances dictate.
EMPLOYEE BENEFIT PL AN CHANGES
We are making several changes to our employee benefit
plans that will take effect in fiscal year 2000. Our objective
is to ensure that the overall compensation and benefit
plans offered to our employees are competitive with our
industry. The changes that have been made to our vacation
policy, pension and retiree medical plans include some
benefit enhancements as well as cost containment provi-
sions. We do not believe that the net impact of these
changes will be material to our financial results in fiscal
year 2000.
In addition, as previously disclosed at the time of our initial
public offering, we are not continuing the broad-based
stock option program provided by PepsiCo. In its place our
Board of Directors has approved a matching company con-
tribution to our 401(k) plan to begin in 2000. The match will
be made in PBG stock and the amount will depend upon the
employee’s contribution and years of service. We anticipate
that the matching company contribution will cost approxi-
mately $12 million in fiscal year 2000.
Finally, in the fourth quarter of 1999 we recognized a $16 mil-
lion compensation charge related to full-year 1999 perfor-
mance. This expense is one-time in nature and is for the
benefit of our management employees, reflecting our suc-
cessful operating results as well as providing certain incen-
tive-related features.
FISC AL YE AR
Our fiscal year ends on the last Saturday in December and,
as a result, a fifty-third week is added every five or six
years. Fiscal years 1999, 1998 and 1997 consisted of
52 weeks. Fiscal year 2000 will have 53 weeks.

Management’s Financial Review
RE SULTS OF OPER ATIONS
Fiscal 1999 vs. 1998 Fiscal 1998 vs. 1997Constant Constant
Reported Territory Reported Territory
Change Change Change Change
EBITDA 25% 13% (7)% 0%
Volume 4% 0% 7 % 5%
Net Revenue
per Case 3% 3% (1)% 0%
EBITDA
Reported EBITDA was $901 million in 1999, representing a
25% increase over 1998. On a constant territory basis,
EBITDA growth of 13% was driven by a strong pricing envi-
ronment particularly in the U.S. take-home segment, solid
volume growth in our higher-margin cold drink segment
and reduced operating losses in Russia.
In 1998, EBITDA declined 7% on a reported basis and was
flat on a constant territory basis. Strong volume gains
were more than offset by higher raw material costs in
North America, increased selling and delivery expenses
associated with our investment in the cold drink segment
and higher losses in our Russian operations. The reported
decline in 1998 was also impacted by $28 million of cash
restructuring charges.
Fiscal years ended December 25, 1999, December 26, 1998 and December 27, 1997dollars in millions, except per share data 1999 1998 1997
Net Revenues $7,505 $7,041 $6,592Cost of sales 4,296 4,181 3,832Gross Prof i t 3,209 2,860 2,760Selling, delivery and administrative expenses 2,813 2,583 2,425Unusual impairment and other charges and credits (16) 222 —Operat ing Income 412 55 335Interest expense, net 202 221 222Foreign currency loss (gain) 1 26 (2)Minority interest 21 — —Income (Loss) Before Income Taxes 188 (192) 115Income tax expense (benefit) 70 (46) 56Net Income (Loss) $ 118 $ (146) $ 59Basic and Di luted Earnings (Loss) Per Share $ 0.92 $ (2.65) $ 1.07Weighted-Average Basic and Di luted Shares Outstanding 128 55 55
See accompanying notes to Consolidated Financial Statements.
TH E PE PS I BOTTLI NG G ROUP, I NC. 1999 Annual Repor t
29
Cons ol idated Statement s of Operat ions
VOLUME
Our worldwide raw case volume grew 4% on a reported basis
in 1999, and was flat on a constant territory basis. Raw cases
are physical cases sold, regardless of the volume contained
in these cases. In North America, which consists of the U.S.
and Canada, constant territory volume improved 1%. Growth
in our cold drink segment was offset by declines in the take-
home business as we raised prices in the take-home seg-
ment. Outside North America, our constant territory volumes
declined 6%, driven by the continued impact of the economic
conditions in Russia, which began to deteriorate in
August 1998 with the devaluation of the ruble.
In 1998, worldwide case volume grew 7% compared to 1997,
with North America increasing 6% and countries outside
North America increasing 18%. Constant territory volume
increased 5% in the North American markets, 6% outside
North America and 5% worldwide. North American results
were driven by solid growth in our cold drink segment, modest
gains in the take-home segment and the favorable impact of
the launch of Pepsi ONE in the fourth quarter of 1998. Constant
territory volume growth outside North America was positive in
all of our markets, led by Russia, which increased 21%.

TH E PE PS I BOTTLI NG G ROUP, I NC.
30
Management’s Financial Review
NET REVENUES
On a reported basis, net revenues were $7,505 million in
1999, representing a 7% increase over 1998. On a constant
territory basis, net revenues increased 3%, with increases in
North America offsetting a revenue decline outside North
America. North American constant territory revenue growth
was driven by a 1% increase in volume, and a 4% increase in
net revenue per case. The net revenue per case increase was
driven by strong pricing, led by advances in the take-home
segment and an increased mix of higher-revenue cold drink
volume. Initial volume declines partially offset the revenue
impact of higher take-home pricing, although volumes
rebounded in the fourth quarter of 1999. Outside North
America, revenue declines were impacted by the August
1998 ruble devaluation in Russia. On a worldwide basis,
constant territory revenue per physical case was up 3%.
Worldwide net revenues grew 7% from 1997 to 1998 on a
reported basis and 5% on a constant territory basis.
Volume gains contributed five percentage points to con-
stant territory revenue growth while pricing remained
essentially flat. Flat pricing reflected an increased mix
of higher-priced single-serve cold drink packages sold,
offset by lower take-home package pricing in the North
American markets, and promotional pricing relating to the
U.S. introduction of Pepsi ONE in the fourth quarter of 1998.
COST OF SALES
Cost of sales as a percentage of net revenues decreased
from 59.4% in 1998 to 57.3% in 1999. This trend was driven
by higher net revenue per case and relatively flat cost of
sales per case as higher concentrate prices were offset by
lower packaging costs and the favorable effect of renegoti-
ating our raw material contracts in Russia to a ruble
denomination instead of U.S. dollars.
Cost of sales as a percentage of net revenues increased from
58.1% in 1997 to 59.4% in 1998. This increase was primarily
a result of margin declines in the take-home segment and
increases in concentrate costs. An increased mix of revenues
in the higher-margin cold drink segment in 1998 was insuffi-
cient to offset margin declines in the take-home segment.
SELLING, DELIVERY AND ADMINISTRAT IVE E XPEN SES
Selling, delivery and administrative expenses increased
$230 million, or 9%, in 1999. This increase was driven by
acquisitions and higher selling and delivery costs, which
resulted from our continued investment in our North
American cold drink infrastructure. Additional headcount,
delivery routes and depreciation increases resulted from
this initiative in 1999. We anticipate that the investments
we are making in the cold drink business will be more than
recovered through the resulting revenue growth in this
higher-margin business. In addition, higher advertising and
marketing spending was offset by reduced operating costs
in Russia, as our cost structure benefited from our fourth
quarter 1998 restructuring actions. Administrative costs
were impacted by increased performance-related compen-
sation due to our stronger operating results in 1999 com-
pared to 1998. Excluding the impact of performance-related
compensation, our administrative costs were relatively flat
year-over-year.
In 1998, selling, delivery and administrative expenses
increased $158 million, or 7%. Selling and delivery costs grew
at a rate faster than volume while our other administrative
costs grew less than 1% in 1998. The costs associated with
selling and delivery grew faster than volume largely because
of our heavy investment in vending machines and coolers,
consistent with our long-term strategy to increase our pres-
ence in the cold drink segment of the industry in North
America. Spending on vending machines and coolers at cus-
tomer locations in the North American markets was approxi-
mately 20% higher in 1998 than in 1997, driving increases in
the costs associated with placing, depreciating and providing
service for these assets.
FOREIGN CURRENC Y E XCHANGE G AIN S/LOSSES
Our foreign currency exchange gains and losses arise from
our operations in Russia. Since Russia is considered a
highly inflationary economy for accounting purposes, we
are required to remeasure the net monetary assets of our
Russian operations in U.S. dollars and reflect any resulting
gain or loss in the Consolidated Statements of Operations.
The August 1998 devaluation of the Russian ruble resulted
in a significant foreign exchange loss in 1998. In 1999, for-
eign exchange losses have been minimized due to a more
stable ruble exchange rate.

31
1999 Annual Repor t
INTEREST E XPEN SE, NET
Net interest expense decreased by $19 million to $202 mil-
lion in 1999, due primarily to a lower average interest rate
on PBG’s $3.3 billion of long-term debt. Our average inter-
est rate decreased from 6.4% in 1998, when we used
PepsiCo’s average interest rate, to 6.1% in the current year
when we issued our own debt in the first quarter of 1999.
Our lower 1999 interest rates reflect market conditions at
the time we issued our debt. In addition, we had reduced
levels of external debt outside North America.
In 1998, interest expense decreased $1 million compared
to 1997, reflecting higher interest income in Spain, offset
by an increase in PepsiCo’s average borrowing rate from
6.2% to 6.4%.
PROVISION FOR INCOME TA XES
Our full-year effective tax rate for 1999 was an expense of
37.4%, compared to a benefit of 24.0% in 1998 and an
expense of 48.7% in 1997. In 1999, the impact of non-
deductible goodwill and other expenses on the effective tax
rate was offset in part by lower tax rates in our markets out-
side the U.S., and by higher overall pre-tax income. In 1998,
we settled a dispute with the Internal Revenue Service
regarding the deductibility of the amortization of acquired
franchise rights, resulting in a $46 million tax benefit in the
fourth quarter. Also in 1998, our effective tax rate was
increased due to the unusual charges relating to Russia
restructuring and asset write-offs for which we did not rec-
ognize a tax benefit. The 1997 tax rate was driven by the
effect of non-deductible goodwill and other expenses, off-
set in part by lower tax rates outside the U.S.
Our effective tax rate, excluding the unusual impairment
and other charges and credits, would have been 38.0%,0.9% and 48.7% in 1999, 1998 and 1997, respectively.
E ARNINGS PER SHARE
1999 1998 1997
Earnings (loss) per share on
reported net income (loss) $0.92 $(2.65) $1.07
Average shares
outstanding (millions) 128 55 55
Our historical capital structure is not representative of our cur-
rent structure due to our initial public offering. In 1999, imme-
diately preceding the offering, and in 1998 and 1997, we had
55 million shares of common stock outstanding. In connection
with the offering, we sold 100,000,000 shares of common
stock to the public and used the $2.2 billion of proceeds to
repay obligations to PepsiCo and to fund acquisitions.
The table below sets forth earnings per share adjusted for
the initial public offering and the impact of our unusual
impairment and other charges and credits as previously
discussed. In 1999, we assumed 155 million shares were
outstanding from the beginning of the year and adjusted
for our share repurchase program, which began in October
and under which we made net repurchases of approxi-
mately 5.3 million shares. Similarly, the 1998 and 1997earnings per share amounts in the table below have been
adjusted, assuming 155 million shares had been outstand-
ing for the entire period presented.
1999 1998 1997
Earnings (loss) per share on
reported net income (loss) $ 0.76 $(0.94) $0.38
Unusual impairment and other
charges and credits (0.05) 1.41 —
Tax settlement — (0.30) —
Adjusted earnings per share $ 0.71 $ 0.17 $0.38
Assumed shares
outstanding (millions) 155 155 155
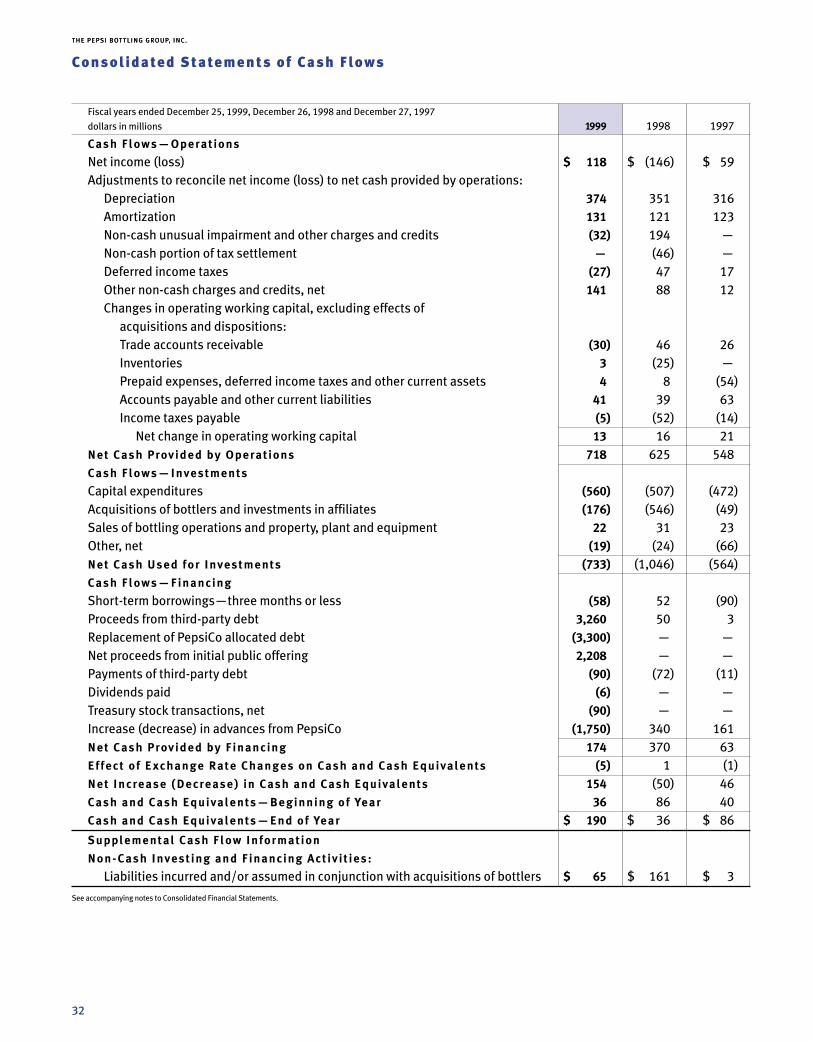
Fiscal years ended December 25, 1999, December 26, 1998 and December 27, 1997
dollars in millions 1999 1998 1997
Cash Flows—Operat ions
Net income (loss) $ 118 $ (146) $ 59Adjustments to reconcile net income (loss) to net cash provided by operations:
Depreciation 374 351 316Amortization 131 121 123Non-cash unusual impairment and other charges and credits (32) 194 —Non-cash portion of tax settlement — (46) —Deferred income taxes (27) 47 17Other non-cash charges and credits, net 141 88 12Changes in operating working capital, excluding effects of
acquisitions and dispositions:
Trade accounts receivable (30) 46 26Inventories 3 (25) —Prepaid expenses, deferred income taxes and other current assets 4 8 (54)Accounts payable and other current liabilities 41 39 63Income taxes payable (5) (52) (14)
Net change in operating working capital 13 16 21Net Cash Provided by Operat ions 718 625 548Cash Flows—Investments
Capital expenditures (560) (507) (472)Acquisitions of bottlers and investments in affiliates (176) (546) (49)Sales of bottling operations and property, plant and equipment 22 31 23Other, net (19) (24) (66)Net Cash Used for Investments (733) (1,046) (564)Cash Flows—Financing
Short-term borrowings—three months or less (58) 52 (90)Proceeds from third-party debt 3,260 50 3Replacement of PepsiCo allocated debt (3,300) — —Net proceeds from initial public offering 2,208 — —Payments of third-party debt (90) (72) (11)Dividends paid (6) — —Treasury stock transactions, net (90) — —Increase (decrease) in advances from PepsiCo (1,750) 340 161Net Cash Provided by F inancing 174 370 63Effect o f E xchange Rate Changes on Cash and Cash Equivalents (5) 1 (1)Net Increase (Decrease) in Cash and Cash Equivalents 154 (50) 46Cash and Cash Equivalents—Beginning of Year 36 86 40Cash and Cash Equivalents—End of Year $ 190 $ 36 $ 86
Supplemental Cash F low Informat ion
Non-Cash Invest ing and F inancing Act iv i t ies:
Liabilities incurred and/or assumed in conjunction with acquisitions of bottlers $ 65 $ 161 $ 3
See accompanying notes to Consolidated Financial Statements.
TH E PE PS I BOTTLI NG G ROUP, I NC.
32
TH E PE PS I BOTTLI NG G ROUP, I NC.
Cons ol idated Statement s of Ca sh Flows

December 25, 1999 and December 26, 1998
in millions, except per share data 1999 1998
A SSETS
Current Assets
Cash and cash equivalents $ 190 $ 36Trade accounts receivable, less allowance of $48 and $46, in 1999 and 1998, respectively 827 808Inventories 293 296Prepaid expenses, deferred income taxes and other current assets 183 178
Total Current Assets 1,493 1,318Property, plant and equipment, net 2,218 2,055Intangible assets, net 3,819 3,806Other assets 89 143
Total Assets $7,619 $7,322
LIABILIT IES AND SHAREHOLDER S’ EQUIT Y
Current L iabi l i t ies
Accounts payable and other current liabilities $ 924 $ 904Income taxes payable — 9Short-term borrowings 23 112
Total Current L iabi l i t ies 947 1,025Allocation of PepsiCo long-term debt — 3,300Long-term debt due to third parties 3,268 61Other liabilities 385 367Deferred income taxes 1,178 1,202Minority interest 278 —Advances from PepsiCo — 1,605
Total L iabi l i t ies 6,056 7,560Shareholders ’ Equi ty
Common stock, par value $.01 per share:
Authorized 300 shares, issued 155 shares 2 —Treasury stock: 5 shares (90) —Additional paid-in capital 1,736 —Retained earnings 138 —Accumulated other comprehensive loss (223) (238)
Total Shareholders ’ Equi ty (Def ic i t ) 1,563 (238)Total L iabi l i t ies and Shareholders ’ Equi ty $7,619 $7,322
See accompanying notes to Consolidated Financial Statements.
TH E PE PS I BOTTLI NG G ROUP, I NC. 1999 Annual Repor t
33
Cons ol idated Balance Sheet s

TH E PE PS I BOTTLI NG G ROUP, I NC.
34
Management’s Financial Review
TH E PE PS I BOTTLI NG G ROUP, I NC.
LIQUIDIT Y AND FINANCIAL CONDITION
LIQUIDIT Y AND C APITAL RESOURCES
Liquidi ty Pr ior to our Separat ion f rom PepsiCo and our
In i t ia l Publ ic Of fer ing
We financed our capital investments and acquisitions
through cash flow from operations and advances from
PepsiCo prior to our separation from PepsiCo and our initial
public offering. Under PepsiCo’s centralized cash manage-
ment system, PepsiCo deposited sufficient cash in our bank
accounts to meet our daily obligations, and withdrew excess
funds from those accounts. These transactions are included
in advances from PepsiCo in our Consolidated Balance
Sheets and Consolidated Statements of Cash Flows.
Liquidi ty Af ter our In i t ia l Publ ic Of fer ing
Subsequent to our initial public offering, we have financed
our capital investments and acquisitions substantially
through cash flow from operations. We believe that our
future cash flow from operations and borrowing capacity
will be sufficient to fund capital expenditures, acquisitions,
dividends and other working capital requirements.
FINANCING TRAN SACT ION S
On February 9, 1999, $1.3 billion of 55⁄8% senior notes and
$1.0 billion of 53⁄8% senior notes were issued by Bottling
Group, LLC and are guaranteed by PepsiCo. On March 8,1999, we issued $1 billion of 7% senior notes, which are
guaranteed by Bottling Group, LLC. During the second quar-
ter of 1999, we executed an interest rate swap converting
3% of our fixed-rate debt to floating-rate debt.
On March 31, 1999, we offered 100,000,000 shares of PBG
common stock for sale to the public in an underwritten ini-
tial public offering generating $2.2 billion of net proceeds.
In April 1999, we entered into a $500 million commercial
paper program that is supported by a credit facility. The
credit facility consists of two $250 million components,
one of which is one year in duration and the other of which
is five years in duration. There were no borrowings out-
standing under this program at December 25, 1999.
The proceeds from the above financing transactions were
used to repay obligations to PepsiCo and fund acquisitions.
C APITAL E XPENDITURES
We have incurred and will require capital for ongoing
infrastructure, including acquisitions and investments in
developing market opportunities.
♦ Our business requires substantial infrastructure invest-
ments to maintain our existing level of operations and to
fund investments targeted at growing our business.
Capital infrastructure expenditures totaled $560 mil-
lion, $507 million and $472 million during 1999, 1998and 1997, respectively. We believe that capital infra-
structure spending will continue to be significant, driven
by our investments in the cold drink segment.
♦ We intend to continue to pursue acquisitions of inde-
pendent PepsiCo bottlers in the U.S. and Canada, partic-
ularly in territories contiguous to our own. These
acquisitions will enable us to provide better service to
our large retail customers, as well as to reduce costs
through economies of scale. We also plan to evaluate
international acquisition opportunities as they become
available. Cash spending for acquisitions was $176 mil-
lion, $546 million and $49 million in 1999, 1998 and
1997, respectively.
C A SH FLOWS
Fiscal 1999 Compared to F iscal 1998
Operating cash flow in 1999 grew $36 million, or 29%, to
$161 million from 1998. Operating cash flow is defined as
net cash provided by operations less net cash used for
investments, excluding cash used for acquisitions of bot-
tlers and investments in affiliates.
Net cash provided by operations in 1999 improved to
$718 million from $625 million in 1998, due primarily to
strong growth in EBITDA and favorable working capital cash
flows resulting from the timing of cash payments and our
continued focus on working capital management.
Net cash used for investments was $733 million in 1999compared to $1,046 million in 1998. In 1999, $176 million
was utilized for the acquisition of bottlers in the U.S.,
Canada and Russia, compared to $546 million in 1998. In
addition, we continued to invest heavily in cold drink equip-
ment in North America, resulting in increased capital spend-
ing from $507 million in 1998 to $560 million in 1999.

1999 Annual Repor t
35
Net cash provided by financing decreased by $196 million
from $370 million to $174 million during 1999, mainly due
to the net pay-down of $58 million of short-term borrow-
ings in 1999, the payment in the first quarter of 1999 of
borrowings in Russia related to the purchase of Pepsi
International Bottlers, LLC and $90 million of share repur-
chases in the fourth quarter of 1999. Net IPO proceeds of
$2.2 billion and proceeds from the issuance of third-party
debt of $3.3 billion were used to repay obligations to
PepsiCo and fund acquisitions.
Fiscal 1998 Compared to F iscal 1997
Net cash provided by operations in 1998 improved to
$625 million from $548 million in 1997 due primarily to the
favorable effect of a three-year insurance prepayment to a
PepsiCo affiliate in 1997, and our continued focus on work-
ing capital management.
Net cash used for investments was $1,046 million in 1998compared to $564 million in 1997. In 1998, $546 million was
utilized for the acquisition of bottlers and investments in affil-
iates in the U.S., Canada and Russia, compared to $49 million
in 1997. In addition, we continued to increase our investment
in cold drink equipment in North America.
The net cash used for financing in 1998 was provided by
normal operating activities, advances from PepsiCo and
proceeds from short-term borrowings. The total net cash
from financing activities in 1998 was $370 million.
MARKET RI SKS AND C AUTIONARY STATEMENTS
QUANT ITAT IVE AND QUALITAT IVE DISCLOSURES
ABOUT MARKET RISK
We are exposed to various market risks including commodity
prices, interest rates on our debt and foreign exchange rates.
Commodity Pr ice Risk
We are subject to market risks with respect to commodities
because our ability to recover increased costs through
higher pricing may be limited by the competitive environ-
ment in which we operate.
We use futures contracts and options on futures in the nor-
mal course of business to hedge anticipated purchases of
certain raw materials used in our manufacturing opera-
tions. Currently we have various contracts outstanding for
aluminum purchases in 2000, which establish our pur-
chase price within defined ranges.
Interest Rate Risk
Historically, we have had no material interest rate risk
associated with debt used to finance our operations due to
limited third-party borrowings. We intend to manage our
interest rate exposure using both financial derivative
instruments and a mix of fixed and floating interest rate
debt. During the second quarter of 1999, we executed an
interest rate swap converting 3% of our fixed-rate debt to
floating-rate debt.
Foreign Currency E xchange Rate Risk
Operating in international markets involves exposure to
movements in currency exchange rates. Currency exchange
rate movements typically also affect economic growth,
inflation, interest rates, government actions and other fac-
tors. These changes can cause us to adjust our financing
and operating strategies. The discussion below of changes
in currency exchange rates does not incorporate these
other economic factors. For example, the sensitivity analy-
sis presented in the foreign exchange discussion below
does not take into account the possibility that the impact of
an exchange rate movement may or may not be offset by
the impact of changes in other categories.
Operations outside the U.S. constitute approximately 15%
of our net revenues. As currency exchange rates change,
translation of the statements of operations of our interna-
tional businesses into U.S. dollars affects year-over-year
comparability. We have not hedged translation risks
because cash flows from international operations have
generally been reinvested locally, nor historically have we
entered into hedges to minimize the volatility of reported
earnings. We estimate that a 10% change in foreign
exchange rates would affect reported operating income by
less than $10 million.
Foreign exchange gains and losses reflect transaction and
translation gains and losses arising from the re-measurement
into U.S. dollars of the net monetary assets of businesses
in highly inflationary countries. Russia is considered a
highly inflationary economy for accounting purposes and
all foreign exchange gains and losses are included in the
Consolidated Statements of Operations.
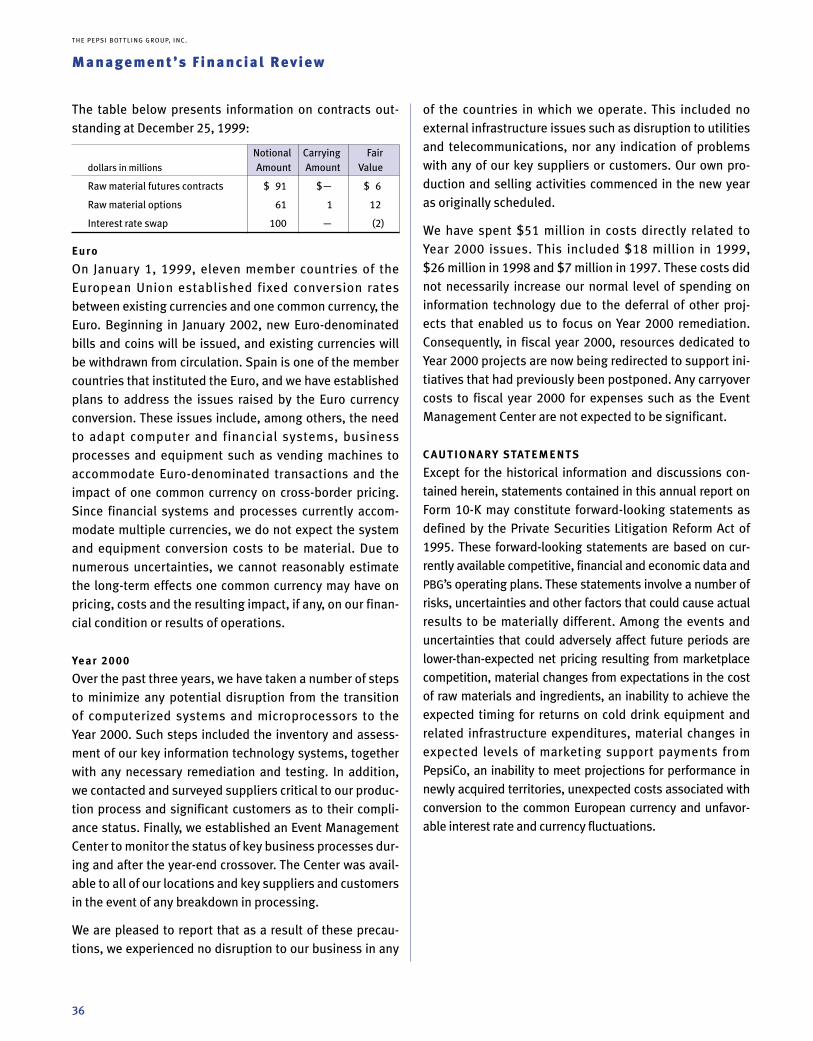
TH E PE PS I BOTTLI NG G ROUP, I NC.
36
Management’s Financial Review
of the countries in which we operate. This included no
external infrastructure issues such as disruption to utilities
and telecommunications, nor any indication of problems
with any of our key suppliers or customers. Our own pro-
duction and selling activities commenced in the new year
as originally scheduled.
We have spent $51 million in costs directly related to
Year 2000 issues. This included $18 million in 1999,$26 million in 1998 and $7 million in 1997. These costs did
not necessarily increase our normal level of spending on
information technology due to the deferral of other proj-
ects that enabled us to focus on Year 2000 remediation.
Consequently, in fiscal year 2000, resources dedicated to
Year 2000 projects are now being redirected to support ini-
tiatives that had previously been postponed. Any carryover
costs to fiscal year 2000 for expenses such as the Event
Management Center are not expected to be significant.
C AUT IONARY STATEMENTS
Except for the historical information and discussions con-
tained herein, statements contained in this annual report on
Form 10-K may constitute forward-looking statements as
defined by the Private Securities Litigation Reform Act of
1995. These forward-looking statements are based on cur-
rently available competitive, financial and economic data and
PBG’s operating plans. These statements involve a number of
risks, uncertainties and other factors that could cause actual
results to be materially different. Among the events and
uncertainties that could adversely affect future periods are
lower-than-expected net pricing resulting from marketplace
competition, material changes from expectations in the cost
of raw materials and ingredients, an inability to achieve the
expected timing for returns on cold drink equipment and
related infrastructure expenditures, material changes in
expected levels of marketing support payments from
PepsiCo, an inability to meet projections for performance in
newly acquired territories, unexpected costs associated with
conversion to the common European currency and unfavor-
able interest rate and currency fluctuations.
The table below presents information on contracts out-
standing at December 25, 1999:
Notional Carrying Fair
dollars in millions Amount Amount Value
Raw material futures contracts $ 91 $— $ 6
Raw material options 61 1 12
Interest rate swap 100 — (2)
Euro
On January 1, 1999, eleven member countries of the
European Union established fixed conversion rates
between existing currencies and one common currency, the
Euro. Beginning in January 2002, new Euro-denominated
bills and coins will be issued, and existing currencies will
be withdrawn from circulation. Spain is one of the member
countries that instituted the Euro, and we have established
plans to address the issues raised by the Euro currency
conversion. These issues include, among others, the need
to adapt computer and financial systems, business
processes and equipment such as vending machines to
accommodate Euro-denominated transactions and the
impact of one common currency on cross-border pricing.
Since financial systems and processes currently accom-
modate multiple currencies, we do not expect the system
and equipment conversion costs to be material. Due to
numerous uncertainties, we cannot reasonably estimate
the long-term effects one common currency may have on
pricing, costs and the resulting impact, if any, on our finan-
cial condition or results of operations.
Year 2000
Over the past three years, we have taken a number of steps
to minimize any potential disruption from the transition
of computerized systems and microprocessors to the
Year 2000. Such steps included the inventory and assess-
ment of our key information technology systems, together
with any necessary remediation and testing. In addition,
we contacted and surveyed suppliers critical to our produc-
tion process and significant customers as to their compli-
ance status. Finally, we established an Event Management
Center to monitor the status of key business processes dur-
ing and after the year-end crossover. The Center was avail-
able to all of our locations and key suppliers and customers
in the event of any breakdown in processing.
We are pleased to report that as a result of these precau-
tions, we experienced no disruption to our business in any

Accumu-
Fiscal years ended December 25, lated Other Compre-
1999, December 26, 1998 and Additional Compre- hensive
December 27, 1997 Common Treasury Paid-In Retained hensive Income/
in millions Stock Stock Capital Earnings Loss Total (Loss)
Balance at December 28, 1996 $– $ – $ – $ – $(102) $ (102)Comprehensive income:
Net income – – – – – – $ 59Currency translation adjustment – – – – (82) (82) (82)
Total comprehensive loss $ (23)
Balance at December 27, 1997 – – – – (184) (184)Comprehensive loss:
Net loss – – – – – – $(146)Currency translation adjustment – – – – (35) (35) (35)Minimum pension
liability adjustment – – – – (19) (19) (19)Total comprehensive loss $(200)
Balance at December 26, 1998 – – – – (238) (238)Comprehensive income:
Net loss before IPO – – – – – – $ (29)Net income after IPO – – – 147 – 147 147Currency translation adjustment – – – – (4) (4) (4)Minimum pension
liability adjustment – – – – 19 19 19Total comprehensive income $ 133
Initial public offering (100 shares)
net of settlement of
advances from PepsiCo 2 – 1,736 – – 1,738
Treasury stock transactions,
net (5 shares) – (90) – – – (90)
Cash dividends declared on
common stock – – – (9) – (9)
Balance at December 25, 1999 $2 $(90) $1,736 $138 $(223) $ 1,563
See accompanying notes to Consolidated Financial Statements.
37
Cons ol idated Statement s of Change s in Shareholders ’ Equity
TH E PE PS I BOTTLI NG G ROUP, I NC. 1999 Annual Repor t
TH E PE PS I BOTTLI NG G ROUP, I NC.
38
Note s to Cons ol idated Financial Statement sTabular dollars in millions, except per share data
NOTE 1. BA SI S OF PRE SENTATION
The Pepsi Bottling Group, Inc. (“PBG”) consists of bottling
operations located in the United States, Canada, Spain,
Greece and Russia. These bottling operations manufacture,
sell and distribute Pepsi-Cola beverages including Pepsi-Cola,
Diet Pepsi, Mountain Dew and other brands of carbonated soft
drinks and other ready-to-drink beverages. Approximately
90% of PBG’s 1999 net revenues were derived from the sale of
Pepsi-Cola beverages. References to PBG throughout these
Consolidated Financial Statements are made using the first-
person notations of “we,” “our” and “us.”
Prior to our formation, we were an operating unit of PepsiCo,
Inc. (“PepsiCo”). On March 31, 1999, we offered 100,000,000shares of PBG common stock for sale at $23 per share in an
initial public offering generating $2,208 million in net pro-
ceeds. These proceeds were used to fund acquisitions and
repay obligations to PepsiCo. Subsequent to the offering,
PepsiCo owned and continues to own 55,005,679 shares of
common stock, consisting of 54,917,329 shares of common
stock and 88,350 shares of Class B common stock. PepsiCo’s
ownership at December 25, 1999, represents 36.7% of the
outstanding common stock and 100% of the outstanding
Class B common stock, together representing 44.8% of the
voting power of all classes of our voting stock. Subsequent to
the offering, PepsiCo also owns 7.1% of the equity of Bottling
Group, LLC, our principal operating subsidiary, giving PepsiCo
economic ownership of 41.2% of our combined operations at
December 25, 1999.
The 154,917,354 common shares and 88,350 Class B com-
mon shares are substantially identical, except for voting
rights. Holders of our common stock are entitled to one vote
per share and holders of our Class B common stock are enti-
tled to 250 votes per share. Each share of Class B common
stock held by PepsiCo is, at PepsiCo’s option, convertible
into one share of common stock. Holders of our common
stock and holders of our Class B common stock share
equally on a per share basis in any dividend distributions.
The accompanying Consolidated Financial Statements
include information that has been presented on a “carve-out”
basis for the periods prior to our initial public offering. This
information includes the historical results of operations and
assets and liabilities directly related to PBG, and has been
prepared from PepsiCo’s historical accounting records.
Certain estimates, assumptions and allocations were made
in determining such financial statement information. There-
fore, these Consolidated Financial Statements may not
necessarily be indicative of the results of operations, finan-
cial position or cash flows that would have existed had we
been a separate, independent company from the first day of
all periods presented.
NOTE 2 . SUMMARY OF SIGNIFIC ANT
ACCOUNTING POLICIE S
Our preparation of the Consolidated Financial Statements
in conformity with generally accepted accounting princi-
ples requires us to make estimates and assumptions that
affect the reported amounts of assets and liabilities and
the disclosure of contingent assets and liabilities at the
date of the financial statements, and the reported amounts
of net revenues and expenses during the reporting period.
Actual results could differ from our estimates.
Basis of Consolidation The accounts of all of our wholly
and majority-owned subsidiaries are included in the
accompanying Consolidated Financial Statements. We
have eliminated intercompany accounts and transactions
in consolidation.
Fiscal Year Our fiscal year ends on the last Saturday in
December and, as a result, a fifty-third week is added every
five or six years. Fiscal years 1999, 1998 and 1997 con-
sisted of 52 weeks. Fiscal year 2000 will have 53 weeks.
Revenue Recognition We recognize revenue when goods
are delivered to customers. Sales terms do not allow a right
of return unless product freshness dating has expired.
Reserves for returned product were $2 million at fiscal
year-end 1999, 1998 and 1997, respectively.
Advertising and Marketing Costs We are involved in a vari-
ety of programs to promote our products. We include
advertising and marketing costs in selling, delivery and
administrative expenses and expense such costs in the
year incurred. Advertising and marketing costs were
$298 million, $233 million and $210 million in 1999, 1998and 1997, respectively.
Bottler Incentives PepsiCo and other brand owners, at
their sole discretion, provide us with various forms of mar-
keting support. This marketing support is intended to cover
a variety of programs and initiatives, including direct mar-
ketplace support, capital equipment funding and shared
media and advertising support. Based on the objective of
the programs and initiatives, we record marketing support

39
1999 Annual Repor t
as an adjustment to net revenues or as a reduction of selling,
delivery and administrative expenses. Direct marketplace
support is primarily funding by PepsiCo and other brand
owners of sales discounts and similar programs and is
recorded as an adjustment to net revenues. Capital equip-
ment funding is designed to support the purchase and
placement of marketing equipment and is recorded as a
reduction to selling, delivery and administrative expenses.
Shared media and advertising support is recorded as a
reduction to advertising and marketing expense within
selling, delivery and administrative expenses. There are no
conditions or other requirements that could result in a
repayment of marketing support received.
The total bottler incentives we received from PepsiCo and
other brand owners, were $563 million, $536 million and
$463 million for 1999, 1998 and 1997, respectively. Of
these amounts, we recorded $263 million, $247 million
and $235 million for 1999, 1998 and 1997, respectively, in
net revenues, and the remainder as a reduction to selling,
delivery and administrative expenses. The amount of our
bottler incentives received from PepsiCo was more than
90% of our bottler incentives in each of the three years,
with the balance received from the other brand owners.
Stock-Based Employee Compensation We measure stock-
based compensation expense in accordance with
Accounting Principles Board Opinion 25, “Accounting for
Stock Issued to Employees,” and its related interpretations.
Accordingly, compensation expense for stock option grants
to PBG employees is measured as the excess of the quoted
market price of common stock at the grant date over the
amount the employee must pay for the stock. Our policy is
to grant stock options at fair value on the date of grant.
Cash Equivalents Cash equivalents represent funds we
have temporarily invested with original maturities not
exceeding three months.
Inventories We value our inventories at the lower of cost com-
puted on the first-in, first-out method or net realizable value.
Property, Plant and Equipment We state property, plant and
equipment (“PP&E”) at cost, except for PP&E that has been
impaired, for which we write down the carrying amount to
estimated fair-market value, which then becomes the new
cost basis.
Intangible Assets Intangible assets include both franchise
rights and goodwill arising from the allocation of the pur-
chase price of businesses acquired. Goodwill represents
the residual purchase price after allocation of all identifi-
able net assets. Franchise rights and goodwill are evalu-
ated at the date of acquisition and amortized on a
straight-line basis over their estimated useful lives, which
in most cases is between 20 to 40 years.
Recoverability of Long-Lived Assets We review all long-
lived assets, including intangible assets, when facts and
circumstances indicate that the carrying value of the asset
may not be recoverable. When necessary, we write down an
impaired asset to its estimated fair value based on the best
information available. Estimated fair value is generally
based on either appraised value or measured by discount-
ing estimated future cash flows. Considerable manage-
ment judgment is necessary to estimate discounted future
cash flows. Accordingly, actual results could vary signifi-
cantly from such estimates.
Minority Interest PBG and PepsiCo contributed bottling
businesses and assets used in the bottling businesses to
Bottling Group, LLC, our principal operating subsidiary, in
connection with the formation of Bottling Group, LLC. As a
result of the contribution of these assets, PBG owns 92.9%of Bottling Group, LLC and PepsiCo owns the remaining
7.1%. Accordingly, the Consolidated Financial Statements
reflect PepsiCo’s share of consolidated net income of
Bottling Group, LLC as minority interest in our Consolidated
Statements of Operations, and PepsiCo’s share of consoli-
dated net assets of Bottling Group, LLC as minority interest
in our Consolidated Balance Sheets from our initial public
offering through the end of the year.
Treasury Stock We record the repurchase of shares of our
common stock at cost and classify these shares as treasury
stock within shareholders’ equity. Repurchased shares are
included in our authorized shares but not included in our
shares outstanding. We record shares reissued using an
average cost. During 1999, our Board of Directors autho-
rized the repurchase of 10 million shares of common stock
under which we made net repurchases of 5.3 million shares
for $90 million.

TH E PE PS I BOTTLI NG G ROUP, I NC.
40
Note s to Cons ol idated Financial Statement sTabular dollars in millions, except per share data
Financial Instruments and Risk Management We use
futures contracts and options on futures to hedge against
the risk of adverse movements in the price of certain com-
modities used in the manufacture of our products. In order
to qualify for deferral hedge accounting of unrealized gains
and losses, such instruments must be designated and
effective as a hedge of an anticipatory transaction. Changes
in the value of instruments that we use to hedge commod-
ity prices are highly correlated to the changes in the value
of the purchased commodity.
We review the correlation and effectiveness of these finan-
cial instruments on a periodic basis. Gains and losses on
futures contracts that are designated and effective as
hedges of future commodity purchases are deferred and
included in the cost of the related raw materials when pur-
chased. Financial instruments that do not meet the criteria
for hedge accounting treatment are marked-to-market with
the resulting unrealized gain or loss recorded as other
income and expense within selling, delivery and adminis-
trative expenses. Realized gains and losses that result from
the early termination of financial instruments used for
hedging purposes are deferred and are included in cost of
sales when the anticipated transaction actually occurs.
Premiums paid for the purchase of options on futures are
recorded as a prepaid expense in the Consolidated Balance
Sheets and are amortized as an adjustment to cost of sales
over the duration of the contract.
From time to time, we utilize interest rate swaps to hedge
our exposure to fluctuations in interest rates. The interest
differential to be paid or received on an interest rate swap
is recognized as an adjustment to interest expense as the
differential occurs. The interest differential not yet settled
in cash is reflected in the accompanying Consolidated
Balance Sheets as a receivable or payable within the
appropriate current asset or liability captions. If we termi-
nate an interest rate swap position, the gain or loss real-
ized upon termination would be deferred and amortized to
interest expense over the remaining term of the underlying
debt instrument it was intended to modify, or would be rec-
ognized immediately if the underlying debt instrument was
settled prior to maturity.
Foreign Exchange Gains and Losses We translate the bal-
ance sheets of our foreign subsidiaries that do not operate
in highly inflationary economies at the exchange rates in
effect at the balance sheet date, while we translate the
statements of operations at the average rates of exchange
during the year. The resulting translation adjustments of
our foreign subsidiaries are recorded directly to accumu-
lated other comprehensive loss. Foreign exchange gains
and losses reflect transaction and translation gains and
losses arising from the re-measurement into U.S. dollars of
the net monetary assets of businesses in highly inflation-
ary countries. Russia is considered a highly inflationary
economy for accounting purposes and we include all for-
eign exchange gains and losses in the Consolidated
Statements of Operations.
New Accounting Standards In June 1998, the Financial
Accounting Standards Board (FASB) issued Statement of
Financial Accounting Standard 133, “Accounting for Derivative
Instruments and Hedging Activities.” This statement estab-
lishes accounting and reporting standards for hedging
activities and derivative instruments, including certain
derivative instruments embedded in other contracts, which
are collectively referred to as derivatives. It requires that an
entity recognize all derivatives as either assets or liabilities
in the statement of financial position and measure those
instruments at fair value. We are currently assessing the
effects of adopting SFAS 133, and have not yet made a
determination of the impact on our financial position or
results of operations.
In July 1999, the FASB issued Statement of Financial
Accounting Standard 137, delaying the implementation of
SFAS 133 for one year. SFAS 133 will now be effective for our
first quarter of fiscal year 2001.
Earnings Per Share We compute basic earnings per share
by dividing net income by the weighted-average number of
common shares outstanding for the period. Diluted earn-
ings per share reflect the potential dilution that could occur
if securities or other contracts to issue common stock were
exercised or converted into common stock that would then
participate in net income.
NOTE 3 . INITIAL PUBLIC OFFERING AND
COMPAR ABILIT Y OF RE SULTS
For the periods prior to our initial public offering, our
Consolidated Financial Statements have been carved out
from the financial statements of PepsiCo using the histori-
cal results of operations and assets and liabilities of our

business. The Consolidated Financial Statements reflect
certain costs that may not necessarily be indicative of the
costs we would have incurred had we operated as an inde-
pendent, stand-alone entity for all periods presented. These
costs include an allocation of PepsiCo corporate overhead
and interest expense, and income taxes.
♦ We included corporate overhead related to PepsiCo’s
corporate administrative functions based on a specific
identification of PepsiCo’s administrative costs relating
to the bottling operations and, to the extent that such
identification was not practicable, based upon the per-
centage of our revenues to PepsiCo’s consolidated net
revenues. These costs are included in selling, delivery
and administrative expenses in our Consolidated
Statements of Operations.
♦ We allocated $3.3 billion of PepsiCo debt to our busi-
ness. We charged interest expense on this debt using
PepsiCo’s weighted-average interest rate. Once we
issued $3.3 billion of third-party debt in the first quarter
of 1999, our actual interest rates were used to deter-
mine interest expense for the remainder of the year.
♦ We reflected income tax expense in our Consolidated
Financial Statements as if we had actually filed a sepa-
rate income tax return.
The amounts, by year, of the historical allocations described
above are as follows:
1999* 1998 1997
Corporate overhead expense $ 3 $ 40 $ 42
Interest expense $28 $210 $205
PepsiCo weighted-average
interest rate 5.8% 6.4% 6.2%
*Prior to our initial public offering.
In addition, our historical capital structure is not represen-
tative of our current structure due to our initial public offer-
ing. In 1999, immediately preceding the offering and in
1998 and 1997, we had 55,000,000 shares of common
stock outstanding. In connection with the offering, we sold
100,000,000 shares to the public.
41
1999 Annual Repor t
NOTE 4. UNUSUAL IMPAIRMENT AND OTHER CHARGE S
AND CREDITS
1999 1998*
Non-cash compensation charge $ 45 $ —
Vacation policy change (53) —
Asset impairment and restructuring charges (8) 222
$(16) $222
After minority interest and income taxes $ (9) $218
*Does not include tax settlement with the Internal Revenue Service discussed on the next page.
The 1999 unusual items comprise the following:
♦ In connection with the completion of our initial public
offering, PepsiCo vested substantially all non-vested
PepsiCo stock options held by PBG employees. As a
result, we incurred a $45 million non-cash compensa-
tion charge in the second quarter, equal to the differ-
ence between the market price of the PepsiCo capital
stock and the exercise price of these options at the
vesting date.
♦ Employees will now earn vacation time evenly through-
out the year based upon service rendered. Previously,
employees were fully vested for the current year at the
beginning of each year. As a result of this change, we
have reversed an accrual of $53 million into income.
♦ In the fourth quarter, $8 million of the remaining 1998restructuring reserve was reversed into income, as actual
costs incurred to renegotiate manufacturing and leasing
contracts in Russia and to reduce the number of employ-
ees were less than the amounts originally estimated.
The 1998 unusual items comprise the following:
♦ A fourth-quarter charge of $212 million for asset impair-
ment of $194 million and other charges of $18 million
related to the restructuring of our Russian bottling oper-
ations. The economic turmoil in Russia, which accompa-
nied the devaluation of the ruble in August 1998, had an

TH E PE PS I BOTTLI NG G ROUP, I NC.
42
Note s to Cons ol idated Financial Statement sTabular dollars in millions, except per share data
adverse impact on our operations. Consequently, in the
fourth quarter we experienced a significant drop in
demand, resulting in lower net revenues and increased
operating losses. Additionally, since net revenues in
Russia are denominated in rubles, whereas a substan-
tial portion of costs and expenses at that time were
denominated in U.S. dollars, our operating margins
were further eroded. In response to these conditions,
we reduced our cost structure primarily through closing
four of our 26 distribution facilities, renegotiating manu-
facturing and leasing contracts and reducing the number
of employees, primarily in sales and operations, from
approximately 4,500 to 2,000. We also evaluated the
resulting impairment of long-lived assets, triggered by
the reduction in utilization of assets caused by the lower
demand, the adverse change in the business climate and
the expected continuation of operating losses and cash
deficits in that market. The impairment charge reduced
the net book value of these assets from $245 million to
$51 million, their estimated fair market value based pri-
marily on values paid for similar assets in Russia.
♦ A fourth-quarter charge of $10 million for employee-
related and other costs, mainly relocation and sever-
ance, resulting from the separation of Pepsi-Cola North
America’s concentrate and bottling organizations.
♦ At year-end 1999, $3 million remained in accounts
payable and other current liabilities relating to remain-
ing lease termination costs on facilities and employee
costs to be paid in 2000.
♦ We recognized an income tax benefit of $46 million in the
fourth quarter of 1998 upon the settlement of a disputed
claim with the Internal Revenue Service relating to the
deductibility of the amortization of acquired franchise
rights. The settlement also resulted in the reduction of
goodwill and income taxes payable by $194 million.
NOTE 5 . INVENTORIE S
1999 1998
Raw materials and supplies $110 $120
Finished goods 183 176
$293 $296
NOTE 6 . PROPERT Y, PL ANT AND EQUIPMENT, NET
1999 1998
Land $ 145 $ 151
Buildings and improvements 852 813
Production and distribution equipment 2,112 1,989
Marketing equipment 1,596 1,368
Other 84 95
4,789 4,416
Accumulated depreciation (2,571) (2,361)
$ 2,218 $ 2,055
We calculate depreciation on a straight-line basis over the
estimated lives of the assets as follows:
Buildings and improvements 20–33 years
Production equipment 10 years
Distribution equipment 5–8 years
Marketing equipment 3–7 years
NOTE 7. INTANGIBLE A SSETS, NET
1999 1998
Franchise rights and other
identifiable intangibles $ 3,565 $ 3,460
Goodwill 1,582 1,539
5,147 4,999
Accumulated amortization (1,328) (1,193)
$ 3,819 $ 3,806
Identifiable intangible assets arise principally from the
allocation of the purchase price of businesses acquired,
and consist primarily of territorial franchise rights. Our
franchise rights are typically perpetual in duration, subject
to compliance with the underlying franchise agreement. We
assign amounts to such identifiable intangibles based on
their estimated fair value at the date of acquisition. Goodwill
represents the residual purchase price after allocation to all
identifiable net assets.
NOTE 8 . ACCOUNTS PAYABLE AND
OTHER CURRENT LIABILITIE S
1999 1998
Accounts payable $334 $328
Accrued compensation and benefits 147 174
Trade incentives 201 163
Accrued interest 69 —
Other current liabilities 173 239
$924 $904
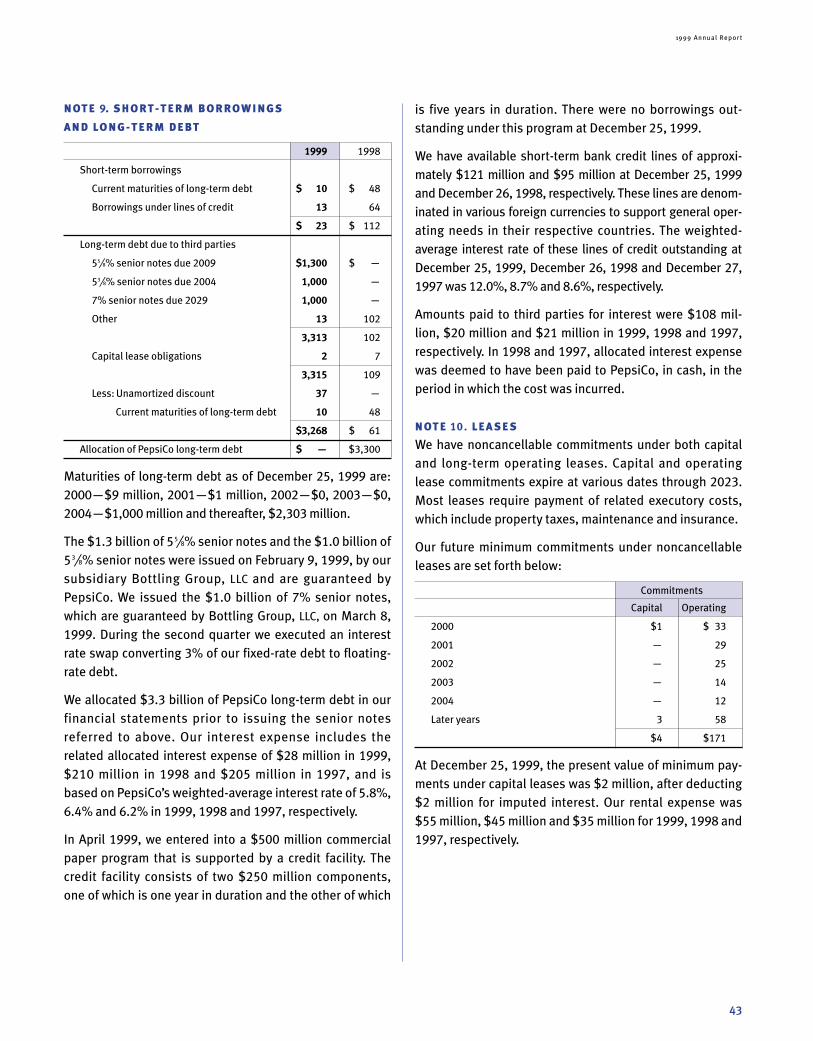
is five years in duration. There were no borrowings out-
standing under this program at December 25, 1999.
We have available short-term bank credit lines of approxi-
mately $121 million and $95 million at December 25, 1999and December 26, 1998, respectively. These lines are denom-
inated in various foreign currencies to support general oper-
ating needs in their respective countries. The weighted-
average interest rate of these lines of credit outstanding at
December 25, 1999, December 26, 1998 and December 27,1997 was 12.0%, 8.7% and 8.6%, respectively.
Amounts paid to third parties for interest were $108 mil-
lion, $20 million and $21 million in 1999, 1998 and 1997,respectively. In 1998 and 1997, allocated interest expense
was deemed to have been paid to PepsiCo, in cash, in the
period in which the cost was incurred.
NOTE 10. LEA SE S
We have noncancellable commitments under both capital
and long-term operating leases. Capital and operating
lease commitments expire at various dates through 2023.
Most leases require payment of related executory costs,
which include property taxes, maintenance and insurance.
Our future minimum commitments under noncancellable
leases are set forth below:
Commitments
Capital Operating
2000 $1 $ 33
2001 — 29
2002 — 25
2003 — 14
2004 — 12
Later years 3 58
$4 $171
At December 25, 1999, the present value of minimum pay-
ments under capital leases was $2 million, after deducting
$2 million for imputed interest. Our rental expense was
$55 million, $45 million and $35 million for 1999, 1998 and
1997, respectively.
43
1999 Annual Repor t
NOTE 9. SHORT-TERM B ORROWING S
AND LONG-TERM DEBT
1999 1998
Short-term borrowings
Current maturities of long-term debt $ 10 $ 48
Borrowings under lines of credit 13 64
$ 23 $ 112
Long-term debt due to third parties
55⁄8% senior notes due 2009 $1,300 $ —
53⁄8% senior notes due 2004 1,000 —
7% senior notes due 2029 1,000 —
Other 13 102
3,313 102
Capital lease obligations 2 7
3,315 109
Less: Unamortized discount 37 —
Current maturities of long-term debt 10 48
$3,268 $ 61
Allocation of PepsiCo long-term debt $ — $3,300
Maturities of long-term debt as of December 25, 1999 are:
2000—$9 million, 2001—$1 million, 2002—$0, 2003—$0,
2004—$1,000 million and thereafter, $2,303 million.
The $1.3 billion of 55⁄8% senior notes and the $1.0 billion of
53⁄8% senior notes were issued on February 9, 1999, by our
subsidiary Bottling Group, LLC and are guaranteed by
PepsiCo. We issued the $1.0 billion of 7% senior notes,
which are guaranteed by Bottling Group, LLC, on March 8,1999. During the second quarter we executed an interest
rate swap converting 3% of our fixed-rate debt to floating-
rate debt.
We allocated $3.3 billion of PepsiCo long-term debt in our
financial statements prior to issuing the senior notes
referred to above. Our interest expense includes the
related allocated interest expense of $28 million in 1999,$210 million in 1998 and $205 million in 1997, and is
based on PepsiCo’s weighted-average interest rate of 5.8%,6.4% and 6.2% in 1999, 1998 and 1997, respectively.
In April 1999, we entered into a $500 million commercial
paper program that is supported by a credit facility. The
credit facility consists of two $250 million components,
one of which is one year in duration and the other of which
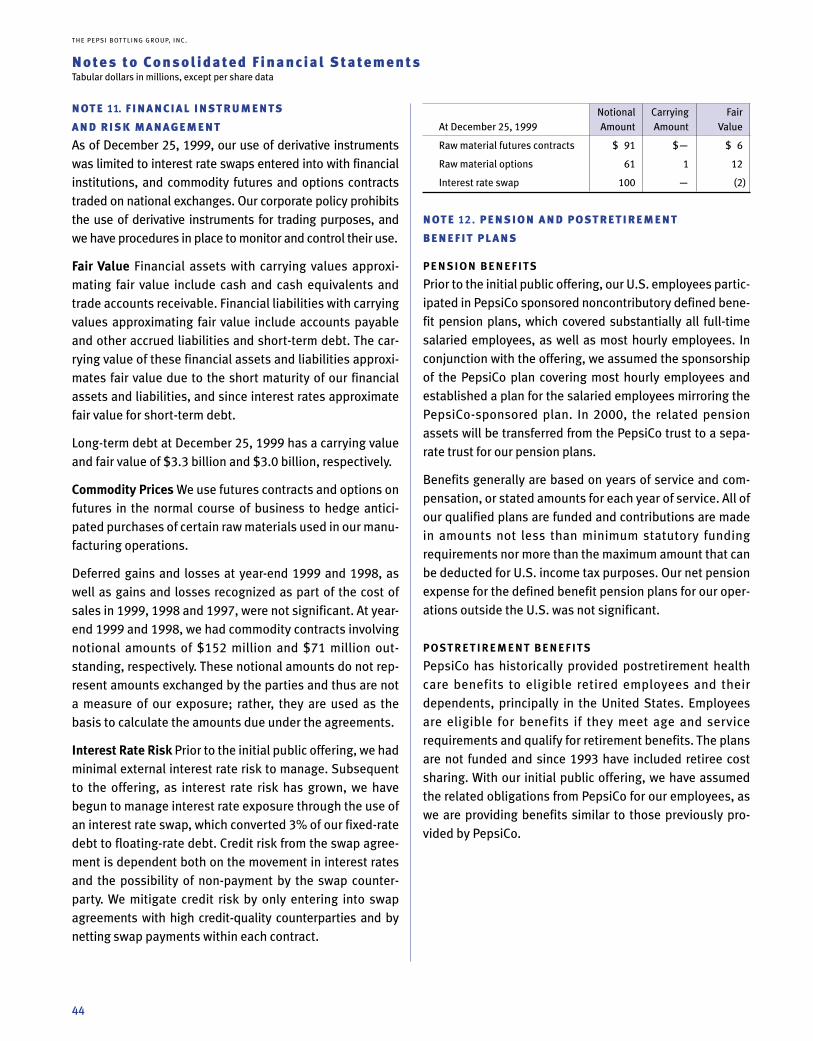
Notional Carrying Fair
At December 25, 1999 Amount Amount Value
Raw material futures contracts $ 91 $— $ 6
Raw material options 61 1 12
Interest rate swap 100 — (2)
NOTE 12. PENSION AND POSTRETIREMENT
BENEFIT PL ANS
PEN SION BENEFITS
Prior to the initial public offering, our U.S. employees partic-
ipated in PepsiCo sponsored noncontributory defined bene-
fit pension plans, which covered substantially all full-time
salaried employees, as well as most hourly employees. In
conjunction with the offering, we assumed the sponsorship
of the PepsiCo plan covering most hourly employees and
established a plan for the salaried employees mirroring the
PepsiCo-sponsored plan. In 2000, the related pension
assets will be transferred from the PepsiCo trust to a sepa-
rate trust for our pension plans.
Benefits generally are based on years of service and com-
pensation, or stated amounts for each year of service. All of
our qualified plans are funded and contributions are made
in amounts not less than minimum statutory funding
requirements nor more than the maximum amount that can
be deducted for U.S. income tax purposes. Our net pension
expense for the defined benefit pension plans for our oper-
ations outside the U.S. was not significant.
POSTRET IREMENT BENEFITS
PepsiCo has historically provided postretirement health
care benefits to eligible retired employees and their
dependents, principally in the United States. Employees
are eligible for benefits if they meet age and service
requirements and qualify for retirement benefits. The plans
are not funded and since 1993 have included retiree cost
sharing. With our initial public offering, we have assumed
the related obligations from PepsiCo for our employees, as
we are providing benefits similar to those previously pro-
vided by PepsiCo.
NOTE 11. FINANCIAL INSTRUMENTS
AND RI SK MANAGEMENT
As of December 25, 1999, our use of derivative instruments
was limited to interest rate swaps entered into with financial
institutions, and commodity futures and options contracts
traded on national exchanges. Our corporate policy prohibits
the use of derivative instruments for trading purposes, and
we have procedures in place to monitor and control their use.
Fair Value Financial assets with carrying values approxi-
mating fair value include cash and cash equivalents and
trade accounts receivable. Financial liabilities with carrying
values approximating fair value include accounts payable
and other accrued liabilities and short-term debt. The car-
rying value of these financial assets and liabilities approxi-
mates fair value due to the short maturity of our financial
assets and liabilities, and since interest rates approximate
fair value for short-term debt.
Long-term debt at December 25, 1999 has a carrying value
and fair value of $3.3 billion and $3.0 billion, respectively.
Commodity Prices We use futures contracts and options on
futures in the normal course of business to hedge antici-
pated purchases of certain raw materials used in our manu-
facturing operations.
Deferred gains and losses at year-end 1999 and 1998, as
well as gains and losses recognized as part of the cost of
sales in 1999, 1998 and 1997, were not significant. At year-
end 1999 and 1998, we had commodity contracts involving
notional amounts of $152 million and $71 million out-
standing, respectively. These notional amounts do not rep-
resent amounts exchanged by the parties and thus are not
a measure of our exposure; rather, they are used as the
basis to calculate the amounts due under the agreements.
Interest Rate Risk Prior to the initial public offering, we had
minimal external interest rate risk to manage. Subsequent
to the offering, as interest rate risk has grown, we have
begun to manage interest rate exposure through the use of
an interest rate swap, which converted 3% of our fixed-rate
debt to floating-rate debt. Credit risk from the swap agree-
ment is dependent both on the movement in interest rates
and the possibility of non-payment by the swap counter-
party. We mitigate credit risk by only entering into swap
agreements with high credit-quality counterparties and by
netting swap payments within each contract.
TH E PE PS I BOTTLI NG G ROUP, I NC.
44
Note s to Cons ol idated Financial Statement sTabular dollars in millions, except per share data

45
1999 Annual Repor t
Components of net periodic benefit costs:
Pension
1999 1998 1997
Service cost $ 30 $ 24 $ 22
Interest cost 42 37 35
Expected return on plan assets (49) (45) (41)
Amortization of transition assets — (2) (4)
Amortization of net loss 4 — —
Amortization of prior service
amendments 5 4 4
Net periodic benefit cost 32 18 16
Settlement loss — 1 —
Net periodic cost including
settlements $ 32 $ 19 $ 16
Components of net periodic benefit costs:
Postretirement
1999 1998 1997
Service cost $ 4 $ 4 $ 3
Interest cost 12 12 15
Expected return on plan assets — — —
Amortization of transition assets — — —
Amortization of net loss — — —
Amortization of prior service
amendments (5) (5) (5)
Net periodic benefit cost 11 11 13
Settlement loss — — —
Net periodic cost including
settlements $ 11 $ 11 $ 13
We amortize prior service costs on a straight-line basis over
the average remaining service period of employees
expected to receive benefits.
Changes in the benefit obligation:
Pension Postretirement
1999 1998 1999 1998
Obligation at
beginning of year $648 $545 $187 $164
Service cost 30 24 4 4
Interest cost 42 37 12 12
Plan amendments 3 5 — —
Actuarial (gain)/loss (57) 78 14 19
Benefit payments (38) (36) (11) (12)
Acquisitions and other 19 — — —
Settlement gain — (5) — —
Obligation at
end of year $647 $648 $206 $187
Changes in the fair value of assets:
Pension Postretirement
1999 1998 1999 1998
Fair value at
beginning of year $541 $602 $ — $ —
Actual return on
plan assets 85 (26) — —
Employer contributions — 5 11 12
Benefit payments (38) (36) (11) (12)
Acquisitions and other 9 — — —
Settlement gain — (4) — —
Fair value at
end of year $597 $541 $ — $ —
Selected information for the plans with accumulated benefitobligations in excess of plan assets:
Pension Postretirement
1999 1998 1999 1998
Projected benefit
obligation $(32) $(648) $(206) $(187)
Accumulated benefit
obligation (12) (575) (206) (187)
Fair value of
plan assets — 541 — —
Funded status recognized on the Consolidated Balance Sheets:
Pension Postretirement
1999 1998 1999 1998
Funded status at
end of year $(50) $(107) $(206) $(187)
Unrecognized prior
service cost 33 34 (17) (22)
Unrecognized
(gain)/loss (14) 84 35 20
Unrecognized
transition asset — (1) — —
Unrecognized special
termination benefits (2) (2) — —
Employer contributions — — 3 —
Net amounts
recognized $(33) $ 8 $(185) $(189)
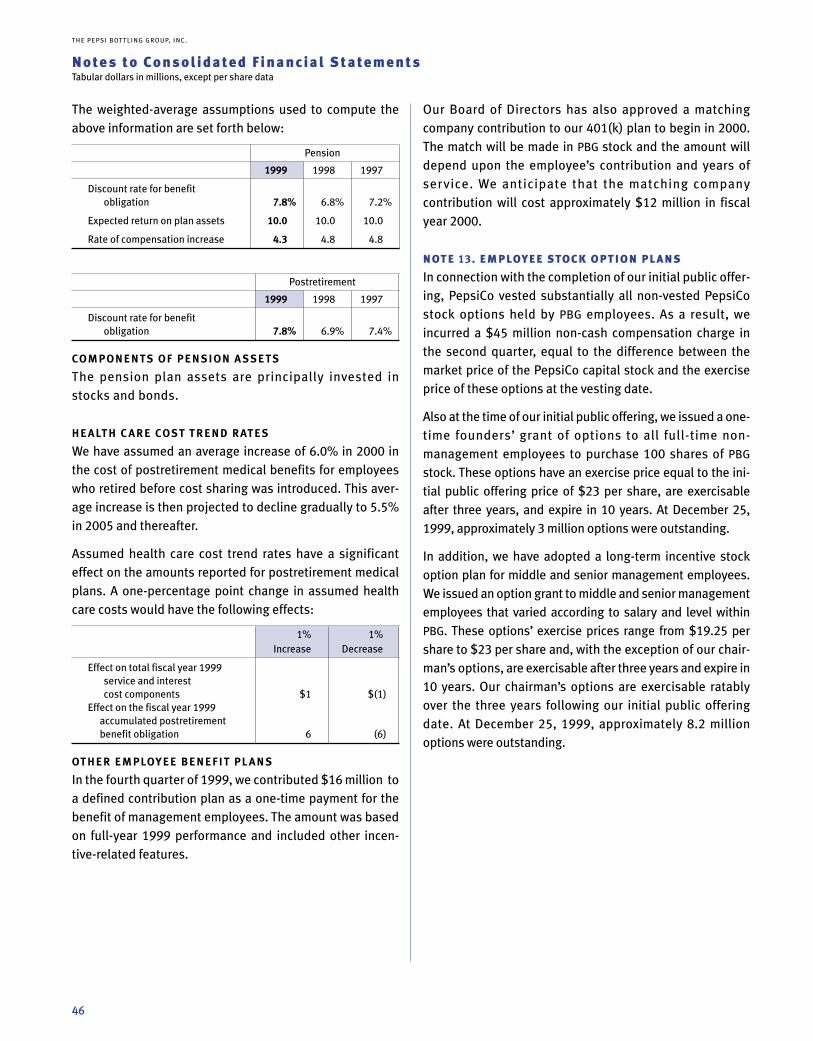
TH E PE PS I BOTTLI NG G ROUP, I NC.
46
Note s to Cons ol idated Financial Statement sTabular dollars in millions, except per share data
Our Board of Directors has also approved a matching
company contribution to our 401(k) plan to begin in 2000.
The match will be made in PBG stock and the amount will
depend upon the employee’s contribution and years of
service. We anticipate that the matching company
contribution will cost approximately $12 million in fiscal
year 2000.
NOTE 13 . EMPLOYEE STOCK OPTION PL ANS
In connection with the completion of our initial public offer-
ing, PepsiCo vested substantially all non-vested PepsiCo
stock options held by PBG employees. As a result, we
incurred a $45 million non-cash compensation charge in
the second quarter, equal to the difference between the
market price of the PepsiCo capital stock and the exercise
price of these options at the vesting date.
Also at the time of our initial public offering, we issued a one-
time founders’ grant of options to all full-time non-
management employees to purchase 100 shares of PBG
stock. These options have an exercise price equal to the ini-
tial public offering price of $23 per share, are exercisable
after three years, and expire in 10 years. At December 25,
1999, approximately 3 million options were outstanding.
In addition, we have adopted a long-term incentive stock
option plan for middle and senior management employees.
We issued an option grant to middle and senior management
employees that varied according to salary and level within
PBG. These options’ exercise prices range from $19.25 per
share to $23 per share and, with the exception of our chair-
man’s options, are exercisable after three years and expire in
10 years. Our chairman’s options are exercisable ratably
over the three years following our initial public offering
date. At December 25, 1999, approximately 8.2 million
options were outstanding.
The weighted-average assumptions used to compute the
above information are set forth below:
Pension
1999 1998 1997
Discount rate for benefit
obligation 7.8% 6.8% 7.2%
Expected return on plan assets 10.0 10.0 10.0
Rate of compensation increase 4.3 4.8 4.8
Postretirement
1999 1998 1997
Discount rate for benefit
obligation 7.8% 6.9% 7.4%
COMPONENTS OF PEN SION A SSETS
The pension plan assets are principally invested in
stocks and bonds.
HE ALTH C ARE COST TREND RATES
We have assumed an average increase of 6.0% in 2000 inthe cost of postretirement medical benefits for employees
who retired before cost sharing was introduced. This aver-
age increase is then projected to decline gradually to 5.5%in 2005 and thereafter.
Assumed health care cost trend rates have a significant
effect on the amounts reported for postretirement medical
plans. A one-percentage point change in assumed health
care costs would have the following effects:
1% 1%Increase Decrease
Effect on total fiscal year 1999service and interest
cost components $1 $(1)Effect on the fiscal year 1999
accumulated postretirement
benefit obligation 6 (6)
OTHER EMPLOYEE BENEFIT PL AN S
In the fourth quarter of 1999, we contributed $16 million to
a defined contribution plan as a one-time payment for the
benefit of management employees. The amount was based
on full-year 1999 performance and included other incen-
tive-related features.

The following table summarizes option activity during 1999:
1999Weighted-
Average
Exercise
Options in millions Options Price
Outstanding at beginning of year — $ —
Granted 12.1 22.98
Exercised — —
Forfeited (0.9) 23.00
Outstanding at end of year 11.2 $22.98
Exercisable at end of year — $ —
Weighted-average fair value of options
granted during the year $10.29
We adopted the disclosure provisions of Statement of
Financial Accounting Standard 123, “Accounting for Stock-
Based Compensation,” but continue to measure stock-based
compensation cost in accordance with the Accounting
Principles Board Opinion 25 and its related interpretations. If
we had measured compensation cost for the stock options
granted to our employees in 1999 under the fair value based
method prescribed by SFAS 123, net income would have been
changed to the pro forma amounts set forth below:
1999
Net Income
Reported $118
Pro forma 102
The fair value of PBG stock options used to compute pro
forma net income disclosures was estimated on the date of
grant using the Black-Scholes option-pricing model based on
the following weighted-average assumptions:
1999
Risk-free interest rate 5.8%
Expected life 7 years
Expected volatility 30%
Expected dividend yield 0.09%
1999 Annual Repor t
47
NOTE 14 . INCOME TA XE S
The details of our income tax provision are set forth below:
1999 1998 1997
Current: Federal $ 79 $(84) $31
Foreign (1) 4 3
State 19 (13) 5
97 (93) 39
Deferred: Federal (17) 45 17
Foreign — (5) (2)
State (10) 7 2
(27) 47 17
$ 70 $(46) $56
Our U.S. and foreign income (loss) before income taxes is
set forth below:
1999 1998 1997
U.S. $188 $ 116 $177
Foreign — (308) (62)
$188 $(192) $115
Our reconciliation of income taxes calculated at the U.S.
federal statutory rate to our provision for income taxes is
set forth below:
1999 1998 1997
Income taxes computed at the
U.S. federal statutory rate 35.0% (35.0)% 35.0%
State income tax, net of
federal tax benefit 3.2 — 4.4
Impact of foreign results (9.1) (12.2) (9.5)
U.S. goodwill and other
nondeductible expenses 7.8 7.5 14.8
U.S. franchise rights tax settlement — (24.0) —
Unusual impairment and
other charges and credits (0.6) 38.7 —
Other, net 1.1 1.0 4.0
Total effective income tax rate 37.4% (24.0)% 48.7%

NOTE 15. GEOGR APHIC DATA
We operate in one industry, carbonated soft drinks and
other ready-to-drink beverages. We do business in
41 states and the District of Columbia in the U.S. Outside
the U.S., we do business in eight Canadian provinces,
Spain, Greece and Russia.
Net Revenues
1999 1998 1997
U.S. $6,352 $5,886 $5,584
Other countries 1,153 1,155 1,008
$7,505 $7,041 $6,592
Long-Lived Assets
1999 1998 1997
U.S. $5,139 $5,024 $4,918
Other countries 987 980 934
$6,126 $6,004 $5,852
We have included in other assets on the Consolidated
Balance Sheets $2 million, $1 million and $64 million of
investments in joint ventures at December 25, 1999,
December 26, 1998 and December 27, 1997, respectively.
Our equity loss in such joint ventures was $0 million,
$5 million and $12 million in 1999, 1998 and 1997, respec-
tively, which is included in selling, delivery and administra-
tive expenses.
NOTE 16. REL ATIONSHIP WITH PEPSICO
At the time of the initial public offering we entered into a num-
ber of agreements with PepsiCo. The most significant agree-
ments that govern our relationship with PepsiCo consist of:
(1) the master bottling agreement for cola beverages bear-
ing the “Pepsi-Cola” and “Pepsi” trademark, including
Pepsi, Diet Pepsi and Pepsi ONE in the United States;
bottling and distribution agreements for non-cola prod-
ucts in the United States, including Mountain Dew; and
a master fountain syrup agreement in the United States;
The details of our 1999 and 1998 deferred tax liabilities
(assets) are set forth below:
1999 1998
Intangible assets and property, plant
and equipment $1,231 $1,252
Other 90 112
Gross deferred tax liabilities 1,321 1,364
Foreign net operating loss carryforwards (132) (123)
Employee benefit obligations (77) (85)
Bad debts (21) (20)
Various liabilities and other (157) (164)
Gross deferred tax assets (387) (392)
Deferred tax asset valuation allowance 147 135
Net deferred tax assets (240) (257)
Net deferred tax liability $1,081 $1,107
Included in:
Prepaid expenses, deferred income taxes
and other current assets $ (97) $ (95)
Deferred income taxes 1,178 1,202
$1,081 $1,107
We have net operating loss carryforwards totaling $465 mil-
lion at December 25, 1999, which are available to reduce
future taxes in Spain, Greece and Russia. Of these carry-
forwards, $37 million expire in 2000 and $428 million
expire at various times between 2001 and 2006. We have
established a full valuation allowance for these net operat-
ing loss carryforwards based upon our projection that these
losses will expire before they can be used.
Our valuation allowances, which reduce deferred tax
assets to an amount that will more likely than not be real-
ized, have increased by $12 million and $55 million in 1999and 1998, respectively.
Amounts paid to taxing authorities for income taxes were
$111 million in 1999. In 1998 and 1997 our allocable share
of income taxes was deemed to have been paid to PepsiCo,
in cash, in the period in which the cost was incurred.
TH E PE PS I BOTTLI NG G ROUP, I NC.
48
Note s to Cons ol idated Financial Statement sTabular dollars in millions, except per share data
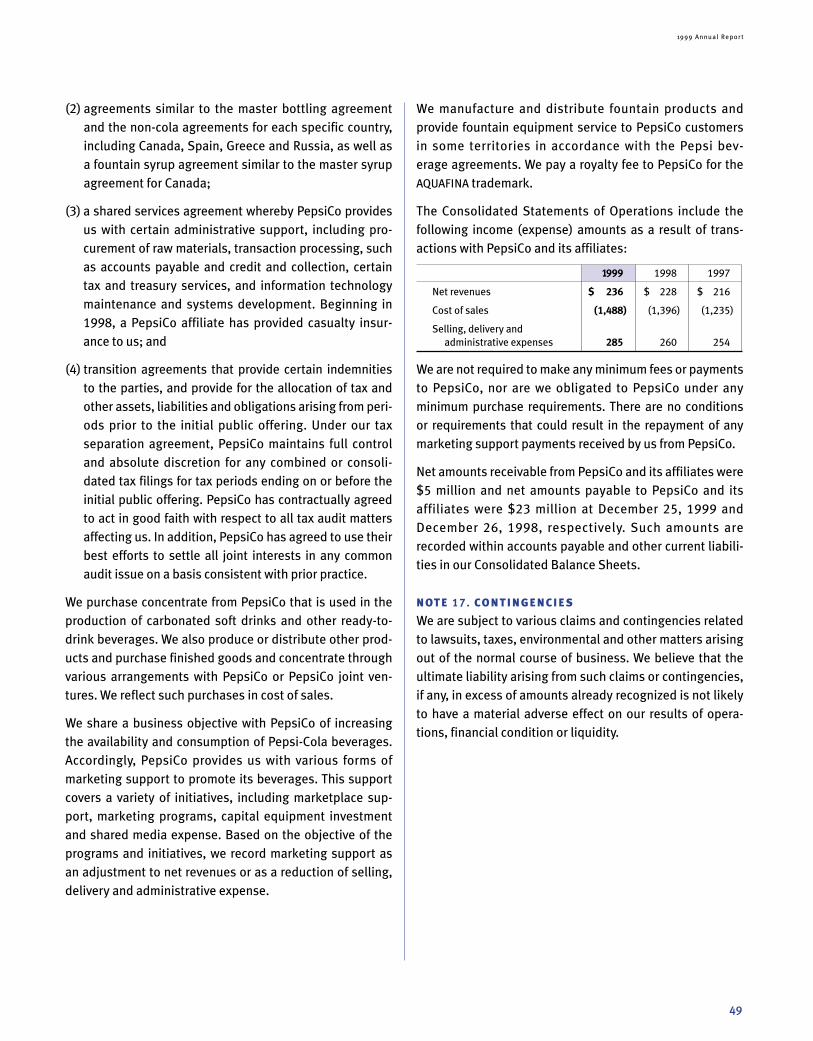
49
1999 Annual Repor t
We manufacture and distribute fountain products and
provide fountain equipment service to PepsiCo customers
in some territories in accordance with the Pepsi bev-
erage agreements. We pay a royalty fee to PepsiCo for the
AQUAFINA trademark.
The Consolidated Statements of Operations include the
following income (expense) amounts as a result of trans-
actions with PepsiCo and its affiliates:
1999 1998 1997
Net revenues $ 236 $ 228 $ 216
Cost of sales (1,488) (1,396) (1,235)
Selling, delivery and
administrative expenses 285 260 254
We are not required to make any minimum fees or payments
to PepsiCo, nor are we obligated to PepsiCo under any
minimum purchase requirements. There are no conditions
or requirements that could result in the repayment of any
marketing support payments received by us from PepsiCo.
Net amounts receivable from PepsiCo and its affiliates were
$5 million and net amounts payable to PepsiCo and its
affiliates were $23 million at December 25, 1999 and
December 26, 1998, respectively. Such amounts are
recorded within accounts payable and other current liabili-
ties in our Consolidated Balance Sheets.
NOTE 17. CONTINGENCIE S
We are subject to various claims and contingencies related
to lawsuits, taxes, environmental and other matters arising
out of the normal course of business. We believe that the
ultimate liability arising from such claims or contingencies,
if any, in excess of amounts already recognized is not likely
to have a material adverse effect on our results of opera-
tions, financial condition or liquidity.
(2) agreements similar to the master bottling agreement
and the non-cola agreements for each specific country,
including Canada, Spain, Greece and Russia, as well as
a fountain syrup agreement similar to the master syrup
agreement for Canada;
(3) a shared services agreement whereby PepsiCo provides
us with certain administrative support, including pro-
curement of raw materials, transaction processing, such
as accounts payable and credit and collection, certain
tax and treasury services, and information technology
maintenance and systems development. Beginning in
1998, a PepsiCo affiliate has provided casualty insur-
ance to us; and
(4) transition agreements that provide certain indemnities
to the parties, and provide for the allocation of tax and
other assets, liabilities and obligations arising from peri-
ods prior to the initial public offering. Under our tax
separation agreement, PepsiCo maintains full control
and absolute discretion for any combined or consoli-
dated tax filings for tax periods ending on or before the
initial public offering. PepsiCo has contractually agreed
to act in good faith with respect to all tax audit matters
affecting us. In addition, PepsiCo has agreed to use their
best efforts to settle all joint interests in any common
audit issue on a basis consistent with prior practice.
We purchase concentrate from PepsiCo that is used in the
production of carbonated soft drinks and other ready-to-
drink beverages. We also produce or distribute other prod-
ucts and purchase finished goods and concentrate through
various arrangements with PepsiCo or PepsiCo joint ven-
tures. We reflect such purchases in cost of sales.
We share a business objective with PepsiCo of increasing
the availability and consumption of Pepsi-Cola beverages.
Accordingly, PepsiCo provides us with various forms of
marketing support to promote its beverages. This support
covers a variety of initiatives, including marketplace sup-
port, marketing programs, capital equipment investment
and shared media expense. Based on the objective of the
programs and initiatives, we record marketing support as
an adjustment to net revenues or as a reduction of selling,
delivery and administrative expense.

NOTE 18 . ACQUI SITIONS
During 1999 and 1998, we acquired the exclusive right to
manufacture, sell and distribute Pepsi-Cola beverages from
several independent PepsiCo franchise bottlers. These acqui-
sitions were accounted for by the purchase method. During
1999, the following acquisitions occurred for an aggregate
purchase price of $185 million in cash and assumed debt:
♦ Jeff Bottling Company, Inc. of New York in January.
♦ Pepsi-Cola General Bottlers of Princeton, Inc. and Pepsi-
Cola General Bottlers of Virginia, Inc. of West Virginia
and Virginia in March.
♦ Pepsi-Cola General Bottlers of St. Petersburg, Russia in
March.
♦ Leader Beverage Corporation of Connecticut in April.
♦ Guillemette & Frère, Ltée. of Québec, Canada in
September.
♦ The Pepsi-Cola Bottling Company of Bainbridge, Inc. of
Georgia in December.
During 1998, the following acquisitions occurred for an
aggregate cash purchase price of $546 million:
♦ The remaining 75% interest in our Russian bottling joint
venture, Pepsi International Bottlers, LLC in February.
♦ Gray Beverages, Inc. of Alberta and British Columbia,
Canada in May.
♦ Pepsi-Cola Allied Bottlers, Inc. of New York and
Connecticut in November.
The 1999 and 1998 aggregate purchase price exceeded the
fair value of net assets acquired, including the resulting tax
effect, by approximately $174 million and $474 million,
respectively. The excess was recorded in intangible assets.
TH E PE PS I BOTTLI NG G ROUP, I NC.
50
Note s to Cons ol idated Financial Statement sTabular dollars in millions, except per share data
The following table presents the unaudited pro forma con-
solidated results of PBG and the acquisitions noted above as
if they had occurred at the beginning of the year in which
they were acquired. The pro forma information does not
necessarily represent what the actual results would have
been for these periods and is not intended to be indicative
of future results.
Unaudited
1999 1998
Pro forma net revenues $7,522 $7,248
Pro forma net income (loss) 117 (135)
Pro forma earnings (loss) per share
(155 million shares) 0.76 (0.87)
NOTE 19 . COMPUTATION OF BA SIC AND DILUTED
EARNING S (LOSS) PER SHARE
shares in thousands 1999 1998 1997
Number of shares on
which basic earnings (loss)
per share is based:
Average outstanding
during period 128,426 55,000 55,000
Add – Incremental
shares under stock
compensation plans — — —
Number of shares on
which diluted
earnings (loss) per share
is based 128,426 55,000 55,000
Basic and diluted net
earnings (loss) applicable
to common
shareholders $ 118 $ (146) $ 59
Basic and diluted
earnings (loss) per share $0.92 $(2.65) $1.07
We issued a one-time founders’ grant of options in connec-
tion with our initial public offering to all non-management
employees to purchase 100 shares of PBG common stock.
We also issued options during the second quarter to all
management employees as part of our long-term
incentive plan.
In October, our Board of Directors authorized the repur-
chase of up to 10 million shares of our common stock. As of
December 25, 1999, we made net repurchases of approxi-
mately 5.3 million shares.
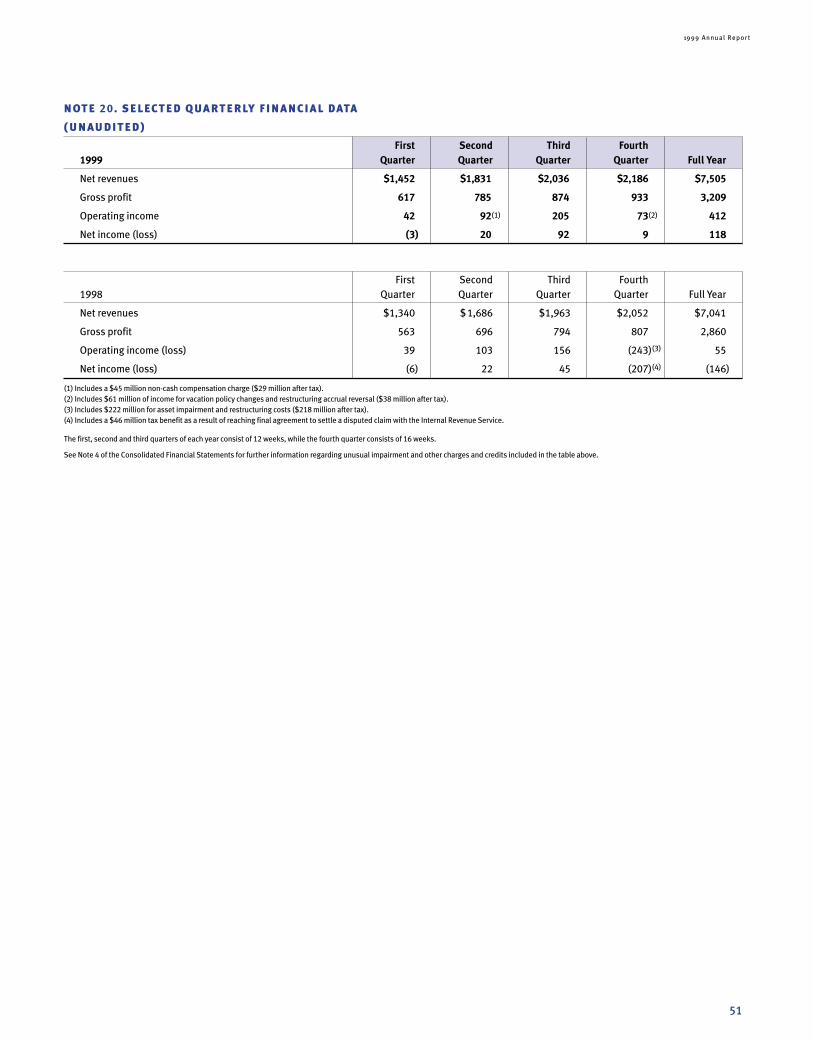
1999 Annual Repor t
51
First Second Third Fourth
1999 Quarter Quarter Quarter Quarter Full Year
Net revenues $1,452 $1,831 $2,036 $2,186 $7,505
Gross profit 617 785 874 933 3,209
Operating income 42 92(1) 205 73(2) 412
Net income (loss) (3) 20 92 9 118
First Second Third Fourth
1998 Quarter Quarter Quarter Quarter Full Year
Net revenues $1,340 $1,686 $1,963 $2,052 $7,041
Gross profit 563 696 794 807 2,860
Operating income (loss) 39 103 156 (243)(3) 55
Net income (loss) (6) 22 45 (207)(4) (146)
(1) Includes a $45 million non-cash compensation charge ($29 million after tax).
(2) Includes $61 million of income for vacation policy changes and restructuring accrual reversal ($38 million after tax).
(3) Includes $222 million for asset impairment and restructuring costs ($218 million after tax).
(4) Includes a $46 million tax benefit as a result of reaching final agreement to settle a disputed claim with the Internal Revenue Service.
The first, second and third quarters of each year consist of 12 weeks, while the fourth quarter consists of 16 weeks.
See Note 4 of the Consolidated Financial Statements for further information regarding unusual impairment and other charges and credits included in the table above.
NOTE 20 . SELECTED QUARTERLY FINANCIAL DATA
(UNAUDITED)

52
To Our Shareholders:
We are responsible for the preparation, integrity and fair presentation of the Consolidated
Financial Statements, related notes and other information included in this annual report. The
Consolidated Financial Statements were prepared in accordance with generally accepted
accounting principles and include certain amounts based upon our estimates and assumptions,
as required. Other financial information presented in the annual report is derived from the
Consolidated Financial Statements.
We maintain a system of internal control over financial reporting, designed to provide reasonable
assurance as to the reliability of the Consolidated Financial Statements, as well as to safeguard
assets from unauthorized use or disposition. The system is supported by formal policies and proce-
dures, including an active Code of Conduct program intended to ensure employees adhere to the
highest standards of personal and professional integrity. Our internal audit function monitors and
reports on the adequacy of and compliance with the internal control system, and appropriate actions
are taken to address significant control deficiencies and other opportunities for improving the sys-
tem as they are identified.
The Consolidated Financial Statements have been audited and reported on by our independent
auditors, KPMG LLP, who were given free access to all financial records and related data, including
minutes of the meetings of the Board of Directors and Committees of the Board. We believe that
management representations made to the independent auditors were valid and appropriate.
The Audit Committee of the Board of Directors, which is composed solely of outside directors,
provides oversight to our financial reporting process and our controls to safeguard assets
through periodic meetings with our independent auditors, internal auditors and management.
Both our independent auditors and internal auditors have free access to the Audit Committee.
Although no cost-effective internal control system will preclude all errors and irregularities, we
believe our controls as of December 25, 1999 provide reasonable assurance that our assets are
safeguarded.
John T. Cahill Peter A. Bridgman
Executive Vice President Senior Vice President
and Chief Financial Officer and Controller
TH E PE PS I BOTTLI NG G ROUP, I NC.
Management’s Re sponsibi l i ty forFinancial Statement s
53
1999 Annual Repor t
Repor t of Independent Auditors
Board of Directors and Shareholders
The Pepsi Bottling Group, Inc.
We have audited the accompanying Consolidated Balance Sheets of The Pepsi Bottling Group,
Inc. as of December 25, 1999 and December 26, 1998 and the related Consolidated Statements
of Operations, Cash Flows and Changes in Shareholders’ Equity for each of the fiscal years in the
three-year period ended December 25, 1999. These Consolidated Financial Statements are the
responsibility of management of The Pepsi Bottling Group, Inc. Our responsibility is to express an
opinion on these Consolidated Financial Statements based on our audits.
We conducted our audits in accordance with generally accepted auditing standards. Those stan-
dards require that we plan and perform the audit to obtain reasonable assurance about whether
the financial statements are free of material misstatement. An audit includes examining, on a test
basis, evidence supporting the amounts and disclosures in the financial statements. An audit
also includes assessing the accounting principles used and significant estimates made by man-
agement, as well as evaluating the overall financial statement presentation. We believe that our
audits provide a reasonable basis for our opinion.
In our opinion, the Consolidated Financial Statements referred to above present fairly, in all mate-
rial respects, the financial position of The Pepsi Bottling Group, Inc. as of December 25, 1999 and
December 26, 1998, and the results of its operations and its cash flows for each of the fiscal years
in the three-year period ended December 25, 1999, in conformity with generally accepted
accounting principles.
New York, New York
January 25, 2000

TH E PE PS I BOTTLI NG G ROUP, I NC.
54
Fiscal years ended 1999 1998 1997 1996 1995
Statement of Operat ions Data:
Net revenues $7,505 $7,041 $6,592 $6,603 $6,393Cost of sales 4,296 4,181 3,832 3,844 3,771Gross profit 3,209 2,860 2,760 2,759 2,622Selling, delivery and administrative expenses 2,813 2,583 2,425 2,392 2,273Unusual impairment and other charges and credits(1) (16) 222 – – –Operating income 412 55 335 367 349Interest expense, net 202 221 222 225 239Foreign currency loss (gain) 1 26 (2) 4 –Minority interest 21 – – – –Income (loss) before income taxes 188 (192) 115 138 110Income tax expense (benefit)(2) 70 (46) 56 89 71Net income (loss) $ 118 $ (146) $ 59 $ 49 $ 39
Per Share Data:
Basic and diluted earnings (loss) per share $ 0.92 $ (2.65) $ 1.07 $ 0.89 $ 0.71Cash dividend per share $ 0.06 – – – –Weighted-average basic and diluted shares outstanding 128 55 55 55 55
Other F inancial Data:
EBITDA(3) $ 901 $ 721 $ 774 $ 792 $ 767Cash provided by operations 718 625 548 451 431Capital expenditures (560) (507) (472) (418) (358)
Balance Sheet Data (at per iod end):
Total assets $7,619 $7,322 $7,188 $7,052 $7,082Long-term debt:
Allocation of PepsiCo long-term debt – 3,300 3,300 3,300 3,300Due to third parties 3,268 61 96 127 131
Total long-term debt 3,268 3,361 3,396 3,427 3,431Minority interest 278 – – – –Advances from PepsiCo – 1,605 1,403 1,162 1,251Accumulated other comprehensive loss (223) (238) (184) (102) (66)Shareholders’ equity (deficit) 1,563 (238) (184) (102) (66)
(1) Unusual impairment and other charges and credits is comprised of the following:
• $45 million non-cash compensation charge in the second quarter of 1999.
• $53 million vacation accrual reversal in the fourth quarter of 1999.
• $8 million restructuring reserve reversal in the fourth quarter of 1999.
• $222 million charge related to the restructuring of our Russian bottling operations and the separation of Pepsi-Cola North America’s concentrate and bottling organizations in the fourth quarter of 1998.
(2) 1998 includes a $46 million income tax benefit in the fourth quarter for the settlement of a disputed claim with the Internal Revenue Service relating to the deductibility of the amortization of acquired
franchise rights.
(3) Excludes the non-cash component of unusual impairment and other charges and credits.
Sele cted Financial and Operat ing Data(in millions, except per share data)

1999 Annual Repor t
55
The Pepsi Bott l ing Group Senior Management Team
Peter A. Bridgman
Senior Vice President and Controller
14 years
John T. Cahill
Executive Vice President and Chief Financial Officer
10 years
Robert W. Cameron
Business Unit General Manager, Texoma
14 years
L. Kevin Cox
Senior Vice President and Chief Personnel Officer
10 years
Shawn E. Dunn
Senior Vice President, Finance
9 years
Eric J. Foss
Senior Vice President, U.S. Sales and Field Operations
17 years
Christopher D. Furman
Business Unit General Manager, Southern California
13 years
Scott J. Gillesby
Business Unit General Manager, Central
18 years
James Keown
Business Unit General Manager, Southeast
24 years
Robert C. King
Vice President, National Sales and Field Marketing
10 years
Harrald F. Kroeker
Business Unit General Manager, Mid-Atlantic
14 years
Linda A. Kuga
President, PBG Canada
18 years
Christopher S. Langhoff
Vice President and Treasurer
10 years
Pamela C. McGuire
Senior Vice President, General Counsel and Secretary
22 years
Yiannis Petrides
Business Unit General Manager, Spain/Greece
12 years
Eric W. Reinhard
Business Unit General Manager, Great West
16 years
William L. Robinson
Business Unit General Manager, Pacific Northwest
15 years
Barry J. Shea
Business Unit General Manager, Russia
23 years
Paul T. Snell
Business Unit General Manager, Northeast
23 years
Gary K. Wandschneider
Senior Vice President, Operations
18 years
Craig E. Weatherup
Chairman and Chief Executive Officer
25 years
TH E PE PS I BOTTLI NG G ROUP, I NC.
56
TH E PE PS I BOTTLI NG G ROUP, I NC.
Shareholder Information
CORPORATE HE ADQUARTER S
The Pepsi Bottling Group, Inc.
1 Pepsi Way
Somers, New York 10589(914) 767-6000
ANNUAL MEET ING
The annual meeting of shareholders will be held at
10:00 a.m., Wednesday, May 24, 2000, at PBG head-
quarters in Somers, New York.
TRAN SFER AGENT
For services regarding your account such as change of
address, replacement of lost stock certificates or divi-
dend checks, direct deposit of dividends, or change in
registered ownership, contact:
The Bank of New York
Shareholder Services Dept.
P.O. Box 11258Church Street Station
New York, New York 10286-1258
Telephone: (800) 432-0140E-mail: [email protected]
Web site: http://stock.bankofny.com
Or
The Pepsi Bottling Group, Inc.
Shareholder Relations Coordinator
1 Pepsi Way
Somers, New York 10589Telephone: (914) 767-6339
In all correspondence or telephone inquiries, please
mention PBG, your name as printed on your stock certifi-
cate, your Social Security number, your address and
telephone number.
STOCK E XCHANGE LIST ING
Common shares (symbol: PBG) are traded on the
New York Stock Exchange.
INDEPENDENT PUBLIC ACCOUNTANTS
KPMG LLP
345 Park Avenue
New York, New York 10154
INVESTOR REL AT ION S
PBG’s 2000 quarterly releases are expected to be issued
the weeks of April 3, July 10 and October 2, 2000 and
January 22, 2001.
Earnings and other financial results, corporate news and
other company information are available on PBG’s web-
site: http://www.pbg.com
Investors desiring further information about PBG should
contact the Investor Relations department at corporate
headquarters at (914) 767-6339.
Printed on recycled paper.
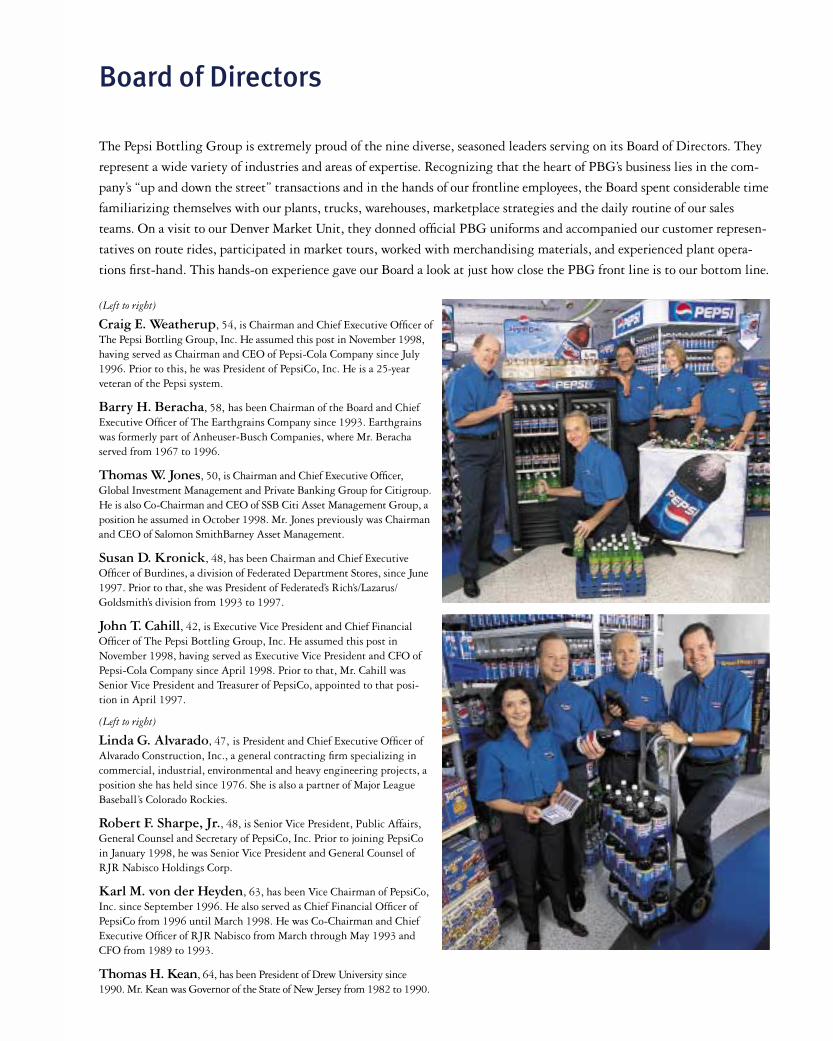
Board of Directors
The Pepsi Bottling Group is extremely proud of the nine diverse, seasoned leaders serving on its Board of Directors. They
represent a wide variety of industries and areas of expertise. Recognizing that the heart of PBG’s business lies in the com-
pany’s “up and down the street” transactions and in the hands of our frontline employees, the Board spent considerable time
familiarizing themselves with our plants, trucks, warehouses, marketplace strategies and the daily routine of our sales
teams. On a visit to our Denver Market Unit, they donned official PBG uniforms and accompanied our customer represen-
tatives on route rides, participated in market tours, worked with merchandising materials, and experienced plant opera-
tions first-hand. This hands-on experience gave our Board a look at just how close the PBG front line is to our bottom line.
(Left to right)
Craig E. Weatherup, 54, is Chairman and Chief Executive Officer ofThe Pepsi Bottling Group, Inc. He assumed this post in November 1998,having served as Chairman and CEO of Pepsi-Cola Company since July1996. Prior to this, he was President of PepsiCo, Inc. He is a 25-yearveteran of the Pepsi system.
Barry H. Beracha, 58, has been Chairman of the Board and ChiefExecutive Officer of The Earthgrains Company since 1993. Earthgrainswas formerly part of Anheuser-Busch Companies, where Mr. Berachaserved from 1967 to 1996.
Thomas W. Jones, 50, is Chairman and Chief Executive Officer,Global Investment Management and Private Banking Group for Citigroup.He is also Co-Chairman and CEO of SSB Citi Asset Management Group, aposition he assumed in October 1998. Mr. Jones previously was Chairmanand CEO of Salomon SmithBarney Asset Management.
Susan D. Kronick, 48, has been Chairman and Chief ExecutiveOfficer of Burdines, a division of Federated Department Stores, since June1997. Prior to that, she was President of Federated’s Rich’s/Lazarus/Goldsmith’s division from 1993 to 1997.
John T. Cahill, 42, is Executive Vice President and Chief FinancialOfficer of The Pepsi Bottling Group, Inc. He assumed this post inNovember 1998, having served as Executive Vice President and CFO ofPepsi-Cola Company since April 1998. Prior to that, Mr. Cahill wasSenior Vice President and Treasurer of PepsiCo, appointed to that posi-tion in April 1997.
(Left to right)
Linda G. Alvarado, 47, is President and Chief Executive Officer ofAlvarado Construction, Inc., a general contracting firm specializing incommercial, industrial, environmental and heavy engineering projects, aposition she has held since 1976. She is also a partner of Major LeagueBaseball’s Colorado Rockies.
Robert F. Sharpe, Jr., 48, is Senior Vice President, Public Affairs,General Counsel and Secretary of PepsiCo, Inc. Prior to joining PepsiCoin January 1998, he was Senior Vice President and General Counsel ofRJR Nabisco Holdings Corp.
Karl M. von der Heyden, 63, has been Vice Chairman of PepsiCo,Inc. since September 1996. He also served as Chief Financial Officer ofPepsiCo from 1996 until March 1998. He was Co-Chairman and ChiefExecutive Officer of RJR Nabisco from March through May 1993 andCFO from 1989 to 1993.
Thomas H. Kean, 64, has been President of Drew University since1990. Mr. Kean was Governor of the State of New Jersey from 1982 to 1990.
Financial Highlights
Net Revenues $7,505 $7,041 7%
Operating Income (1) $ 396 $ 277 43%
EBITDA(1) $ 901 $ 721 25%
EPS (1)(2) $ 0.71 $ 0.17 318%
Operating Cash Flow (3) $ 161 $ 125 29%
Capital Spending $ 560 $ 507 10%
(1) Excludes the impact of unusual impairment and other charges and credits.
(2) Reflects the initial public offering of 100 million shares of common stock on March 31, 1999 as if the shares
were outstanding during the entire periods presented. The 1999 results also reflect the impact of our share
repurchase program, which began in October.
(3) Operating Cash Flow is defined as net cash provided by operations less net cash used for investments,
excluding cash used for acquisitions of bottlers and investments in affiliates.
$ in millions, except per share data 1999 1998 Change
Table of Contents
Letter to Shareholders 1Our Mission 3Our Brands 4Our System 6Our Partnerships 12Our Growth Story 16Glossary 24Our Financial Review 25Senior Management Team 55Shareholder Information 56Board of Directors Inside Back Cover

The Pepsi Bottling Group, Inc. Our first annual report
1999
The Pepsi Bottling Group, Inc.1 Pepsi WaySomers, New York 10589
Th
e P
ep
si B
ottlin
g G
rou
p, In
c. An
nu
al R
ep
ort 19
99