the pennsylvania state university - lucy song,...
TRANSCRIPT

THE PENNSYLVANIA STATE UNIVERSITY
SCHREYER HONORS COLLEGE
SCHOOL OF HOSPITALITY MANAGEMENT
THE IMPACT OF A NUTRITIOUS CAFETERIA ON EMPLOYEE ATTITUDES
LUCY J. SONG
Spring 2014
A thesis
submitted in partial fulfillment
of the requirements
for baccalaureate degrees in Hotel, Restaurant, and Institutional Management and
Nutritional Sciences
with honors in Hotel, Restaurant, and Institutional Management
Reviewed and approved* by the following:
Larry Martinez
Assistant Professor of Hospitality Management
Thesis Supervisor
Breffni Noone
Associate Professor of Hospitality Management
Honors Adviser
* Signatures are on file in the Schreyer Honors College.

i
ABSTRACT
In the past few decades, workplace health promotion has become increasingly popular
because it has been shown to have benefits not only for employee health, but also for
organizations by decreasing health care and turnover costs and increasing positive employee
attitudes and behaviors. Health promotion programs include a variety of different interventions
that range from environmental modifications in the employee cafeteria and fitness facility to
providing health education, counseling and other services to employees. A randomized survey of
200 college students and working adults revealed that participants who evaluated a healthy
employee cafeteria reported higher job satisfaction, person-organization fit, perceived
organizational support, energy levels, and lower turnover intention than participants who
evaluated an unhealthy employee cafeterias. Based on these results, organizations can consider
offering a healthy cafeteria as a method of boosting positive employee attitudes and lowering
employee turnover.

ii
TABLE OF CONTENTS
List of Figures .......................................................................................................................... iii
List of Tables ........................................................................................................................... iv
Acknowledgements .................................................................................................................. v
Chapter 1 Introduction and Literature Review ........................................................................ 1
Chapter 2 Pilot Study ............................................................................................................... 10
Chapter 3 Methods ................................................................................................................... 12
Chapter 4 Results ..................................................................................................................... 16
Chapter 5 Discussion ............................................................................................................... 21
Appendix A Participant Surveys ..................................................................................... 23 Appendix B Survey Key ................................................................................................. 28 References ........................................................................................................................ 30
iii
LIST OF FIGURES
Figure 1: Means and standard errors for Job Satisfaction ........................................................ 17
Figure 2: Means and standard errors for Energy ...................................................................... 17
Figure 3: Means and standard errors for PO Fit ....................................................................... 18
Figure 4: Means and standard errors for POS .......................................................................... 18
Figure 5: Means and standard errors for Turnover Intention ................................................... 19

iv
LIST OF TABLES
Table 1: Means, standard deviations, reliabilities, and inter-correlations among study
constructs ......................................................................................................................... 16
Table 2: Results of UNIANOVA tests on study constructs ..................................................... 19
Table 3: Results of a MANOVA analysis using all five dependent variables ......................... 20

v
ACKNOWLEDGEMENTS
First and foremost, I would like to thank my thesis advisor, Dr. Larry Martinez, for being
incredibly helpful and supportive through the process of writing this thesis. He always made
himself available to help me and made great suggestions to improve my ideas. This thesis would
not have been possible without him. I would also like to thank Dr. Andy Mowen for teaching me
all about how to develop a thesis topic in his RPTM 530 (Research Methods) class.
Another person I would like to thank is my honors adviser, Dr. Breffni Noone, for her
continual guidance and advice in shaping my academic path. Dr. Albert Bartlett has also been a
source of encouragement throughout my time as an HRIM student.
Finally, I would like to thank my parents, Chunshan Song and Lu Sun, for always
supporting me and believing in me.

1
Chapter 1
Introduction and Literature Review
What is Workplace Health Promotion?
Workplace health promotion consists of the various programs and efforts that employers
make to care for the physical and psychosocial wellbeing of their employees. These programs
serve to prevent health problems on three levels. Primary intervention involves helping healthy
individuals to remain healthy by encouraging lifestyle changes to avoid developing health
problems. Secondary intervention targets people who are more prone to certain diseases and uses
screening and other monitoring procedures to track the development of health problems. Finally,
tertiary intervention—or disease management—involves helping people who have already
developed illnesses to recover (Goetzel, 2008).
Benefits of Workplace Health Promotion
In the past few decades, workplace health promotion has become increasingly popular
because it has been shown to have benefits not only to employee health, but also for the
organization by decreasing health care and turnover costs and increasing productivity, employee
morale, and company loyalty (Goetzel, 2008). Though it used to be viewed as a nice perk
affordable by a successful company, evidence has shown that it can have tremendous return on
investment for companies of all sizes. For example, H-E-B Company has found that their health
promotion program yields return on investment of 6 to 1. Moreover, a 2009 study by Dr. Ronald
Loeppke and colleagues of 50,000 employees in 10 companies showed that costs due to lost

2
productivity were 2.3 times higher than the medical and pharmacy costs that employers paid for
employee benefits. This statistic also further illustrates the importance of measuring not only
absenteeism, but also presenteeism—when people are present at work but don’t perform well due
to stress, fatigue, or health conditions (Berry, 2010). Health promotion programs have also been
shown to decrease absenteeism. A large study conducted in 1990 of 29,315 blue collar workers
showed that having a health promotion program decreased absenteeism by 10.4% in the first year
and 14% in the second year of having the program.
Another benefit of health promotion programs in the workplace is that it increases
employee morale. Studies have shown that increased pride in the organization is positively
correlated to job satisfaction and more positive employee behaviors. The cumulative effect of
positive behavior among employees in turn causes more workplace pride and satisfaction, which
continues the cycle of increasing positive employee behavior (Arnett, 2002).
Employee health programs are also an important component of hospitality. Hospitality is
all about taking good care of guests and ensuring that they have an enriching experience. In the
workplace, employees are considered internal customers, and this idea has significant
implications in the hospitality industry because only when employees are well taken care of can
they in turn provide pleasant experiences to external guests. This concept is known as internal
marketing, and research has shown that it can decrease turnover, increase job satisfaction, and
increase service quality (Taylor, 1997). Employees that have a positive opinion of their
workplace are more likely to provide exceptional service to guests. (Arnett, 2002). Thus, taking
good care of employees is not only the right thing to do, but is also a sound business decision.

3
Components of a Good Health Promotion Program
At the core of health promotion programs is the drive to increase employee wellbeing,
but much controversy surrounds the question of whether or not to develop such programs. Some
employers feel that health promotion at the workplace interferes with the personal lifestyle
choices of employees and is not aligned with the company mission. Others are reluctant to begin
such programs due to delayed or lost return on investment. Health promotion programs are costly
to implement and companies often do not experience a positive return on investment for at least
one year and more likely two to three years (Serxner, 2009).
Regardless of the motive, it is important to note that not all health promotion programs
experience the aforementioned benefits to the company and employee. There is a wide array of
options that health promotion program developers can explore in designing these programs. In
each industry, there are employees of varying ages, genders, backgrounds, and attitudes toward
health. It would be unwise to assume that all employees will respond the same way to a particular
health promotion initiative. In fact, employee responses to health promotion programs can be
very complex and diverse depending on the needs of each individual person (Zoller, 2004). As a
result, it is important to customize health programs to the target employee groups rather than
assume a homogenous workforce across companies and geographical areas. Moreover, not all
employees willingly embrace health promotion initiatives. Just as some people highly value
eating a healthy diet and exercising, others simply do not value taking care of their health as
much.
In order to have an effective health promotion program, employees must see the value of
these programs in the context of their lifestyles. This can be facilitated by fostering an internal
culture of concern for personal health in the company (Harden, 1999). Health promotion
programs will not be effective if employees are not willing to participate in them. Thus, it is
important to obtain employee input in program development and doing so will help employees to

4
take ownership of the program and also increase its long-term sustainability. Harden (1998)
suggests that it is important for top management to be visible and enthusiastic in their support of
the program. There should also be involvement of employees at all levels of planning, and
implementation, and these employees will also serve as internal proponents in promoting the
program. Finally, interventions should be tailored to the specific needs of the employees. Other
studies echo these concepts by demonstrating that workplace health promotion programs are more
effective when both internal and external influences are addressed. Programs that focus solely on
individual behavior are less likely to yield results than programs that address both individual
behavior and the workplace environment for promoting health (Shain, 2004). Furthermore, it has
been found that programs that address holistic wellness affect job satisfaction more than
programs that only address physical health (Connolly, 2003).
Examples of Health Promotion Programs
Health promotion programs can vary in a number of ways. Some are very intensive and
address both psychosocial and physical wellness in multi-initiative programs. Others can be as
simple as using monetary incentives to encourage healthy behavior such as going to the doctor for
a physical exam. Some companies utilize programs that focus on environmental modifications
such as offering nutritious food in employee cafeterias or a fitness center with various fitness
classes to employees. It is thought that providing access to healthy foods will increase
consumption of these foods by employees (Blank, 2007). An increasing trend in health promotion
programs is to offer onsite medical care. The Statistical Analysis System (SAS) Institute, for
example, operates its own full-service health care center for employees and their families. By
having its own practice, SAS is able to offer free health care to its employees and actually saves
$1.50 for each dollar it would have spent on external health care (Berry, 2012).

5
Problem of Turnover
As previously stated, one of the biggest benefits of health promotion programs is they
reduce employee turnover. Traditionally, the hotel industry has always experienced an
abnormally high turnover rate compared to other industries. In fact, the term “turnover culture”
has been coined to describe this phenomenon. This culture is characterized by a general
acceptance of turnover as a normal phenomenon in the workplace and is detrimental to the
fulfillment of organizational objectives since employees are not as committed (Iverson, 2007).
Having such a culture suggests the lack of proper management techniques and organizational
support systems in place to retain happy employees, and the presence of a turnover culture is a
key factor in determining an employee’s intention to leave the company (Deery, 1999).
Having high turnover rates is a problem because employee turnover is strongly associated
with decreased hotel profits, especially at larger properties (Simons, 2001). Retaining highly
educated employees is a challenge for hotel organizations and the turnover of these employees
lead to higher staffing costs because it takes time and labor—thus money—to train new
employees. Moreover, potential profits that would have been earned if tasks were not delayed to
allow for training are lost. In fact, lost productivity usually accounts for 50 percent of turnover
expense (Walsh, 2007). Other intangible, but significant consequences include the erosion of the
company knowledge base and decrease in organizational competencies (Blomme, 2010). It is
difficult for a company to grow if experienced managers keep leaving and are replaced with
newer, less experienced ones that do not have the expertise of managing within the company’s
unique culture. For line level employees, the process of transitioning to new supervisors and
managers can also be stressful and cause conflict if managing styles are different. Occupational
stress is one important factor that causes employee turnover (Blomme, 2010), so turnover of
managers can also lead to turnover of line level employees.
6
In an effort to understand the causes of turnover, one study found that workplace
flexibility and organizational support are inversely related to turnover intention (Blomme, 2010).
In other words, employees desire to work for a company that will give them flexibility on the job
as well as support their well-being and socioemotional needs. They want to know that their
employers care about their personal wellbeing and the wellbeing of their families, and when
employers can demonstrate that they do, employees develop positive feelings toward their
employer and thus, company loyalty increases (Blomme, 2010). For example, a Burger King
franchisee found that its number one most promising demographic for new employees was young
mothers, and the top concern of these young mothers was childcare. In response, this Burger King
franchisee decided to offer free childcare services to its employees and as a result, experienced
much lower turnover than Burger Kings that did not offer these services (Bonn, 1992).
Study Purpose
The purpose of this study is to investigate one type of health promotion program—the
environmental modification of offering a nutritious cafeteria— and measure its effects on the
following employee job attitudes: turnover intention, organizational commitment, job satisfaction,
stress, perceived organizational support (POS), energy, and person-organization fit (PO Fit).
According to Tett & Meyer’s (1993) meta-analysis, turnover intention, organizational
commitment, and job satisfaction all strongly predict turnover. Of these three, turnover intention
is most strongly correlated, followed by organizational commitment. Job satisfaction is negatively
correlated with turnover to a lesser degree. Another study also asserts that there is a significant
and consistent relationship between job satisfaction and turnover, but that it is not particularly
strong because there are other factors that mediate this relationship (Mobley, 1977). Some of
these other factors include the following variables being studied.

7
There is significant evidence indicating that POS is negatively correlated with both
turnover intention and actual turnover (Allen, 2003). This relationship is also mediated by job
satisfaction and organizational commitment. Similarly, job satisfaction also mediates the
relationship between stress and turnover, such that stress leads to absenteeism and is positively
correlated with turnover (Gupta, 1979). From these examples, it is evident that the relationships
between these employee job attitudes are often interrelated and complex. Thus, it is important to
study them as a group rather than individually because studying a single variable may not
completely explain its relationship with turnover. Allen (2003) also suggests that the results
indicate that there is an inherent relationship between how employees perceive the human
resource (HR) practices of their company and their intentions to withdraw or quit. This does not
necessarily indicate that HR practices such as implementing a health promotion program have a
direct effect on employee turnover intention, but rather that such HR practices help employees to
feel more support and care from their organizations, which in turn increase their positive feelings
for the company and encourage them to remain with the organization. As such, it has been shown
that POS is positively correlated with job satisfaction, positive mood, affective organizational
commitment, and lessened withdrawal behavior such as turnover (Rhoades, 2002).
In this study, “Energy” is defined as bursting with energy, feeling strong and vigorous,
and being excited to go to work. Pelled’s (1999) study defines positive affect (PA) in a similar
manner as “active, elated, and enthusiastic”. This study found that PA was significantly and
negatively correlated with absenteeism, and that negative affect (NA) was significantly and
positively correlated with absenteeism and turnover. From these results, it can be inferred that
energy levels will also be negatively related to turnover.
The last variable being studied is PO Fit. Independent of age, gender, or tenure, PO Fit
has been shown to be positively correlated with normative organizational commitment and job

8
satisfaction and negatively correlated with turnover intention. In fact, high PO Fit at time of hire
has been associated with both PA and decreased turnover intention one year later. It is also
predictive of actual turnover, which increases in employees with lower PO Fit (O’Reilly, 1991).
There is an ample amount of literature on the effects of employee health promotion
programs in other industries, but there is very little literature available on their effects in
industries with traditionally higher turnover rates, such as the hospitality industry. In the case of
Rosen Hotels & Resorts, the presence of its extensive onsite medical program has greatly
corresponded with reduced turnover, but it is unclear if such results would be present across
different types of employee health programs (Berry, 2007).
In an effort to understand the effect of health promotion programs on turnover intention,
this study will investigate one aspect of workplace wellness programs: a nutritious employee
cafeteria. This is important for hospitality companies to understand because currently, many
young and talented managers are leaving the industry within just one to two years of graduation
and companies want to be able to attract and retain their highly educated workforce (Walsh,
2007). Furthermore, research shows that turnover is closely related to recruitment and retention
and that having desirable employee programs helps to retain employees (Bonn, 1992).
Hypotheses
H1: Healthy food will be rated higher than the Control condition with respect to job satisfaction
(H1a), energy (H1b), organizational commitment (H1c), POS (H1d), PO Fit (H1e) and lower with
respect to turnover intentions (H1f) and stress (H1g).
H2: Healthy food will be rated higher than the Unhealthy condition with respect to job
satisfaction (H2a), energy (H2b), organizational commitment (H2c), POS (H2d), PO Fit (H2e)
and lower with respect to turnover intentions (H2f) and stress (H2g).

9
H3: Unhealthy food will be rated lower than the Control condition with respect to job satisfaction
(H3a), energy (H3b), organizational commitment (H3c), POS (H3d), PO Fit (H3e) and higher
with respect to turnover intentions (H3f) and stress (H3g).

10
Chapter 2
Pilot Study
Methods and Participants
Participants were recruited via a popular social networking site. There were a total of 93
individuals that participated in this research. Of these, 4 were removed because they were missing
substantial amounts of data (more than 10 percent) or were under the age of 18. This resulted in a
final sample size of 89. Of these participants, 24 (27%) were male and 65 (73%) were female.
The average age of participants was 22.0 years (SD = 2.00).
Participants were directed to an online study where they were shown the four pictures of
food that were used in the main study surveys (see Appendix A). The foods depicted were pizza,
fish and chips, a plate of chickpeas over rice, and a salad bar. The purpose of this pilot study was
to determine whether each picture was perceived as healthy or unhealthy in order to ensure that
they stimulated the proper responses in participants in the main study. Participants were shown all
four pictures in a random order and rated each picture with respect to nine items created for the
purpose of this study on a 7-point Likert-type scale. These items were combined into a
“healthiness” composite by taking the average of the items. Alpha reliabilities for all composite
scores across all picture manipulations were > .79.
The nine items used to assess participant perception of the healthiness of foods depicted
were:
1. This food looks healthy
2. I would want to eat this food
3. Eating this food would prevent chronic diseases
4. Eating this food would help me maintain a healthy weight
5. This food looks unhealthy (reverse-coded)
6. Eating this food would make me feel energetic

11
7. Eating this food would increase my quality of life
8. I would not want to eat this food (reverse-coded)
9. Eating this food would make me feel sick (reverse-coded)
Results
A repeated measures ANOVA of the individual picture manipulations revealed that there
was an overall significant difference between the four pictures, F(3, 264) = 240.75, p < .001, η2 =
.73. Individual comparisons revealed that the Pizza (M = 2.68, SD = 1.01) and Fish & Chips (M =
2.56, SD = 0.91) pictures did not receive significantly different ratings of healthiness, pbonferroni >
.05. However, the Salad (M = 5.97, SD = .95) was rated as being significantly healthier than the
Chickpeas (M = 4.59, SD = 1.14), pbonferroni < .001.
Although there was a significant difference in the healthiness ratings between the Salad
and the Chickpeas dishes, it was determined that the manipulation of healthiness was achieved
because both of those dishes were rated higher than the midpoint on the healthiness scale and they
were both rated as being significantly more healthy than the Pizza and the Fish and Chips dishes.
When combined into Unhealthy (Pizza and Fish & Chips) Healthy (Chickpeas and Salad)
composites, a repeated measures ANOVA revealed that there was a significant difference in
healthiness ratings between the Healthy and Unhealthy conditions, F(1, 88) = 458.56, p < .001, η2
= .84. Specifically, there was a significant difference such that the Healthy condition (M = 5.28,
SD = 0.73) was rated higher in healthiness than the Unhealthy condition (M = 2.62, SD = 0.84),
pbonferroni < .001.
Thus, it was determined that the healthiness manipulations were successful, with both the
Salad and Chickpeas treated as Healthy, and the Pizza and Fish and Chips treated as Unhealthy,
in further testing.

12
Chapter 3
Methods
Participants
There were a total of 307 individuals that participated in this research. Of these, 107 were
removed because they were missing substantial amounts of data (more than 10 percent) or were
under the age of 18. This resulted in a final sample size of 200. Of these, 124 (62%) were female
and 76 (38%) were male. Of the participants, 146 (73%) identified as Caucasian, 36 (18%)
identified as Asian or Pacific Islander, 2 (1%) identified as Black or African American, 7 (4%)
identified as Hispanic, 6 (3%) identified as Mixed Race, and 3 (2%) identified as “Other”. The
average age was 22.34 years (SD = 3.69).
Materials
Participants indicated the extent to which they agreed with each of the items used in this
study using a Likert-type scale from 1 to 7 where 1 = agree not at all and 7 = agree very strongly,
unless otherwise noted. For a list of these items, see Appendix B.
Job satisfaction was measured using three items from Spector’s (1997) scale. The items
include “I like doing things at work,” “I feel a sense of pride in doing my job,” and “My job is
enjoyable.” Reliability for this scale was α = .89
Turnover intention was measured using three items from Cammann, Fishman, Jenkins,
and Kelsch’s (1979) scale. The items include “All in all, I am satisfied with my job” (reverse
coded), “I often think about quitting,” and “I will probably look for a new job in the next year.”
Reliability for this scale was α = .63
13
Energy was measured using three items from Schaufeli, Salanova, Gonzalez-Roma, and
Bakker’s (2002) scale. The items include “At my work, I feel bursting with energy,” “At my job,
I feel strong and vigorous,” and “When I get up in the morning, I feel like going to work.”
Reliability for this scale was α = .83
Stress was measured using four items from Motowildo, Packard, and Manning’s (1986)
scale. The items include “I feel a great deal of stress because of my job,” “My job is extremely
stressful,” “Very few stressful things happen to me at work,” (reverse coded), and “I almost never
feel stressed at work” (reverse coded). Reliability for this scale was α = .56. Due to its low
reliability, this construct was not included in subsequent analyses.
Affective organizational commitment was measured using three items from Allen and
Meyer’s (1990) scale. The items include “I would be very happy to spend the rest of my career
within this job,” “I think that I could easily become as attached to another job as I am to this one”
(reverse coded), and “I do not feel a strong sense of belonging to my job” (reverse coded).
Reliability for this scale was α = .25. Due to its low reliability, this construct was not included in
subsequent analyses.
Continuance organizational commitment was measured using three items Allen and
Meyer’s (1990) scale. The items include “I am not afraid of what might happen if I quit my job
without having another one lined up” (reverse-coded), “I feel that I have too few options to
consider leaving this job,” and “One of the major reasons I continue to work for this job is that
leaving would require considerable personal sacrifice — another job may not match the overall
benefits I have here.” Reliability for this scale was α = .55. Due to its low reliability, this
construct was not included in subsequent analyses.
Normative organizational commitment was measured using four items from Allen and
Meyer’s (1990) scale. The items include “I think that people these days move from job to job too
often,” “Jumping from job to job does not seem at all unethical to me” (reverse-coded), “One of

14
the major reasons I continue to work for this job is that I believe that loyalty is important and
therefore feel a sense of moral obligation to remain,” and “If I got another offer for a better job
elsewhere I would not feel it was right to leave my job.” Reliability for this scale was α = .52.
Due to its low reliability, this construct was not included in subsequent analyses.
PO Fit was measured using three items from Cable and Judge’s (1996) scale. The items
include “My personal values match or fit the organization’s and the other employees in the
organization,” “The values and personality of the organization reflect your own values and
personality,” and “My values match those of the other employees in the organization.” Reliability
for this scale was α = .75
POS was measured using three items from Rhoades and Eisenberger’s (2002) scale. The
items include “My organization really cares about my well-being,” “My organization strongly
considers my goals and values,” and “My organization shows very little concern for me”
(reverse-coded). Reliability for this scale was α = .73
Procedure
Participants were recruited via a popular social networking website. Participation in this
research was a voluntary activity and participants that consented were directed to an online
survey via a hyperlink on the social networking event page. Participants were randomly assigned
to one of three conditions (Healthy, Unhealthy, or Control). The survey for each condition had a
different description and pictures of a company (see Appendix A). In the Control condition, the
survey provided generic information about a company and displayed photographs of the interior
and exterior of the supposed organization. For the Healthy and Unhealthy conditions, the surveys
included the same information as the Control survey plus additional descriptions and pictures of
the employee cafeteria. The Healthy survey provided a description of an employee cafeteria that
offered healthy entrées plus the food pictures that participants perceived as healthy in the pilot

15
study. Likewise, the Unhealthy survey had a description of an employee cafeteria that offered
unhealthy entrées plus the food pictures that participants perceived as unhealthy in the pilot study.
After reading the description and viewing the photos of their assigned condition, participants
were asked to complete the survey as if they were an employee of the company they were just
shown. All participants completed the exact same survey regardless of the condition they were
assigned. This survey assessed their levels of job satisfaction, turnover intention, energy, stress,
affective organizational commitment, continuance organizational commitment, normative
organizational commitment, PO Fit, and POS. The items for each study construct were randomly
scattered throughout the survey. Finally, participants were thanked for their time.

16
Chapter 4
Results
Table 1 lists the means, standard deviations, reliabilities, and zero-order correlation
coefficients for each job attitude across all conditions. Scales with low reliability (< .60) were
excluded.
Table 1: Means, standard deviations, reliabilities, and inter-correlations among study constructs
The results of one-way ANOVAs revealed that there were significant differences
between groups with respect to job satisfaction, energy, PO Fit, POS, and turnover intention (see
Table 2). There was a significant difference across conditions with respect to job satisfaction,
F(2, 197) = 9.51, p < .001, η2 = .09. Specifically, there was a significant difference between the
Unhealthy (M = 3.68, SD = 1.15) and both the Healthy condition (M = 4.33, SD = 1.09), pbonferroni
< .01 and the Control condition (M = 4.46, SD = 1.08), pbonferroni < .001. There was no difference
between the Healthy condition and the Control condition (see Figure 1).
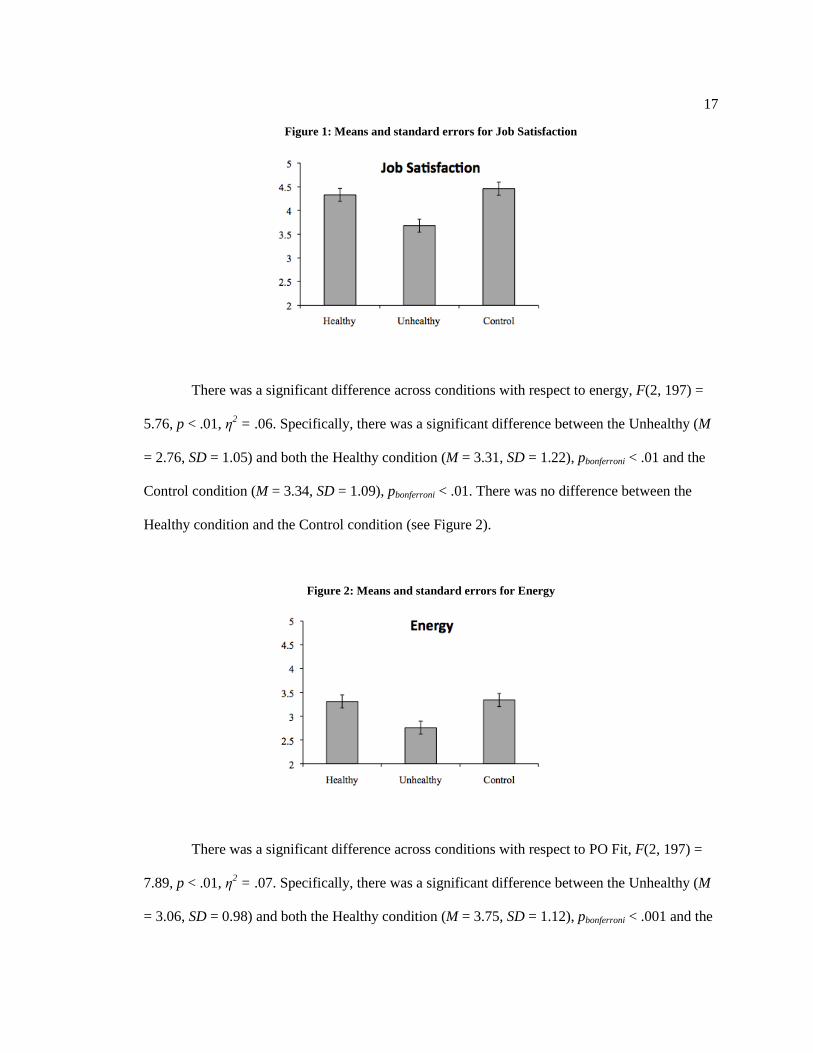
17
Figure 1: Means and standard errors for Job Satisfaction
There was a significant difference across conditions with respect to energy, F(2, 197) =
5.76, p < .01, η2 = .06. Specifically, there was a significant difference between the Unhealthy (M
= 2.76, SD = 1.05) and both the Healthy condition (M = 3.31, SD = 1.22), pbonferroni < .01 and the
Control condition (M = 3.34, SD = 1.09), pbonferroni < .01. There was no difference between the
Healthy condition and the Control condition (see Figure 2).
Figure 2: Means and standard errors for Energy
There was a significant difference across conditions with respect to PO Fit, F(2, 197) =
7.89, p < .01, η2 = .07. Specifically, there was a significant difference between the Unhealthy (M
= 3.06, SD = 0.98) and both the Healthy condition (M = 3.75, SD = 1.12), pbonferroni < .001 and the

18
Control condition (M = 3.61, SD = 1.08), pbonferroni < .01. There was no difference between the
Healthy condition and the Control condition (see Figure 3).
Figure 3: Means and standard errors for PO Fit
There was a significant difference across conditions with respect to POS, F(2, 197) =
11.70, p < .001, η2 = .11. There were significant differences between all three conditions. There
was a significant difference between the Healthy (M = 4.31, SD = 1.14) and the Unhealthy
conditions (M = 3.36, SD = 1.09), pbonferroni < .001, the Healthy and Control conditions (M = 3.80,
SD = 1.20), pbonferroni < .05, and the Unhealthy and Control conditions, pbonferroni < .05 (see Figure
4).
Figure 4: Means and standard errors for POS

19
There was a significant difference across conditions with respect to turnover intention, F(2, 197)
= 11.89, p < .001, η2 = .11. Specifically, there was a significant difference between the Unhealthy
(M = 3.98, SD = 1.15) and both the Healthy condition (M = 3.17, SD = 1.02), pbonferroni < .001 and
the Control condition (M = 3.21, SD = 1.07), pbonferroni < .001. There was no difference between
the Healthy condition and the Control condition (see Figure 5).
Figure 5: Means and standard errors for Turnover Intention
Table 2: Results of UNIANOVA tests on study constructs
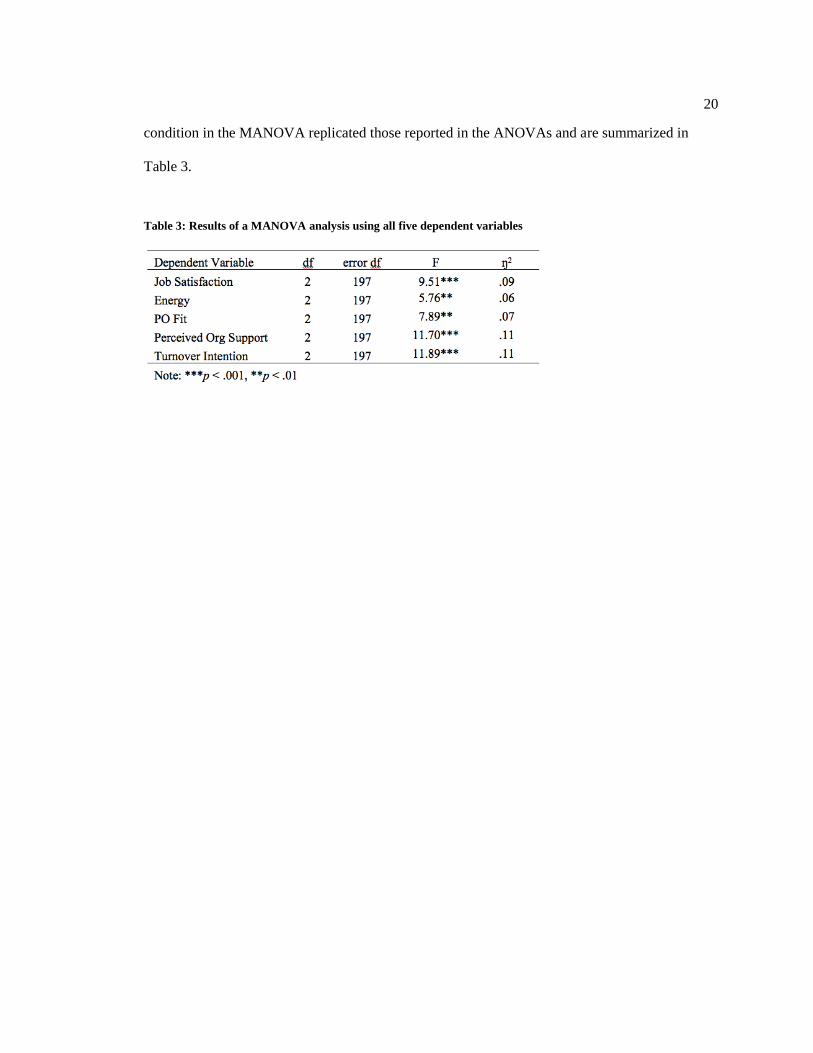
Because the job attitudes were highly correlated, a one-way MANOVA was conducted to
test the effect of condition on job attitudes. The results suggest that there was an overall effect of
condition on job attitudes, F(10, 388) = 4.27, p < .001, η2 = .10. The individual effects of
20
condition in the MANOVA replicated those reported in the ANOVAs and are summarized in
Table 3.
Table 3: Results of a MANOVA analysis using all five dependent variables

21
Chapter 5
Discussion
Summary of Results
In summary, the following employee job attitudes studied yielded significant results: job
satisfaction, energy, PO Fit, POS, and turnover intention. The three types of organizational
commitment and stress were not analyzed due to low alpha reliability results. Hypothesis 2 was
supported because the Healthy condition was rated more positively than the Unhealthy condition
with respect to higher job satisfaction (H2a), energy (H2b), POS (H2d), PO Fit (H2e) and more
negatively with respect to turnover intentions (H2f). Hypothesis 3 was also supported because the
Unhealthy condition was rated more negatively than the Control condition with respect to job
satisfaction (H3a), energy (H3b), POS (H3d), PO Fit (H3e) and more positively with respect to
turnover intentions (H3f).
However, Hypothesis 1 was only partially supported. The Healthy condition had higher
ratings than the Control condition with respect to POS (H1d), but did not differ significantly from
the Control condition for any of the other variables studied. A possible explanation is that the
Control condition was not appropriately designed because it lacked any mention of food and thus,
there is no way to determine what kind of cafeteria participants were envisioning, if at all. A
Control condition that depicted neutral foods that are regarded as neither healthy nor unhealthy
may have been more appropriate.
22
Implications of Study
Regardless of whether or not the Healthy condition is significantly different from the
Control condition, results still indicate that the healthiness of an employee cafeteria does have an
effect on employee job attitudes. This relationship is that a healthy cafeteria yields higher levels
of positive employee attitudes (job satisfaction, energy, PO Fit, POS) and lower levels of negative
employee attitudes (turnover intention) than an unhealthy cafeteria. As discussed in the Literature
Review, these variables are all predictive of employee turnover, and thus, offering an employee
cafeteria with nutritious options may be one possible method of decreasing employee turnover.
Since high turnover is costly in both the financial and organizational culture sense, it is very
important for companies to find ways to decrease their turnover rates.
Moreover, the results of this study are likely conservative estimates since they were
gathered using merely stimuli of four pictures and a short description. Studies using a stronger
manipulation should yield even greater findings. This research lays the groundwork for continued
investigation of the effects of a nutritious cafeteria on employee outcomes. Future studies can
consider doing cross sectional studies or long-term interventions of healthy vs. unhealthy
employee cafeterias and their relationships with job attitudes and actual turnover. In these studies,
it will also be possible to quantify return on investment for the company by comparing costs of
offering a nutritious cafeteria with the financial savings of decreased withdrawal behaviors such
as turnover and absenteeism.

23
Appendix A
Participant Surveys
Control Manipulation
Instructions:
Please read and view the following information and pictures. Imagine that you are an employee at
this facility and answer the following questions according to how you would respond if you were
employed at this company.
You have been working at the EFG Corporation for some time now. The company usually has
good management, but sometimes you disagree with executive decisions and get frustrated at
work. You also enjoy being with your coworkers, even though sometimes you get in small
disagreements.

24
Healthy Manipulation
Instructions:
Please read and view the following information and pictures. Imagine that you are an employee at
this facility and answer the following questions according to how you would respond if you were
employed at this company.
You have been working at the EFG Corporation for some time now. The company usually has
good management, but sometimes you disagree with executive decisions and get frustrated at
work. The employee cafeteria typically offers a salad bar, grilled chicken, fresh fruits and
vegetables, and other low-fat entrées. You also enjoy being with your coworkers, even though
sometimes you get in small disagreements.

25
Unhealthy Manipulation
Instructions:
Please read and view the following information and pictures. Imagine that you are an employee at
this facility and answer the following questions according to how you would respond if you were
employed at this company.
You have been working at the EFG Corporation for some time now. The company usually has
good management, but sometimes you disagree with executive decisions and get frustrated at
work. The employee cafeteria typically offers hamburgers, pizza, French Fries, fried fish patties,
and other common entrées. You also enjoy being with your coworkers, even though sometimes
you get in small disagreements.
26
(The following are the survey questions that followed Control, Healthy, and Unhealthy
manipulations. The specific order of questions was randomized on the actual participant survey.)
Survey Page 1
Please choose the response that best describes you.
Likert Scale:
1 = Agree not at all
2 = Slightly agree
3 = Somewhat agree
4 = Moderately agree
5 = Agree
6 = Strongly agree
7 = Very strongly agree
1. I sometimes feel my job is meaningless
2. I like doing the things I do at work
3. I feel a sense of pride in doing my job
4. My job is enjoyable
5. All in all, I am satisfied with my job.
6. I often think about quitting.
7. I will probably look for a new job in the next year.
8. At my work, I feel bursting with energy
9. At my Job, I feel strong and vigorous
10. When I get up in the morning, I feel like going to work
11. At my work I always persevere, even when things do not go well
Survey Page 2
Please choose the response that best describes you.
Likert Scale:
1 = Agree not at all
2 = Slightly agree
3 = Somewhat agree
4 = Moderately agree
5 = Agree
6 = Strongly agree
7 = Very strongly agree
1. I feel a great deal of stress because of my job
2. Very few stressful things happen to me at work
3. My job is extremely stressful
4. I almost never feel stressed at work
5. I would be very happy to spend the rest of my career within this job.
6. I think that I could easily become as attached to another job as I am to this one.
7. I do not feel a strong sense of belonging to my job.
8. I am not afraid of what might happen if I quit my job without having another one lined up.
9. I feel that I have too few options to consider leaving this job.
27
10. One of the major reasons I continue to work for this job is that leaving would require
considerable personal sacrifice — another job may not match the overall benefits I have here.
Survey Page 3
Please choose the response that best describes you.
Likert Scale:
1 = Agree not at all
2 = Slightly agree
3 = Somewhat agree
4 = Moderately agree
5 = Agree
6 = Strongly agree
7 = Very strongly agree
1. I think that people these days move from job to job too often.
2. Jumping from job to job does not seem at all unethical to me.
3. One of the major reasons I continue to work for this job is that I believe that loyalty is
important and therefore feel a sense of moral obligation to remain.
4. If got another offer for a better job elsewhere I would not feel it was right to leave my job.
5. My personal values match or fit the organization’s and the other employees in the
organization
6. The values and personality of the organization reflect your own values and personality
7. My values match those of the other employees in the organization
8. My organization really cares about my well-being.
9. My organization strongly considers my goals and values.
10. My organization shows very little concern for me.

28
Appendix B
Survey Key
Job Satisfaction
1. I sometimes feel my job is meaningless. (Reverse-coded)
2. I like doing the things I do at work.
3. I feel a sense of pride in doing my job.
4. My job is enjoyable.
Turnover Intention
1. All in all, I am satisfied with my job. (Reverse-coded)
2. I often think about quitting.
3. I will probably look for a new job in the next year.
Energy/Worker Engagement
1. At my work, I feel bursting with energy.
2. At my Job, I feel strong and vigorous.
3. When I get up in the morning, I feel like going to work.
4. At my work I always persevere, even when things do not go well.
Stress
1. I feel a great deal of stress because of my job.
2. Very few stressful things happen to me at work. (Reverse-coded)
3. My job is extremely stressful.
4. I almost never feel stressed at work. (Reverse-coded)
Org Commitment—Affective
1. I would be very happy to spend the rest of my career within this job.
2. I think that I could easily become as attached to another job as I am to this one.
(Reverse-coded)
3. I do not feel a strong sense of belonging to my job. (Reverse-coded)
Org Commitment—Continuance
1. I am not afraid of what might happen if I quit my job without having another one
lined up. (Reverse-coded)
2. I feel that I have too few options to consider leaving this job.

29
3. One of the major reasons I continue to work for this job is that leaving would require
considerable personal sacrifice — another job may not match the overall benefits I
have here.
Org Commitment—Normative
1. I think that people these days move from job to job too often.
2. Jumping from job to job does not seem at all unethical to me. (Reverse-coded)
3. One of the major reasons I continue to work for this job is that I believe that loyalty
is important and therefore feel a sense of moral obligation to remain.
4. If got another offer for a better job elsewhere I would not feel it was right to leave my
job.
Person/Organization Fit
1. My personal values match or fit the organization’s and the other employees in the
organization.
2. The values and personality of the organization reflect your own values and
personality.
3. My values match those of the other employees in the organization.
Perceived Organizational Support
1. My organization really cares about my well-being.
2. My organization strongly considers my goals and values.
3. My organization shows very little concern for me. (Reverse-coded)

30
References
Adbel-Moty, K. (2010). Creating a wellness program for hotel front desk employees. UNLV
Theses/Dissertations/Professional Papers/Capstones, Paper 427.
Allen, D., Shore, L., & Griffeth, R. (2003). The role of perceived organizational support and
supportive human resource practices in the turnover process. Journal of Management,
29, 99-118.
Arnett, D., Laverie, D., & McLane, C. (2002). Using job satisfaction and pride as internal
marketing tools. Cornell Hotel and Restaurant Administration Quarterly, 43, 87-96.
Berry, L. (2007). "Do-it-yourself" employee health care. Sloan MIT Management Review, 53, 15-
16.
Bertera, R. (1990). The effects of workplace health promotion on absenteeism and employment
costs in a large industrial population. American Journal of Public Health, 80, 1101-
1105.
Blake, H., Zhou, D., & Batt, M. E. (2013). Five-year workplace wellness intervention in the NHS.
Perspectives in Public Health , 133, 262-271.
Blanck, H., Yaroch, A., Atienza, A., Yi, S., Zhang, J., & Masse, L. (2007). Factors influencing
lunchtime food choices among working Americans. Health Education & Behavior, 36,
289-301.
Blomme, R. J., Rheede, A. V., & Tromp, D. M. (2010). Work-family conflict as a cause for
turnover intentions in the hospitality industry. Tourism and Hospitality Research, 10,
269-285.

31
Bonn, M. A. (1992). Reducing turnover in the hospitality industry: An overview of recruitment,
selection, and retention. International Journal of Hospitality Management, 11, 47-63.
Connolly, K., & Myers, J. (2003). Wellness and mattering: The role of holistic factors in job
satisfaction. Journal of Employment Counseling, 40, 152-160.
Deery, M. A., & Shaw, R. N. (1999). An investigation of the relationship between employee
turnover and organizational culture. Journal of Hospitality & Tourism Research, 23,
387-400.
Goetzel, R., & Ozminkowski, R. (2008). The health and cost and benefits of worksite health
promotion programs. Annual Review of Public Health, 29, 303-23.
Gupta, N., & Beehr, T. A. (1979). Job stress and employee behaviors. Organizational Behavior
and Human Performance, 23, 373-387.
Harden, A., Peersman, G., Oliver, S., Mauthner, M., & Oakley, A. (1998). A systematic review of
the effectiveness of health promotion interventions in the workplace. Occupational
Medicine, 40, 540-548.
Iverson, R. D., & Deery, M. (1997). Turnover culture in the hospitality industry. Human
Resource Management Journal, 7, 71-82.
Mobley, W. H. (1977). Intermediate linkages in the relationship between job satisfaction and
employee turnover. Journal of Applied Psychology, 62, 237-240.
O'Reilly, C. A., Chatman, J., & Caldwell, D. F. (1991). People and organizational culture: A
profile comparison approach to assessing person-organization fit. Academy of
Management Journal, 34, 487-516.

32
Pelled, L. H. (1999). Down and out: An investigation of the relationship between mood and
employee withdrawal behavior. Journal of Management, 25, 875-895.
Rhoades, L., & Eisenberger, R. (2002). Perceived organizational support: A review of the
literature. Journal of Applied Psychology, 87, 698-714.
Sanchez, D., & King-Toler, E. (2007). Addressing disparities consultation and outreach strategies
for university settings. Consulting Psychology Journal: Practice and Research, 59, 286-
295.
Serxner, S., Gold, D., & Meraz, A. (2009). Do employee health management programs work?
American Journal of Health Promotion, 23, 1-8.
Shain, M., & Kramer, D. M. (2004). Health promotion in the workplace: Framing the concept;
reviewing the evidence. Journal of Occupational and Environmental Medicine, 61, 643-
648.
Simons, T., & Hinkin, T. (2001). The effect of employee turnover on hotel profits. Cornell Hotel
and Restaurant Administration Quarterly, 42, 65-69.
Taylor, S., & Cosenza, R. (1997). Internal marketing can reduce employee turnover. Supervision,
58, 3-5.
Tett, R. P., & Meyer, J. P. (1993). Job satisfaction, organizational commitment, turnover
intention, and turnover: path analyses based on meta-analytic findings. Personnel
Psychology, 46, 259-293.
Vickers, M. (2006). Towards employee wellness: Rethinking bullying paradoxes and masks.
Journal of Employee Rights and Responsibilities, 18, 267-281.

33
Walsh, K. (2007). Developing in-house careers and retaining management talent. Cornell Hotel
and Restaurant Administration Quarterly, 48, 163-182.
Zoller, H. (2004). Manufacturing health: Employee perspectives on problematic outcomes in a
workplace health promotion initiative. Western Journal of Communication, 68, 278-301.
34 Academic Vita
Lucy J. Song
EDUCATION
The Pennsylvania State University— Schreyer Honors College
B.S. Candidate: Nutritional Sciences
B.S. Candidate: Hotel, Restaurant, and Institutional Management Minors in International Studies and Japanese Language
University Park, PA Expected Graduation:
May 2014
WORK EXPERIENCE
LEADERSHIP EXPERIENCE
CRU (Christian Fellowship), Conference Team Leader Jan 2012- Dec 2012
Planned and led a week-long spring break conference for 55 students and a weekend retreat for 170 students
Managed teams of 10 and 30 student leaders
Responsible for logistics of $25,000 in funds and travel/housing arrangements
Penn State Dance MaraTHON (Student-run Pediatric Cancer Philanthropy) Aug 2009 – May 2012
Merchandise 2012 Captain: Operated THON Merchandise stores
Supply Logistics 2011 Captain: Cold-called companies and secured donations
INTERNATIONAL EXPERIENCE AND LANGUAGE SKILLS
Study Abroad at CIEE Seville Study Center: Seville, Spain Summer 2011
Study Abroad at IES Abroad Tokyo Center: Tokyo, Japan Summer 2010
Fluent in Mandarin Chinese
Proficient in Spanish and Japanese
HONORS AWARDS AND CERTIFICATIONS
Phi Kappa Phi Honor Society Jan 2014
College of HHD 2014 Alumni Recognition for Student Excellence Award Dec 2013
ServSafe Certification Nov 2011
ARAMARK at The Children’s Hospital of Philadelphia, Nutrition Services Intern Philadelphia, PA
Supervised total of 70 employees in hospital kitchen serving 600 meals a day
Jun 2013- Aug 2013
Assisted nursing administration with trial of new feeding pump, performed data analysis, and presented information to administrators
Reorganized formula storeroom of over 200 products
The Penn Stater Conference Center Hotel, Conference Planning Intern State College, PA
Analyzed client needs to determine setup of room, AV, and food & beverage Jan 2012- Aug 2012
Designed Banquet Event Orders, meeting room diagrams, and oversaw events
Planned 32 meeting and banquet events ranging up to 70 guests
Learned Daylight Advanced Catering and Meeting Matrix systems
Scored an average rating of 96% on MeetingScope Post-Event Surveys
The Tavern Restaurant, Key Shift and Server State College, PA
Delivered meals, aided servers, and trained 4 new employees as key shift Dec 2010 – Dec 2012
Promoted to server after demonstrating ample skill and knowledge