the pedestrian behaviour of spanish adolescents
TRANSCRIPT
1
The Pedestrian Behaviour of Spanish Adolescents
Sullman, M. J. M.,1 Gras, M.E.
2, Font-Mayolas, S.
2, Masferrer, L.
2, Cunill, M.
2 & Planes,
M.2
1 School of Psychology, University of Hertfordshire, United Kingdom.
2 Quality of Life Research Institute, University of Girona, Catalonia, Spain
Address for contact:
Dr Mark Sullman
School of Psychology
University of Hertfordshire
College Lane, Hatfield, Hertfordshire, AL10 9AB, UK
Email: [email protected]
Tel: +44 (0) 1707 284625
Fax +44 (0) 1707 285073
2
The Pedestrian Behaviour of Spanish Adolescents
Abstract
Adolescent pedestrians are a particularly vulnerable group of road users. This research
tested the applicability of the recently developed Adolescent Road user Behaviour
Questionnaire (ARBQ) amongst a sample of 2006 Spanish adolescents. Confirmatory
Factor Analysis of the full scale found that the original three factors did not adequately fit
the data, but an acceptable fit was obtained for the shortened 21-item version of the scale.
In line with research from the UK, the present study found that males reported more
unsafe road crossing behaviour and playing on the roads, but there was no gender
difference for engaging in planned protective behaviour. This research also confirmed
that unsafe road crossing behaviour increased with age, while dangerous playing on the
road and planned protective behaviours both decreased with age. The present study also
confirmed that the ARBQ is a useful tool for investigating the safety-related behaviour of
adolescents on the road.
Keywords: Adolescents; Behaviour; Road safety; Pedestrians; ARBQ
3
Introduction
In terms of westernised countries Spain has a relatively high number of road deaths. In
2006 there were 4,104 deaths and more than 63,014 injuries on Spanish roads (DGT,
2007). This equates to a fatality rate of 85/1,000,000 people, which is almost twice as
high as in the Netherlands (43/1,000,000 people) and more than three times as high as in
Malta (25/1,000,000) (European Commission, 2008). However, the risk of being killed or
seriously injured in the advent of an accident differs according to the type of road user,
with pedestrians being one particularly vulnerable group of road users.
Pedestrian accidents are one of the single biggest causes of injury, disability and death in
the developed world. This is particularly the case amongst children, where the problem of
pedestrian accidents has been identified as one of the most serious health risks facing
children in developed countries (Thomson, Tolmie, Foot, & Mclaren, 1996). Moreover,
injury is the principal cause of child death in all developed nations, accounting for almost
40% of deaths amongst 1 to 14 year olds, with the single largest proportion of these
(41%) occurring on the road (UNICEF, 2008).
In terms of the Spanish statistics, in 2006 pedestrians were involved in 613 (15%) deaths
and 11,153 (18%) serious injuries, with 5-17 years old accounting for 13% of all
pedestrian injuries and death (DGT, 2007). In order to reduce the number of child
pedestrians injured and killed on the roads there is a need to understand the behaviour of
adolescents on the roads.
4
As would be expected, an extensive amount of research has shown that adolescents
engage in risky behaviours on the roads and that these behaviours, along with the failure
to engage in personal protective behaviours, increase the risk that they will be killed or
injured (e.g. BRAKE, 2004; Elliott & Baughan, 2004; Sullman & Mann, 2009; West,
Train, Junger, Pickering, Taylor and West, 1998). Therefore, understanding adolescents’
on road behaviour is an important first step in the reduction of accidents involving
adolescent pedestrians.
Although there is currently no agreed upon framework for investigating the behaviour of
adolescent pedestrians the Adolescent Road user Behaviour Questionnaire (ARBQ),
developed by Elliott and Baughan (2004), has potential to fill this gap. The original
ARBQ contained 43 items and was developed in the UK using information obtained via
qualitative descriptions of pedestrian accidents involving children, focus groups with
children, and road safety experts. Although the scale focused mainly on pedestrian
behaviours, it also included a small number of important behaviours as cyclists and using
the road to skateboard and roller blade.
In order to test the ARBQ Elliott and Baughan (2004) surveyed 2,433 English 11-16 year
olds and found that the scale was measuring three latent variables. The three factors,
which all had good internal reliabilities, were labelled: “unsafe crossing behaviour”,
“dangerous playing in the road” and “planned protective behaviour”. The “unsafe
crossing behaviour” factor consisted primarily of behaviours to do with crossing the road
in an unsafe manner (e.g. getting partway across the road and having to run the rest of the
way to avoid traffic). Dangerous playing on the roads (Factor 2) consisted of behaviours
which were mostly to do with playing on the road (e.g. skateboard on the road). In
5
contrast to the other two factors, the third factor (planned protective behaviour) was
comprised of protective behaviours which were aimed at reducing the risk of being
involved in an accident (e.g. using lights when riding a bike). This three way distinction
was largely supported in a recently completed study using a sample of New Zealand
secondary school students (Sullman & Mann, 2009).
Although there are substantial differences in the road traffic environment between NZ
and the UK, with the most obvious being population density and the ethnic make up of
the two populations, there were a large number of similarities in the findings of the two
studies. Aside from the substantial agreement in the factor structure, the order of the
items (by mean) was also similar, with the position of only two items differing greatly.
These two items were: wearing a helmet when riding a bike (3rd
in NZ and 27th
in the
UK) and using a crossing monitor where one was available (4th
in NZ and 26th
in the
UK). Although there is an obvious explanation for the difference in the former (using a
bike helmet is a legal requirement in NZ, but not the UK), there is no readily available
explanation for the latter difference.
Similar relationships were also found in the relationships the ARBQ factors had with the
adolescents’ demographic variables. In both studies males reported playing on the road
significantly more often than females and in neither study were there gender differences
in the reported frequency at which adolescents engaged in planned protective behaviour.
However, there were also a number of findings which differed between the two studies.
In the UK research, males reported engaging in unsafe road crossing behaviours more
often than females (Elliott & Baughan, 2004), but this was not replicated in the NZ study
6
(Sullman & Mann, 2009). The UK research also reported age differences in the frequency
at which the English adolescents reported engaging in the three types of behaviours. They
found that 11-12 year olds reported more planned protective behaviours and less unsafe
crossing behaviours than both 13-14 year olds and 14-15 year olds. In addition, 13-14
year olds also reported engaging in more dangerous play on the roads than 15-16 year
olds. As the NZ research did not include any 11-12 year olds, the only conflicting
findings were the absence of a difference between the two groups (13-14 vs. 15-16 year
olds) on the dangerous playing on the road factor and the absence of a gender difference
for the unsafe road crossing factor.
The frequency at which adolescents engage in the two types of potentially risky
behaviours (playing on the road and unsafe road crossing) and planned protective
behaviours has important implications for their safety. Information regarding the
relationships the three ARBQ factors have with demographic variables, such as age and
gender, could help identify who to target with any proposed interventions. This would
allow the identification of at risk groups so that interventions could be developed
specifically to target them. Finally, this information could also be useful for identifying
where additional research resources need to be directed towards.
However, in order for the ARBQ to become an agreed upon framework for investigating
the behaviour of adolescents as pedestrians, the scale must be tested in a country and
culture more dissimilar than NZ and the UK. The national culture of Spain has been
found to differ substantially from those of NZ and the UK on all four (power distance,
individualism, masculinity and uncertainty avoidance) of the Hofstede dimensions of
national culture that were reported for all three countries (Hofstede, 2008). It would
7
therefore be interesting to test whether the three way distinction for adolescent pedestrian
behaviour also applies in Spain. Furthermore, it would be interesting to investigate
similarities and differences between the three countries. This may help explain why there
are large differences in the injury and fatality statistics for the three countries. In addition,
if the same behavioural patterns emerge, then perhaps similar interventions may be
effective across the three countries.
In summary, this research attempted to describe the road user behaviour of Spanish
adolescents. More specifically we investigated the rank ordering of the 43 self-reported
behaviours and compared these with previous research from NZ and the UK to
investigate similarities and differences between the three countries. Finally, the present
study also investigated whether the resultant factors had relationships with the
demographic variables measured.
Method
Participants
The target population consisted of all secondary students (2180) attending all public
schools in the city of Girona (Spain). However, only 2036 students were present during
normal class time on the day of the data collection and the data of thirty participants
could not be analysed as they had not completed the questionnaire correctly. Therefore,
the final sample consisted of 2006 secondary students (92% participation). The age of the
participants ranged from 12 to 17 years old (Mean = 13.95, SD = 1.39), with 49.8 %
being female.
8
Materials
A Spanish version of the Adolescent Road User Behaviour Questionnaire (ARBQ) was
used to investigate the behaviour of adolescents on Spanish roads. The ARBQ consists of
43 items which start “As pedestrians, how often do you”, followed by examples of road
user behaviours. The scale is comprised of three different kinds of behaviours: unsafe
crossing behaviour (e.g. “run across a road without looking because you are in a
hurry”), playing on the road (e.g. “deliberately run across the road without looking, for a
dare”) and planned protective behaviour (e.g. “wear bright or protective clothing when
out on foot in the dark”). Table 1 shows the full list of these items and the order in which
they appeared in the questionnaire. Responses were made on a five point Likert scale (1 =
Never to 5 = Very often).
Design and Procedure
The study was peer reviewed to ensure the study complied with the University’s ethical
guidelines. Participation was voluntary and adolescents were assured of their anonymity
and the confidentiality of their responses. A cross-sectional survey was used to collect the
data. After permission had been obtained from the person in charge of each School, the
questionnaires were administered to all students present during normal class time. The
students answered the ARBQ along with questions about age and gender.
As the original version of the ARBQ was in English, the scale had to be translated into
Spanish. Translation of the scale was carried out by two native Spanish speakers and
9
these translations were then translated back into English by a native English speaker. No
major issues were identified during the translation process.
Results
Individual items
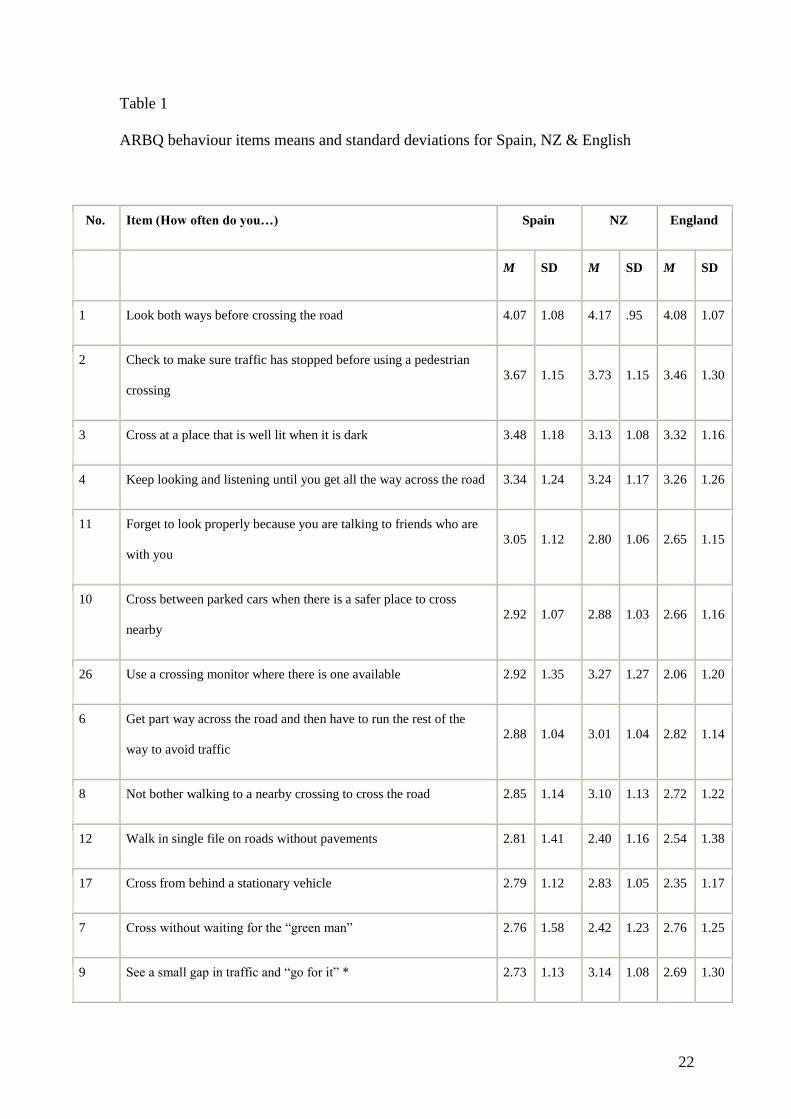
Table 1 shows the Spanish means and standard deviations, presented in descending order,
for each of the 43 ARBQ items. The table also presents the corresponding data from the
New Zealand and English research (Elliott & Baughan, 2004; Sullman & Mann, In
Press). The behaviour reported most often by the Spanish participants was also the
highest in both the English & NZ samples (“Looking both ways before crossing the
road”). This was followed by “Check to make sure traffic has stopped before using a
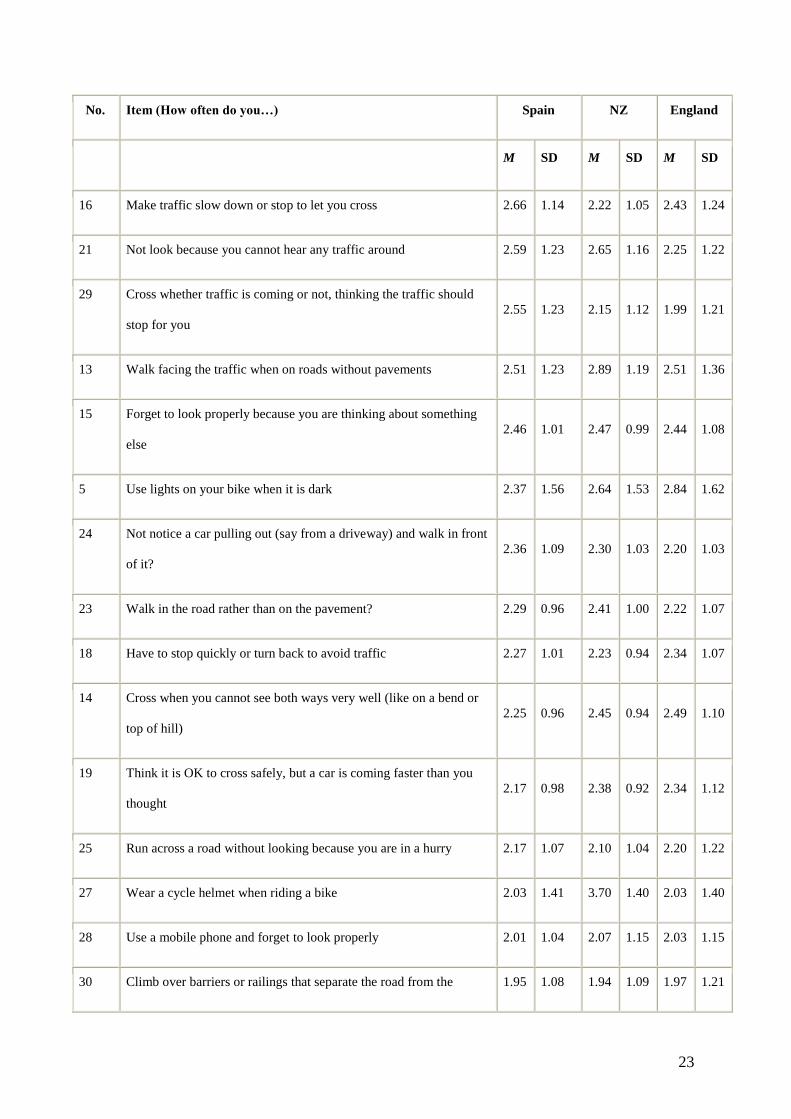
pedestrian crossing”, which was also second in both previous studies. The item “Wear a
cycle helmet when riding a bike” was the most dissimilarly rated item between the NZ
and Spanish adolescents (4th
in NZ and 26th
in Spain). The biggest difference with the UK
adolescents was the item “Use a crossing monitor where there is one available”, which
was rated the 6th
most frequently rated behaviour (similar to NZ in 7th
) while in the UK it
was 26th
. The behaviour the Spanish adolescents reported more often than the other two
samples was “Cross whether traffic is coming or not, thinking the traffic should stop for
you (16th
in Spain, 28th
in NZ and 29th
in the UK).
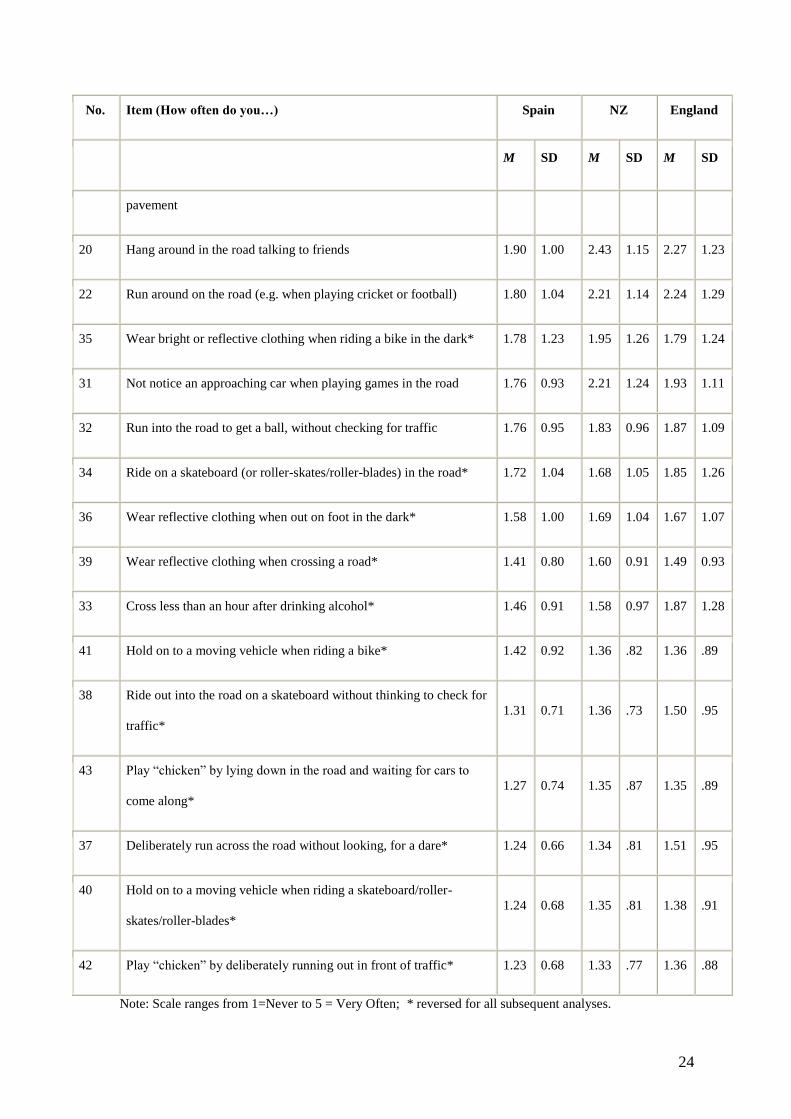
The four least often reported behaviours were almost exactly the same in the three
samples. The four least often reported behaviours by Spanish and New Zealand
10
adolescents were “Play “chicken” by deliberately running out in front of traffic”, “Hold
on to a moving vehicle when riding a skateboard or roller blades”, “Play chicken by lying
down in the road and waiting for cars to come along”, and “Deliberately run across the
road without looking, for a dare”. Three of the bottom four were also in the bottom four
of the UK, but the item “Deliberately run across the road without looking, for a dare” was
reported more frequently by UK adolescents thank by Spanish adolescents.
[Insert Table 1]
Factor Analysis
Confirmatory factor analysis (CFA) was used to investigate whether the factors identified
by Elliott and Baughan (2004) were a good fit for the Spanish ARBQ data. LISREL 8.71
was used and the fit was analysed using Maximum Likelihood Estimation procedures.
The missing data was treated using the Expectation Maximization (EM) method. The
processes began with the three factor model, which included the original 43 items (Elliott
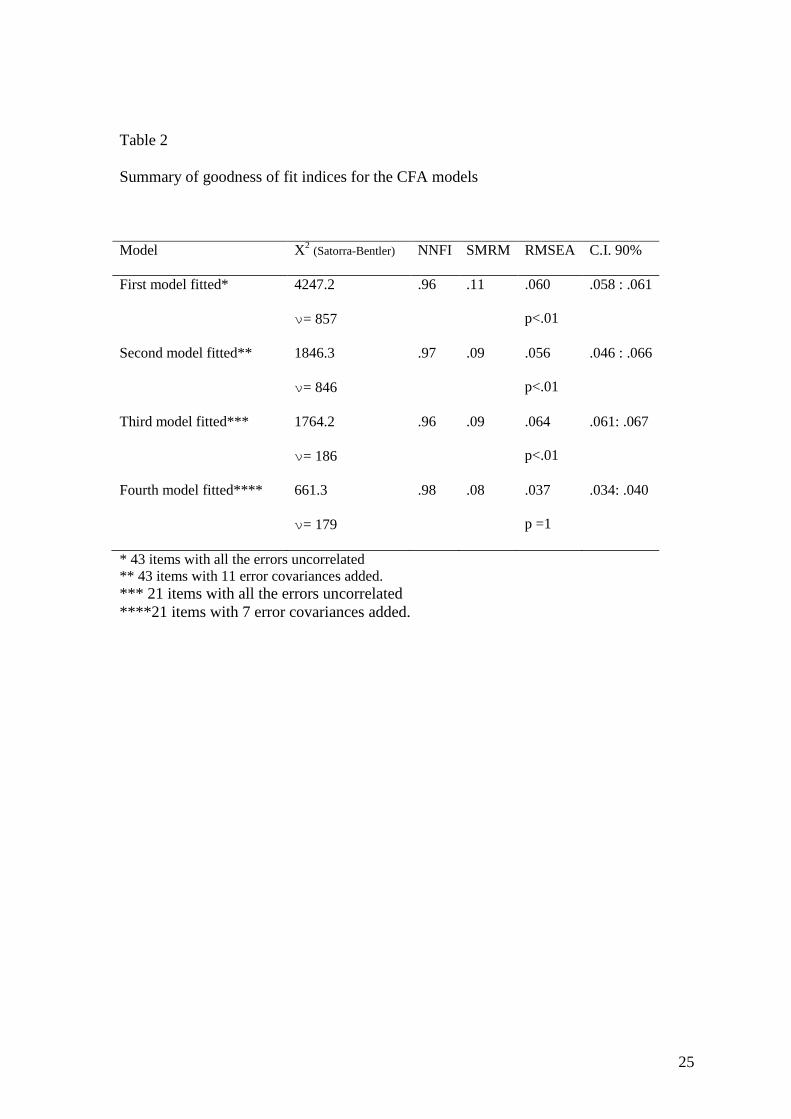
and Baughan, 2004). Table 2 presents a summary of the goodness of fit indices. The
goodness of fit indices used included the Satorra-Bentler Scaled Chi-Squared statistic and
the Non-Normed Fit Index (NNFI), due to the non-normality of the data. The
Standardised Root Mean Square (SMRM) and Root Mean-Squared Error of
Approximation Measures Residual (RMSEA) were also used.
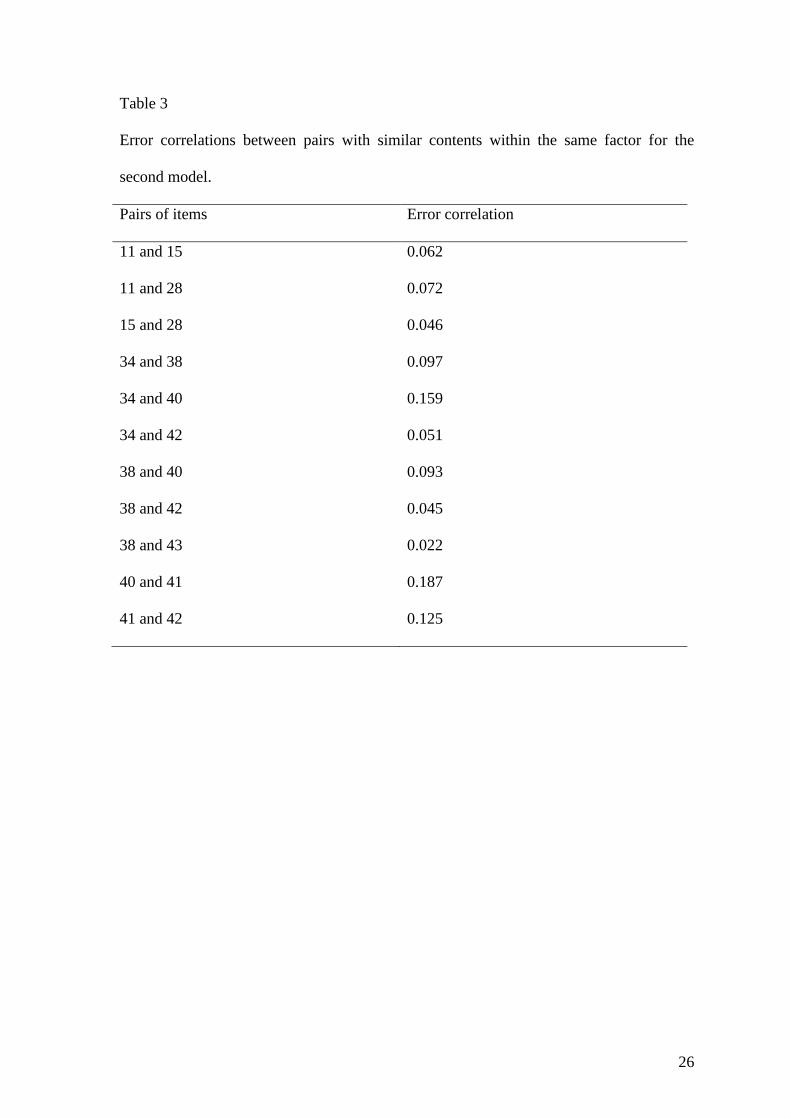
Although in the first model the NNFI was acceptable (over .95), the SMRM and RMSEA
were both higher than desired and so the modification indices were examined. This
showed a number of problem pairs of items (see Table 3). Redundant content appeared to
be the most likely explanation for these issues, as the pairs of items involved were
11
similar. For example, item 11 “Forget to look properly because you are talking to friends
who are with you” and item 15 “Forget to look properly because you are thinking about
something else” are very similar. Only error correlations between similar items within the
same factor were allowed. Allowing these items to be correlated produced a second
model which still did not have satisfactory fit indices (see Table 2).
[Insert Table 2]
[Insert Table 3]
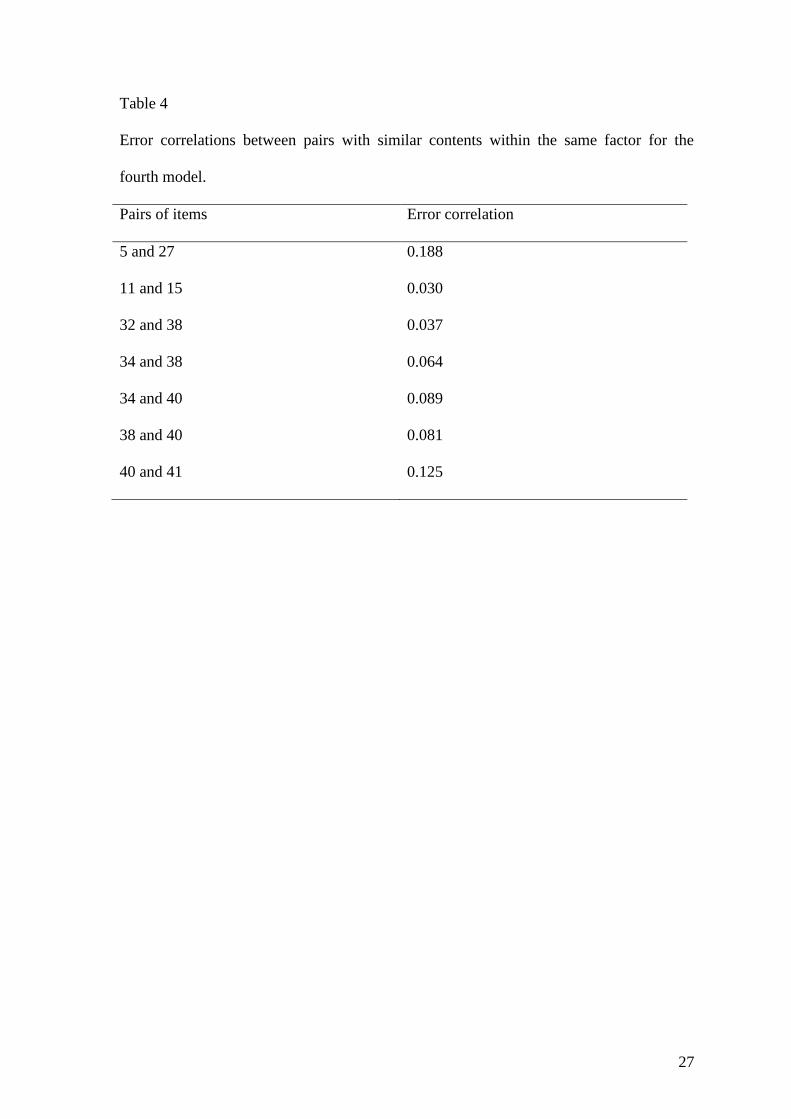
The third model tested was the shortened 21-item ARBQ produced by selecting the items
that loaded most strongly on the three factors (Elliott and Baughan, 2004). This model
also showed an acceptable NNFI, but higher than desired values for the SMRM and
RMSEA. When the modification indices were examined they showed problems with
seven pairs of items (see Table 4). Allowing these items to be correlated produced a
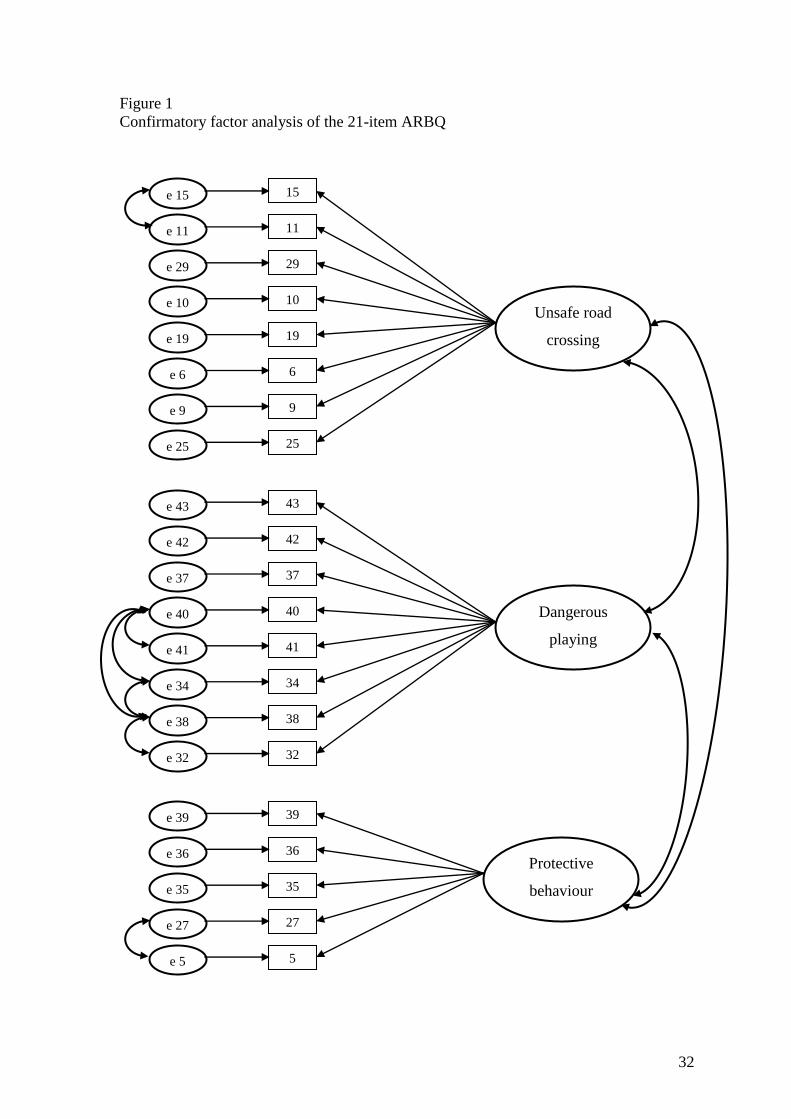
fourth model which had satisfactory fit indices (see Table 2). The correlated version of
the 21 item three factor model was therefore selected as the best and is shown in Figure 1.
[Insert Table 4]
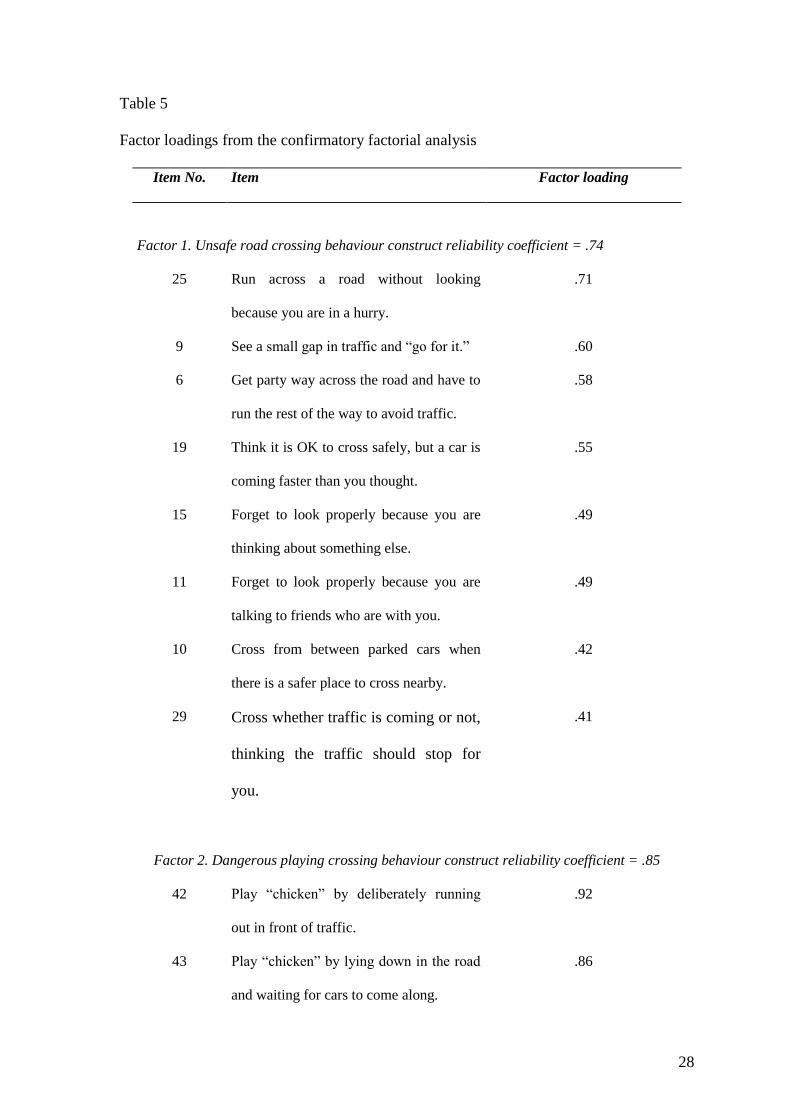
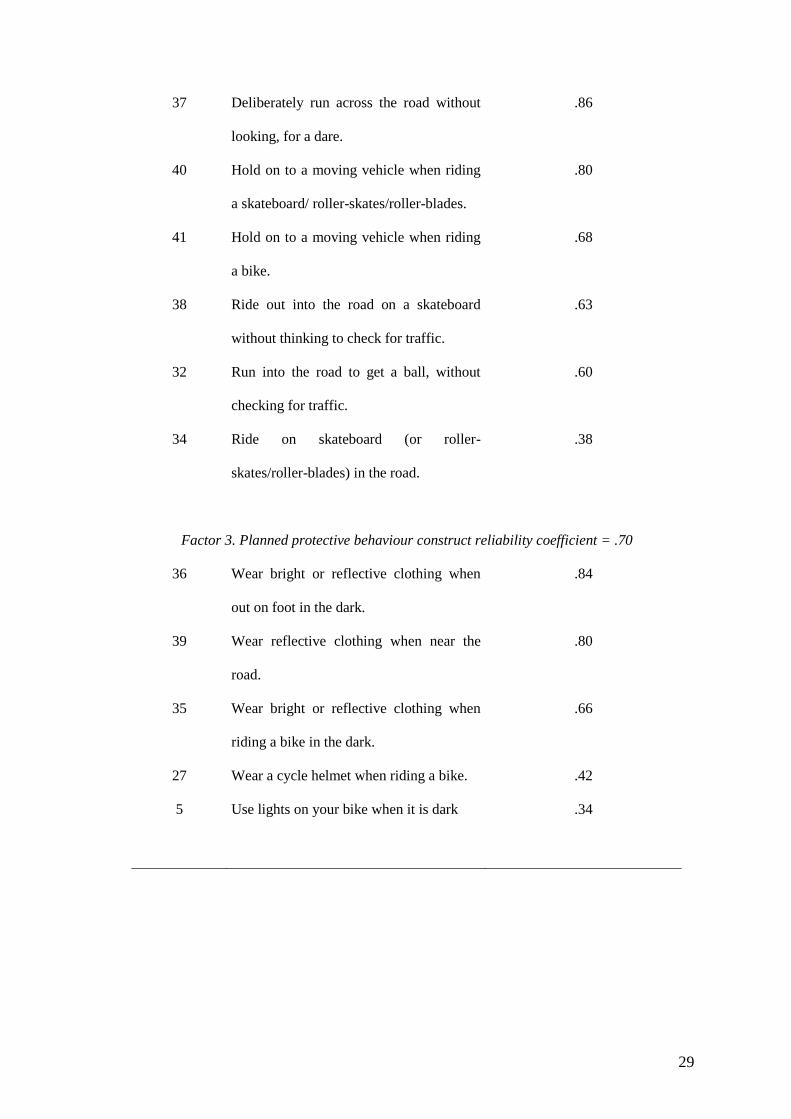
Table 5 shows the factor loadings, from the CFA, along with the Construct Reliability
Coefficients (Hair, Anderson, Tatham & Black, 1999) for the fourth model. All factors
had good construct reliability (>.70) and the factor loadings were all above .30.
[Insert Figure 1]
[Insert Table 5]
12
Adolescent Road Behaviour by age & gender
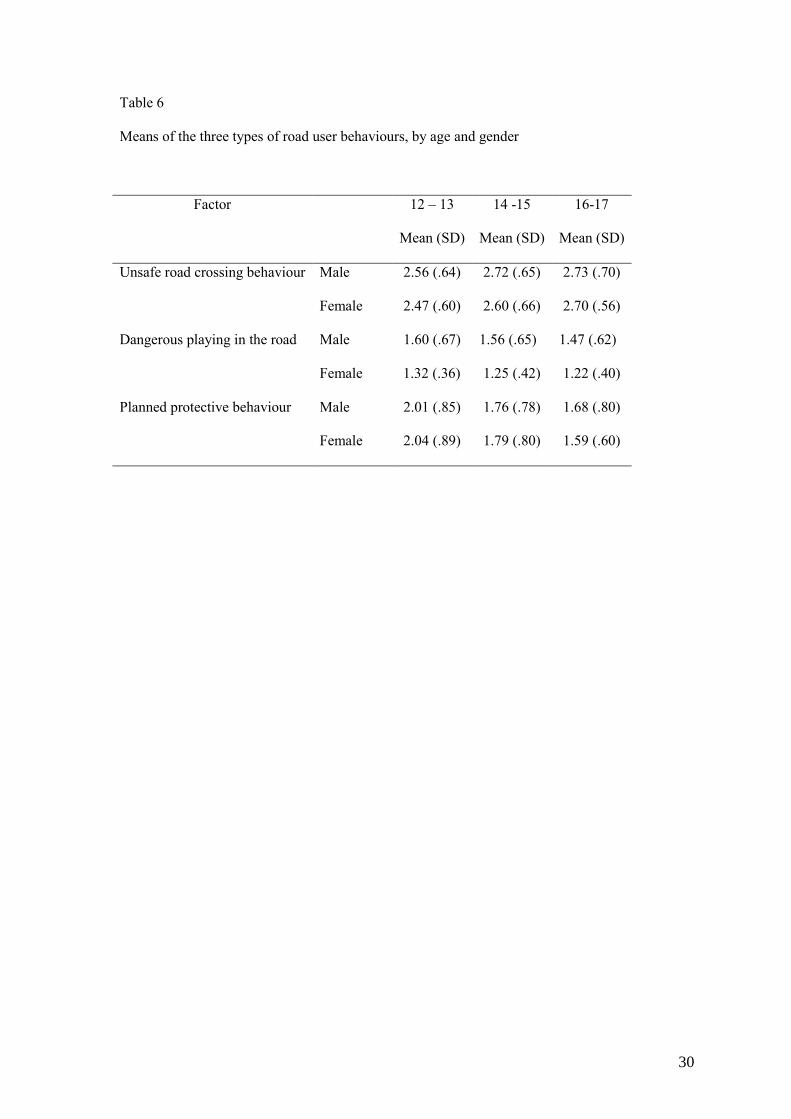
Table 6 shows the mean (and SD) for the three factors, by age and gender. The results of
a two way ANOVA (gender x age group) for the three factors found that males reported
significantly more unsafe road crossing behaviours (p<.001) and more dangerous playing
in the road (p<.001). However, there was no difference by gender in the reported
engagement in planned protective behaviours.
Table 6 also shows that self-reported unsafe road crossing behaviours increased with age.
However, the significant difference was between the 12-13 years old and the two older
groups (p<.001). The difference between the two oldest groups was not significant.
Dangerous playing in the road decreased with age, but again the difference was between
12-13 years old group and the two older groups (p<.05). Planned protective behaviour
also decreased with age, with the significant differences again being between the
youngest group and the two older groups (p<.0001). The interaction effects of age and
gender on the three different types of ARBQ behaviours were also examined but were not
significant.
[Insert Table 6]
[Insert Table 7]
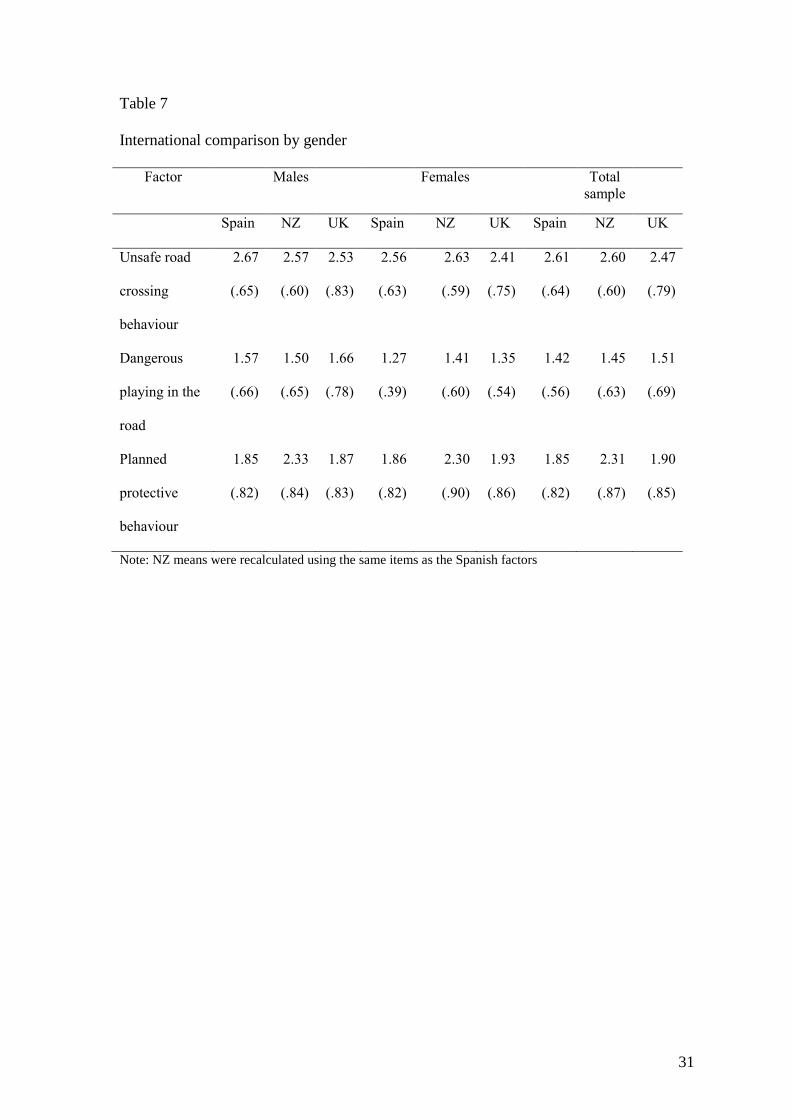
Table 7 shows the means (and SD) for each of the three ARBQ factors, by country, for
the total sample and also by gender. It should be noted that the items which comprised
this factor in the NZ research (Sullman & Mann, 2009) were slightly different from those
13
that made up the UK and Spanish factors. Therefore the means reported here were
recalculated to contain the same items as the present study. One sample t-tests were
individually undertaken to test whether the Spanish means were different from the NZ
and UK means. This found that the Spanish adolescents reported engaging more often in
unsafe road crossing behaviour than the UK adolescents (p<.0005), but reported the same
frequency as NZ adolescents (p=.48). By gender, the Spanish males reported engaging
more often in these behaviours than both the UK (p<.0005) and NZ (p<.0005) males. In
addition, Spanish females reported engaging more often in unsafe road crossing
behaviour than UK females (p<.005), but less frequently than the NZ females (p=.001).
In contrast, the Spanish adolescents reported less dangerous playing on the roads than
both UK (p<.0005) and NZ (p<.02) adolescents. By gender, the Spanish males reported
less dangerous playing on the roads than their UK counterparts (p<.005), but more than
NZ males (p=.003). Spanish females reported less playing on the roads than both UK
(p<.0005) and NZ females (p<.0005).
The planned protective behaviours were clearly more frequently reported by NZ
adolescents, than Spanish adolescents, for the whole sample (p<.0005) and for both
genders (p<.0005). Compared to the UK, Spanish adolescents also reported engaging in
planned protective behaviours less often (p<.01), but this difference only remained
significant for females (p=.005), but not males (p=.53).
Discussion
The present study investigated the road user behaviour of Spanish adolescents and made
a substantial number of findings which were in agreement with previous research. Firstly,
14
there were considerable similarities in the ordering of the 43 behaviours in the Spanish
sample to those found in both NZ and the UK. The two most frequently reported
behaviours (“Looking both ways before crossing the road” & “Check to make sure traffic
has stopped before using a pedestrian crossing”) were also the two most frequently
reported in both the UK and NZ samples. There was also a high degree of similarity in
the behaviours which were least frequently reported, with the lowest five in Spain and
NZ being exactly the same and four of the five also being the lowest in the UK sample.
There were, however, a number of differences between the three countries, with the
Spanish adolescents reporting a much lower level of cycle helmet use than the NZ
adolescents (using a cycle helmet is a legal requirement in NZ). In contrast, the Spanish
adolescents engaged more often, than the English and NZ adolescents, in the behaviour
“Cross whether traffic is coming or not, thinking the traffic should stop for you”. This is
an interesting finding and possibly points to evidence of a cultural difference with the
other two English speaking countries, where this behaviour is less common.
Although the bottom five behaviours were reported infrequently, in total 15% of Spanish
adolescents reported that they “Play “chicken” by deliberately running out in front of
traffic” at some stage. Very similar proportions were also found for the other four least
frequently reported behaviours. These findings are particularly disturbing, as safety
experts rated these five behaviours as being extremely risky (Elliott & Baughan, 2003).
The challenge for road safety experts, therefore, is to continue to reduce the number of
adolescents (and other road users) engaging in these five very dangerous behaviours,
along with other potentially risky behaviours, while at the same time promoting self-
protective behaviours.
15
The present research also found that confirmatory factor analysis of the Spanish ARBQ
broadly supported the original three factor solution found in the UK sample (Elliott &
Baughan, 2004). However, unfortunately it was not possible to produce a satisfactory fit
for the three factor model with 43 items. In contrast, satisfactory goodness of fit indices
were obtained for the short 21-item scale. This finding is very important, as the much
shorter 21-item scale is a more practical research tool which can be used more easily in
combination with other research instruments.
The most obvious feature of the international comparison was the fact that the NZ
adolescents (both male and female) reported substantially higher engagement in planned
protective behaviours than the Spanish and UK adolescents. This seems to be mainly due
to the high level that NZ adolescents reported using a cycle helmet, as none of the other
items which comprised this factor differed substantively. Another notable feature is the
fact that Spanish males appear to engage in more negative behaviours (unsafe crossing &
dangerous playing on the road) and less positive behaviours (unplanned protective
behaviours) than NZ males. The Spanish females also engaged in planned protective
behaviours less often than the UK and NZ females. Perhaps this is related to lower risk
perceptions or higher levels of some other individual differences (e.g. sensation seeking)
which are related to risky behaviours and engagement in protective behaviours.
Regardless of the cause, this finding should be concerning for Spanish safety authorities,
as the rate at which Spanish 1-14 year olds are killed on the roads (4.0/100,000) is
considerably higher than in the UK (2.9/100,000) (UNICEF, 2008). Therefore, the
challenge for Spain should be to equal, or better, the fatality statistics of the UK.
16
The relationships the ARBQ factors had with age and gender also showed a high degree
of similarity with previous research, particularly that from the UK. The pattern of
findings by gender directly replicated Elliott & Baughan´s (2004) findings, in that males
reported significantly higher levels of unsafe crossing behaviour and dangerous playing
on the road, but there was no difference between males and females on the planned
protective behaviour factor. These findings also largely agree with the NZ research, in
there being no gender difference on the planned protective behaviour factor and that
males reported more dangerous playing on the roads (Sullman & Mann, 2009).
The finding that males engage in more risky on road behaviours in Spain, England and to
some extent NZ is also in agreement with previous research using different instruments
(e.g. BRAKE, 2004; Byrnes, Miller & Schafer, 1999; Granié, 2007; Morrongiello &
Dawber, 1999; Waylen & McKenna, 2008; West et al., 1998). Moreover, these findings
are also supported by the accident statistics, which have shown that most of the
adolescents killed and injured on the roads are male (e.g. DFT, 2008; DGT, 2007;
Poudel-Tandukar Nakahara, Ichikawa, Poudel, & Wakai., 2006; Sullman & Mann, 2009;
Twisk, 2007).
The relationships the three ARBQ factors had with age were also very similar to those
previously found amongst English adolescents (Elliott & Baughan, 2004). In agreement
with the English research this study found age differences on all three factors, with
unsafe road crossing increasing with age, while playing on the roads and protective
behaviours both decreased with age. These findings may appear to be counter intuitive, as
in most areas of road safety, risky behaviours decrease with age. However, the increase in
unsafe road crossing behaviour and reduced engagement in personal protective
17
behaviours may be partially explained by the fact that at this time in a child’s life their
exposure to risk increases, while the amount of adult supervision decreases (Lynam &
Harland, 1992). In contrast to the other two factors, dangerous playing on the road
decreased with age. Therefore, the present research seems to highlight the need for safety
interventions to target males, in general, and the two older age groups in order to increase
their personal protective behaviours and to reduce their engagement in unsafe road
crossing behaviour. Furthermore, the road safety countermeasures need to target
dangerous playing on the road amongst the 12-13 year olds.
Although it may appear reasonable to argue that safety improvements would eventuate by
making positive changes in the three types of behaviours measured by the ARBQ, future
research is needed to investigate whether the three ARBQ factors are related to important
safety outcome measures, such accidents and near misses. This would be an obvious way
to clearly demonstrate that making positive changes in the behaviours measured by the
ARBQ would lower the adolescents’ risk of being killed or injured on the road.
Furthermore, although understanding the relationships the ARBQ factors have with
demographic variables is potentially useful for targeting road safety interventions, it does
not identify the causes of these behaviours. Therefore, future research is needed into the
psychological precursors of the three types of ARBQ behaviours. Thrill seeking
behaviour, unrealistic optimism and mild social deviance have all been shown to be
associated with risky behaviours in other domains (e.g. Scott-Parker, Watson, & King,
2009; Sullman, Meadows, & Pajo, 2002; Waylen & McKenna, 2008; West et al., 1998)
and may prove to be useful starting point. A more clear understanding of the
psychological mechanisms underlying these behaviours may assist in the development of
methods to influence adolescents’ on road behaviour.
18
The study reported here clearly had a number of methodological limitations. The most
obvious is the possibility of sampling bias. As all participants attended secondary schools
in the city of Girona, it is possible that they differ significantly in some way from the
general population of Spain. However, confidence in this data can be drawn from the fact
that a large number of the results were similar to those found in the NZ and UK research,
both of which used less regionally focused samples.
In summary, this research has confirmed the applicability of the ARBQ to Spain, a
country and culture which is more distinctive than the UK and NZ. The present study
supported the factor structure of the 21-item scale, and found that Spanish males were
more likely than females to engage in unsafe road crossing behaviour and dangerous
playing on the road. This research also found that younger Spanish adolescents engaged
more often in dangerous playing on the roads, while older adolescents were more likely
to put themselves at risk by failure to elicit personal protective behaviours, or by
engaging in unsafe road crossing behaviours. Overall, the present study concludes that
the ARBQ appears to be a useful framework for investigating the behaviour of
adolescents on the road.
Acknowledgements
The authors would like to thank the schools and pupils that participated in the study.
19
References
BRAKE (2004). Hard facts – statistics and research: Survey of 11-14 year olds.
(http://www.brake.org.uk/)
Byrnes, J., Miller, D., Schafer, W. (1999). Gender differences in risk taking: A meta-
analysis. Psychological Bulletin, 125, 367-383.
DFT (2008). Child Fact Sheet - Child Casualties in Road Accidents Great Britain: 2006
Retrieved from the World Wide Web July 7 2008 from
http://www.dft.gov.uk/162259/162469/221412/221549/227755/328843/childfact20
06.pdf
DGT (2007). Anuario estadístico de accidentes 2006. Retrieved from the World Wide
Web
http://www.dgt.es/was6/portal/contenidos/documentos/seguridad_vial/estadistica/ac
cidentes_30dias/anuario_estadistico/anuario_estadistico001.pdf
Elliott, M.A., & Baughan, C.J. (2004). Developing a self-report method for investigating
adolescent road user behaviour. Transportation Research Part F, 7, 373-393.
European Commission (2008). Road Safety Scoreboard. Retrieved July 7 2008 from the
World Wide Web
http://ec.europa.eu/transport/roadsafety_library/scoreboard/scoreboard.pdf
Granié, M-A. (2007). Gender differences in preschool children’s declared and
behavioural compliance with pedestrian rules. Transportation Research Part F, 10,
371-382.
Hair, J.F., Anderson, R.E., Tatham, R.L. & Black, W.C. (1999) Análisis Multivariante.
Prentice-Hall: Madrid.
20
Hofstede, G. (2008). Geert Hofstede Cultural Dimensions. Retrieved July 10 2008 from
the World Wide Web http://www.geert-
hofstede.com/hofstede_dimensions.php?culture1=83&culture2=63
Lynam, D., & Harland, D. (1992). Child pedestrian safety in the UK. Berlin: VTI/FERSI
Conference.
Morrongiello, B., & Dawber, T. (1999). Parental influences on toddlers’ injury-risk
behaviors: Are sons and daughters socialised differently? Journal of Applied
Developmental Psychology, 27, 227-251.
Poudel-Tandukar, K., Nakahara, S., Ichikawa, M., Poudel, K.C., & Wakai, S. (2006).
Relationship between mechanisms and activities at the time of pedestrian injury and
activity limitation among school adolescents in Kathmandu, Nepal. Accident
Analysis & Prevention, 38, 1058-1063.
Scott-Parker, B., Watson, B., & King, M. J. (2009). Understanding the psychosocial
factors influencing the risky behaviour of young drivers. Transportation Research
Part F, 12, 470-482.
Sullman, M.J.M., & Mann, H. (2009). Adolescent Road User Behaviour amongst New
Zealand Adolescents. Transportation Research Part F, 12, 494-502.
Sullman, M.J.M., Meadows, M.L., & Pajo, K. (2002). Aberrant driving behaviours
amongst New Zealand truck drivers. Transportation Research Part F, 5, 217-232.
Twisk, D. (2007). Jóvenes conductors: el camino hacia la seguridad. In: Real Automóvil
Club de Cataluña (ed.). Jóvenes y conducción: un derecho y una responsabilidad.
Barcelona: RACC.
Thomson, J. A., Tolmie, A., Foot, H. C., & Mclaren, B. (1996). Child development and
the aims of Road Safety Education: A Review and Analysis. Road Safety Research
Report No.1, Department of Transport, UK.
21
UNICEF. (2001). A League Table of Child Deaths by Injury in Rich Nations. Retrieved
July 10 2008 from the World Wide Web http://www.unicef-icdc.org
Waylen, A.E., & McKenna, F.P. (2008). Risky attitudes towards road use in pre-drivers.
Accident Analysis & Prevention, 40, 905-911.
West, R., Train, H., Junger, M., Pickering, A., Taylor, E., & West, A. (1998). Childhood
accidents and their relationship with problem behaviour. DETR Report No 7.
London: The Stationery Office.
22
Table 1
ARBQ behaviour items means and standard deviations for Spain, NZ & English
No. Item (How often do you…) Spain NZ England
M SD M SD M SD
1 Look both ways before crossing the road 4.07 1.08 4.17 .95 4.08 1.07
2 Check to make sure traffic has stopped before using a pedestrian
crossing 3.67 1.15 3.73 1.15 3.46 1.30
3 Cross at a place that is well lit when it is dark 3.48 1.18 3.13 1.08 3.32 1.16
4 Keep looking and listening until you get all the way across the road 3.34 1.24 3.24 1.17 3.26 1.26
11 Forget to look properly because you are talking to friends who are
with you 3.05 1.12 2.80 1.06 2.65 1.15
10 Cross between parked cars when there is a safer place to cross
nearby 2.92 1.07 2.88 1.03 2.66 1.16
26 Use a crossing monitor where there is one available 2.92 1.35 3.27 1.27 2.06 1.20
6 Get part way across the road and then have to run the rest of the
way to avoid traffic 2.88 1.04 3.01 1.04 2.82 1.14
8 Not bother walking to a nearby crossing to cross the road 2.85 1.14 3.10 1.13 2.72 1.22
12 Walk in single file on roads without pavements 2.81 1.41 2.40 1.16 2.54 1.38
17 Cross from behind a stationary vehicle 2.79 1.12 2.83 1.05 2.35 1.17
7 Cross without waiting for the “green man” 2.76 1.58 2.42 1.23 2.76 1.25
9 See a small gap in traffic and “go for it” * 2.73 1.13 3.14 1.08 2.69 1.30
23
No. Item (How often do you…) Spain NZ England
M SD M SD M SD
16 Make traffic slow down or stop to let you cross 2.66 1.14 2.22 1.05 2.43 1.24
21 Not look because you cannot hear any traffic around 2.59 1.23 2.65 1.16 2.25 1.22
29 Cross whether traffic is coming or not, thinking the traffic should
stop for you 2.55 1.23 2.15 1.12 1.99 1.21
13 Walk facing the traffic when on roads without pavements 2.51 1.23 2.89 1.19 2.51 1.36
15 Forget to look properly because you are thinking about something
else 2.46 1.01 2.47 0.99 2.44 1.08
5 Use lights on your bike when it is dark 2.37 1.56 2.64 1.53 2.84 1.62
24 Not notice a car pulling out (say from a driveway) and walk in front
of it? 2.36 1.09 2.30 1.03 2.20 1.03
23 Walk in the road rather than on the pavement? 2.29 0.96 2.41 1.00 2.22 1.07
18 Have to stop quickly or turn back to avoid traffic 2.27 1.01 2.23 0.94 2.34 1.07
14 Cross when you cannot see both ways very well (like on a bend or
top of hill) 2.25 0.96 2.45 0.94 2.49 1.10
19 Think it is OK to cross safely, but a car is coming faster than you
thought 2.17 0.98 2.38 0.92 2.34 1.12
25 Run across a road without looking because you are in a hurry 2.17 1.07 2.10 1.04 2.20 1.22
27 Wear a cycle helmet when riding a bike 2.03 1.41 3.70 1.40 2.03 1.40
28 Use a mobile phone and forget to look properly 2.01 1.04 2.07 1.15 2.03 1.15
30 Climb over barriers or railings that separate the road from the 1.95 1.08 1.94 1.09 1.97 1.21
24
No. Item (How often do you…) Spain NZ England
M SD M SD M SD
pavement
20 Hang around in the road talking to friends 1.90 1.00 2.43 1.15 2.27 1.23
22 Run around on the road (e.g. when playing cricket or football) 1.80 1.04 2.21 1.14 2.24 1.29
35 Wear bright or reflective clothing when riding a bike in the dark* 1.78 1.23 1.95 1.26 1.79 1.24
31 Not notice an approaching car when playing games in the road 1.76 0.93 2.21 1.24 1.93 1.11
32 Run into the road to get a ball, without checking for traffic 1.76 0.95 1.83 0.96 1.87 1.09
34 Ride on a skateboard (or roller-skates/roller-blades) in the road* 1.72 1.04 1.68 1.05 1.85 1.26
36 Wear reflective clothing when out on foot in the dark* 1.58 1.00 1.69 1.04 1.67 1.07
39 Wear reflective clothing when crossing a road* 1.41 0.80 1.60 0.91 1.49 0.93
33 Cross less than an hour after drinking alcohol* 1.46 0.91 1.58 0.97 1.87 1.28
41 Hold on to a moving vehicle when riding a bike* 1.42 0.92 1.36 .82 1.36 .89
38 Ride out into the road on a skateboard without thinking to check for
traffic* 1.31 0.71 1.36 .73 1.50 .95
43 Play “chicken” by lying down in the road and waiting for cars to
come along* 1.27 0.74 1.35 .87 1.35 .89
37 Deliberately run across the road without looking, for a dare* 1.24 0.66 1.34 .81 1.51 .95
40 Hold on to a moving vehicle when riding a skateboard/roller-
skates/roller-blades* 1.24 0.68 1.35 .81 1.38 .91
42 Play “chicken” by deliberately running out in front of traffic* 1.23 0.68 1.33 .77 1.36 .88
Note: Scale ranges from 1=Never to 5 = Very Often; * reversed for all subsequent analyses.
25
Table 2
Summary of goodness of fit indices for the CFA models
Model X2 (Satorra-Bentler) NNFI SMRM RMSEA C.I. 90%
First model fitted* 4247.2
ν= 857
.96 .11 .060
p<.01
.058 : .061
Second model fitted** 1846.3
ν= 846
.97 .09 .056
p<.01
.046 : .066
Third model fitted*** 1764.2
ν= 186
.96 .09 .064
p<.01
.061: .067
Fourth model fitted**** 661.3
ν= 179
.98 .08 .037
p =1
.034: .040
* 43 items with all the errors uncorrelated
** 43 items with 11 error covariances added.
*** 21 items with all the errors uncorrelated
****21 items with 7 error covariances added.
26
Table 3
Error correlations between pairs with similar contents within the same factor for the
second model.
Pairs of items Error correlation
11 and 15 0.062
11 and 28 0.072
15 and 28 0.046
34 and 38 0.097
34 and 40 0.159
34 and 42 0.051
38 and 40 0.093
38 and 42 0.045
38 and 43 0.022
40 and 41 0.187
41 and 42 0.125
27
Table 4
Error correlations between pairs with similar contents within the same factor for the
fourth model.
Pairs of items Error correlation
5 and 27 0.188
11 and 15 0.030
32 and 38 0.037
34 and 38 0.064
34 and 40 0.089
38 and 40 0.081
40 and 41 0.125
28
Table 5
Factor loadings from the confirmatory factorial analysis
Item No. Item Factor loading
Factor 1. Unsafe road crossing behaviour construct reliability coefficient = .74
25 Run across a road without looking
because you are in a hurry.
.71
9 See a small gap in traffic and “go for it.” .60
6 Get party way across the road and have to
run the rest of the way to avoid traffic.
.58
19 Think it is OK to cross safely, but a car is
coming faster than you thought.
.55
15 Forget to look properly because you are
thinking about something else.
.49
11 Forget to look properly because you are
talking to friends who are with you.
.49
10 Cross from between parked cars when
there is a safer place to cross nearby.
.42
29 Cross whether traffic is coming or not,
thinking the traffic should stop for
you.
.41
Factor 2. Dangerous playing crossing behaviour construct reliability coefficient = .85
42 Play “chicken” by deliberately running
out in front of traffic.
.92
43 Play “chicken” by lying down in the road
and waiting for cars to come along.
.86
29
37 Deliberately run across the road without
looking, for a dare.
.86
40 Hold on to a moving vehicle when riding
a skateboard/ roller-skates/roller-blades.
.80
41 Hold on to a moving vehicle when riding
a bike.
.68
38 Ride out into the road on a skateboard
without thinking to check for traffic.
.63
32 Run into the road to get a ball, without
checking for traffic.
.60
34 Ride on skateboard (or roller-
skates/roller-blades) in the road.
.38
Factor 3. Planned protective behaviour construct reliability coefficient = .70
36 Wear bright or reflective clothing when
out on foot in the dark.
.84
39 Wear reflective clothing when near the
road.
.80
35 Wear bright or reflective clothing when
riding a bike in the dark.
.66
27 Wear a cycle helmet when riding a bike. .42
5 Use lights on your bike when it is dark .34
30
Table 6
Means of the three types of road user behaviours, by age and gender
Factor 12 – 13
Mean (SD)
14 -15
Mean (SD)
16-17
Mean (SD)
Unsafe road crossing behaviour Male 2.56 (.64) 2.72 (.65) 2.73 (.70)
Female 2.47 (.60) 2.60 (.66) 2.70 (.56)
Dangerous playing in the road Male 1.60 (.67) 1.56 (.65) 1.47 (.62)
Female 1.32 (.36) 1.25 (.42) 1.22 (.40)
Planned protective behaviour Male 2.01 (.85) 1.76 (.78) 1.68 (.80)
Female 2.04 (.89) 1.79 (.80) 1.59 (.60)
31
Table 7
International comparison by gender
Factor Males Females Total
sample
Spain NZ UK Spain NZ UK Spain NZ UK
Unsafe road
crossing
behaviour
2.67
(.65)
2.57
(.60)
2.53
(.83)
2.56
(.63)
2.63
(.59)
2.41
(.75)
2.61
(.64)
2.60
(.60)
2.47
(.79)
Dangerous
playing in the
road
1.57
(.66)
1.50
(.65)
1.66
(.78)
1.27
(.39)
1.41
(.60)
1.35
(.54)
1.42
(.56)
1.45
(.63)
1.51
(.69)
Planned
protective
behaviour
1.85
(.82)
2.33
(.84)
1.87
(.83)
1.86
(.82)
2.30
(.90)
1.93
(.86)
1.85
(.82)
2.31
(.87)
1.90
(.85)
Note: NZ means were recalculated using the same items as the Spanish factors
32
Figure 1
Confirmatory factor analysis of the 21-item ARBQ
Unsafe road
crossing
Dangerous
playing
Protective
behaviour
15
11
29
19
10
25
6
9
38
43
32
42
37
40
41
34
27
5
39
36
35
e 15
e 11
e 29
e 10
e 19
e 6
e 9
e 25
e 43
e 42
e 37
e 40
e 41
e 34
e 38
e 32
e 39
e 36
e 35
e 27
e 5