the peaking of world oil
TRANSCRIPT

1
Congressman Roscoe Bartlett
Congressional Record
THE PEAKING OF WORLD OIL
House of Representatives
February 8, 2006
@9:15 pm
[Page: H207]
---
The SPEAKER pro tempore (Mr. Campbell of California). Under the Speaker's announcedpolicy of January 4, 2005, the gentleman from Maryland (Mr. Bartlett) is recognized for 60minutes.
Mr. BARTLETT of Maryland. Mr. Speaker, sometime ago, our Department of Energycommissioned a study with SAIC, Science Applications International Corporation, to do a studyon the peaking of world oil production, impacts mitigation, and risk management. This veryprestigious scientific organization took some time to complete this study; and when theycompleted it, they made a recommendation to the Congress and to the Department of Energy.Part of what they said in their recommendation is included here:

2
``The peaking of world oil production presents the U.S. and the world with an unprecedentedrisk management problem.''
That is quite an adjective to use. No risk problem like this ever in the history of the world iswhat they are saying: ``..... unprecedented risk management problem. As peaking is approached,liquid fuel prices and price volatility will increase dramatically. And without timely mitigation,the economic, social, and political cost will be unprecedented.''
Again, Mr. Speaker, they are pointing out, and they will use these words in a chart I will have alittle later, that the world has never faced a problem like this.
``Viable mitigation options exist on both the supply and demand side, but to have substantialimpact they must be initiated more than a decade in advance of peaking.''
When will peaking occur? Do we have a decade? And they are saying if we do not have adecade, we're going to have problems. Dealing with world oil production peaking will beextremely complex, involve literally trillions of dollars, and require many years of intense effort.
Our next chart, which speaks to the same phenomenon, inspired 30 of our leaders, BoydenGray, McFarland, James Woolsey, and about 27 others, many of them four-star retired admiralsand generals, to write a letter to the President.

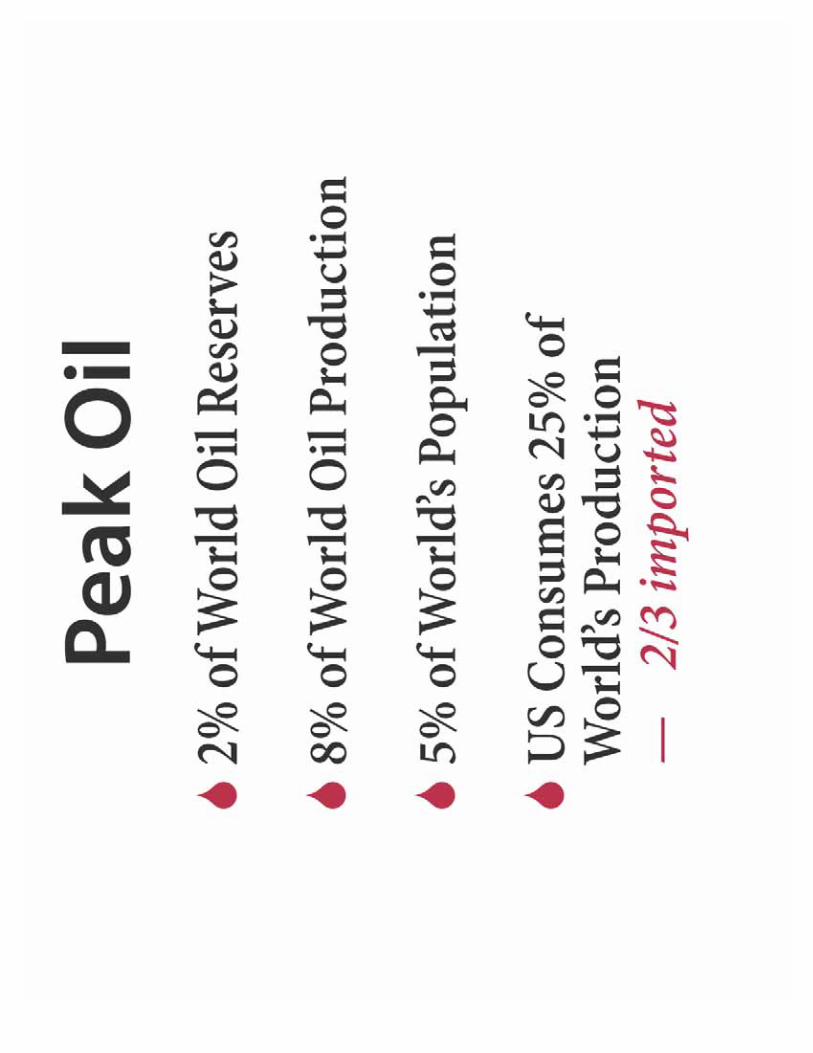
3
In that letter they said, Mr. President, the fact that we have only 2 percent of the world oilreserves, that we use 25 percent of the world's oil, and we import almost two-thirds of what weuse represents a totally unacceptable national security risk. Mr. President, we need to dosomething about that.
Two other numbers here are of significance. We represent a bit less actually than 5 percent ofthe world's population, about one person out of 22. And in spite of the fact that we have only 2percent of the world oil reserves, we produce about 8 percent of the world's oil. We need to keepthis in mind for some of the later charts we are going to show, because what this means is thatwe are pumping our little reserves, only 2 percent, four times faster than the rest of the world.
If we were pumping it as fast, with 2 percent of the reserves, we would be producing 2 percentof the production; but we are producing 8 percent. So if the world is going to run into troublewith decreasing amounts of oil, Mr. Speaker, we are going to get there first because we arepumping our oil more rapidly.
How did we get here? The next chart speaks to that, and we need to go back about six decades.
(FSU) – Former Soviet Union

4
There was a scientist by the name of M. King Hubbert, who worked for the Shell Oil Company;and he noted the exploitation and exhaustion of individual oil fields. We would find an oil field,we would start pumping, and the oil field would reach a maximum production. And then after themaximum production, at about half of its total ultimate production, it would start falling off. Nomatter how hard they pumped, it would produce less and less oil, until finally the field peteredout.
He rationalized that if he knew how many oil fields there were in the United States and roughlywhat their reserves were, and if he could predict how many new oil fields the United Stateswould find, he could then add up all these little bell curves and he would get a big bell curvewhich would tell him when the United States was going to peak in oil production. So he did thatin a paper in 1956, and he wrote in that paper that with this analysis he predicted that the UnitedStates would peak, and that was the lower 48 at that time, that the United States would peak inoil production and consumption of our own oil about 1970.
Right on schedule, and some authorities will say 1970 and some will say 1971, but as this chartshows, the smooth green curve here was his prediction peaking about 1970, and the more raggedlarge green symbols represent the actual production, which pretty much followed his curve. Andit did peak, as you can see, at about 1970; and it has been downhill since then.
By 1980, we knew very well that we were downhill, and the early Reagan years provided a lotof incentives for drilling. There were a lot of oil wells drilled in our country. Notice the tinyincrease from that. It simply brought us back to the curve that had been predicted by M. KingHubbert.
Now, the red curve here is the curve for the Soviet Union. They had more oil than we, and theypeaked higher than we. And when the Soviet Union fell apart, you see that they broke away fromthe predicted decline. They are now going to have a second little peak here, and then it will befalling off. They will never get back to their earlier peak of oil production.
The next chart shows some detail about where our oil has come from through the years.

5
And if you are looking only at the lower 48, you are going to be following this curve. And if youadd to it the liquids that we are getting from gas, you will see that it still followed Hubbert'scurve. It peaked in 1970 and then fall off.
But we found a lot of oil in Alaska. As a matter of fact, I have been there, Mr. Speaker, at milezero, at Dead Horse, Prudhoe Bay. And through that pipeline has come for the last several yearsa fourth of all of our domestic production. But notice that in spite of that enormous find of oil inPrudhoe Bay, there was just a little blip on the downside of Hubbert's peak.
This yellow here on the chart is very interesting. That, you may remember, Mr. Speaker, wasthe fabled Gulf of Mexico oil discoveries. I remember how that was hyped. That was going tosave us. There was plenty of oil there.
That was all it did, Mr. Speaker. It hardly slowed us down. In terms of the total amount that wewere producing,
[Page: H208]
you can hardly see any effect of the Gulf of Mexico oil discovery.
We were thinking about that discovery and those wells in the recent hurricane. There are 4,000wells in the Gulf of Mexico. By the way, Mr. Speaker, that is about 10 times as many wells asthere are in all of Saudi Arabia. We have about 530,000 oil wells in our country, about 80percent of all the oil wells drilled in all the world. Maybe that is why we are able to produce oilfrom our reserves relatively four times faster than the rest of the world.
The next chart looks back through history, and it shows two things.

6
It shows two curves, one superimposed on the other. One of the curves is the discovery curve,and this shows when we found the big oil fields starting way back in the 1930s, and then a lot ofthem in the 1940s, and some big oil fields found in the 1950s. But notice that this follows kind ofa curve like so, and it peaks at about 1970, and it has been falling off ever since that. In spite ofvery large profits from the oil companies, they are not finding much more oil.
I might note, Mr. Speaker, that the profits for the oil companies was inevitable. They do not setthe price of oil. Chevron and BP and ExxonMobil, they do not set the price of oil. The price ofoil is set by you and me and all the other roughly 7 billion people in the world who use oil.
[Time: 21:15]
We set the price by our demand relative to the supply. As supply has fallen off in the lastseveral years, the price has gone up. Oil companies that were making money at $25 a barrel, howmuch more money do you think they will make when oil is $65 a barrel? We should not becarping about how much money they make; what we should be looking at is how responsiblythey use the profits they make.
Some of those profits need to be invested in finding new oil fields, but the experts do not thinkthere is much more to find.
Several Congresses ago I was chairman of the Energy Subcommittee on Science, and I wantedto determine the dimensions of the problem. We had the world's experts in to talk about howmuch oil is out there that we can realistically pump. There was general agreement, quitesurprising agreement, that it is roughly 1,000 gigabarrels. Giga is used because in Europe abillion is not our billion so if you say billion, not everybody will understand it. So giga means abillion, and it means the same thing around the world.
A thousand gigabarrels is about a trillion barrels of oil. That may sound like a lot, but it isabout the amount of oil that we have pumped so far in all of history. If you divide the 84 billionbarrels a day that we are using today into that trillion barrels of oil, it comes out to about 40years. Most of the experts believe we have found about 95 percent of all of the oil we will find.We now have very sophisticated seismic techniques with 3-D computer modeling. This is whatthey believe will be found, this gray-shaded area over here. It is not going to follow that smoothcurve, but on average that is how much they think we will find.
The solid black line here represents the amount of oil we have been using. Up until about 1980,we always found more oil than we were using. There was always a big reserve out there. Since1980, we have found less and less oil, and we have been using more and more oil. We have beenable to do that because we are now using up some of these reserves we found before.
All of the oil that we can use has to be all the oil that is there. If you have not found it, youcannot pump it. So you make your own judgment how much oil you think we are going to find inthe future, then you add that to the reserves back here. That is going to be the area under thiscurve from now on.

7
By the way, this 40 years that I mentioned, that is not a plateau. You do not plateau out for 40years and then fall off a cliff. It is going to follow that typical bell curve of every oil field. By theway, 33 of the top 45 oil-producing countries have now peaked. It is only a few that have notpeaked.
What will this curve look like from here on? We can change the shape. If we use some of ourgood recovery enhancement techniques, we can pump oil a little faster, and we may pump a littlemore, so we may get a little more out of these fields than depicted here. This is not all of the oilin the fields because probably half of the oil there will not get pumped because it is so difficult toget, it is going to cost more energy to get the oil than you get out of the oil. So you get to thepoint of you stop getting the oil. As the old farmer said, at that point ``the juice ain't worth thesqueezing,'' so we stop trying to get oil at that point.
The next chart shows a simple schematic that depicts the problem and where we are.
Everybody may not agree this is where we are. Most of the people that have thought about peakoil think we are here or will shortly be here. This is a 2 percent growth curve. With 2 percentgrowth, that doubles in 35 years. This point is twice that point, and so this is a 35-year periodfrom here to here.

8
Notice what this chart points out is that you start having a problem before peaking because theexponential use curve, the demand curve keeps going up like this, whereas when we reach peakoil, it will of necessity level off, and then no matter what we do, it will inexorably go downhillafter that. It does for individual oil fields. It has for the United States.
By the way, the same M. King Hubbard that predicted we would peak in about 1970, he wasright on. He predicted that the world would peak about now. If he was right about the UnitedStates, maybe he is right about the world, and maybe we should have been paying some attentionto that.
I would submit that we have now, in common parlance, we have blown 25 years when weknew very well M. King Hubbard was right about the United States. If he was right about theUnited States, would not it have been prudent to recognize that maybe he just might be rightabout the world? If he is right about the world, the world is about to peak in oil production now,then we should have been doing something during these last 25 years so this would be asmoother transition.
The next chart shows us the alternatives.
• Potential Alternative Solutions
o Finite Resources:
Tar Sands Oil Shale Coal Nuclear Fission Nuclear Fusion
o Renewable Resources:
Solar Wind Geothermal Ocean Energy Agricultural Resources:
• Soy/Biodiesel
• Ethanol
• Methanol
• Biomass
Waste to Energy Hydrogen from Renewables

9
As the world peaks in oil production, we are going to have to, first of all, turn to some finiteresources, and we are now doing that. I will chat for a moment about those. And those will notlast forever. They are finite, as the word implies, except for nuclear, which is kind of different.The only nuclear that is finite is light water reactors that use fissionable uranium. If we go tobreeder reactors, as the term implies, you make more fuel than you are using, and that could goon and on. You have to accept the problems you buy there with the enrichment and moving fuelaround that could make bombs and so forth.
Of course, the one thing that gets us home free is nuclear fusion. If we could harness the kindof energy that the sun sends down to us every day, we are home free. But, Mr. Speaker, the oddsof our doing that are a bit like you or me solving our personal economic problems by winning thelottery. That would be nice, and by the way, I do not play the lottery, but I do not think thatrational people count on solving their economic problems by winning the lottery, and neither do Ithink that we should count on solving our energy problems of the future by nuclear fusion. Thatdoes not mean I do not support it. I vote every year for all of the money, $250 million or so, thatwe put into that, because we have to try. If we do not successfully harness nuclear fusion, wehave a really challenging road ahead.
Let us look at these finite resources and what kind of potential we can expect from them. Thereis a lot of suggestion today about the tar sands up in Alberta, Canada. There are enormousreserves there. The reserves there are at least as large of all of the oil reserves in all of the world.Then what we are worrying about? Well, because it is there does not necessarily mean that wecan harness it in enough quantities or soon enough to really make a big contribution.
As an example, Mr. Speaker, every day the Moon goes around the Earth roughly in a day, andit lifts the oceans about 2 feet. That is an incredible amount of energy. I carry two gallon bucketsof water and lift them up, that is a lot of energy. If we could harness the energy of the tides, wewould be home free. There is an old adage that says energy to be effective must be
[Page: H209]
concentrated, and because those tides are spread out over all of the oceans of all of the world, itis difficult to harness them.
The tar sands are a little like that. There is an incredible amount of energy there, and theCanadians are working very hard at harnessing that. Let me see if I can remember the numbers. Ithink they have a shovel in Alberta, Canada, that lifts 100 tons at a time and dumps it into a truckthat carries 400 tons, and I think those are the right numbers. It carries them to a place wherethey are cooked, because the oil in those tar sands is a bit better, but kind of like the oil in yourasphalt road. If you put a blow torch on an asphalt road and mix it with some lighter fuels, it willflow. That is kind of like what we are doing with the tar sands. They are working very hard, andthey are producing a million barrels a day. We will talk in just a moment about energy profitratio. They are making a lot of dollars doing that because it costs them less than $30 a barrel tomake it. The oil is now bringing $60-some a barrel, so the dollar-profit ratio is up there. They areusing, I have heard, maybe more energy from natural gas to produce the oil than they are gettingout of the oil. That makes good sense for them because they have natural gas there, and it is hardto ship, and it is relatively cheap, and the oil is easy to ship and in high demand at $60-some abarrel.

10
Mr. Speaker, by the end of the day, we really need to be thinking about energy profit ratiobecause that is what will be telling. They are now producing a million barrels a day, and if theywork real hard, they will be producing 2 million barrels a day in 5 years. Big deal.
The world today is using 84 million barrels a day, and if they work really hard, 10 years fromnow they will be producing 3 times as much as today, 3 million barrels a day, but the worldwould like to be using another 40 million barrels a day. I do not think it will be there, but if youproject our current demand for those 10 years, we would like to be using another 40 millionbarrels of oil, and they will be producing another 2 million barrels of oil, \1/20\ of the additionaloil the world would like to use. Although there is a lot of energy there, and I am sure that we willfind techniques to get it out that have some energy profit ratio so there will be energy there for along time, but it is not going to be available anywhere near the quantities needed to meet theneeds of contending with the crisis that will occur with peak oil.
Now, the oil shales in our country are very much the same thing. Recently you may have readof an experiment out in Colorado. I think it was Shell Oil Company that devised a new techniquefor getting the oil out of the oil shales, which is like the oil in the tar sands. It is very thick andwill not flow.
What they did to avoid polluting the groundwater was drill a series of holes in a circle, andthen they froze the ground because the oil will not move through frozen ground. Inside thatfrozen vessel, if you will, they cooked and cooked it for a year. They put steam down and cookedit for a year. After that year, they started sucking on the oil, and for another year they cooked andthey sucked, and they got a pretty meaningful amount of oil out of that.
There is an awful lot of oil in the oil shales, maybe about as much as in the tar sands, but thescale, scaling up for this is incredibly difficult. I am not sure what the energy profit ratio is,because if you have to freeze the perimeter of that big vessel, if that is what you want to call it,and then you have to cook it for a couple of years, obviously you are putting a lot of energy in.They believe they got more energy out than they put in. But still, the energy profit ratio is notgoing to be enormous. Even if you can make that attractive, you still have the problem of scale.With the world using 84 billion barrels of oil a day, you have to have a lot of a million here, amillion there before it adds up to what we are using.
Coal, you may hear people do not worry about energy, we have 500 years of coal. That is nottrue. At current use rates, we have about 250 years of coal. That is a long time, so why are weworrying? If we have 250 years of coal at current use rates, and obviously you can do with coalwhat we do with oil. Hitler did it. When we denied him access to oil, he made oil out of coal.When I was a little boy, the lamps that we call kerosene lamps today, we called them coal oillamps because they were filled with oil, made from oil. So if you must use coal, if you havegreater demand than we use today, that 250 years quickly shrinks. I have a chart a little later thatshows that. But it quickly shrinks to about 85 years, and if you have to use some of the energy toconvert the coal since you cannot have a trunkload of coal in your car, the energy to do that nowshrinks that supply. There is only a 2 percent growth rate, and I think we will have to use it atmuch more than 2 percent growth rate, and it shrinks it to 50 years. So we have to husband thatresource very wisely.

11
We have already chatted briefly about nuclear fission and nuclear fusion. Today we produce 20percent of our electricity from nuclear. France produces 75 or 80. If you have some concernsabout nuclear power, when you drive tonight note that every fifth business and every fifth housewould be dark if were not for nuclear energy.
[Time: 21:30]
One-fifth, 20 percent, of all the electricity in our country comes from nuclear. Well, once theseare gone, and they will be gone, except nuclear breeder reactors, as many of those as we want tohave and maybe, maybe if we are lucky nuclear fusion. But we will transition, Mr. Speaker,whether we like it or not, as the world runs out of oil, we will transition to the renewables. Whatare they? They are solar and wind and geothermal. Geothermal is when we tap into the moltencore of the Earth when we are close enough to that that you can get some heat from that. If yougo to Iceland, there is not a chimney there because all of their energy comes from geothermal.
We are trying very hard, as I mentioned previously, to tap into ocean energy. It is not just thetides. It is the waves. It is the thermal gradients in the ocean, the cold water at the depths, thewarmer water on top, kind of a thermal couple effect that you can get there.
Then there is lots and lots of talk about getting energy from agriculture. Soy diesel, bio diesel,ethanol, methanol, biomass. The President mentioned it in his State of the Union. He said we arehooked on oil and have got to wean ourselves from that, and technology will do it. And he talkedabout some exciting technology, about taking some biomass like soybean stubble and corn stalksand switch grass. What is switch grass? Switch grass is prairie grass, and a lot of it grows. Of theprairie that we did not plow up and let that return to switch grass, it is a big crop every year. Andthey are talking about harvesting that and using something like culling cellulosic ethanol. Webioengineered a little organism that can split cellulose into its requisite glucose molecules. It ismade of sugar. Sure does not taste like sugar. See, because the human's molecules are so closelytied together that the enzymes in our body cannot split them. But these little bioengineeredorganisms can do that, so we break cellulose down to glucose, and then we ferment the glucose,and we get ethanol from it. And there is a lot of talk about that.
And biomass. Waste energy. Burning waste. There is a plant not far from here in MontgomeryCounty, I would be proud to have it by my church. It looks like an office building. You do noteven know it is an incinerator burning trash and producing electricity. They bring the trash in bytruck or train in containers. You do not even see it until it is inside the building and then theydump it. Really interesting to watch it because that trash comes in with all sorts of things in it.They have a crane there that picks it up and drops it to see if there is something evil in it like atank of propane. You would not want to put that in the fire. It might explode. And if they drop itand there is nothing evil-looking in it, they pick it up again and drop it over into the fire. It isreally worth a trip there. And we now get a meaningful amount of energy, as a later chart willshow from waste to energy.

12
Then hydrogen. Many people think that we do not have to worry about energy because wehave got hydrogen. Hydrogen, Mr. Speaker, is not an energy source. Hydrogen is simply a wayof transferring energy from one point
[Page: H210]
to another. It will always cost more energy to make hydrogen than you will get out of thehydrogen. I can say that with some confidence because just as sure as there will never be aperpetual motion machine, we will never suspend the second law of thermodynamics. And thatsays that when you transfer energy from one form to another, you will always loose some energyin that transfer. Why are we so enthusiastic about hydrogen if that is true? It is because hydrogenhas some incredible capabilities. When you burn it, you get water. That is really not verypolluting, is it? And further more, hydrogen is a great thing to put in a fuel cell. And a fuel cellgets twice the efficiency of a reciprocating engine. So I am not depreciating the value of lookingat hydrogen. I am simply pointing out that hydrogen is little more than a battery which takesenergy from one place to another place. As a matter of fact, in a recent hearing, we had threeexperts on hydrogen, and there are three ways that you could transport hydrogen. One is as aliquid. It must be really, really cold, several hundred degrees below zero to keep it as a liquid,which means you have to have a lot of insulation, and even then it is going to boil off, so youhave got to use it faster than that boils off.
The other way to carry it is as a gas. Well, hydrogen is the lightest element we have. Those gasmolecules are really trying to get apart from each other, so it takes a really high pressure vesselto contain hydrogen.
The third way to transport hydrogen is in solid state. You adhere the hydrogen either by someadhesion or by some chemical process. You carry it in a solid state. That is very much like theway we carry electrons in what we call a battery. Hydrogen is a proton plus an electron; and so,and I asked the question, is a hydrogen battery inherently going to be more efficient than anelectron battery? Well, we really need to look at hydrogen, but it is not a salvation to ourproblems.
The next chart looks at the characteristics that we are going to want to find in whateveralternative we turn to, and here we have on the ordinate the energy profit ratio.

13
I have talked about energy profit ratio. That is how much energy you put in compared to howmuch energy you get out. And our big oil fields here, you see, they are up at 60 to one. As amatter of fact, the charts were even higher. Some of those were more than 100 to one. By theway, there were none of those in our country. They exist only in the Middle East and the bigGharwar oil field-the granddaddy of all oil fields is in Saudi Arabia.
And the energy profit ratio is 60. You put in one unit of energy, one BTU, and you get out 60BTUs. The abscissa here is economic effectiveness in transport, that is, how handy is it to use.And we are talking primarily about transportation and liquid fuels, how handy is it to use. Well,oil of course is the handiest thing to use. It is way over here on the right. And it had an enormousenergy profit ratio if it came from the giant oil fields. In 1970, when we peaked, our energyprofit ratio was down here. Now it is harder and harder to get our oil, and so by 1985 the energyprofit ratio had slid down to here. Notice where the energy profit ratio is for tar sands andethanol and that sort of source: way down here, just about zero. In fact, some people think thatthe energy profit ratio for ethanol, the way that it is frequently made, is below zero here, thatmore energy goes into making ethanol from the fossil fuels that made the tractor and plows fieldand makes the fertilizer and so forth than you get out of the ethanol.
Well, here we have some of the other things: hydro, coal fired, nuclear, photovoltaics. Theynow are getting much better. They are moving up in energy profit ratio. Wind machines shouldbe on here too, and they would be about in this same category. So whatever alternative energysource we use, to see how useful it is going to be, we need to put it on this chart: does it have ahigh energy profit ratio, and is it really convenient to use for transportation.
The next chart is one which really has the long look.

14
I like this chart because it is kind of humbling. It kind of puts us and oil and our whole historyinto perspective. Here we have only about 400 years, a little less than 400 years out of 5,000years of recorded history. But for the first 4,600 years not a whole lot happened. And so if youextended this back 4,600 years, it would look very much the same. Very little energy produced.Here you see it. Wood. And then we learned how to use it more effectively. The IndustrialRevolution started here in the early 1800s. We denuded the hills of New England to sendcharcoal to England to make steel. There is a little historic place called Catoctin Furnace up inFrederick County, and we denuded our hills up there to make charcoal for Catoctin Furnace. Andthen we found coal.
Oh, the ordinate here is quadrillion BTUs, how much energy you are producing. And then wefound coal. And boy, look what happened. Look what happened. We really took off. The coalwas very limited in what it could do compared with gas and oil, and the red curve here is gas andoil. And look what happened. It just took off and was reaching for the sky. Notice here theworldwide recession after the Arab-induced oil price spike hikes, worldwide recession, and wedid use less oil. So we can economize. We can be more efficient. We can use less.
I might point out, Mr. Speaker, that the world's population has pretty much followed this. Justthis afternoon I was looking at a chart of world population. Half a billion, a billion people forway back as far as we can look in history. And then we start the Industrial Revolution, and theworld's population took off and it mirrors this. From a half a million, half a billion to a billionpeople up to now nearly seven billion people.
If, in fact we are at peak oil, and almost nobody denies, the most optimistic estimate I haveever seen is that we will reach peak oil at about 2035 or 2036. You know, that is not forever inthe future. Most authorities believe that we are either here or it is very imminent. But if we havereached peak oil, we are about halfway through the age of oil. That is incredible. Out of 5,000years of recorded history, 150 years now we are into the age of oil. In another 150 years we willbe through the age of oil. Our great grandchildren will live then. What will their world be like?We face a lot of really serious challenges.
Mr. Speaker, when I think back, and someone asked me the other day how long I have beenthinking about this subject, and maybe it is because I am a scientist. I knew that the fossil fuelscould not be forever and so maybe 30, 40 years ago, when I was teaching school and doingresearch, I started asking myself that question, what does that mean, not forever? Do we haveanother 10 years, a hundred years, a thousand years? Obviously, it is not going to last forever.But what does that mean? And so I have been following this for 30, 40 years now.
The next chart looks at something that I have spoken briefly about and that is coal.

15
And some will tell you, and I have heard a lot of people who ought to know better say, do notworry, we have got 250 years of coal. That is true, at current use rates. But if you start increasingcoal only 2 percent a year, you know, Albert Einstein was asked after the discovery of nuclearenergy, what is next? What is the most powerful force in the universe, Dr. Einstein? You knowwhat his response was? The power of compound interest. That is exponential growth. Compoundinterest.
And if you grow only 2 percent a year, that 250 years now immediately shrinks to about, what,85 years here? And obviously you cannot fill your trunk up with coal. You are going to have toconvert it to a gas or a liquid. And so when you have used some energy to convert it to a gas or aliquid, after conversion you have got about 50 years left. That is a long time. And it is ameaningful resource. But it is not forever. And by the way, there are one of two penalties you aregoing to pay for burning coal. Either you are going to pay a big environmental penalty if you donot clean it up. And every year we vote some billions of dollars for clean coal technology. Andstill we have too much CO2, too much pollution from coal.
And by the way, Mr. Speaker, the use of coal is not without its price. We have had, what, 16miners killed in West Virginia in the last couple of weeks in producing coal.
When was the last time you heard that a worker in a nuclear power plant
[Page: H211]
was killed or injured? The answer is, never in this country. It just has not happened. I livedthrough the Three Mile Island disaster. I was not very far from it in Frederick, Maryland. Therewas a lot of hoopla about that. Very little actual effects of that. I have some friends who havebeen avidly antinuclear. When they are considering the alternative of shivering in the dark as werun down the other side of Hubbert's peak, they are wisely taking a new look at nuclear.
Our next chart is a very interesting one.

16
We have talked about the potential from agriculture. Let me make two generalizations as acaution. We are barely able to feed the world. Tonight, 20 percent of the world or so will go tobed hungry. How much food can we convert to energy and still feed the world, particularly if wepermit the world's population to increase as it is today?
The other caution is, how much biomass can we take from our land and still have topsoil? Withall of our good techniques today, no till farming and so forth, every bushel of corn we grow inIowa is accompanied by three bushels of topsoil that go down the Mississippi River.
Now, topsoil is topsoil, rather than subsoil simply because it has organic matter in it. And thatorganic matter, the humus comes from decaying organic material. And if you are taking all thatorganic material off to burn or to ferment or whatever you are going to do with it, I am notcertain how long we can maintain the quality of our topsoil so that we can continue to producethe food and fiber that we need and that the world needs.
On the top here are shown two depictions. One is the amount of energy you get out ofpetroleum. Obviously, you do not get all the energy in your car. It takes energy to drill the wells,to pump it out, to transport it, to refine it, to haul it to the gas station and so forth.
[Time: 21:45]
So when we get out 1 million BTUs, there are probably, they estimate, it took 1.23 millionBTUs input. So you do not get it all in your car. You would not expect to.
Now, what about the energy profit ratio here of ethanol? And here we are getting a lot ofenergy from the sun. What does that mean in terms of the final product? And I am told by somethis is a pretty optimistic assessment here. But even if we reach this, you have put in .74 millionBTUs. Almost three-fourths of the energy you get out of ethanol is represented by the energythat went into producing ethanol. There is an energy profit ratio, although some have disputedthat. There is a doctor in the East here and one in the West, and they have done what they say is avery good analysis of all the energy, and it is hard to keep track of that, Mr. Speaker. It is not justthe diesel fuel they use in the tractors. How much energy does it take to make the tractor? Everyautomobile tire has the equivalent of 6 gallons of oil in it. As you burn the tire, you get somesense that that is probably pretty close to the truth.
These two scientists believe that today in the way that some ethanol is made, it takes moreenergy from fossil fuels to make the ethanol that we get out of the ethanol. Even if that is true,there is a good byproduct remaining, all the fat and all the protein. Tofu is a protein, by the way.That is the protein from soybeans. We get a similar protein from corn. So we can use that asanimal food or human food.
The bottom chart here shows some of the challenge of getting energy from corn. This is a piechart which shows the total amount of energy that goes into producing a bushel of corn. Andnotice, Mr. Speaker, that almost half of that total energy comes from nitrogen. That is becausenitrogen fertilizer is made from natural gas. Before we learned how to do that, the only source of

17
nitrogen fertilizer was barnyard manure and what we call guano. Guano is the droppings of batsand birds for very long periods of time, hundreds of years, maybe thousands of years, and itaccumulated on the tropical islands, and in the case of bats, we mined that to get guano. That isgone. If we wait another 10-, 20-, 30,000 years, there will be some more. But it takes a very longtime to accumulate that.
This is all the other energy that goes into producing a bushel of corn. Potash was mined usingfossil fuels. Phosphate was mined using fossil fuels. The lime was quarried using fossil fuels.Here is the diesel fuel that ran the tractor and the combine, the gasoline that is used in some ofthe farm equipment, liquid gas, electricity, all of which is produced by fossil fuels, most of it byfossil fuels, some by nuclear, 20 percent by nuclear. The custom work, the diesel that went intodoing the work, the energy, the fossil energy it took to build the tractor and so forth. And manyof the chemicals we use in agriculture are made from oil. The water is pumped using energy. Thehauling, the seed, fossil fuel energy goes into producing all of this.
Mr. Speaker, how will we feed the world once we run down the other side of Hubbert's peak?
The next chart, this is a really interesting one.

18
I use an analogy here that helps me to understand this. I imagine a young couple that has justgotten married, and their grandparents died and left them a pretty big inheritance. So they havenow established a life-style where 85 percent of all the money they spend comes from theirgrandparents' inheritance and only 15 percent from their income. And they look at the amountthey are spending and at the size of the grandparents' inheritance and say, gee, this is not going tolast until we retire. So obviously they have got to do one or both of two things: Either they havegot to spend less money, or they have got to earn more money.
I use that 85-15. Others may use 86-14. The 85 or the 86 is the percentage of energy in oureconomy that we get from the fossil fuels, natural gas and petroleum and coal. Only 15 percentin this depiction do we get from nonfossil fuel sources. A bit more than half of that, nuclearenergy, 8 percent, that is, 8 of 15, a bit more than half, comes from nuclear. That is 20 percent ofelectricity, but 8 percent of our total energy use heating buildings and manufacturing and soforth. Seven percent of it comes from renewables. Remember that previous chart? Ultimately wewill transition to these renewables, with the exception of what we will get from nuclear. Whenwe are through the age of oil, it will all be renewables.
What are they? Solar. This is a 2000 chart. We are better today. In 2000, solar represented 1percent of 7 percent. That is .07 percent. It has been growing at 30 percent a year. That doublesin about 3 years. So now, big deal, it is .28 percent of our total energy.
Wood, 38 percent. Not the West Virginia hillbilly, but this is the timber industry and the paperindustry wisely using a waste product, what would otherwise be a waste product.
I mentioned waste before. That is 8 percent of our total renewable energy. We ought to beproducing a lot more of that. Landfills are pretty silly when you think that you could beproducing electricity with that rather than worrying about the methane that is produced there.They do harvest some of that, by the way, and use it.
Wind, another 1 percent. By the way, wind and solar are essentially the same energy source.The wind blows because of the differential heating of the sun; so they both go back to the sun.We can now produce electricity from wind at 2 1/2 cents a kilowatt hour. That is reallycompetitive. Why are we not producing more of it? Wind farms are growing. You may see them.Some people do not like the look of those. I think that the big wind machines are prettyhandsome. That is about where solar is today, about .28 percent of our total energy.
How long will it take us to get to any meaningful percentage there? Because that isincreasingly what we are going to have to rely on in the future.
Conventional hydro, almost half of all of our renewables comes from an energy source that isnot going to grow in our country. We have dammed every river that should be dammed andprobably a few that should not; so that is not likely to grow.
Now we are down here to agriculture, alcohol fuels and so forth. Again, almost in the noiselevel. And geothermal, where we are close enough to the molten core of the Earth, we reallyshould tap into that. That is free. It is forever if you use it properly.

19
The next chart shows us something very interesting.
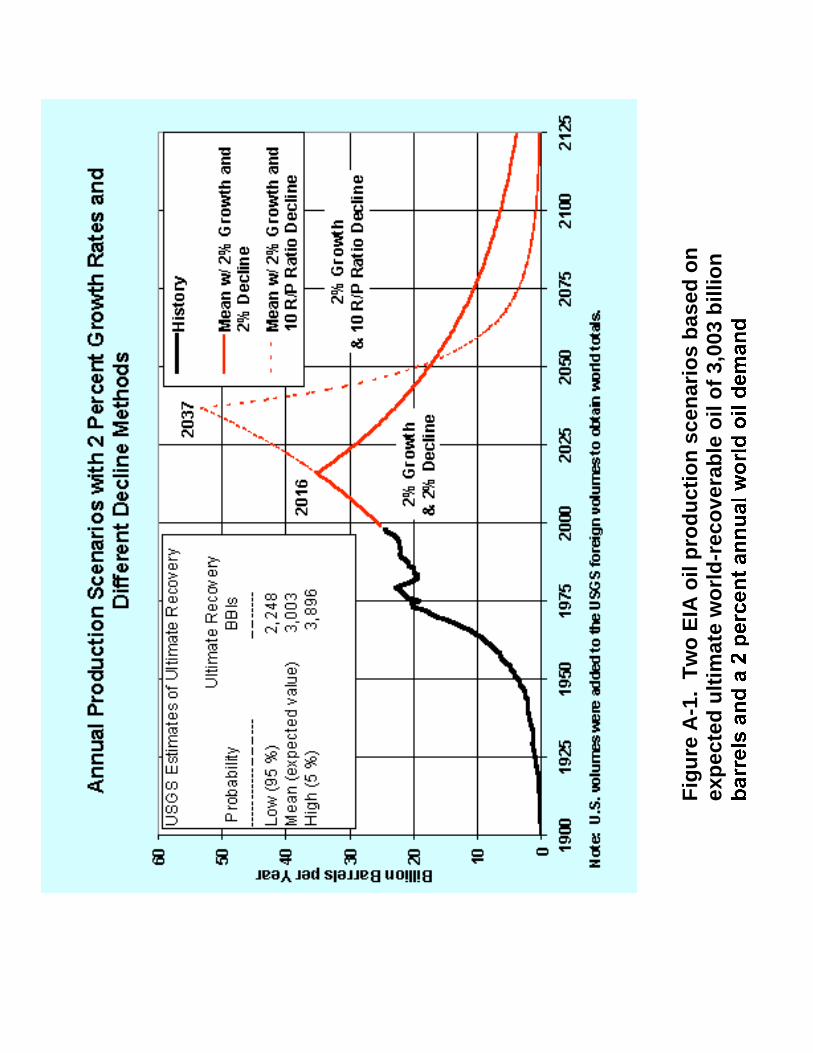
Mr. Speaker, I would like to get some input from statisticians on this because everybody knows
[Page: H212]
the jargon of something which is statistically significant. There is a 95 percent probability, thereis a 5 percent probability, and so forth. And here they have done something which I find verystrange. If you are looking at the path that a hurricane is going to take, you notice it starts outvery narrow. It could get pretty good for the next few hours, but when it gets out to hours anddays, it gets broader and broader. Now, the hurricane maybe will go down the middle, but thereis just as big a chance it will go to the left as there is that it will go to the right. And what thesefolk are doing and what they are using here is statistical jargon. They are saying a high 5 percentprobability, low 95 percent, and the mean is what is in the middle. Now, that could just as well
Figure A-1. Two EIA oil production scenarios based onexpected ultimate world-recoverable oil of 3,003 billion barrelsand a 2 percent annual world oil demand escalation
20
be a whole lot less as that much more. So the real peak is probably going to occur about righthere.
This is where we are now. This is the 2000 chart. We are about right here. They are using thismean here. No one that I know of believes that the ultimate recovery, 1 billion barrels of oil, is 3trillion. But even if you use the 3 trillion, that takes you only to this point. It pushes peak oil outonly to 2016.
The next one is a really interesting one. If you assume that you are going to get it faster andmove the peak out to 2037, look what happens after that. You fall off a cliff.
So we need to be careful about this enhanced oil recovery, because if there is only so much topump, and you pump it sooner rather than later, later you are going to have less to pump.
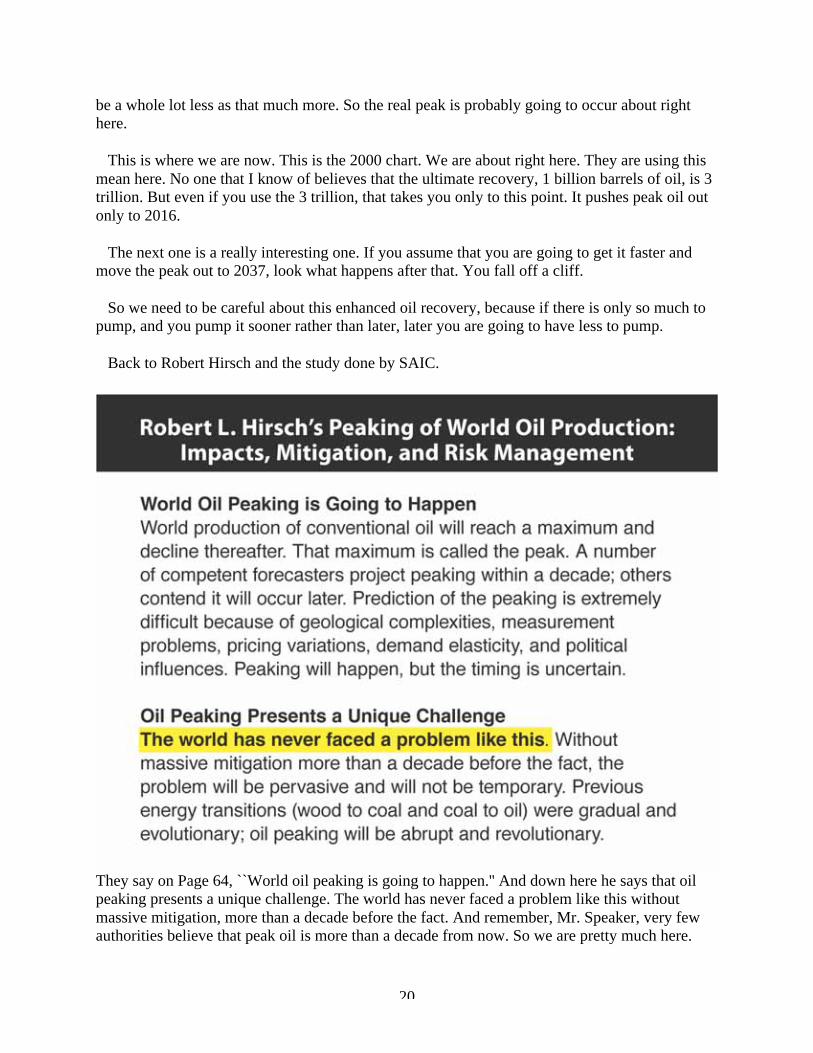
Back to Robert Hirsch and the study done by SAIC.
They say on Page 64, ``World oil peaking is going to happen.'' And down here he says that oilpeaking presents a unique challenge. The world has never faced a problem like this withoutmassive mitigation, more than a decade before the fact. And remember, Mr. Speaker, very fewauthorities believe that peak oil is more than a decade from now. So we are pretty much here.
21
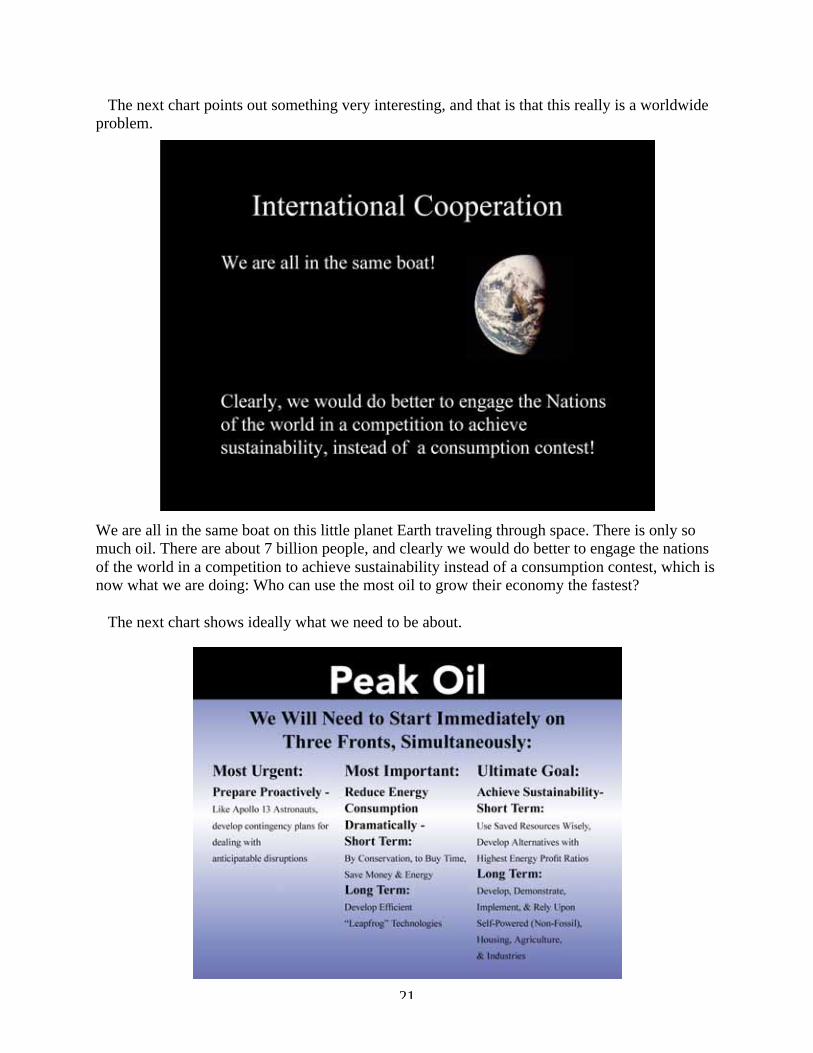
The next chart points out something very interesting, and that is that this really is a worldwideproblem.
We are all in the same boat on this little planet Earth traveling through space. There is only somuch oil. There are about 7 billion people, and clearly we would do better to engage the nationsof the world in a competition to achieve sustainability instead of a consumption contest, which isnow what we are doing: Who can use the most oil to grow their economy the fastest?
The next chart shows ideally what we need to be about.

22
By the way, Mr. Speaker, I think that if we do not have a national and indeed internationalprogram which kind of has the breadth of putting a man on the Moon and the intensity of theManhattan Project, I think we are in for a pretty rough landing.
First of all, there is voluntarily conservation, and we can do that. We can conserve. Californiadid. They had no rolling blackouts because they voluntarily reduced their electricity use by 11percent in a single year. That is big. We start out with voluntary conservation, ride with two inthe car, turn our thermostat down, put a sweater on. To organize voluntary conservation, workingtogether to provide for the van pools and so forth, then the government can provide somemonetary incentives, giving you the incentive to do the right thing. And then efficiency, ofcourse. These were two words that were absent from the President's very good message onenergy, conservation and efficiency.
I am a conservative. My wife says she thinks that there ought to be some relationship betweenconservation and conservatives. Does that make sense, Mr. Speaker?
The next chart we are going back again to the Hirsch report.

23
That was such a great study. They said on page 24, ``We cannot conceive of any affordablegovernment-sponsored crash program to accelerate normal replacement schedules so as toincorporate higher energy efficiency technologies into the private-owned transportation sector.Significant improvements in energy efficiency will thus be inherently time-consuming of theorder of a decade or so.''
For instance, if everyone was to drive a hybrid car, which gets two or three times the mileageof an ordinary car, it takes one or two decades to turn over the motor fleet; 28 years, I think, forthe big trucks; much less than that for the vanity of cars and so forth.
The next chart, this is something that we are doing out in Frederick.
We wanted to demonstrate that it was possible to be totally self-sufficient, so we have proposed,and we have funding to do it thanks to the generosity of the taxpayers, that we are going to builda welcome center coming down into Frederick that is totally energy self-sufficient. We will getall of our water from the rain. We will handle all of our waste without putting anything into theground, with composting toilets and constructed wetlands and so forth. We will produce all ofour energy with wind machines and solar panels and so forth. This should in the next couple ofyears be existing. If you go up 270 into Frederick and start down the hill where you look over theFrederick Valley and see the city there, on your right will be the Goodloe Byron Overlook. Ifyou pull in there, you will be at this welcome center, which will have a lot of what we callbenign technologies.
24
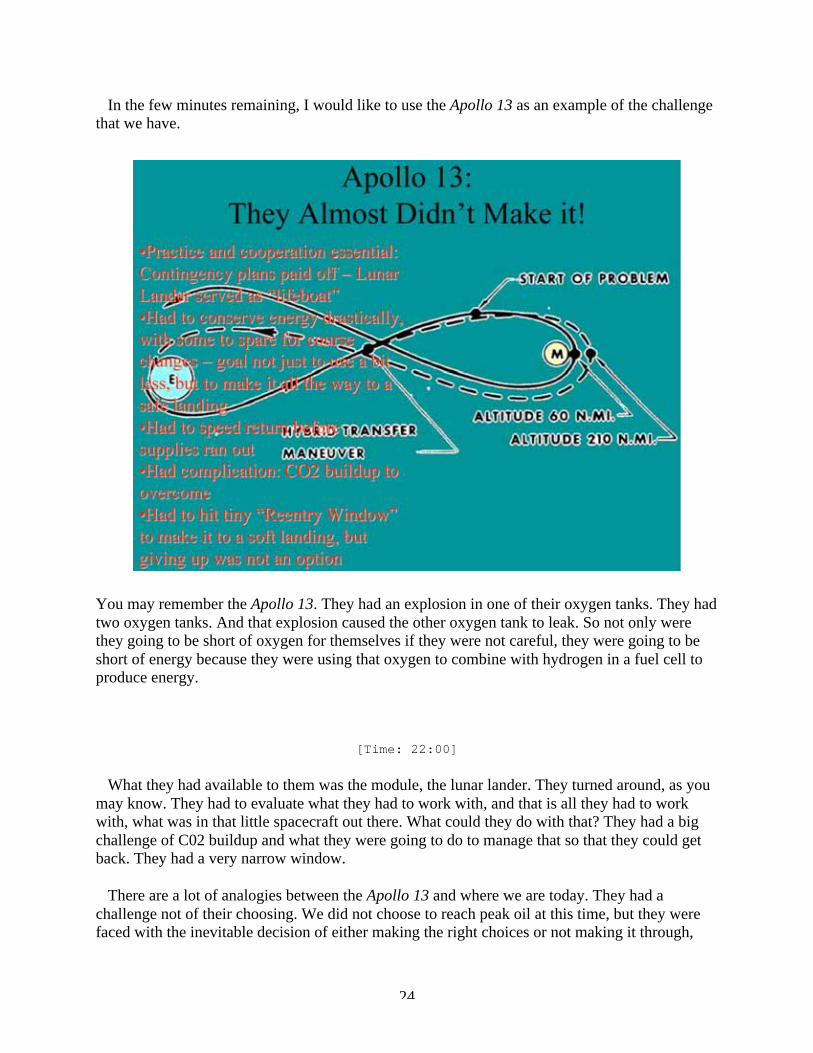
In the few minutes remaining, I would like to use the Apollo 13 as an example of the challengethat we have.
You may remember the Apollo 13. They had an explosion in one of their oxygen tanks. They hadtwo oxygen tanks. And that explosion caused the other oxygen tank to leak. So not only werethey going to be short of oxygen for themselves if they were not careful, they were going to beshort of energy because they were using that oxygen to combine with hydrogen in a fuel cell toproduce energy.
[Time: 22:00]
What they had available to them was the module, the lunar lander. They turned around, as youmay know. They had to evaluate what they had to work with, and that is all they had to workwith, what was in that little spacecraft out there. What could they do with that? They had a bigchallenge of C02 buildup and what they were going to do to manage that so that they could getback. They had a very narrow window.
There are a lot of analogies between the Apollo 13 and where we are today. They had achallenge not of their choosing. We did not choose to reach peak oil at this time, but they werefaced with the inevitable decision of either making the right choices or not making it through,

25
and we are faced with very much that same kind of a dilemma. We have some choices to makenow, and the next chart points to the kinds of choices that we have and what I think we need tobe doing.
I want to refer you to an earlier chart which, by the way, we had that bell curve and we had theconsumption going up like so, and there is a gap there.
A lot of people are trying to fill the gap. Here is that chart. Put that in front of this one. We willtalk about that in just a moment. A lot of people are talking about filling the gap so that wecontinue on this course and use ever more and more.
I would suggest, Mr. Speaker, it is not what our challenge should be. As a matter of fact, to getalternative energy sources, we are going to have to invest three things. Money, we will not worryabout that. We will borrow that from our kids and our grandkids, I am sorry to say; but wecannot borrow time from them, and you cannot borrow energy from them. We have run out oftime. We are using all the oil that is available. If there was more oil than we would like to use, itwould not be a sixty-couple dollars a barrel, would it? So in order to have any energy to invest inthe alternative, we have to reduce our demand for oil so we have something to invest.

26
Trying to fill the gap just puts off the inevitable. If, in fact, we are able to do that momentarily,since there is not going to be much more oil found out there, the experts believe all you are doingnow is setting yourself up for a bigger fall later. The old adage, in a hole, stop digging, thecorollary to that is you are climbing a hill and you are going to fall off the other side, the higheryou climb, the further you fall. This is pretty much where we are with oil. Let us go back nowabout the choices before us now.
Like Apollo 13, we have got to develop those contingency plans. What will we do? We need toprepare proactively. We have almost run out of time to do that. We must reduce energyconsumption to make some energy available. That will
[Page: H213]
buy some time. By the way, the cheapest oil is the oil you do not use. We have bought some timeso we can make investments now in more efficiency, first of all, and then in these alternativeswhich we will increasingly turn to.
The ultimate goal is to achieve sustainable growth. By the way, Mr. Speaker, there is no suchthing as sustainable growth, whether short term you may make it appear to be so; but ultimatelythere is no such thing as continued forever sustainable growth. We are going to have to learn tobe happy with being satisfied with what we have got.

27
I think, Mr. Speaker, we have some really, really great times ahead of us. I can imaginenothing more than all Americans feeling really good about contributing to a solution to thisproblem.
What we really need is leadership that the American people understand that they really cancontribute. We have enormous creativity and entrepreneurship. We need to harness that. Thenext big burst in economic efficiency and growth can be in developing these alternatives andmore efficient ways of doing things.
The ultimate goal, and we will get to that goal, we will transition. When the age of oil isfinished and there is no more oil that can be gotten without paying more for the oil than you getout of it, we will have been transitioned to the renewables. What will life be like then? What willlife be like in that transition?
This is really a good-news story. The sooner we start to address this problem, the less traumaticwill be the transition. I like to think, Mr. Speaker, that if we harness the creativity and the energyof the American people, there is nothing that will make sleep so refreshing other than justknowing you really contributed something that day.
Mr. Speaker, I think that we have a bright future ahead of us. Unless we recognize, weprobably are approaching peak oil. I would encourage, Mr. Speaker, that you go do a Googlesearch for peak oil, pull up the articles on peak oil or do Hubbert's peak, you will find essentiallythe same articles there. There is a lot of information out there.
The average person is so consumed with the necessities of life, the tyranny of the urgent thatpushes the important off the table: you really need to change the diapers; you really do need to beresponsible; you also need to be thinking about tomorrow. We think about our next election. Theboard of directors thinks about the next quarterly report. Who is looking 5 years from now, 10years from now?
Mr. Speaker, I think we have a great future ahead of us. The American people will respond ifproperly challenged.
END

28
Congressman Roscoe Bartlett
Congressional Record
THE PEAKING OF WORLD OIL
House of Representatives
February 8, 2006
Appendix of Charts
Chart 1 Hirsch Report: Peak an unprecedented risk management problemChart 2 2% World Reserves, 8% World Production, 5% World PopulationChart 3 Annual Oil Production for U.S. and FSU (Former Soviet Union)Chart 4 U.S. Oil Production ForecastChart 5 Peak Oil – The Growing GapChart 6 Peak Oil – We Are HereChart 7 Potential Alternative SolutionsChart 8 Energy Profit Ratios for Several FuelsChart 9 U.S. Consumption of Energy By ResourceChart 10 Coal: 40 Years at 2% GrowthChart 11 Total Energy Requirement Btu per Bushel of CornChart 12 Renewable Energy as Share of US Energy Consumption, 2000Chart 13 Hirsch Report: Annual Production Scenarios With 2% Growth RatesChart 14 Hirsch Report: World oil peaking is going to happen.Chart 15 We Are All in the Same BoatChart 16 We Will Need to Start Immediately on Three Fronts SimultaneouslyChart 17 Hirsch Report: government-sponsored “crash program”Chart 18 Western Maryland Welcome CenterChart 19 Apollo 13: They Almost Didn’t Make It!Chart 20 Peak Oil – We Are HereChart 21 We Will Need to Start Immediately on Three Fronts Simultaneously

29
30

31
(FS
U)
– F
orm
er S
ovie
t U
nio
n

32

33

34

35
• P
ote
nti
al A
lter
nat
ive
So
luti
on
s
o
F
init
e R
esourc
es:
T
ar S
ands
O
il S
hal
e C
oal
N
ucl
ear
Fis
sion
N
ucl
ear
Fusi
on
o R
enew
able
Res
ourc
es:
S
ola
r W
ind
G
eoth
erm
al O
cean
Ener
gy
A
gri
cult
ura
l R
esourc
es:
• S
oy/B
iodie
sel
• E
than
ol

36

37

38

39

40
41
Fig
ure
A-1
. T
wo
EIA
oil
pro
du
cti
on
sc
en
ari
os
ba
se
d o
ne
xp
ec
ted
ult
ima
te w
orl
d-r
ec
ov
era
ble
oil
of
3,0
03
bil
lio
n

42

43

44

45

46

47

48

49