the papers
TRANSCRIPT

DEPARTMENT OF ECONOMICS � UNIVERSIDAD DE GRANADA
UNIVERSIDAD DE GRANADAWORKING PAPER SERIESDPTO. TEORIA E HISTORIA ECONOMICA
ThE PAPERS
20/01
Pablo Branas-Garza, Elena Molis, and Levent Neyse
Spread of Information, Inequality and Cooperation
ThE PAPERS
Spread of Information, Inequality and Cooperation
Pablo Branas-Garza, Elena Molis, and Levent Neyse
20/01
Pablo Branas-Garza, Elena Molis, and Levent Neyse (2020). Spread of Information, Inequality andCooperation. ThE Papers, Department of Economic Theory and Economic History of Universidad deGranada. 20/01.
� SUGGESTED CITATION

Spread of Information, Inequality and Cooperation
Pablo Brañas-Garza1, Elena Molis2, and Levent Neyse3,*
1Loyola University, Department of Economics, Cordoba, Spain.
2University of Granada, Department of Economics, Spain
3SOEP at DIW, Berlin, Germany
*Corresponding Author: [email protected]; Mohrenstrasse 58, 10117, Berlin, Germany
Abstract
With the rise of information technologies, citizens can compare public good efficien-
cies between countries easier now and being aware of large efficiency differences may
affect tax compliance behavior. We experimentally test whether contributions in
the public goods game are sensitive to comparative information regarding marginal
per capita returns of other groups. Our experimental results indeed suggest that
comparative information creates polarization in contribution levels in the presence
of large inequality between comparison groups.
Keywords: Public Goods; Inequality; Cooperation; Information; Experiment
JEL Codes: C9, D8, H4
1 Introduction
Internet and social media, have immensely increased the spread of news globally. Citizens
now receive more information about developments around the world and commonly com-
pare their own countries to others. For instance, Programme for International Student
Assessment (PISA) studies of OECD show worldwide levels of education and the find-
ings are well spread both in mass and social media. As a result, citizens of participating
1
March 2020

countries are informed more accurately about the quality of their countries’ education
systems. Such type of information regarding inequalities between countries can have a
great impact on tax compliance behavior as they shape taxpayers’ perceptions regarding
the efficiency of public policies.
Individuals show greater support for public good projects that they gain higher benefits
from (Olson, 2009). This observation has been repeatedly confirmed by experimental
studies (Kölle, 2015; Ledyard, 1995; Lugovskyy et al., 2017; Reuben & Riedl, 2009,
2013; Tan, 2008). However, the role of information in public goods games is not entirely
clear. On the one hand transparency might increase contributions (Davis et al., 2010;
Fischbacher et al., 2001; Friedman, 1971; Fudenberg & Maskin, 2009). On the other
hand, information about other group members’ payoffs decreases the contributions (Fiala
& Suetens, 2017; Nikiforakis, 2010). It is suggested that payoff based learning yields
contribution decline in repeated public goods games (Burton-Chellew et al., 2015).
The common feature of those studies investigating the role of information on public
goods provision is that they manipulate the information and feedback schemes within
groups. Meaning that, the payoffs of group members are directly affected by the decisions
of other members of the same group. However, both economic and social decisions out-
side the laboratory are also affected by economically irrelevant information as a body of
literature documented (e.g. Easterlin, 2001; Luttmer, 2005). Further examples regarding
economic behavior suggest that social comparison information shapes work productivity
(Charness et al., 2016; Cohn et al., 2014; Gächter & Thöni, 2010), risky decisions (Gamba
et al., 2017; Linde & Sonnemans, 2012; Schmidt et al., 2019) and charitable giving (Frey
& Meier, 2004).
In this study, we experimentally test whether public goods contributions are sensitive
to information regarding marginal per capita return (m) inequalities between groups. We
also test whether the size of inequality plays a role. Our results suggest that information
on m inequality yields a polarization in contributions if the inequality is large. We do not
observe such a polarization when the m inequality between groups is small.
2

2 Methods
2.1 Experimental Procedures
The experiment was run at EGEO, the experimental lab in Faculty of Economics and
Business of University of Granada in Spain and conducted with Z-tree software (Fis-
chbacher, 2007). The participants were recruited through ORSEE (Greiner, 2015). The
total number of participants was 183 (female=106), who were students of the School of
Business and Economics.1
In each session, participants were randomly assigned to the computers and their
groups. Following several control questions and two trial periods, players were informed
about their own m and also the m of the other two members in their groups on their
screens. Meaning that, the m’s of group members were common knowledge in each group.
After participants completed the experiment they were paid confidentially for a randomly
selected round and left the lab. The duration of a session was about 1 hour. Participants
earned 13.41 Euros in average (including 3 Euros show up fee).
2.2 Experimental Design and Treatments
Our experiment used a standard linear public goods game design. Each group had three
players and each group member had the same m (i.e. homogeneous groups). Each player
made a contribution decision from her endowment of 20 tokens in each period (ci ∈ [0, 20];
exchange rate of a token was 0.33 Euros). Payoff function of the players is as follows:
πi = (wi − ci) +mi ×3∑
j=1
cj, (1)
where wi is the initial endowment of subject i, ci is her contribution to the public pool
and her mi is the marginal per capita return. cj stands for the contributions of the other
players in the same group. The experiment was run for 10 periods. In all treatments,
participants were given full information about their own payoffs and also a vector showing1Each treatment contains 18 participants (6 groups) except for T7 and T8. In T7-T8 the number of
participants are 39 and 36.
3
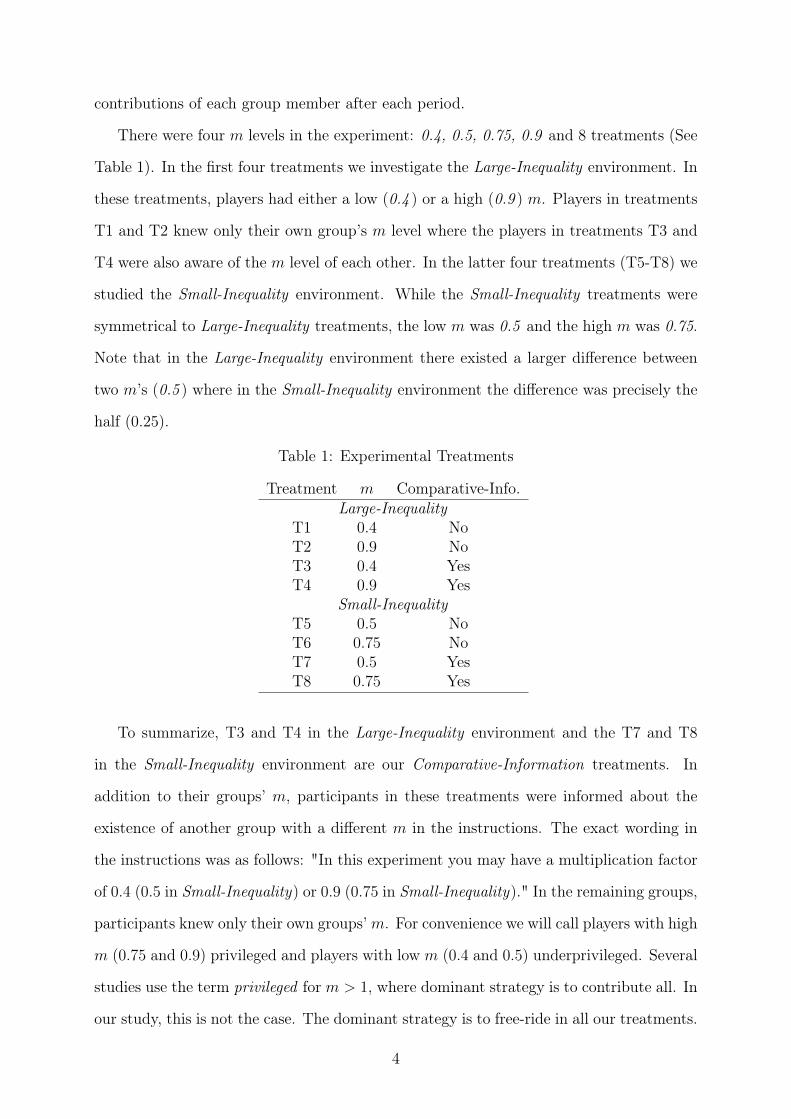
contributions of each group member after each period.
There were four m levels in the experiment: 0.4, 0.5, 0.75, 0.9 and 8 treatments (See
Table 1). In the first four treatments we investigate the Large-Inequality environment. In
these treatments, players had either a low (0.4 ) or a high (0.9 ) m. Players in treatments
T1 and T2 knew only their own group’s m level where the players in treatments T3 and
T4 were also aware of the m level of each other. In the latter four treatments (T5-T8) we
studied the Small-Inequality environment. While the Small-Inequality treatments were
symmetrical to Large-Inequality treatments, the low m was 0.5 and the high m was 0.75.
Note that in the Large-Inequality environment there existed a larger difference between
two m’s (0.5 ) where in the Small-Inequality environment the difference was precisely the
half (0.25).
Table 1: Experimental Treatments
Treatment m Comparative-Info.Large-Inequality
T1 0.4 NoT2 0.9 NoT3 0.4 YesT4 0.9 Yes
Small-InequalityT5 0.5 NoT6 0.75 NoT7 0.5 YesT8 0.75 Yes
To summarize, T3 and T4 in the Large-Inequality environment and the T7 and T8
in the Small-Inequality environment are our Comparative-Information treatments. In
addition to their groups’ m, participants in these treatments were informed about the
existence of another group with a different m in the instructions. The exact wording in
the instructions was as follows: "In this experiment you may have a multiplication factor
of 0.4 (0.5 in Small-Inequality) or 0.9 (0.75 in Small-Inequality)." In the remaining groups,
participants knew only their own groups’m. For convenience we will call players with high
m (0.75 and 0.9) privileged and players with low m (0.4 and 0.5) underprivileged. Several
studies use the term privileged for m > 1, where dominant strategy is to contribute all. In
our study, this is not the case. The dominant strategy is to free-ride in all our treatments.
4

3 Results
3.1 Large-Inequality
Figure 1 shows the contribution trends in Large-Inequality treatments (m= 0.4 and 0.9 )
where left panel shows treatments without comparative information and the right one
treatments with comparative information. Without information, underprivileged play-
ers (m=0.4 ) start contributing at 56% and reduce until 22%. Privileged players also
start around 60% but do not exhibit a decline. In the information condition, informed
underprivileged players start contributing at remarkably low rates and they exhibit a
gentle decline. In summary, the contributions of informed underprivileged players are
significantly lower than uniformed underprivileged players (means: Lownoinfo = %33.50;
Lowinfo = %16.28; p = 0.003). On the contrary, privileged players (m=0.9 ) start con-
tributing at a very high level (70%) and continue contributing consistently until the end of
the game. Hence, there is no decline. Although the contribution pattern of privileged gets
more stable with information, statistical tests do not detect a significant difference between
informed and uninformed privileged players on average (means: Highnoinfo = %57.72;
Highinfo = %70.81; p = 0.195). Figure A1 and Figure A2 show average contributions in
the first 5 and last 5 periods.
Figure 1: Contributions along 10 periods: Large-Inequality
Panel regression analysis is presented in Table 2. The impact of information on contri-
butions is significant for underprivileged groups (p = 0.023) but not in privileged groups
5

(p = 0.903). Furthermore, the period is not significant for privileged groups, meaning
that there is no significant contribution decay along 10 periods. See Table A1 for the
regression analyses by inequality sizes.
Table 2: Regressions by m levels
m = 0.4 m = 0.5 m = 0.75 m = 0.9(1) (2) (3) (4)
info -0.172** 0.027 -0.014 0.131(0.076) (0.094) (0.118) (0.120)
period -0.022*** -0.032*** -0.023*** 0.001(0.006) (0.007) (0.007) (0.008)
constant 0.455*** 0.634*** 0.689*** 0.569***(0.058) (0.099) (0.113) (0.093)
Observations 360 570 540 360N 36 57 54 36R2 0.200 0.085 0.040 0.035Panel regressions. Dependent variable: Contributions [0,1].info=1 for comparative information treatments, period is the timevariable [1,10]. Robust standard errors in parentheses.* p < 0.1,** p < 0.05, *** p < 0.01; regressions were clustered by groups.
3.2 Small-Inequality
Figure 2 presents the Small-Inequality treatments (m= 0.5 and 0.75 ).The common con-
tribution decline patterns are observed in all treatments. Contributions begin around
60% of the endowment in period 1 and they decrease gradually. In Small-Inequality case,
we do not observe any significant treatment effects caused by comparative information
neither for underprivileged (Means: Lownoinfo = %46.00; Lowinfo = %48.73; p = 0.619)
nor for privileged players (Means: Highnoinfo = %56.47; Highinfo = %55.03; p = 0.614).
Figures A1 and A2 show average contributions in the first 5 and last 5 periods.
Regression analyses do not detect a significant effect of info on contributions in the
Small-Inequality treatments and decline pattern is significant in all treatments (See Tables
2 and A1 for regression analyses).
6

Figure 2: Contributions along 10 periods: Small-Inequality
4 Conclusion
In this experimental study, we investigated whether being exposed to comparative infor-
mation, that makes the economic inequality more salient, affects individuals’ contribution
decisions in a linear public goods game. Since the members of each group have the iden-
tical m levels (i.e. homogeneous groups) the comparative information they receive should
not affect their contributions theoretically. Yet, our results in the Large-Inequality treat-
ments show the otherwise. The contribution difference between underprivileged (0.4) and
privileged (0.9) groups widens when they learn about the existence of each other. Our
analyses show that this effect is mainly due to a decrease in underprivileged groups’ con-
tributions: informed underprivileged groups contribute extremely low, starting from the
first period. This might imply that in the existence of large inequality, warm-glow of
giving almost disappears with the comparative information.
People now receive more information and they compare themselves or their countries
to relative others easily today. Our results suggest that information might have adverse
consequences as economic and social inequalities are rising today (Piketty, 2014). As
in previously given PISA example, tax-payers who are informed about their countries’
low scores might end up evading taxes. However, decreasing the economic and social
inequalities might help as our experimental results did not detect such an impact of
comparative information in Small-Inequality treatments.
7
References
Burton-Chellew, M. N., Nax, H. H., & West, S. A. (2015). Payoff-based learning explains
the decline in cooperation in public goods games. Proceedings of the Royal Society
B: Biological Sciences, 282 (1801), 20142678.
Charness, G., Cobo-Reyes, R., Lacomba, J. A., Lagos, F., & Pérez, J. M. (2016). Social
comparisons in wage delegation: Experimental evidence. Experimental Economics,
19 (2), 433–459.
Cohn, A., Fehr, E., Herrmann, B., & Schneider, F. (2014). Social comparison and effort
provision: Evidence from a field experiment. Journal of the European Economic
Association, 12 (4), 877–898.
Davis, D., Korenok, O., & Reilly, R. (2010). Cooperation without coordination: Signaling,
types and tacit collusion in laboratory oligopolies. Experimental Economics, 13 (1),
45–65.
Easterlin, R. A. (2001). Income and happiness: Towards a unified theory. The Economic
Journal, 111 (473), 465–484.
Fiala, L., & Suetens, S. (2017). Transparency and cooperation in repeated dilemma games:
A meta study. Experimental Economics, 20 (4), 755–771.
Fischbacher, U. (2007). Z-tree: Zurich toolbox for ready-made economic experiments.
Experimental Economics, 10 (2), 171–178.
Fischbacher, U., Gächter, S., & Fehr, E. (2001). Are people conditionally cooperative?
evidence from a public goods experiment. Economics Letters, 71 (3), 397–404.
Frey, B. S., & Meier, S. (2004). Social comparisons and pro-social behavior: Testing"
conditional cooperation" in a field experiment. American Economic Review, 94 (5),
1717–1722.
Friedman, J. W. (1971). A non-cooperative equilibrium for supergames. The Review of
Economic Studies, 38 (1), 1–12.
Fudenberg, D., & Maskin, E. (2009). The folk theorem in repeated games with discounting
or with incomplete information, In A long-run collaboration on long-run games.
World Scientific.
8

Gächter, S., & Thöni, C. (2010). Social comparison and performance: Experimental evi-
dence on the fair wage–effort hypothesis. Journal of Economic Behavior & Orga-
nization, 76 (3), 531–543.
Gamba, A., Manzoni, E., & Stanca, L. (2017). Social comparison and risk taking behavior.
Theory and Decision, 82 (2), 221–248.
Greiner, B. (2015). Subject pool recruitment procedures: Organizing experiments with
orsee. Journal of the Economic Science Association, 1 (1), 114–125.
Kölle, F. (2015). Heterogeneity and cooperation: The role of capability and valuation on
public goods provision. Journal of Economic Behavior & Organization, 109, 120–
134.
Ledyard, O. (1995). Public goods: Some experimental results. Handbook of Experimental
Economics, 1.
Linde, J., & Sonnemans, J. (2012). Social comparison and risky choices. Journal of Risk
and Uncertainty, 44 (1), 45–72.
Lugovskyy, V., Puzzello, D., Sorensen, A., Walker, J., & Williams, A. (2017). An experi-
mental study of finitely and infinitely repeated linear public goods games. Games
and Economic Behavior, 102, 286–302.
Luttmer, E. F. (2005). Neighbors as negatives: Relative earnings and well-being. The
Quarterly Journal of Economics, 120 (3), 963–1002.
Nikiforakis, N. (2010). Feedback, punishment and cooperation in public good experiments.
Games and Economic Behavior, 68 (2), 689–702.
Olson, M. (2009). The logic of collective action (Vol. 124). Harvard University Press.
Piketty, T. (2014). Capital in the twenty-first century. Harvard University Press, Cam-
bridge, MA.
Reuben, E., & Riedl, A. (2009). Public goods provision and sanctioning in privileged
groups. Journal of Conflict Resolution, 53 (1), 72–93.
Reuben, E., & Riedl, A. (2013). Enforcement of contribution norms in public good games
with heterogeneous populations. Games and Economic Behavior, 77 (1), 122–137.
9

Schmidt, U., Neyse, L., & Aleknonyte, M. (2019). Income inequality and risk taking: The
impact of social comparison information. Theory and Decision, 1–15.
Tan, F. (2008). Punishment in a linear public good game with productivity heterogeneity.
De Economist, 156 (3), 269–293.
Appendix
Figure A1: Average contributions: First 5 periods
0%
20%
40%
60%
80C
ontri
butio
ns (%
)
Small Inequality Large Inequalitym=0.5 m=0.75 m=0.4 m=0.9
No Information Information
10

Figure A2: Average contributions: Last 5 periods
0%
20%
40%
60%
80C
ontri
butio
ns (%
)
Small Inequality Large Inequalitym=0.5 m=0.75 m=0.4 m=0.9
No Information Information
Table A1: Regressions by the Size of Inequality
Large-Inequality Small-InequalityAll All No-Info Info All All No-Info Info(1) (2) (3) (4) (5) (6) (7) (8)
m 0.788∗∗∗ 0.484∗∗ 0.484∗∗ 1.091∗∗∗ 0.306 0.419 0.419 0.252(0.152) (0.220) (0.225) (0.173) (0.244) (0.540) (0.557) (0.252)
info -0.021 -0.415∗∗ 0.007 0.111(0.076) (0.163) (0.074) (0.363)
period -0.010∗ -0.010∗ -0.017∗ -0.004 -0.027∗∗∗ -0.027∗∗∗ -0.037∗∗∗ -0.023∗∗∗(0.005) (0.005) (0.009) (0.006) (0.005) (0.005) (0.007) (0.007)
mXinfo 0.606∗∗ -0.167(0.277) (0.595)
constant 0.001 0.197 0.233∗ -0.252∗∗ 0.471∗∗∗ 0.400 0.453 0.486∗∗∗(0.110) (0.132) (0.138) (0.109) (0.154) (0.328) (0.354) (0.167)
Observations 720 720 360 360 1110 1110 360 750N 72 72 36 36 111 111 36 75R2 0.307 0.351 0.135 0.560 0.073 0.074 0.100 0.060Panel regressions. Dependent variable: Contributions [0,1]. Independent variables: i) m; ii) info is a binaryvariable; iii) period [0,10]; iv) mXinfo interaction variable. Robust standard errors in parentheses.∗ p < 0.1, ∗∗ p < 0.05, ∗∗∗ p < 0.01; regressions were clustered by experimental groups of three.
11

DEPARTMENT OF ECONOMICS � UNIVERSIDAD DE GRANADA
http://tehieco.ugr.es/
� PREVIOUS WORKING PAPERS IN THE SERIES
19/11 Why do the poor vote for low tax rates? A (real-effort task) experiment on income redistribution.Natalia Jimenez Jimenez, Elena Molis, and Angel Solano-Garcıa
19/10 Preferences for efficiency, rather than preferences for morality, drive cooperation in the one-shot Stag-Hunt Game.Valerio Capraro, Ismael Rodrıguez-Lara, and Maria J. Ruiz-Martos
19/09 Fluctuations in Global Macro Volatility.Danilo Leiva-Leon and Lorenzo Ductor
19/08 Current Account and International Networks.Daryna Grechyna
19/07 Socioeconomic Correlates of Political Polarization: Evidence from English Counties.Daryna Grechyna
19/06 Nudging responses to marketing emails: Evidence from London Fireworks Campaign.Alice Gimblett and Daryna Grechyna
19/05 Mandatory Spending, Political Polarization, and Macroeconomic Volatility.Daryna Grechyna
19/04 Conformity and truthful voting under different voting rules.Bernardo Moreno, Marıa del Pino Ramos-Sosa, and Ismael Rodrıguez-Lara
19/03 On how to allocate the fixed cost of transport networks.Teresa Estan, Natividad Llorca, Ricardo Mart, and Joaquın Sanchez-Soriano
19/02 Multilevel proficiency comparisons with an application to educational outcomes in PISA.Ricardo Martınez and Antonio Villar
19/01 Population structure and the human development index.Carmen Herrero, Ricardo Martınez, and Antonio Villar