the ownership and trading of debt claims in chapter 11 ... files/iis... · the ownership and...
TRANSCRIPT
The Ownership and Trading of Debt Claims in
Chapter 11 Restructurings
Victoria Ivashina
Harvard University and NBER
Benjamin Iverson
Northwestern University
David C. Smith University of Virginia
This draft: March 2015
(First draft: January 2011)
Using a novel dataset that covers individual debt claims against 136 bankrupt U.S. companies and
includes information on a subset of claims transfers, we provide new empirical insight regarding how a
firm’s debt ownership relates to bankruptcy outcomes. Firms with higher debt concentration at the start of
the case are more likely to file prearranged bankruptcy plans, to move quickly through the restructuring
process, and to emerge successfully as independent going concerns. Moreover, higher ownership
concentration within a debt class is associated with higher recovery rates to that class. Trading of claims
during bankruptcy concentrates ownership further but this trading is not associated with subsequent
improvements in bankruptcy outcomes and may, at the margin, increase the likelihood of liquidation.
Keywords: Chapter 11; Ownership structure; Distressed debt; Trading in bankruptcy
JEL classification: G23; G30; G33
The authors can be contacted via the following email addresses: Victoria Ivashina: [email protected]; Ben Iverson:
[email protected]; David Smith: [email protected]. Corresponding author: Victoria Ivashina,
Baker Library, Bloomberg Center 233, Boston MA 02163, (617) 495-8018
This research was funded in part by a grant from the American Bankruptcy Institute (ABI) Endowment Fund. We
are grateful to BMC Group, Donlin Recano & Company, EPIQ Systems, and Kurtzman Carson Consultants (KCC)
for their aid in collecting the claims data used in this project. Tinamarie Feil, Brad Daniel, and Brendan Bozack
from BMC Group and Jonathan Carson from KCC were especially helpful in explaining the claims trading process.
Per Strömberg had valuable input on many of the ideas behind the paper, for which we are grateful. We thank an
anonymous referee, Bo Becker, Christa Bouwman, Shawn Cole, Michael Gallmeyer, Stuart Gilson, John Graham,
Sascha Steffen, Jeremy Stein, Elizabeth Tashjian, and participants at the 2012 University Chicago Conference on
Creditors and Corporate Governance, 2011 AFA Annual Meeting in Denver, 2011 FIRS meeting in Sydney, 2011
Stanford Institute for Theoretical Economics summer workshop, 2011 EFA meeting in Stockholm, and seminar
participants at Cornerstone Research, Erasmus University, Harvard University, the University of New South Wales,
and the University of Virginia for their insightful comments. Dmitri Adler, Adam Fitzer, James Reilly, Avina
Sugiarto, and Le Yang provided excellent research assistance. Smith is grateful for additional financial support from
the Research Council of Norway’s Finansmarkedsfond and the McIntire Center for Financial Innovation.
The Ownership and Trading of Debt Claims in
Chapter 11 Restructurings
Using a novel dataset that covers individual debt claims against 136 bankrupt U.S. companies and
includes information on a subset of claims transfers, we provide new empirical insight regarding how a
firm’s debt ownership relates to bankruptcy outcomes. Firms with higher debt concentration at the start of
the case are more likely to file prearranged bankruptcy plans, to move quickly through the restructuring
process, and to emerge successfully as independent going concerns. Moreover, higher ownership
concentration within a debt class is associated with higher recovery rates to the class. Trading of claims
during bankruptcy concentrates ownership further but this trading is not associated with subsequent
improvements in bankruptcy outcomes and may, at the margin, increase the likelihood of liquidation.
Keywords: Chapter 11; Ownership structure; Distressed debt; Trading in bankruptcy
JEL classification: G23; G30; G33
1. Introduction
The ownership structure of corporate debt is potentially a key factor affecting the cost of financial
distress. However, past studies have been hampered by the fact that it is difficult to observe the ownership
of debt claims. We overcome this obstacle by using claim-level holdings and trading data on bankrupt
firms collected electronically by claims administration companies.1 For 136 large U.S. bankruptcy cases
filed between July 1998 and March 2009, these data identify the holder of each claim or the name of a
custodian, the amount of the claim, information on the claim type, and, for a subset of claims, ownership
transfers that occur during the bankruptcy process. We use these data to study the ownership structure of
firms that have filed for bankruptcy, how ownership changes during bankruptcy, and ultimately, how
ownership structure influences Chapter 11 outcomes (our dataset does not include private workouts).
We collect claim-level holdings data at two points during the bankruptcy: (1) at the start of the
case when the debtor files its Schedules of Assets and Liabilities (“Schedules”), and (2) near the end of
the case when votes are tabulated for the debtor’s Plan of Reorganization or Plan of Liquidation (“Plan”).
We observe holdings across the entire capital structure for each sample firm in the Schedules and for the
subset of all voting creditors at the time vote tabulations are submitted for a Plan. The second snapshot
allows us to see claims holdings for 75% of the original claims, weighted by face value. Between the two
snapshots, our data cover 71,358 different creditors in the 136 bankrupt firms.
We show that ownership concentration, measured as the share of total claims owned by the ten
largest creditors, is strongly associated with bankruptcy outcomes. When ownership is highly
concentrated at the bankruptcy filing, cases are more likely to be filed as prearranged or “prepackaged”
bankruptcies, in which much of the negotiation among creditors is completed prior to entering
bankruptcy. Subsequently, the bankruptcy process moves more quickly than it does in cases that are not
1 Note that the phrase “bankruptcy claim” is a broader concept than “security,” as it can include any of the firms’
liabilities, interests, or other rights-to-payment. In what follows, we will use the terms “claim holders” and
“creditors” interchangeably.

2
prearranged.2 Creditor concentration is also positively related to the speed at which traditional (non-
prearranged) Chapter 11 restructurings occur and to the likelihood that firms reorganize as independent
going concerns (as opposed to being sold or liquidated). Finally, we show that classes of debt that are
more concentrated within a firm’s capital structure have higher recovery rates at bankruptcy exit than
classes that are less concentrated. To the extent that faster bankruptcy resolution and survival as an
independent firm are indicators of a more efficient outcome, our results suggest that more concentrated
capital structures are associated with better restructuring outcomes.
Modern debt markets allow for extensive trading in the claims of distressed firms, including not
only bonds and bank debt, but also trade credit and lease, tax, insurance, and derivative claims. Our
dataset captures trading during bankruptcy cases through disclosures of “Rule 3001(e) transfers,”
composed chiefly of trade credit, canceled leases, and debt instruments not registered with the SEC or a
loan syndicate. We find that Rule 3001(e) trading increases creditor concentration during bankruptcy. For
example, by the end of the bankruptcy process, firms in the top tercile of “trading intensity”— measured
as total in-bankruptcy trading volume scaled by the total amount of claims outstanding—have voting
claims that are 16 percentage points more concentrated than firms in the bottom tercile, which is a
difference of nearly one standard deviation. Many of these increases in ownership concentration occur as
the result of consolidation of claims through purchases from trade creditors. (As a group, trade creditors
hold an average of 22.5% of the total claims volume in a bankrupt firm at the time of the filing, and
24.1% of the claims volume entitled to vote on a Plan.)
While creditor ownership concentration at the start of the case is positively related to the ability to
quickly and successfully reorganize, we find that further increases in creditor concentration are associated
with a higher likelihood that the restructuring ends in the liquidation of the firm. This finding is robust
under a variety of specifications and to an instrumental variables approach that uses characteristics of
2 Although this result is intuitive, strictly speaking, we cannot establish a causal link between ownership
concentration and prearranged filing because our identification is based on trading during bankruptcy, whereas
prearranged reorganization plans by definition are already set at the time of a bankruptcy filing.
3
trade credit—a proxy for the propensity to trade 3001(e) claims—to instrument for creditor ownership
concentration at bankruptcy exit. Although we cannot directly pin down the reasons for the trade-related
increase in the propensity to liquidate, we posit that some investors could take defensive “hold out”
positions that reduce the chance of successful reorganization. This is consistent with the theoretical work
by Gertner and Scharfstein (1991).
Our study is motivated by the theories of Diamond (1991), Rajan (1992), Berglöf and von
Thadden (1994), and Bolton and Scharfstein (1996), which argue that debt ownership structure has the
potential to influence renegotiation costs in distressed restructurings. In this regard, our paper contributes
to research dating back to Gilson (1990), Gilson, John, and Lang (1990), Brown, James, and Mooradian
(1993), Asquith, Gertner, and Scharfstein (1994), and James (1996), who examine how the amount of
bank debt versus public bonds in a capital structure impacts distressed workouts. Our paper extends this
literature by assembling a more complete picture of the creditors of distressed companies and showing
that overall ownership concentration is indeed associated with more efficient bankruptcy outcomes.
Our paper is also the first to show that claims trading during bankruptcy proceedings also
influences ownership concentration. Our finding that further ownership consolidation in bankruptcy is
indicative of a holdout problem, as well as our description of the prominent role of active investors as
buyers of 3001(e) claims, adds to work by Hotchkiss and Mooradian (1997) and Jiang, Li, and Wang
(2012), who study the involvement of hedge funds in bankrupt firm restructurings. We confirm that active
investors impact bankruptcy outcomes, but we also show a specific channel through which active
investors influence the bankruptcy process.
The rest of the paper proceeds as follows. Section 2 describes the data. Section 3 presents the
distribution of debt claim ownership by creditor type across the bankrupt firms in our sample and
analyzes the observed credit trading activity during bankruptcy. Section 4 analyzes the effects of
ownership concentration on bankruptcy outcomes, and discusses how trading during bankruptcy relates to
both creditor concentration and bankruptcy outcomes. Section 5 concludes.
4
2. Data
Outside bankruptcy proceedings, there exists only limited information on the identity and
ownership stake of the holders of public or private debt of U.S. corporations.3 Disclosures required under
the U.S. Bankruptcy Code provide fairly complete snapshots of the debt structure of bankrupt firms, both
at the time that the debtor files its Schedules and when votes are tabulated for the debtor’s Plan.
Bankruptcy-related disclosures also reveal transfers of ownership during the bankruptcy process. We
obtain such data from the four leading providers of claims administrative services in Chapter 11
bankruptcies: BMC Group, EPIQ Bankruptcy Solutions, Donlin Recano & Company, and Kurtzman
Carson Consultants (KCC). Claims administrators are hired by relatively large Chapter 11 debtors to
amass, organize, and make available information on all claims and claimholders.
Our sample consists of all Chapter 11 bankruptcy filings through March 2009 that were handled
by claims administrators, and in which ownership information was archived electronically at both the
filing of the Schedules and the tabulation of Plan votes. A total of 136 firms that filed for bankruptcy meet
these criteria; the earliest filing dates back to July 1998. Our Internet Appendix explains the structure of
the data received from the claims administrators. We report the full list of bankruptcies, along with
summary information on each bankruptcy, in Table A1.
2.1. Claims ownership and trading data
The first source of creditor ownership data is from the Schedules, filed soon after the company
enters bankruptcy, denoted as time t1 in Fig. 1. The Schedules require the debtor to disclose the list of all
known creditors and other claimants holding liabilities against firm assets. From these listings of
3 Unlike public equity holdings regulations, which require disclosures by insiders and owners of more than 5% of
outstanding shares, public bondholdings typically do not require disclosure of holdings or trades. The exceptions to
this rule are the bondholdings of insurers, which must be disclosed to the National Association of Insurance
Commissioners, and the bondholdings of registered investment managers, which must be disclosed to the SEC.

5
liabilities, we collect the name and address of the holder of each claim, the claim amount, and its
description, e.g., whether it is secured or unsecured with collateral.4
[FIGURE 1]
While the listing of claims at t1 is complete in that it contains all ownership claims filed, we
typically do not observe the identities of holders of SEC-registered bonds and notes. The holders are
hidden behind Depository Trust and Clearing Corporation (DTCC) member institutions that, for the
purposes of reporting, act as custodians on behalf of the original holders. In most cases, we observe only
the identity of the custodian, which is usually a large financial institution. However, as we show below,
holders of SEC-registered debt securities occasionally voluntarily disclose their identities. For those
cases, we observe the actual holders of the securities.
The second source of creditor ownership data is the record of votes cast on the Chapter 11 Plan
to resolve the debtor’s bankruptcy (time t2 in Fig. 1) through either a Plan of Reorganization or a Plan of
Liquidation; this is the Plan that is voted upon by creditors, which can be proposed by the debtor or by
creditors.5 This second data snapshot includes the identity of voting claimants, the number of different
claimholders that vote by proxy (e.g., through custodians that vote on behalf of multiple bondholders), the
claim amount, and the voting class, grouped by seniority, to which each claim has been assigned.
Because not all creditors are entitled to vote, the holdings we observe at t2 are a subset of the
holdings at t1. As illustrated in Fig. 2, claimants “unimpaired” under the Plan, i.e., those that will receive
100% of the value of their original claim, as well as impaired claimants that receive no recovery under the
Plan, are precluded from voting and thus are unobservable at t2. Among voting claimants, there is also a
4 We supplement the information gathered from the Schedules with all claims accounted for in the “Claims
Register,” which is an electronic filing system that enables parties to assert claims against the debtor that are left out
of, or incorrectly filed in, the Schedules. 5 A Chapter 11 Plan of Liquidation (or “Liquidating Plan”) lays out how assets of a company will be wound down to
maximize creditor recoveries. Chapter 11 Liquidating Plans allow the debtor and creditors to control the liquidation
of company assets, which make Liquidating Plans the preferred route for large firms to execute an orderly
liquidation. In contrast, Chapter 7 liquidations cede all control of assets to a liquidating trustee. Cases in which the
bankrupt firm is sold as a going-concern through a 363 sale typically end with a Liquidating Plan.
6
proportion of creditors who choose not to submit a vote on the Plan; we miss these claimants as well.6
While the observed holdings at t2 are a subset of the holdings at t1, the overlap between the two snapshots
is large. Across our sample, 53% of claimant classes are entitled to vote on the Plan, but the proportion
increases to 75% when we weight the claims by their face value.
[FIGURE 2]
We observe trading during bankruptcy for all claims that are required to submit proofs of
ownership transfer under Rule 3001(e) of the Federal Rules of Bankruptcy Procedure. This includes all
claims against the debtor that are not syndicated bank loans or public debt securities. Rule 3001(e)
reporting requirements explicitly exclude transfers in ownership of publicly traded debt securities (notes
and bonds), while transfers of syndicated loan commitments are excluded in practice because these trades
are tracked by the loan’s administrative agent. All other claims that trade during bankruptcy must be filed
as 3001(e) proofs of transfer, and are thus part of our claims trading dataset. These claims include all
trade credit and vendor claims, derivative instruments and swaps, intercompany claims, rejected lease and
lease “cure” claims, and tax claims. For the 3001(e) transfers, we observe the identity of the claim, the
seller, the buyer, and the face value of the claim.
Because 3001(e) claims are private and not tracked by one agent, trustee, or central registry, they
are difficult to identify for purposes of trading prior to the filing of the Schedules. Traders and dealers
interested in purchasing 3001(e) claims often must rely on the Schedules as a source for locating potential
claims sellers. This has two implications for our study. First, trading-related changes to the concentration
of holdings of 3001(e) claims are unlikely to occur prior to the bankruptcy filing. This stands in contrast
to loan and bond holdings, which can concentrate – or become more diffusely held – through pre-
bankruptcy trading in active secondary markets. Second, because the filing of the Schedules represents a
6 Using the BMC sample, which tracks the total face value of claims by voting classes that are entitled to vote, we
estimate the median proportion of claims within a voting class that vote to be 84% of the amount entitled to vote,
leaving approximately 16% as the proportion that do not vote.
7
relevant starting point for the trading of 3001(e) claims, our data should capture the bulk of all 3001(e)
claims transfers.
2.2. Identifying and categorizing creditors
Our initial sample of holdings contains a total of 1,461,967 claims across the 136 bankruptcies in
our study. To make the process of identifying creditors more manageable, we exclude claims of less than
$50,000. In so doing, we assume that holdings in claim sizes of less than $50,000 are unlikely to have a
significant influence on the outcome of the bankruptcy. This restriction condenses the sample to 122,530
claims, but on a value-weighted basis it amounts to a loss of only 2.4% of the original sample. We trim
the sample further by eliminating, to as great extent as possible, all entries of duplicate and erroneous
claims.7 This results in a final database of 79,527 claims held by 71,358 unique creditors at t1 or t2.
We use a variety of techniques to categorize the sample of 71,358 creditors into one of twelve
creditor “types.”8 Primarily, we match claimholder names to company and institution lists produced from
Standard and Poor’s Capital IQ, the BarclayHedge archive of hedge fund managers, and databases from
The Deal Pipeline. But we also identify types through common naming conventions. For instance,
individual funds can often be flagged via a Roman numeral at the end of the name (e.g., “CDO Fund IV”)
or because they end with the limited partner designation, LP (e.g., “CDO Offshore Fund LP”). While we
employ electronic text search methods and matching algorithms to link names to institutions, all matches
are also checked by hand for accuracy. For creditors that are trade creditors, financial institutions, and
investment funds, we link matched subsidiary names to the parent and categorize creditor types at the
parent level. Ultimately, we are able to successfully categorize 96.8% of the 71,358 creditors,
representing 98.3% of the face value of claims.
7 Specifically, the records from the claims administrators contained flags indicating if the claim was withdrawn,
invalidated, or otherwise disallowed, and these were removed from our sample, in addition to any claims that
appeared to be duplicates. 8 The creditor types are banks, corporations, bond custodians, active investors, insurance companies, real estate
companies, other financial companies, potentially financial companies, governments, persons, intra-company, and
unknown.

8
We focus our analysis on four key creditor types: (i) “banks,” including commercial and
investment banks, and their subsidiaries; (ii) “bond custodians,” which are institutions reporting on behalf
of the beneficial holders of bonds and notes, (iii) “trade creditors,” identified as holdings by non-financial
corporations, and (iv) “active investors,” which include holdings identified positively to be hedge funds
and private equity (PE) funds, as well as creditors with keywords in their name that suggest they are an
asset management fund or firm. (Other claimholders are grouped together.)
One difficulty arises in categorizing subsidiaries of banks that are engaged in hedge fund- and PE
fund-type activities, including proprietary trading groups within a bank, credit- and distressed-focused
investment subsidiaries, and in-house, bank-financed PE funds. Such bank subsidiaries are active
investors, yet remain housed inside a large bank holding company. These bank subsidiaries are not always
identified separately from their parent companies in our data and so, for purposes of consistency, we
connect all these subsidiaries to their bank holding company parent and consider their debt ownership to
be “bank” holdings.
We use several techniques to distinguish bond custodial holdings from other financial institution
holdings. We automatically treat claims associated with large custodial companies, such as ADP Clearing
and Outsourcing Services, and financial institutions that work primarily as bond trustees, such as Bank of
New York, State Street Bank, or Wilmington Trust Company, as custodial holdings. We also classify any
holding as custodial when the named holder includes the word “trustee,” “custodian,” or “agent” (e.g.,
“J.P. Morgan as trustee”). In addition, we examine each bankruptcy plan “Disclosure Statement” for the
identity of bond indenture trustees. Finally, we classify as custodians any institutions that report votes for
more than one investor in the vote tabulation.
To ensure that our “trade creditors” designation flags actual holdings by a bankrupt company’s
suppliers, we perform two tests. First, we manually check that large corporations flagged as trade
creditors are trade partners of the bankrupt firms. Second, we map all creditors classified as trade
creditors to Compustat, and using this mapping, we compare the industry distribution of trade partners in
our sample to the industry distribution of trade partners from U.S. industry input-output tables from the

9
U.S. Bureau of Economic Analysis (BEA) (www.bea.gov/industry/).9 The two distributions are very
similar.
2.3. Summary of bankrupt firms
Panel A of Table 1 reports summary information on the 136 bankruptcies in our sample, and
compares the distribution of our sample to the firms in the UCLA-LoPucki Bankruptcy Research
Database (BRD) that filed for bankruptcy between 1998 and 2009. The BRD tracks all SEC-registered
firms that file for bankruptcy with assets greater than $280 million.10
The electronic storage of data by claims administrators became common only after the early
2000s. Therefore, compared to the BRD sample, filings in our sample are concentrated in the latter half of
the sample period, including the uptick in filings in 2008 that resulted from the global financial crisis. Our
sample is also more heavily weighted toward wholesalers and retailers (23.5% of cases, compared to
14.2% in the BRD sample), potentially because delegating claims management might make more sense in
these cases. However, as in the BRD sample, manufacturing firms represent the bulk of the bankruptcies.
Consistent with the practice of many large firms that file for bankruptcy, our firms file for
Chapter 11 protection primarily in Delaware (40.4% of cases) and the Southern District of New York in
Manhattan (22.1% of cases), and the remainder (37.5%) file in 28 separate courts across U.S. federal
court districts. The distributions of filings by court venue closely mirror those in the BRD.
Firms that complete a substantial portion of their negotiations with creditors out of court can file a
so-called “prearranged” (or “prepackaged”) bankruptcy. A debtor filing a prearranged bankruptcy
typically has a draft Plan in place and substantial creditor approval prior to filing. Prearranged filings
move quickly through bankruptcy and are generally thought to be less expensive than traditional, “free-
9 Input-output tables track the flow of goods and services used during production processes across different
industries. 10
See http://lopucki.law.ucla.edu/. The actual asset size cutoff for the dataset is 100 million in 1980 dollars, which
corresponds to roughly $280 million as of the end of 2013.

10
fall” bankruptcy filings.11
In our sample, 18.7% of the filings are prearranged, compared to 27.2% of
filings in the BRD sample.
We gather information on the outcome of each bankruptcy case from The Deal Pipeline’s
Bankruptcy Insider archive, and from the Disclosure Statements filed in court with each debtor’s Plan.
We classify each bankruptcy outcome into one of three categories: (1) a reorganization, in which a firm
exits Chapter 11 through a Plan of Reorganization, emerging intact as a free-standing entity with a new
capital structure, (2) a sale of the firm as a going concern to a financial or strategic buyer, typically
through a “Section 363” sale, and (3) a liquidation of the firm’s assets, after which no primary going
concern remains at the end of the case.
Classifying outcomes into one of the three categories requires some judgment, particularly when
it comes to the treatment of companies that engage in asset sales, accomplished through guidelines set
under Section 363 of the U.S. Bankruptcy Code. Section 363 sales are conducted via auction and can
range from dispensing of a few company assets to the sale of the entire company, either as a going
concern or in pieces through liquidation. We classify the outcome of a case according to what happens to
the preponderance of the assets during the case. We code an outcome as a “reorganization” if a free-
standing operating company emerges from bankruptcy under a Plan of Reorganization, even if some
assets of the company are sold during the case. We code an outcome as a “sale of a going concern” if the
bulk of a company’s assets are sold as a free-standing operating company to an acquirer during
bankruptcy so that no operating entity remains in bankruptcy to reorganize after the sale. Finally, we code
an outcome as a “liquidation” if all of the company’s assets are sold—or planned to be sold—in pieces so
that no operating company exists to reorganize upon completion of the sale.
Just under half (45.5%) of our sample firms exit via a traditional reorganization. Another 22.4%
are sold as a going concern (9.7% to financial buyers and 12.7% to strategic buyers), and 32.1% are
11
For example, see “Survey Finds Free-Fall Bankruptcies Becoming More Rare,” Wall Street Journal Bankruptcy
Beat, June 15, 2011(http://blogs.wsj.com/bankruptcy/2011/06/15/survey-finds-free-fall-bankruptcies-becoming-
more-rare).
11
liquidated piecemeal. By comparison, BRD firms reorganize in 53.8% of the cases, are sold in 8.1%, and
liquidate 38.1% of the time. The differences between the two samples likely reflect slightly different
judgments by BRD as to what constitutes a going-concern sale versus a reorganization. In any case, the
splits between reorganizations and liquidations are reasonably similar. The liquidation frequency in our
sample is more in line with Jiang, Li, and Wang (2012), who employ similar rules for coding and report a
liquidation rate of 29%.12
Across reorganizations and going-concern sales, “financials”—banks and active investors—are
the largest equity investor at exit in nearly two-thirds of firms that emerge from bankruptcy. In
reorganizations, the “fulcrum” class of voting claims—the class of claimholders that receives the
controlling interest (more than 50%) of the reorganized equity at bankruptcy exit—is most often the class
holding prepetition senior lender claims (29.3%), followed by noteholders and bondholders (24.1%). But
controlling equity also goes to general unsecured creditors a fair amount of time (19.0%), as well as to the
original equity holders (15.5%).
[TABLE 1]
Table 1, Panel B reports creditor recovery rates and times in bankruptcy for our sample firms,
split by bankruptcy outcome. For reorganizations, we calculate firm-level recovery rates by dividing the
estimated enterprise value plus distributable cash, as reported in the bankruptcy case Disclosure
Statement, by the value of liabilities reported at filing. For sales of going-concerns and liquidations, we
calculate firm-level recovery rates by dividing total sale proceeds by the value of liabilities reported at
filing. When the enterprise value or sale proceeds are unavailable, we compute recovery rates by
calculating the weighted average recovery rate of the claimant classes (including both impaired and
unimpaired classes) reported in the Disclosure Statement, where the weights correspond to the pre-filing
face value of the claims in that class.
12
Moreover, differences in how outcomes are coded as reorganizations versus going-concern sales do not change
any inferences from our regression results.
12
The two recovery-rate measures are comparable across the sample, although the weighted
average recoveries tend to understate average recovery rates relative to the enterprise value at exit-to-
liability measure in going-concern sales, and to overstate recoveries in liquidations. A general pattern that
emerges is that median estimated recovery rates are highest in reorganizations (Value at exit/Liabilities =
58.6%) and lowest in liquidations (Value at exit/Liabilities = 34.9%). Our estimated recovery rates are
very close to the mean total recovery rate of 52% reported by Moody’s Investors Service (2007) and 54%
reported in Hotchkiss, Smith, and Strömberg (2014).
The average time in bankruptcy for our sample firms is just over one year, which is similar to the
average times in bankruptcy reported by Bharath, Panchapegesan, and Werner (2012), Jiang, Li, and
Wang (2012), and Hotchkiss, Smith, and Strömberg (2014). Bankruptcy liquidations are the slowest to
resolve (median of 421 days) while bankruptcies with going-concern sales resolve the most quickly
(median of 315 days).13
Panel C of Table 1 reports characteristics of bankrupt firms. Our debtor firms tend to be smaller
(median assets of $250 million at filing and close to 2,000 employees) than the BRD firms (median assets
of $567 million at filing and 2,900 employees). This discrepancy is due to the fact that the BRD sample
excludes all private firms and includes only public firms with assets greater than $280 million (in 2013
dollars). Our sample includes both private and public firms with no explicit size restriction.
3. Firm Ownership through the Bankruptcy
3.1. Credit ownership concentration
The goal of our paper is to understand the distribution of credit ownership in bankrupt firms, how
trading impacts creditor concentration, and ultimately, how ownership concentration and trading affect
bankruptcy outcomes. In Table 2, we analyze the distribution of credit claims ownership at t1 and t2 across
13
Only two firms remained in bankruptcy at the point when we finished coding the data (in late 2011). Both
companies were in bankruptcy because they inherited of a large overhang of asbestos-related, class-action litigation
claims. We will exclude these firms when analyzing bankruptcy duration, but retain them for the rest of the analysis.
However, our results are robust to excluding these two cases completely from all analysis.
13
creditor types and report the total held by the ten creditors with the largest ownership stakes in the
company (what we call “top-10 creditors”). Credit claims ownership is defined as the percentage of the
book value of claims held in a bankrupt company by a given creditor type.
Banks are substantial and concentrated holders of claims throughout the bankruptcy process.
Table 2 shows that banks are present in the capital structure of 88.7% of the cases at t1 and are voting
creditors in 72.4% of the cases at t2. At both points in time, banks hold an average of 21.7% of all the debt
in the bankrupt firm (with median holdings of 13.5% at t1 and 10.7% at t2) and are among the ten largest
creditors in nearly 70% of the firms. These findings are consistent with Gilson (1990) and Gilson, John,
and Lang (1990), who argue that banks are significant and concentrated creditors in the capital structure
of distressed firms.
What has been missed by much of the existing literature is the fact that trade creditors represent at
least as much as of the capital structure of bankrupt firms as do banks. According to Table 2, trade
creditors are present in 97.0% of the cases and hold an average of 22.5% (median of 14.6%) of the
amount of claims at t1. Trade creditors are also large participants at t2, accounting for 24.1% (median of
17.2%) of all voting claims. Note that the magnitude of holdings of trade creditors in our sample is
consistent with the findings in Rajan and Zingales (1995), who report that trade credit represents 22.8% of
the liabilities of public U.S. firms.14
We observe active investors in 76.7% of the firms in our sample. This proportion is consistent
with Jiang, Li, and Wang (2012), who report evidence of hedge fund participation in 87% of their sample
of bankrupt firms. Table 2 shows that active investors hold an average of 9.8% (median of 0.5%) of
claims and are among the largest ten creditors in 35.3% of the sample firms at t1, the start of bankruptcy.
By the time votes are tabulated on a Plan, t2, active investors hold 15.0% (median of 2.8%) of voting
claims and are among the largest ten creditors in 56.9% of the cases. The observed increase in holdings by
active investors partly derives from purchases of notes and bonds that are reported anonymously as
14
Although trade creditors have a high incidence among the top-ten creditors, note that the distribution of ownership
among the top creditors is very skewed, and trade creditors’ stakes tend to be relatively small.
14
custodial holdings at t1, but are voluntarily disclosed by the active investors at the time that they vote on
the Plan.15
As we show in the next section, active investors also purchase significant amounts of 3001(e)
bankruptcy claims during the bankruptcy process.
Registered note and bond issuances, identified by the names of the custodial institutions that
report holdings on behalf of beneficial owners, are a relatively small part of bankrupt firms’ capital
structures. Notes and bonds are present in 44.4% of the firms in our sample and, as noted in the previous
paragraph, they represent an average of 12.5% (median of 0.0%) of the claims in the capital structure of
all filing firms. Although they represent a small portion of the capital structure, notes and bonds could be
important at the margin to strategic investors that take positions in the capital structure in advance of a
bankruptcy filing. For instance, if active investors acquired all notes and bonds of the firms in our sample
(including holdings reported through a custodian) they would hold an average of 20.9% (15.0% + 5.9%)
of claims that can vote on a Plan. Still, at the median, the stake held by active investors and bondholders
together is small, representing less than 3.0% of claims in a bankrupt company.
Table 2 also reports the distribution of holdings for creditor types other than banks, trade
creditors, active investors, and bond custodians. The largest holders of claims in this group are
individuals, who hold an average of 11.6% (median of 3.5%) of claims in the capital structure.
[TABLE 2]
The last line of Table 2 summarizes the importance of the largest ten creditors across the
bankruptcy cases in our sample. On a dollar-weighted basis, the top-10 creditors own on average 83.0%
of the total claims reported at t1. The median ownership is even higher, at 88.4%. However, there is
significant variation across the bankrupt companies, with holdings of the top-10 creditors ranging from
43.2% at the 5th percentile to 100% ownership at the 95
th percentile. The statistics are similar for the ten
largest creditors at t2, with mean and median ownership of 84.6% and 89.6%, respectively.
15
This is consistent with the fact that holdings through bond custodians drop from a reported average of 12.3% of
claims at the start of the case to 5.9% of claims at the time of vote tabulation. However, the drop in custodial
holdings at the voting stage is also consistent with the fact that subordinated notes and bonds are often deemed “out
of the money” under a Plan, and their holders are not entitled to vote.
15
3.2. Claims trading during Chapter 11
Table 3 summarizes the flow in the trading of 3001(e) claims during the bankruptcy process.
Panel A reports the proportion of total claims traded in our sample that are bought and sold by each
creditor type. Panel B reports the average incidence of buyers and sellers of different creditor types across
the bankruptcy cases. There are several noteworthy patterns in this table. Banks appear to be both large
buyers and large sellers of 3001(e) claims, but their purchases and sales are of a similar scale, so their net
position is neutral.16
This pattern is consistent with banks serving in the role of broker-dealers for 3001(e)
claims through their fixed income trading desks. By contrast, active investors are large net purchasers,
and trade creditors are large net sellers, of 3001(e) claims. Active investors are responsible for 37.8% of
all buy transactions, purchasing on average 55.4% of all traded 3001(e) claims in any given bankruptcy,
an amount that is statistically different from any other investor category at the 1% level. Whereas active
investors rarely sell their claims, trade creditors account for 34.5% of all claim sales, on average
representing 61.1% of all claims sales in any given bankruptcy, a difference from other investor types that
is again significant at the 1% level.17
In unreported results, we directly track how claims change hands across creditor types and
observe that active investors are the largest buyers of claims held by trade creditors. We find that 42.6%
of claims held by trade creditors that are sold during bankruptcy are purchased by active investors. The
second largest buyer is banks, which purchase 25.2% of these claims from trade creditors.
[TABLE 3]
For 36 of the bankruptcies (clients of the claims administrator BMC Group), we are able to track
individual claims from the point that they are registered in the Schedules through to the Plan vote
16
We cannot distinguish in the data cases where the transaction takes place within the same bank parent company.
E.g., a commercial bank could sell its position to an active investor that has the same parent company. 17
Panel B of Table 3 indicates that, on average, trade creditors represent 3.7% of the buyers of 3001(e) claims but
10.4% of the average volume of 3001 (e) claims purchased in a given bankruptcy. The high average volume appears
to be driven by a few cases in which industry peers of the bankrupt firm acquire a large fraction of the claims. These
corporations might buy claims as a strategy for winning business. Alternatively, some of the larger single claims
could be supplier contracts or leases that are not rejected during the bankruptcy process and, instead, are acquired by
interested corporations.
16
tabulation. This enables us to observe the extent to which traded claims have strategic value—
specifically, whether they are later entitled to vote under the Plan. Panel A of Table 3 shows that trade
creditors are large net sellers of both non-voting and voting claims, accounting for 65.8% of the sales of
non-voting claims and 70.3% of sales of voting claims. Meanwhile, banks and active investors show a
bias towards purchasing claims that are later entitled to vote on a Plan. Banks’ share of net buys of voting
claims is 19.1% (compared to 2.9% of non-voting claims, significant at the 10% level), while active
investors purchase a net 69.3% of all voting claims (compared with 54.6% of non-voting claims,
significant at the 10% level). Much of the differences in active-investor purchases are driven by hedge
funds and PE funds, whose net-purchase positions in voting claims (39.4%) outweighs their net positions
in non-voting claims (28.4%) by nearly 40%. This evidence suggests that purchases of Chapter 11 claims
by banks and active investors are strategic, in the sense that these purchases concentrate on claims that
will allow the investors to influence the Plan vote.18
In addition to the results in Table 3, we find that a disproportionally large amount of claims
traded are those that are entitled to vote. Voting claims are more than two-and-a-half times more likely to
trade than a claim that does not entitle its holder to vote. Another interesting fact is that trade timing is
bimodal. The first period of high trading volume occurs shortly after the filing of the Schedules. Towards
the end of the case, there is another, significantly smaller, period of high trading intensity. Very little
trading occurs in the middle of cases. On a volume-weighted basis, 91% of all trades happen during the
first half of a bankruptcy case. The fact that most of the 3001(e) trading takes place immediately
following the bankruptcy filing suggests that disclosures of claimant names and addresses through the
Schedules catalyzes trading in this market.
18
However, it should be noted that the relationship between claims trading and voting rights may be endogenous.
For example, it could be that after purchasing a claim the new owner works to ensure that his claim is deemed
impaired, thereby allowing the investor to vote at t2. Alternatively, a claimholder may have an incentive to push for
a full recovery, in which case the holder would have no vote. To account for this endogeneity, we instrument for the
amount of trading in the regressions in Tables 6 and 7. Appendix Table A.IV investigates further which factors
affect the likelihood that a claim is traded.
17
4. Creditor concentration and bankruptcy outcomes
Given the background on the distribution of ownership and trading in Ch. 11 claims, we turn now
to studying how credit ownership concentration varies in the cross-section of bankruptcies and how this
variation relates to bankruptcy outcomes. In what follows, we measure the concentration of credit
ownership as the share of bankruptcy claims owned by the top-10 creditors in the firm.19
Throughout the analysis we include firm-specific controls that have been found to be related to
bankruptcy outcomes. Moulton and Thomas (1993) and Campbell (1996) identify the size of the firm and
its profitability as key variables that influence bankruptcy outcomes. To account for this, we control for
the logarithm of asset size, based on the value of assets reported by firms in their original Chapter 11
petitions. Profitability is measured using an indicator variable equal to one if the firm had positive
EBITDA prior to filing, and zero otherwise. Because EBITDA figures are available only for a subset of
the sample firms (see Table 1), we include an indicator variable equal to one for those firms that have
EBITDA data available. Motivated by Acharya, Bharath, and Srinivasan (2007), each regression also
includes industry fixed effects.
We add a dummy variable equal to one when a firm files for bankruptcy during a recession, as
defined by the National Bureau of Economic Research (NBER). Controlling for economic downturns is
important because the bankruptcy experience is likely to be different for firms that file during a recession.
For instance, Iverson (2014) shows that bankruptcy caseloads are much heavier during recessions, giving
judges and attorneys less time to devote to each case. Also, negotiations between creditors likely differ
during recessions because outside options vary over the business cycle and because it is more difficult to
obtain outside financing during the restructuring. It is also possible that firms filing for bankruptcy in a
recession are intrinsically different from firms that default during normal times, leading to different
bankruptcy outcomes.
19
In an earlier version of the paper, we used the dollar-weighted Herfindahl-Hirschman Index to measure ownership
concentration across the entire capital structure. Our current measure is more conservative, since it only counts the
largest claimholders. However, the correlation between the two measures is 0.61, and by either measure we find that
trading leads to higher concentration.
18
Finally, in our regressions analyzing bankruptcy outcomes, we include a control dummy for
whether the firm obtained debtor-in-possession (DIP) financing. Dahiya, John, Puri, and Ramirez (2003)
show that firms with DIP financing move more quickly through bankruptcy and are more likely to emerge
intact from the Chapter 11 process.20
For our regressions, the sample of bankrupt firms decreases from 136 to 119 observations. This
reduction stems from the fact that for 14 firms in our sample, the claims administrators were retained only
to perform the voting tabulation at t2, so we lack t1 ownership information for these firms, and for an
additional three firms we were unable to obtain data on total assets.
4.1. Creditor concentration at the onset of bankruptcy
4.1.1. Determinants of creditor concentration at t1
We first consider determinants of creditor concentration at the time a company files for
bankruptcy. The goal of this is twofold. First, we would like to better understand how debt ownership
concentration at the start of a bankruptcy restructuring relates to the types of debt in the capital structure
of the bankrupt firm. For instance, as discussed above, claims held by trade creditors cannot be easily
traded in advance of the bankruptcy filing. If the frictions associated with buying and selling trade
creditor claims prior to filing preclude trading that would otherwise concentrate holdings of trade claims,
then debt structures containing significant trade credit should be less concentrated at filing than structures
with fewer accounts payable. Second, we are interested in whether observed trading in a firm’s more
easily-traded debt instruments—loans and bonds—in advance of bankruptcy is related to debt ownership
consolidation at the start of the case.
Table 4 reports cross-sectional regressions of creditor concentration at t1 on pre-filing measures of
the mix of debt instruments in a bankrupt company’s capital structure and on indicators of trading in the
20
We also verify that our results—including the effect of trade on ownership and the effect of ownership on the
bankruptcy outcomes—are not driven by cases filed in Delaware or Southern New York, cases filed in 2008 and
2009, or cases filed after 2005 amendments to the U.S. bankruptcy law. Regarding this last point, there seems to be a
common belief that 2005 changes might have increased the frequency of prearranged bankruptcies; so, when
looking at bankruptcy outcomes, we explicitly control for prearranged bankruptcies.

19
company’s debt claims. The first set of explanatory variables (labeled “Capital structure”) includes the
share of claims owned by trade creditors and by active investors, and three dummy variables that are
equal to one when bank debt, public debt, or either bank or public debt represent more than 5% of the
debt structure of the bankrupt firm (we assume that shares of less than 5% in these categories are unlikely
to impact debt concentration). As an additional control, we include the share of claims in the capital
structure that are unsecured. We add this variable in order to ensure that our results are driven by the
share of trade creditors, rather than by differences between secured and unsecured creditors. The second
set of variables (labeled “Pre-bankruptcy trading”) are proxies for trading activity in a company’s loans
and bonds during the period leading up to the bankruptcy filing. Following Drucker and Puri (2009), we
assume trading in a sample firm’s loans occurs prior to bankruptcy when a secondary market price quote,
as tracked via Markit dealer surveys, exists on the loan within one year (or, under an alternative
definition, five years) of the filing. In the spirit of Goldstein, Hotchkiss, and Sirri (2007) and
Bessembinder and Maxwell (2008), we measure pre-bankruptcy bond trading using the FINRA Trade
Reporting and Compliance Engine (TRACE) dataset to track whether there were trades in the bonds and
notes of our sample firms in a one-year window prior to bankruptcy. We define separate dummy variables
that are equal to one when there is evidence of loan trading (using a one-year and five-year window),
bond trading (one-year window), and loan or bond trading (one-year window) prior to the bankruptcy
filing.
[TABLE 4]
The results in Table 4 indicate that creditor concentration at t1 declines as the share of claims
owned by trade creditors increases; this implies that firms in which trade credit represents a large part of
the capital structure enter Chapter 11 with less concentrated creditor ownership than firms with less trade
credit. The magnitude of the estimates is economically large: a one-standard-deviation increase in the
share of claims owned by trade creditors (22%) reduces the proportion of holdings by the top-10 creditors
by 3 to 4 percentage points. The estimates associated with the pre-bankruptcy trading variables show that
debt ownership structures are also more concentrated at t1 when trading in a firm’s debt occurs prior to
20
filing, which is consistent with the idea that pre-filing trading increases creditor concentration. For
instance, the top-10 creditors own 6.4 percentage points more of the outstanding debt at t1 when a
company’s loan or bond is traded in the year prior to filing for bankruptcy.
4.1.2. Creditor concentration at t1 and bankruptcy outcomes
We now turn to examining the extent to which creditor concentration at t1 explains the outcomes
of the Chapter 11 restructuring. Table 5 reports results in which characteristics of the Chapter 11
restructuring are regressed on creditor concentration at t1 and other control variables. We focus on six
dependent variables in the regressions: an indicator variable that is equal to one if the bankruptcy filing
was prearranged, meaning that many of the restructuring negotiations occur out of court prior to filing;
the number of months the firm remains in bankruptcy; a set of dummy variables identifying the
bankruptcy outcome according to whether a firm exits Chapter 11 through a traditional reorganization, a
going-concern Section 363 sale, or through a piecemeal liquidation; and the overall recovery rate across
all creditor classes. For the dependent variables determined at the end of the bankruptcy, as well as the
control variables included in Table 4, we also include a dummy variable for whether the firms receive
DIP financing.
The results in Table 5 show that firms are significantly more likely to restructure through a pre-
arranged filing, to spend a shorter time in bankruptcy, and to emerge via a reorganization of the existing
entity when debt ownership is more concentrated at t1. The estimates in specification (1) of Table 5, Panel
A imply that for every one-standard-deviation increase in the share of debt claims held by the top-10
creditors, the likelihood that the restructuring will be completed through a prearranged agreement rises by
6.3 (= 0.371*0.17) percentage points. While prearranged deals are structured to move much faster through
Chapter 11, specification (2) of Table 5, Panel A shows that even when the incidence of a prearranged
filing is held constant, the time spent restructuring in Chapter 11 declines by 1.17 (= -6.905*0.17) months
for every one-standard-deviation increase in top-10 creditor ownership. Meanwhile, the estimates in
specification (3) of Table 5, Panel A imply that the likelihood of emerging from bankruptcy via

21
reorganization increases by 7.5 (= 0.443*0.17) percentage points for every one-standard-deviation
increase in creditor concentration. Specification (4) highlights that this effect is not solely driven by
prearranged bankruptcies, and that creditor concentration at the onset of bankruptcy is also important for
traditional, non-prearranged (“free-fall”) filings. The large negative coefficient of creditor concentration
in the liquidation regression (-0.567) also suggests that more concentrated debt structures are less likely to
end in a piecemeal liquidation, although the implied t-statistic of -1.52 (= -0.567/0.372) is not statistically
significant at conventional levels.21
While the coefficient on creditor concentration in specifications (8)
and (9) is negative, it is insignificant in (8) and only marginally significant in (9). Further, this
significance is not robust in further specifications below, suggesting that there is not a strong relationship
between creditor concentration and recovery rates.
[TABLE 5]
These findings are consistent with the ideas put forth in theoretical literature including Bolton and
Scharfstein (1996) that concentrated debt structures reduce creditor coordination costs, making it easier
for a company to restructure. We also find that more concentrated structures are associated with a higher
likelihood of successfully emerging as a reorganized firm, and possibly, a lower likelihood of liquidating
piecemeal. Coupling the results from Table 5 with the inferences from Table 4, our findings thus far
suggest that debt ownership structures with lower levels of trade claims and higher levels of pre-filing
trading are associated with quicker—and potentially less costly—restructurings.
One of the contributions of our paper is an improved measure of ownership concentration at
bankruptcy over those measures used in previous literature, at least for the bankruptcies that took place in
more recent periods. Panel B of Table 5 shows this point. We examine two measures used in the previous
literature: (i) bank debt as a fraction of total debt, used by Gilson (1990), Gilson, John, and Lang (1990),
and (ii) public debt as a fraction of total debt, used by Brown, James, and Mooradian (1993), Asquith,
21
Prearranged bankruptcies can lead to either reorganizations or sales: out of 25 prearranged bankruptcies in our
sample, 17 end in reorganizations (27.9% of all reorganization cases), and 8 end in sales (26.7% of all sales cases).
We omit prearranged bankruptcy control for liquidations, since these are mutually exclusive categories.

22
Gertner, and Scharfstein (1994), and James (1995, 1996). The correlation between the holdings of top-10
creditors at t1 and bank debt as a fraction of total debt is 0.18 and is statistically insignificant at
conventional levels. The correlation between holdings of top-10 creditors and public debt as a fraction of
total debt is 0.21, and only marginally statistically significant. Consistent with these correlations, the
results in Panel B indicate that our findings are largely unaffected by the inclusion of proxies for
concentration from earlier studies. On the other hand, the only statistically significant earlier proxy is of
the opposite sign to what the literature would predict.
4.2. Creditor concentration at the end of bankruptcy
4.2.1. Claims trading and creditor concentration
The evidence presented in Table 3 establishes the existence of an active market for 3001(e)
claims trading during bankruptcy. In this sub-section, we assess the effect of this trading on credit
ownership concentration, and examine how related changes in credit ownership affect bankruptcy
outcomes.
Panel A of Table 6 estimates the impact of 3001(e) trading on ownership concentration at t2. We
measure 3001(e) trading using the discrete variable Claims trading intensity. We adopt a discrete measure
because the distribution of the share of traded claims is heavily skewed; a number of firms experience no
claims trading, while other bankrupt firms experience heavy 3001(e) claims trading.22
To construct
Claims trading intensity, we assign a zero to all firms that experience no trading, and code all other firms
according to where they fall in the distribution of total claims traded as a share of total claims. For firms
in the lowest tercile of trading, Claims trading intensity is equal to 1; the variable is equal to 2 for firms in
the middle tercile, and it is equal to 3 for firms in the highest tercile.
22
The interpretation of our results is robust to the use of a continuous measure of claims trading intensity, measured
as the proportion of trade credit claims that are transferred, with the two outlying values winsorized at the third-
highest level of claims trading intensity. Using the continuous measure, the statistical significance of the results in
Table 6, Panel A are reduced to the 10% level, but all relations remain otherwise robust.
23
We consider two measures of the dependent variable. The first two columns in Panel A of Table 6
employ the level of ownership concentration at t2 as the dependent variable, but also include ownership
concentration at t1 as a control in the regression. Thus, the regressions in the first two columns measure
the marginal impact of Claims trading intensity on ownership concentration at the end of the case,
holding concentration at the start of the case constant. The second two columns of Panel A use the change
in ownership concentration between t1 and t2 as the dependent variable. For these regressions, we
implicitly assume that the distribution of ownership across the capital structure at t1 provides a one-to-one
proxy for the distribution of ownership among voting classes at t2.23
Columns (1) and (3) of Panel A report ordinary least squares (OLS) regressions of t2
concentration on Claims trading intensity. The results indicate a strong positive relation between 3001(e)
claims trading in a firm and changes in creditor concentration over the course of the case. The OLS
estimates imply that moving from a firm with no recorded 3001(e) claims to a firm in the highest tercile
of trading (i.e., an increase of 3 in Claims trading intensity) results in a 0.45 (= (3*0.025)/0.167) standard
deviation increase in the overall level of creditor concentration at t2, and a 0.84 (= (3*0.044)/0.157)
standard deviation increase in the change in concentration between the Schedules and Plan vote
tabulation.
[TABLE 6]
If claims ownership at t1 is a good proxy for the distribution of voting claims ownership at the
start of the case, then any changes in concentration between t1 and t2 must be due to trading. In this case,
the OLS regressions in Table 6 provide positive causal support for the idea that trading in 3001(e) claims
during the case concentrates ownership structure. However, concentration at t1, calculated across all
23
Using the 36 cases from BMC group, we can construct a direct measure of the change in ownership concentration
among claims at t1 that are eventually eligible to vote. While the sample size is small, estimates produced by limiting
the regressions to these 36 exactly-measured cases are similar to the results using the larger sample. In this sub-
sample, we find that the correlation between the share of claims owned by the ten largest claimholders at t1 and t2 is
0.68, which is significant at the 1% level.
24
claims, could measure voting concentration at t2 with error. If trading in 3001(e) claims correlates with
this error, the relation between trading and t2 concentration could be spurious.
To address these issues, we use an instrumental variables approach to capture exogenous
variation in the propensity to trade 3001(e) claims in bankruptcy. We use two instruments: Share of
claims owned by trade creditors, defined as the total dollar amount of claims owned by trade creditors at
t1, scaled by the firm’s total amount of all claims at bankruptcy; and Share of mid-size claims owned by
trade creditors, defined as the total dollar amount of claims whose value is between $100,000 and
$300,000 that are owned by trade creditors at t1, scaled by the firm’s total amount of all claims at
bankruptcy. As we have shown, trade creditors represent a significant part of the filing firms’ ownership
structure and are large net sellers of claims. Because of this, firms with more trade credit are expected to
have more claims available for sale. The basic idea behind using trade credit as an instrument for trading
intensity is that a bigger supply of claims for sale leads to more opportunities to purchase and consolidate
such claims. The second instrumental variable reflects the structure of trade credit; the cut-offs
correspond to the bounds of the second tercile of the cross-sectional distribution of claim size.24
We
explicitly control for firm size in the regressions, but we obtain similar results if we construct the cutoffs
after scaling claims by firm size, instead of using absolute cutoffs. We posit that firms with a large
amount of mid-sized trade credit claims would be expected to have more in-bankruptcy trading because
small claims are costly to transact and large claims often carry a strategic interest for the supplier, e.g., a
large supplier might be interested in retaining its trade claim to preserve a good relationship with the
bankrupt firm. Thus, mid-size claims are most likely to be available for sale. In the Internet Appendix, we
use details of our claims data to show that medium-sized claims are more likely to be sold than large or
small claims.
24 𝑆ℎ𝑎𝑟𝑒 𝑜𝑓 𝑚𝑖𝑑 𝑠𝑖𝑧𝑒 𝑐𝑙𝑎𝑖𝑚𝑠𝑖 =
∑ 𝐶𝑖𝑗𝑗|𝑀
∑ 𝐶𝑖𝑗𝑗, 𝑀 = {𝐶𝑗: 𝐶𝑜𝑟𝑝𝑜𝑟𝑎𝑡𝑒 𝑐𝑙𝑎𝑖𝑚𝑠 ∩ 𝑇1 < 𝐶𝑖𝑗 < 𝑇2} . 𝐶𝑖𝑗 is the claim j for
bankruptcy case i, and T1 and T2 indicate cross-sectional terciles cut-offs for corporate claims.
25
An appealing characteristic of using trade claims as an instrument is that they are unlikely to
change hands through trading prior to the bankruptcy filing because investors looking to purchase
distressed trade credit lack a mechanism for identifying trade creditors prior to the filing of the Schedules.
So, because most trade credit claims trading occurs in bankruptcy, even if the bankruptcy is anticipated,
we can accurately assess change in ownership resulting from transfers of trade claims during the
bankruptcy process.
While our instruments are not fundamentally exogenous (they are not the result of a natural
experiment), they satisfy the conditional independence assumption. As mentioned previously, we control
for firm size, profitability, and industry, as previous research has found that these factors influence
bankruptcy outcome. More broadly, the relationships with trade creditors are likely to be set well in
advance of the firm’s financial distress, and are determined largely by the economic size of the
transaction between the parties, not by the potential outcome of the bankruptcy case. It is possible that
trade creditors could better understand the nature of a customer’s assets (Petersen and Rajan, 1997)—and
the potential outcome of the bankruptcy process—and change their trade credit policy in anticipation of
financial distress, but the fact that trade creditors’ ownership stakes in our bankrupt firms (22.5%) is
nearly identical to their stake in non-bankrupt firms (22.8%, reported in Rajan and Zinagles, 1995)
suggests that they are not doing so on average.
Panel B in Table 6 reports results from the first-stage of the two stage least squares (2SLS)
regressions. The table shows a strong positive correlation between both instruments and claims trading
intensity. The F-statistic for the exclusion of the instrumental variables is 10.20, with p-values close to
zero. Each of the variables is also individually significant.
We report estimates of the impact of claims trading on the concentration of creditors in columns
(2) and (4) of Panel A, Table 6. The 2SLS results are consistent with the OLS estimates and the point
estimates are even larger than the OLS results, suggesting that the endogenous relationship between
claims trading and t2 concentration biases the OLS estimates downwards. This result is also robust to
estimation using limited information maximum likelihood (LIML), which is more robust to weak
26
instruments than two-stage least squares (2SLS). Moreover, Wooldridge’s (1995) score test of
overidentifying restrictions (reported at the bottom of Panel A) is insignificant in both specifications and
thus we cannot reject the null hypothesis that the instruments are valid.
4.2.2. Creditor concentration at t2 and bankruptcy outcomes
The final analysis in this paper measures the impact of changes in creditor concentration that
occur during bankruptcy on bankruptcy outcomes. To do this, we rely on a 2SLS estimate of t2 ownership
concentration that is similar to the 2SLS estimate of trading intensity reported in Table 6. The concern is
that observed claims transfers could be induced by anticipated bankruptcy outcomes, or be spuriously
related to them. In particular, longer bankruptcy durations could lead to lower recoveries and to higher
claim-ownership concentration (given that there is more time for trading). Alternatively, there may be a
bigger desire to sell in time-consuming bankruptcies, which would lead to higher ownership
concentration.
The instrumental variables approach is central to a causal interpretation of the results relating
trading-induced changes in concentration to bankruptcy outcomes. In order to satisfy the exclusion
restriction, our instruments for trading of 3001(e) claims – the share of trade claims and the incidence of
mid-sized trade claims in the capital structure – must affect bankruptcy outcomes only through their
impact on ownership concentration measured at t2. However, as shown in Table 4, these instruments are
also related to t1 claims concentration, which in turn alters negotiations during bankruptcy. For this
reason, we control for t1 concentration throughout the regressions. While this helps to satisfy the
exclusion restriction, we also recognize that our instruments could affect bankruptcy outcomes through
other unobservable avenues. In that case, the results below can also be interpreted as identifying a relation
between bankruptcy outcomes and how a firm chooses to employ trade credit in its capital structure.
Table 7 presents the results of the regressions of bankruptcy outcomes on ownership
concentration measured at t2. As in Table 5, the results are a cross-sectional comparison at the firm level.
The most notable takeaway of this analysis is that ownership concentration at voting has, at the margin, a

27
different effect on the likelihood of liquidation vis-à-vis reorganization, compared to concentration
measured at the filing of the Schedules. Based on our 2SLS estimates, increasing creditor concentration at
t2 by five percentage points increases the probability of liquidation by 18 (= 0.05*3.619) percentage
points, while reducing the probability of reorganization by roughly the same magnitude, although the
impact on reorganizations is statistically insignificant once we control for the impact of prearranged
bankruptcies. Beyond its measured impact on liquidation probabilities, t2 concentration appears to have
no discernible relation to bankruptcy outcomes, including on time spent in bankruptcy and creditor
recovery rates. In unreported results, we verify that these findings are not driven by outliers in any
dimension; excluding extreme observations in excess of the 5th and 95
th percentiles in either instrument or
in t1 and t2 concentration does not affect our conclusions.
[TABLE 7]
Why is an increase in creditor concentration during bankruptcy associated, at the margin, with a
higher likelihood of observing the bankruptcy ending in liquidation? Investors who purchase trade claims
during bankruptcy might have objectives that differ from investors who take positions in loans and bonds
prior to bankruptcy. For instance, these investors may concentrate holdings in 3001(e) claims to gain
bargaining power in the bankruptcy court that could “hold up” negotiations among creditors that occurred
prior to the bankruptcy filing. Such holdup strategies could increase the share of firm value paid to
3001(e) claimants, but could also heighten the risk that a firm is unable to successfully exit bankruptcy as
a going concern. Alternatively, the results could suggest that firms with operating strategies that require
larger amounts of trade claims and, in particular, mid-sized trade claims, are more difficult to reorganize
successfully, even as trading in these claims increases creditor concentration. Distinguishing between
these, and potentially other, explanations is beyond the scope of the paper. The clearest inference from
Table 7 is that increases in creditor concentration that occur during bankruptcy are not associated with
improvements in bankruptcy outcomes.
In Table 8, we examine recovery rates at the voting-class level and their relationship to creditor
concentration within the class. All of the regressions are value-weighted by class so that smaller voting
28
classes do not have a large bearing on the results. We use two alternative ways of computing weights.
First we weight each class by the total value of claims in the class, divided by the overall value of voting
claims. However, using only voting claims as a denominator could miss claimants that do not vote on the
plan. Thus, we also report the results using the total value of allowed claims in each voting class, scaled
by total assets (a proxy for the total firm value). Because recovery rates generally follow absolute priority,
it is important to control for the relative seniority of each voting class. We do so by including a dummy
for secured claimants, as well as for administrative and priority classes that, under bankruptcy law, are
senior to unsecured creditors. Given its strategic importance in determining controlling ownership in the
restructured firm, we also include a dummy for the fulcrum class, defined as the voting class that receives
the largest share of equity in the reorganized firm. Voting class concentration at t2 is determined both by
pre-bankruptcy creditor concentration and by trading during bankruptcy; the results in Table 8 do not
separate the two because we cannot control for creditor concentration at the voting-class level at t1.
[TABLE 8]
The results in Table 8 indicate that higher concentration within a voting class has a positive
impact on class-level recovery rates. The impact is economically meaningful: a one-standard-deviation
increase in voting class concentration increases class-level recovery rates by 13 (= 0.355*0.369)
percentage points. These results are consistent with the idea that concentrated voting classes are better
able to bargain for higher recovery rates for their class, potentially at the cost of reducing recoveries to
creditors in other classes. But we cannot test this definitively because we cannot control for t1
concentration in the Table 8 regressions.
5. Conclusions
Historically, a lack of data has forced researchers to treat the ownership of a bankrupt firm—and
its implications for bargaining in restructuring—as static. This is perhaps reflective of the way the
bankruptcy process looked through the mid-1990s. However, the dynamics of the bankruptcy process
29
have changed considerably since then; in particular, secondary markets for the trading of loan, bond, and
other debt claims have grown extensively.
In this paper, we evaluate the role of ownership concentration on bankruptcy outcomes using a
dataset containing nearly complete information on creditor debt holdings in 136 Chapter 11 bankruptcies
filed between July 1998 and March 2009. The detailed nature of the holdings in our sample allows us to
construct a precise proxy of ownership concentration that encompasses creditors across the entire capital
structure. Consistent with the idea in Bolton and Scharfstein (1996) that concentrated capital structures
reduce renegotiation costs, we find that firms with more concentrated creditor ownership at the time of
bankruptcy filing are more likely to file with a prearranged bankruptcy plan, to pass through bankruptcy
more quickly, and to survive bankruptcy as a reorganized going concern.
However, we also show that ownership concentration continues to change during bankruptcy.
Specifically, we find that trading during bankruptcy in 3001(e) claims, composed chiefly of trade debt
claims, further increases credit ownership concentration, often through purchases by active investors. Yet,
these increases in concentration do not appear to be associated with additional improvements in
bankruptcy outcomes, and instead appear to increase the likelihood that the bankruptcy ends in
liquidation. While we cannot pin down a direct causal explanation for this finding, the fact that additional
increases in concentration are associated with lower reorganization success is consistent with investors
acquiring positions to extract holdout rents, as in the theoretical work by Gertner and Scharfstein (1991).
Consistent with this holdout problem, increased ownership concentration within a debt class is associated
with higher recovery rates to the class, despite the fact that, on the margin, liquidations become more
likely.

30
References
Acharya, V., Bharath, S., Srinivasan, A., 2007. Does industry-wide distress affect defaulted firms?
Evidence from Creditor Recoveries. Journal of Financial Economics 85, 787-821.
Asquith, P., Gertner, R., Scharfstein, D., 1994. Anatomy of financial distress: An examination of junk-
bond issuers. Quarterly Journal of Economics 109, 625-658.
Berglöf, E., von Thadden, E.-L., 1994. Short-term interests vs. long-term interests: Capital structure with
multiple investors. Quarterly Journal of Economics 109, 1055-1084.
Bessembinder, H., Maxwell, W., 2008. Transparency and the corporate bond market. Journal of
Economic Perspectives 22, 217-234.
Bharath, S., Panchapegesan, V., Werner, I., 2010. The changing nature of Chapter 11. Working paper.
Bolton, P., Scharfstein, D., 1996. Optimal debt structure and the number of creditors. Journal of Political
Economy 104, 1-25.
Brown, D., James, C., Mooradian, R., 1993. The information content of distressed restructurings
involving public and private debt claims. Journal of Financial Economics 33, 93-118.
Campbell, S., 1996. Predicting bankruptcy reorganizations for closely held firms. Accounting Horizons
10, 12-25.
Dahiya, S., John, K., Puri, M., Ramirez, G., 2003. Debtor-in-possession financing and bankruptcy
resolution: Empirical evidence. Journal of Financial Economics 69, 259-280.
Diamond, D., 1991. Debt maturity structure and liquidity risk. Quarterly Journal of Economics 106, 709-
737.
Drucker, S., Puri, M., 2009. On loan sales, loan contracting, and lending relationships. Review of
Financial Studies 22, 2835-2872.
Gertner, R., Scharfstetin, D., 1991. A theory of workouts and the effects of reorganization law. Journal of
Finance 46, 1189-1221.
Gilson, S., 1990. Bankruptcy, boards, banks, and blockholders: Evidence on changes in corporate
ownership and control when firms default. Journal of Financial Economics 27, 315-353.
Gilson, S., John, K., Lang, L., 1990. Troubled debt restructurings: An empirical study of private
reorganization of firms in default. Journal of Financial Economics 27, 315-353.
Goldstein, M., Hotchkiss, E., Sirri, E., 2007. Transparency and liquidity: A controlled experiment on
corporate boards. Review of Financial Studies 20, 235-273.
Hotchkiss, E., Mooradian, R., 1997, Vulture investors and the market for control of distressed firms.
Journal of Financial Economics 43, 401-432.
Hotchkiss, E., Smith, D., Strömberg, P., 2014. Private equity sponsors and the resolution of financial
distress. Working paper.
31
Iverson, B., 2014. Get in Line: Chapter 11 restructurings in crowded bankruptcy courts. Working paper.
James, C., 1995. When do banks take equity in debt restructurings? Review of Financial Studies 8, 1209-
1234.
James, C., 1996. Bank debt restructurings and the composition of exchange offers in financial distress.
Journal of Finance 51, 711-727.
Jiang, W., Li, K., Wang, W., 2012. Hedge funds in Chapter 11. Journal of Finance 67, 513-560.
Moody’s Investor Service, 2007. Moody’s Ultimate Recovery Database. Special Comment available via:
https://www.moodys.com/sites/products/DefaultResearch/2006600000428092.pdf. Accessed May 15,
2014.
Moulton, W., Thomas, H., 1993. Bankruptcy as a deliberate strategy: Theoretical considerations and
empirical evidence. Strategic Management Journal 4, 125-135.
Petersen, M., Rajan, R., 1997. Trade credit: Theories and evidence. Review of Financial Studies 10, 661-
691.
Rajan, R., 1992. Insiders and outsiders: The choice between informed and arm’s-length debt. Journal of
Finance 47, 1367-1400.
Rajan, R., Zingales, L., 1995. What do we know about capital structure? Some evidence from
international data. Journal of Finance 50, 1421-1460.
Wooldridge, J. M., 1995. Score diagnostics for linear models estimated by two stage least squares. In
Advances in Econometrics and Quantitative Economics: Essays in Honor of Professor C. R. Rao, ed.
G. S. Maddala, P. C. B. Phillips, and T. N. Srinivasan, 66-87. Oxford: Blackwell.

32
Fig. 1. Bankruptcy timeline.

33
Fig. 2. Example of data availability at t1 and t2.
Secured debt
Senior unsecured debt
Subordinated debt
Common stock
Claims (in order of seniority):
100%
0%
Observable at
t1
90%
75%
Recovery under the Plan:
Observable at
t2
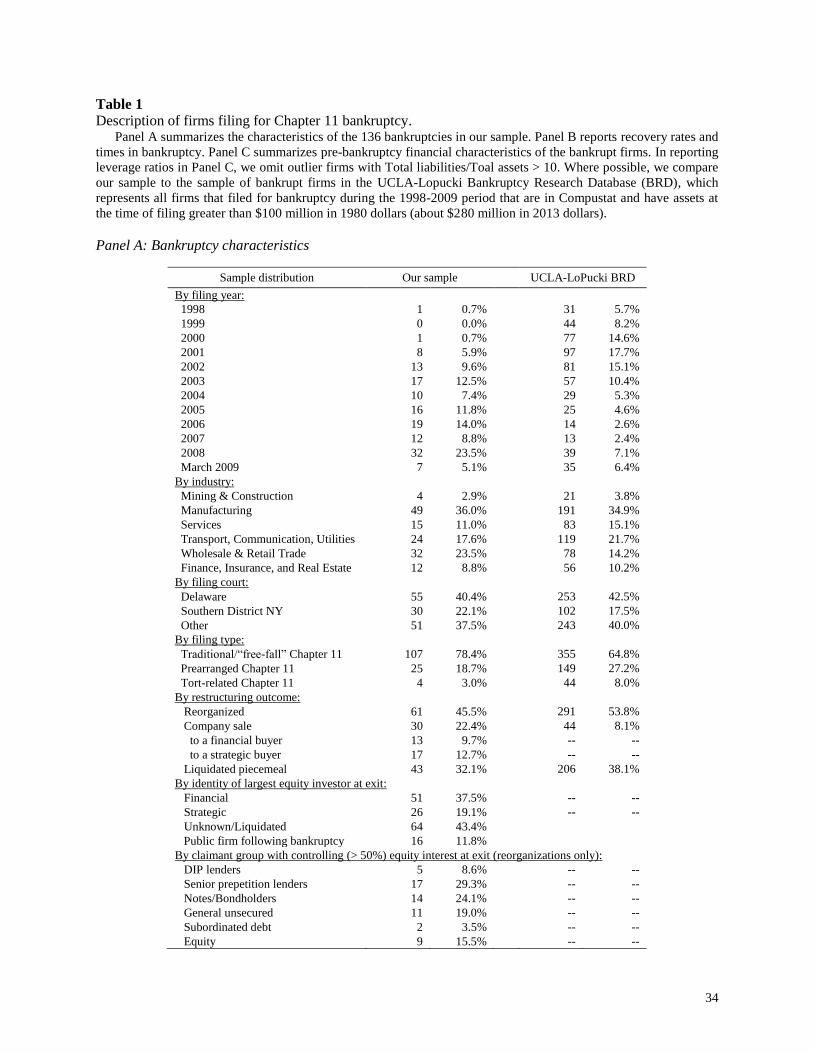
34
Table 1
Description of firms filing for Chapter 11 bankruptcy. Panel A summarizes the characteristics of the 136 bankruptcies in our sample. Panel B reports recovery rates and
times in bankruptcy. Panel C summarizes pre-bankruptcy financial characteristics of the bankrupt firms. In reporting
leverage ratios in Panel C, we omit outlier firms with Total liabilities/Toal assets > 10. Where possible, we compare
our sample to the sample of bankrupt firms in the UCLA-Lopucki Bankruptcy Research Database (BRD), which
represents all firms that filed for bankruptcy during the 1998-2009 period that are in Compustat and have assets at
the time of filing greater than $100 million in 1980 dollars (about $280 million in 2013 dollars).
Panel A: Bankruptcy characteristics
Sample distribution Our sample UCLA-LoPucki BRD
By filing year:
1998 1 0.7% 31 5.7%
1999 0 0.0% 44 8.2%
2000 1 0.7%
77 14.6%
2001 8 5.9%
97 17.7%
2002 13 9.6%
81 15.1%
2003 17 12.5%
57 10.4%
2004 10 7.4%
29 5.3%
2005 16 11.8%
25 4.6%
2006 19 14.0%
14 2.6%
2007 12 8.8%
13 2.4%
2008 32 23.5%
39 7.1%
March 2009 7 5.1%
35 6.4%
By industry:
Mining & Construction 4 2.9% 21 3.8%
Manufacturing 49 36.0% 191 34.9%
Services 15 11.0% 83 15.1%
Transport, Communication, Utilities 24 17.6% 119 21.7%
Wholesale & Retail Trade 32 23.5% 78 14.2%
Finance, Insurance, and Real Estate 12 8.8% 56 10.2%
By filing court:
Delaware 55 40.4% 253 42.5%
Southern District NY 30 22.1% 102 17.5%
Other 51 37.5% 243 40.0%
By filing type:
Traditional/“free-fall” Chapter 11 107 78.4% 355 64.8%
Prearranged Chapter 11 25 18.7% 149 27.2%
Tort-related Chapter 11 4 3.0% 44 8.0%
By restructuring outcome:
Reorganized 61 45.5% 291 53.8%
Company sale 30 22.4% 44 8.1%
to a financial buyer 13 9.7% -- --
to a strategic buyer 17 12.7% -- --
Liquidated piecemeal 43 32.1% 206 38.1%
By identity of largest equity investor at exit:
Financial 51 37.5% -- --
Strategic 26 19.1% -- --
Unknown/Liquidated 64 43.4%
Public firm following bankruptcy 16 11.8%
By claimant group with controlling (> 50%) equity interest at exit (reorganizations only):
DIP lenders 5 8.6% -- --
Senior prepetition lenders 17 29.3% -- --
Notes/Bondholders 14 24.1% -- --
General unsecured 11 19.0% -- --
Subordinated debt 2 3.5% -- --
Equity 9 15.5% -- --
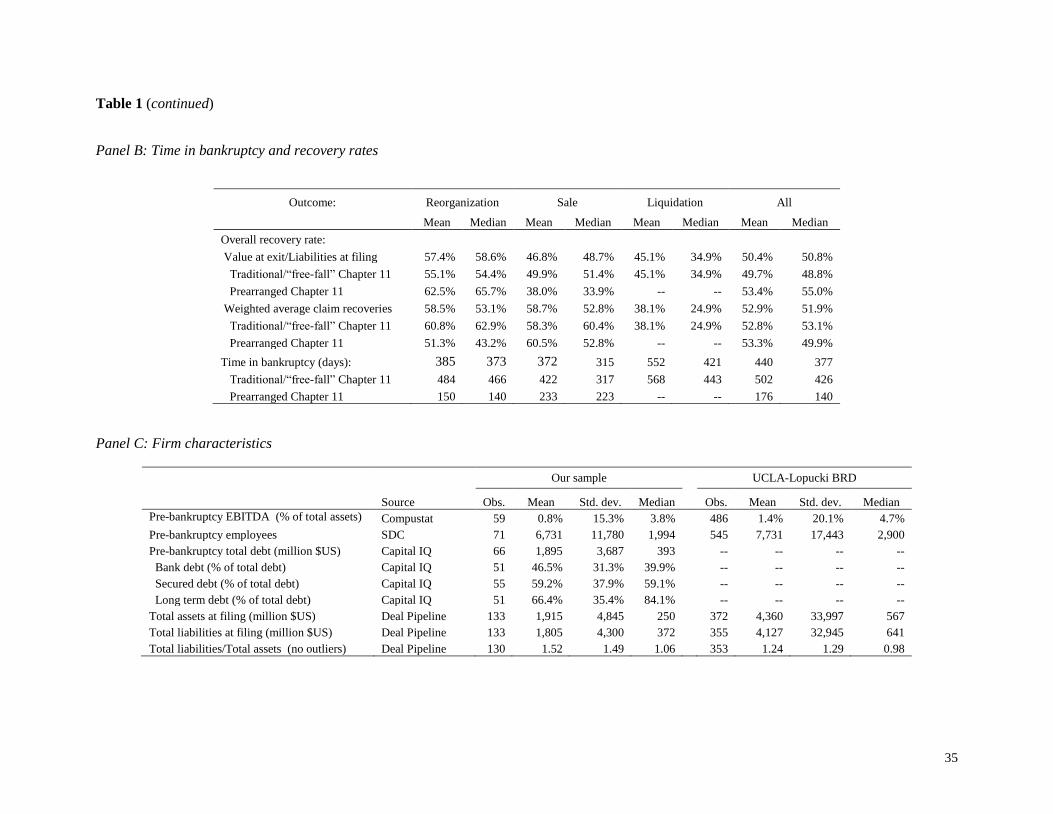
35
Table 1 (continued)
Panel B: Time in bankruptcy and recovery rates
Outcome: Reorganization Sale Liquidation All
Mean Median Mean Median Mean Median Mean Median
Overall recovery rate:
Value at exit/Liabilities at filing 57.4% 58.6% 46.8% 48.7% 45.1% 34.9% 50.4% 50.8%
Traditional/“free-fall” Chapter 11 55.1% 54.4% 49.9% 51.4% 45.1% 34.9% 49.7% 48.8%
Prearranged Chapter 11 62.5% 65.7% 38.0% 33.9% -- -- 53.4% 55.0%
Weighted average claim recoveries 58.5% 53.1% 58.7% 52.8% 38.1% 24.9% 52.9% 51.9%
Traditional/“free-fall” Chapter 11 60.8% 62.9% 58.3% 60.4% 38.1% 24.9% 52.8% 53.1%
Prearranged Chapter 11 51.3% 43.2% 60.5% 52.8% -- -- 53.3% 49.9%
Time in bankruptcy (days): 385 373 372 315 552 421 440 377
Traditional/“free-fall” Chapter 11 484 466 422 317 568 443 502 426
Prearranged Chapter 11 150 140 233 223 -- -- 176 140
Panel C: Firm characteristics
Our sample UCLA-Lopucki BRD
Source Obs. Mean Std. dev. Median
Obs. Mean Std. dev. Median
Pre-bankruptcy EBITDA (% of total assets)
$US) Compustat 59 0.8% 15.3% 3.8% 486 1.4% 20.1% 4.7%
Pre-bankruptcy employees SDC 71 6,731 11,780 1,994 545 7,731 17,443 2,900
Pre-bankruptcy total debt (million $US) Capital IQ 66 1,895 3,687 393 -- -- -- --
Bank debt (% of total debt) Capital IQ 51 46.5% 31.3% 39.9% -- -- -- --
Secured debt (% of total debt) Capital IQ 55 59.2% 37.9% 59.1% -- -- -- --
Long term debt (% of total debt) Capital IQ 51 66.4% 35.4% 84.1% -- -- -- --
Total assets at filing (million $US) Deal Pipeline 133 1,915 4,845 250 372 4,360 33,997 567
Total liabilities at filing (million $US) Deal Pipeline 133 1,805 4,300 372 355 4,127 32,945 641
Total liabilities/Total assets (no outliers) Deal Pipeline 130 1.52 1.49 1.06 353 1.24 1.29 0.98

36
Table 2
Distribution of credit claims ownership by creditor type (%). This table reports the distribution of Chapter 11 credit claims ownership, sorted by the identity of the claimholder by “creditor type,” at two points in time: the filing of the
Schedules of Assets and Liabilities (t1) and the tabulation of votes on a Plan of Reorganization or Plan of Liquidation (t2). Credit claims ownership is defined as the percentage of
the book value of debt claims held by a creditor type within a bankrupt firm. We measure creditor type at the parent level. Top-10 creditors are the ten creditors in a bankrupt firm
with the highest credit claims ownership. All figures are stated as percentages.
At filing of Schedule of Assets and Liabilities (t1) At vote tabulation (t2), voting creditors only
Cases
involving
ownership of
type (%)
Mean Std. dev. Median 95th %
Incidence
among top-10
creditors
(%)
Cases
involving
ownership of
type (%)
Mean Std. dev. Median 95th %
Incidence
among top-10
creditors
(%)
Creditor type:
Banks 88.7 21.7 24.8 13.5 76.5 69.9 72.4 21.7 27.3 10.7 82.9 69.0
Trade creditors 97.0 22.5 22.1 14.6 71.8 90.2 94.8 24.1 26.0 17.2 90.6 78.5
Bond custodians 44.4 12.3 22.0 0.0 62.6 38.4 39.7 5.9 15.1 0.0 33.3 25.9
Active investors: 76.7 9.8 21.3 0.5 69.3 35.3 76.7 15.0 23.4 2.8 81.2 56.9
Asset managers 64.7 7.0 17.9 0.1 47.1 30.1 62.9 9.1 17.7 0.9 47.7 44.8
Hedge funds & PE funds 42.9 2.8 12.4 0.0 16.6 12.0 51.7 5.9 16.6 0.1 37.0 28.5
Sub-total: -- 66.2 -- -- -- -- -- 66.6 -- -- -- --
Insurance 63.9 2.0 8.8 0.0 6.9 15.0 34.5 1.9 7.9 0.0 10.9 10.3
Real estate 64.7 1.5 3.5 0.1 7.7 19.6 31.9 1.1 3.5 0.0 5.4 12.9
Other financial 42.1 1.5 6.2 0.0 8.6 11.3 22.4 1.8 10.1 0.0 5.7 10.3
Potentially financial 94.7 3.6 6.9 1.1 16.5 35.3 87.1 7.5 11.6 1.9 32.3 53.5
Government 87.2 5.5 11.3 1.4 19.0 46.6 39.7 4.4 14.8 0.0 39.2 14.7
Individuals 93.2 11.6 18.8 3.5 60.2 60.2 82.8 12.2 22.5 2.4 73.5 50.9
Intra-company 36.1 4.6 10.3 0.0 25.5 27.8 12.1 2.2 9.8 0.0 20.0 7.8
Unknown 89.5 3.6 8.4 0.6 24.0 36.1 65.5 2.3 6.4 0.1 12.3 25.9
Sub-total: -- 33.8 -- -- -- -- -- 33.4 -- -- -- --
Top-10 creditors 100.0 83.0 16.7 88.4 100.0 -- 100.0 84.6 17.4 89.6 100.0 --
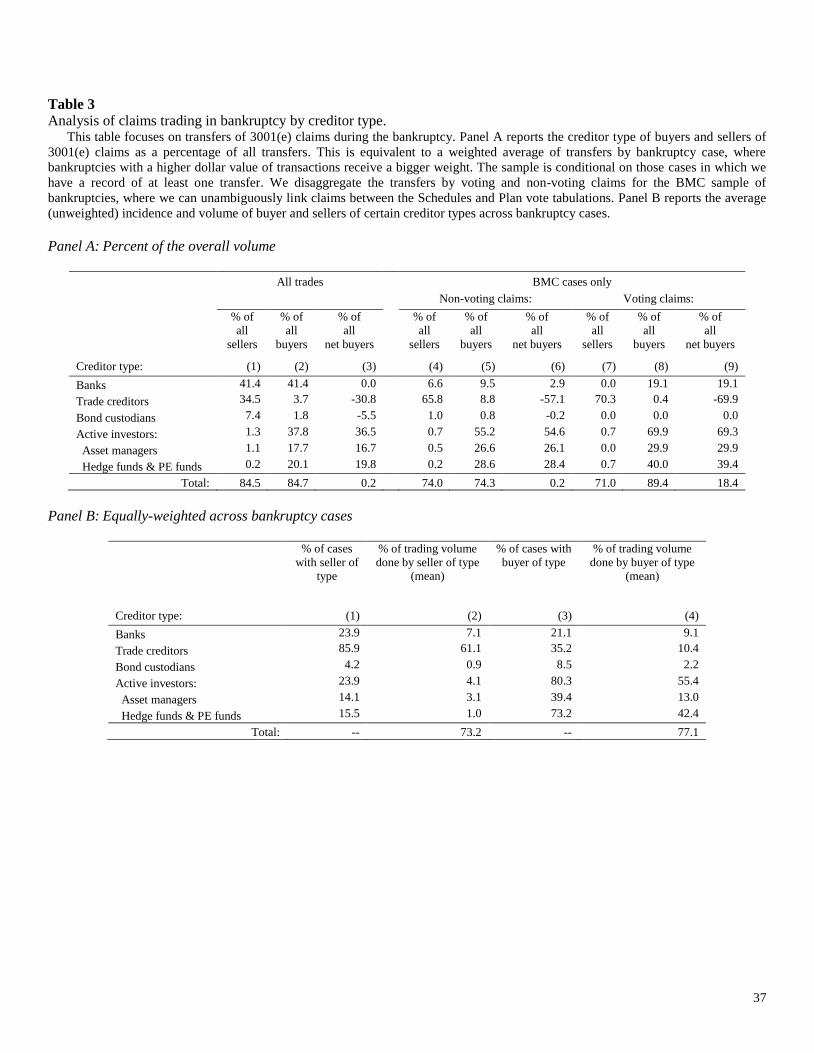
37
Table 3
Analysis of claims trading in bankruptcy by creditor type. This table focuses on transfers of 3001(e) claims during the bankruptcy. Panel A reports the creditor type of buyers and sellers of
3001(e) claims as a percentage of all transfers. This is equivalent to a weighted average of transfers by bankruptcy case, where
bankruptcies with a higher dollar value of transactions receive a bigger weight. The sample is conditional on those cases in which we
have a record of at least one transfer. We disaggregate the transfers by voting and non-voting claims for the BMC sample of
bankruptcies, where we can unambiguously link claims between the Schedules and Plan vote tabulations. Panel B reports the average
(unweighted) incidence and volume of buyer and sellers of certain creditor types across bankruptcy cases.
Panel A: Percent of the overall volume
All trades BMC cases only
Non-voting claims: Voting claims:
% of
all
sellers
% of
all
buyers
% of
all
net buyers
% of
all
sellers
% of
all
buyers
% of
all
net buyers
% of
all
sellers
% of
all
buyers
% of
all
net buyers
Creditor type:
(1) (2) (3) (4) (5) (6) (7) (8) (9)
Banks 41.4 41.4 0.0 6.6 9.5 2.9 0.0 19.1 19.1
Trade creditors 34.5 3.7 -30.8 65.8 8.8 -57.1 70.3 0.4 -69.9
Bond custodians 7.4 1.8 -5.5 1.0 0.8 -0.2 0.0 0.0 0.0
Active investors: 1.3 37.8 36.5 0.7 55.2 54.6 0.7 69.9 69.3
Asset managers 1.1 17.7 16.7 0.5 26.6 26.1 0.0 29.9 29.9
Hedge funds & PE funds 0.2 20.1 19.8 0.2 28.6 28.4 0.7 40.0 39.4
Total: 84.5 84.7 0.2 74.0 74.3 0.2 71.0 89.4 18.4
Panel B: Equally-weighted across bankruptcy cases
% of cases
with seller of
type
% of trading volume
done by seller of type
(mean)
% of cases with
buyer of type
% of trading volume
done by buyer of type
(mean)
Creditor type:
(1) (2) (3) (4)
Banks 23.9 7.1 21.1 9.1
Trade creditors 85.9 61.1 35.2 10.4
Bond custodians 4.2 0.9 8.5 2.2
Active investors: 23.9 4.1 80.3 55.4
Asset managers 14.1 3.1 39.4 13.0
Hedge funds & PE funds 15.5 1.0 73.2 42.4
Total: -- 73.2 -- 77.1

38
Table 4
Determinants of creditor concentration at bankruptcy. This table examines the determinants of credit ownership concentration in our sample firms at the outset of
bankruptcy. The dependent variable is Creditor concentration (t1), measured as the share of claims held by the ten
largest creditors at the filing of the Schedules of Assets and Liabilities. The shares of claims owned by trade
creditors, active investors, and those that are unsecured are given as a percentage of total claims. Bank debt is a
dummy equal to 1 if the share of bank debt as fraction of total debt is at least 5% and 0 otherwise. Public debt is
defined similarly. Bank debt or public debt is a dummy equal to 1 if either Bank debt or Public debt is equal to 1 and
0 otherwise. Loan traded within 5 years of bankruptcy is a dummy equal to 1 if a firm’s loan is quoted in the five
years prior to bankruptcy filing in the Markit secondary market database and 0 otherwise. Loan traded within 1 year
of bankruptcy is defined similarly, but is restricted to loan quotes that are within 1 year of the bankruptcy filing.
Bond traded within 1 year of bankruptcy is a dummy variable equal to 1 if a firm’s bond is quoted within 1 year
prior to bankruptcy filing in TRACE bond transactions database and 0 otherwise. Loan or bond traded within 1 year
of bankruptcy is a dummy equal to 1 if either of the previous two dummies is equal to 1 and 0 otherwise. Assets are
measured in millions and were compiled from each firms’ Chapter 11 petition. Positive EBITDA is a dummy
variable indicating if the firm had positive EBITDA prior to filing. Only limited information is available for pre-
bankruptcy EBITDA. To account for this, we control for the level effect for those firms that have EBITDA data
available. Economic recession is a dummy equal to 1 if the firm files for bankruptcy during a recession period, as
defined by National Bureau of Economic Research. All models are estimated using linear least squares. Standard
errors are clustered by industry and reported in parenthesis. ***, **, and * indicate statistical significance at the 1%,
5%, and 10% level, respectively.
Dependent variable: Creditor concentration (t1)
(1) (2) (3) (4) (5)
Capital structure:
Share of claims owned by trade creditors -0.164** -0.145*** -0.175*** -0.162** -0.148**
(0.050) (0.033) (0.040) (0.047) (0.052)
Share of claims owned by active investors 0.065 0.087 0.065 0.066 0.068
(0.055) (0.058) (0.057) (0.053) (0.065)
Share of claims that are unsecured -0.007 -0.001 0.002 -0.008 -0.003
(0.080) (0.081) (0.084) (0.088) (0.084)
Bank debt (dummy) 0.003 0.025 0.032 -- --
(0.044) (0.048) (0.045)
Public debt (dummy) 0.075** -- -- 0.073 --
(0.027)
(0.053)
Bank or public debt (dummy) -- -- -- -- 0.047
(0.060)
Pre-bankruptcy trading:
Loan traded within 5 years of bankruptcy -- 0.070* -- -- --
(0.031)
Loan traded within 1 year of bankruptcy -- -- 0.032 -- --
(0.019)
Bond traded within 1 year of bankruptcy -- -- -- 0.023 --
(0.060)
Loan or bond traded within 1 year of bankruptcy -- -- -- -- 0.064**
(0.020)
Ln(Assets) -0.013 -0.016 -0.014 -0.013 -0.016
(0.008) (0.009) (0.008) (0.009) (0.009)
EBITDA data available -0.068 -0.044 -0.043 -0.067 -0.058
(0.051) (0.029) (0.035) (0.054) (0.043)
Positive EBITDA 0.053* 0.047 0.051 0.052** 0.043
(0.025) (0.033) (0.030) (0.020) (0.031)
Economic recession 0.011 0.001 0.009 0.011 0.006
(0.022) (0.019) (0.018) (0.023) (0.020)
Observations 119 119 119 119 119
R-squared 0.133 0.139 0.120 0.135 0.143
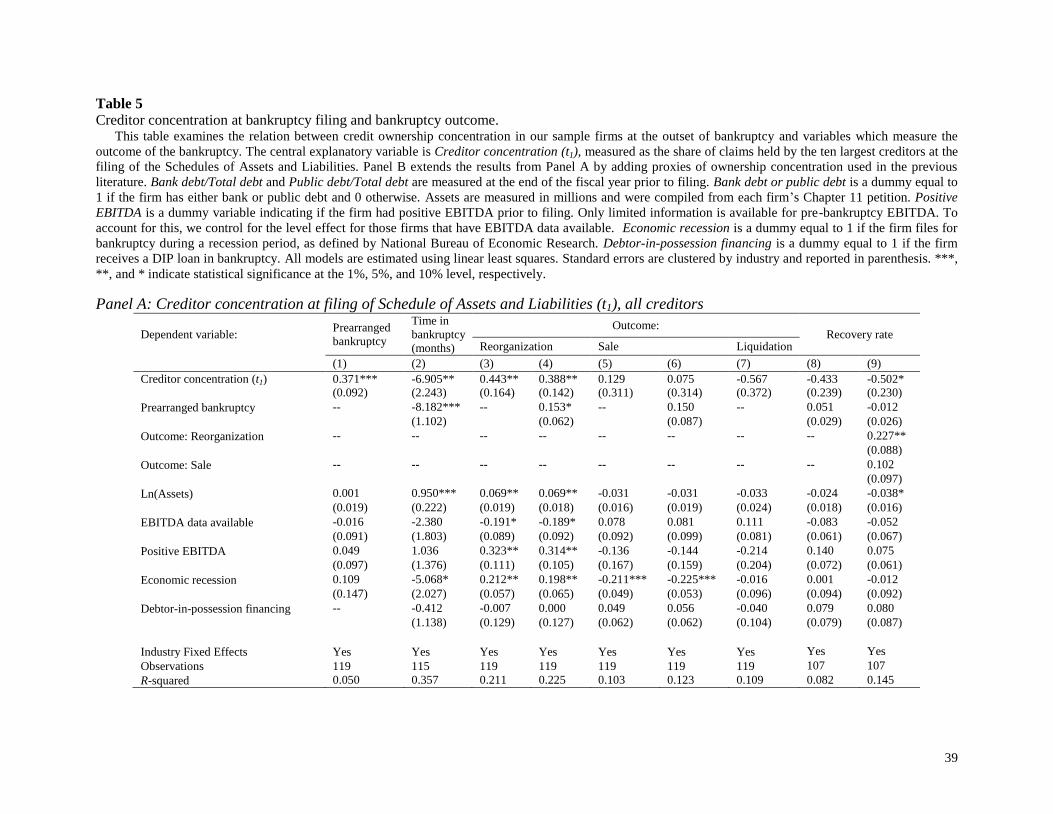
39
Table 5
Creditor concentration at bankruptcy filing and bankruptcy outcome. This table examines the relation between credit ownership concentration in our sample firms at the outset of bankruptcy and variables which measure the
outcome of the bankruptcy. The central explanatory variable is Creditor concentration (t1), measured as the share of claims held by the ten largest creditors at the
filing of the Schedules of Assets and Liabilities. Panel B extends the results from Panel A by adding proxies of ownership concentration used in the previous
literature. Bank debt/Total debt and Public debt/Total debt are measured at the end of the fiscal year prior to filing. Bank debt or public debt is a dummy equal to
1 if the firm has either bank or public debt and 0 otherwise. Assets are measured in millions and were compiled from each firm’s Chapter 11 petition. Positive
EBITDA is a dummy variable indicating if the firm had positive EBITDA prior to filing. Only limited information is available for pre-bankruptcy EBITDA. To
account for this, we control for the level effect for those firms that have EBITDA data available. Economic recession is a dummy equal to 1 if the firm files for
bankruptcy during a recession period, as defined by National Bureau of Economic Research. Debtor-in-possession financing is a dummy equal to 1 if the firm
receives a DIP loan in bankruptcy. All models are estimated using linear least squares. Standard errors are clustered by industry and reported in parenthesis. ***,
**, and * indicate statistical significance at the 1%, 5%, and 10% level, respectively.
Panel A: Creditor concentration at filing of Schedule of Assets and Liabilities (t1), all creditors
Dependent variable: Prearranged
bankruptcy
Time in
bankruptcy
(months)
Outcome: Recovery rate
Reorganization Sale Liquidation
(1) (2) (3) (4) (5) (6) (7) (8) (9)
Creditor concentration (t1) 0.371*** -6.905** 0.443** 0.388** 0.129 0.075 -0.567 -0.433 -0.502*
(0.092) (2.243) (0.164) (0.142) (0.311) (0.314) (0.372) (0.239) (0.230)
Prearranged bankruptcy -- -8.182*** -- 0.153* -- 0.150 -- 0.051 -0.012
(1.102) (0.062) (0.087) (0.029) (0.026)
Outcome: Reorganization -- -- -- -- -- -- -- -- 0.227**
(0.088)
Outcome: Sale -- -- -- -- -- -- -- -- 0.102
(0.097)
Ln(Assets) 0.001 0.950*** 0.069** 0.069** -0.031 -0.031 -0.033 -0.024 -0.038*
(0.019) (0.222) (0.019) (0.018) (0.016) (0.019) (0.024) (0.018) (0.016)
EBITDA data available -0.016 -2.380 -0.191* -0.189* 0.078 0.081 0.111 -0.083 -0.052
(0.091) (1.803) (0.089) (0.092) (0.092) (0.099) (0.081) (0.061) (0.067)
Positive EBITDA 0.049 1.036 0.323** 0.314** -0.136 -0.144 -0.214 0.140 0.075
(0.097) (1.376) (0.111) (0.105) (0.167) (0.159) (0.204) (0.072) (0.061)
Economic recession 0.109 -5.068* 0.212** 0.198** -0.211*** -0.225*** -0.016 0.001 -0.012
(0.147) (2.027) (0.057) (0.065) (0.049) (0.053) (0.096) (0.094) (0.092)
Debtor-in-possession financing -- -0.412 -0.007 0.000 0.049 0.056 -0.040 0.079 0.080
(1.138) (0.129) (0.127) (0.062) (0.062) (0.104) (0.079) (0.087)
Industry Fixed Effects Yes Yes Yes Yes Yes Yes Yes Yes Yes
Observations 119 115 119 119 119 119 119 107 107
R-squared 0.050 0.357 0.211 0.225 0.103 0.123 0.109 0.082 0.145
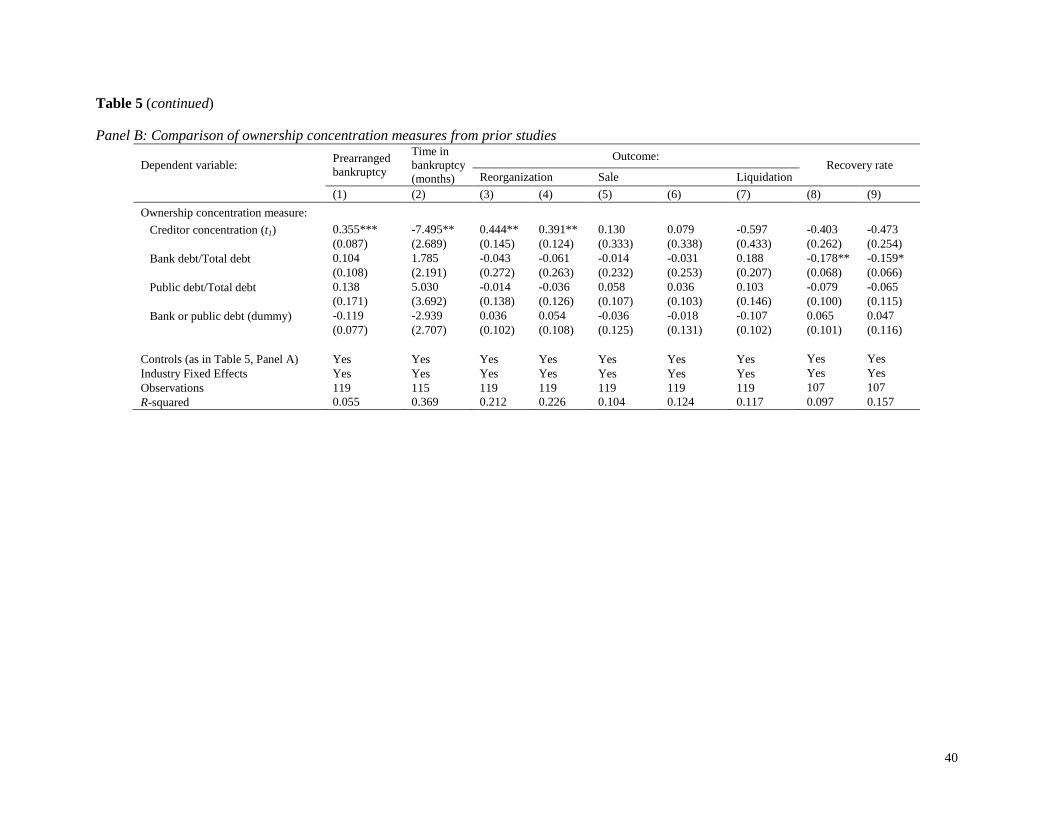
40
Table 5 (continued)
Panel B: Comparison of ownership concentration measures from prior studies
Dependent variable: Prearranged
bankruptcy
Time in
bankruptcy
(months)
Outcome: Recovery rate
Reorganization Sale Liquidation
(1) (2) (3) (4) (5) (6) (7) (8) (9)
Ownership concentration measure:
Creditor concentration (t1) 0.355*** -7.495** 0.444** 0.391** 0.130 0.079 -0.597 -0.403 -0.473
(0.087) (2.689) (0.145) (0.124) (0.333) (0.338) (0.433) (0.262) (0.254)
Bank debt/Total debt 0.104 1.785 -0.043 -0.061 -0.014 -0.031 0.188 -0.178** -0.159*
(0.108) (2.191) (0.272) (0.263) (0.232) (0.253) (0.207) (0.068) (0.066)
Public debt/Total debt 0.138 5.030 -0.014 -0.036 0.058 0.036 0.103 -0.079 -0.065
(0.171) (3.692) (0.138) (0.126) (0.107) (0.103) (0.146) (0.100) (0.115)
Bank or public debt (dummy) -0.119 -2.939 0.036 0.054 -0.036 -0.018 -0.107 0.065 0.047
(0.077) (2.707) (0.102) (0.108) (0.125) (0.131) (0.102) (0.101) (0.116)
Controls (as in Table 5, Panel A) Yes Yes Yes Yes Yes Yes Yes Yes Yes
Industry Fixed Effects Yes Yes Yes Yes Yes Yes Yes Yes Yes
Observations 119 115 119 119 119 119 119 107 107
R-squared 0.055 0.369 0.212 0.226 0.104 0.124 0.117 0.097 0.157

41
Table 6
Claims trading and creditor concentration. This table explores the relation between trading of 3001(e) claims in bankruptcy and changes in the level of credit
ownership concentration during the Chapter 11 case. Panel A presents estimates of the impact of claims trading on
the concentration of creditors. The explanatory variable of interest Claims trading intensity is equal to 0 if there is
no trading in 3001(e) claims (56 out of 119 cases). For the remaining firms, the share of traded 3001(e) claims is
sorted in terciles; Claims trading intensity is equal to 1 for firms in the first tercile (20 firms), 2 for firms in the
second tercile (24 firms), and 3 for the firms the third tercile (19 firms). Panel B reports the results of the first-stage
regressions. Share of mid-size claims owned by trade creditors is defined as the total amount of claims between
$100,000 and $300,000 that are owned by trade creditors, scaled by the firm’s total amount of all claims at
bankruptcy. Share of claims owned by trade creditors is defined as the total amount of claims owned by trade
creditors, scaled by the firm’s total amount of all claims at bankruptcy. Assets are measured in millions and are
compiled from each firm’s Chapter 11 petition. Positive EBITDA is a dummy variable indicating if the firm had
positive EBITDA prior to filing. Only limited information is available for pre-bankruptcy EBITDA. To account for
this, we control for the level effect for those firms that have EBITDA data available. Economic recession is a
dummy equal to 1 if the firm files for bankruptcy during a recession period, as defined by National Bureau of
Economic Research. Debtor-in-possession financing is a dummy equal to 1 if the firm receives a DIP loan in
bankruptcy. All models are estimated using linear least squares. Standard errors are clustered by industry and
reported in parenthesis. ***, **, and * indicate statistical significance at the 1%, 5%, and 10% level, respectively.
Panel A: Claims trading and creditor concentration
Dependent variable: Creditor concentration at
vote tabulation (t2)
Change in creditor
concentration (t2 –t1)
OLS 2SLS
OLS 2SLS
(1) (2) (3) (4)
Claims trading intensity 0.025** 0.079**
0.044*** 0.116***
(0.011) (0.036)
(0.014) (0.027)
Creditor concentration (t1) 0.635*** 0.761***
-- --
(0.112) (0.153)
Ln(Assets) -0.029*** -0.036***
-0.030*** -0.039***
(0.006) (0.007)
(0.006) (0.008)
EBITDA data available 0.059** 0.069*
0.074** 0.081*
(0.029) (0.038)
(0.034) (0.046)
Positive EBITDA -0.115*** -0.126***
-0.141*** -0.144***
(0.038) (0.042)
(0.042) (0.048)
Economic recession -0.057** -0.027
-0.053* -0.010
(0.029) (0.039)
(0.029) (0.037)
Debtor-in-possession financing 0.022 0.022
0.034 0.027
(0.027) (0.028)
(0.028) (0.030)
Industry fixed effects Yes Yes
Yes Yes
Wooldridge overidentifying test -- 0.093 -- 0.018
p-value 0.76 0.89
Observations 119 119
119 119
R-squared 0.52 -- 0.36 --
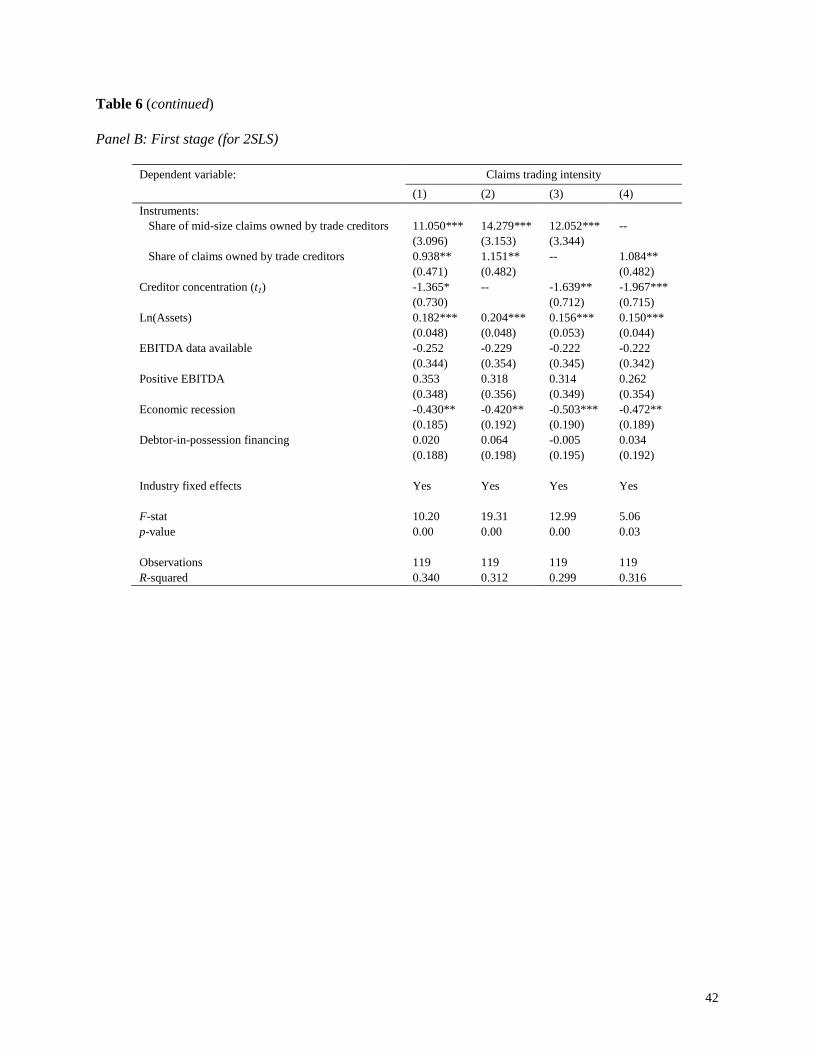
42
Table 6 (continued)
Panel B: First stage (for 2SLS)
Dependent variable: Claims trading intensity
(1) (2) (3) (4)
Instruments:
Share of mid-size claims owned by trade creditors 11.050*** 14.279*** 12.052*** --
(3.096) (3.153) (3.344)
Share of claims owned by trade creditors 0.938** 1.151** -- 1.084**
(0.471) (0.482)
(0.482)
Creditor concentration (t1) -1.365* -- -1.639** -1.967***
(0.730)
(0.712) (0.715)
Ln(Assets) 0.182*** 0.204*** 0.156*** 0.150***
(0.048) (0.048) (0.053) (0.044)
EBITDA data available -0.252 -0.229 -0.222 -0.222
(0.344) (0.354) (0.345) (0.342)
Positive EBITDA 0.353 0.318 0.314 0.262
(0.348) (0.356) (0.349) (0.354)
Economic recession -0.430** -0.420** -0.503*** -0.472**
(0.185) (0.192) (0.190) (0.189)
Debtor-in-possession financing 0.020 0.064 -0.005 0.034
(0.188) (0.198) (0.195) (0.192)
Industry fixed effects Yes Yes Yes Yes
F-stat 10.20 19.31 12.99 5.06
p-value 0.00 0.00 0.00 0.03
Observations 119 119 119 119
R-squared 0.340 0.312 0.299 0.316
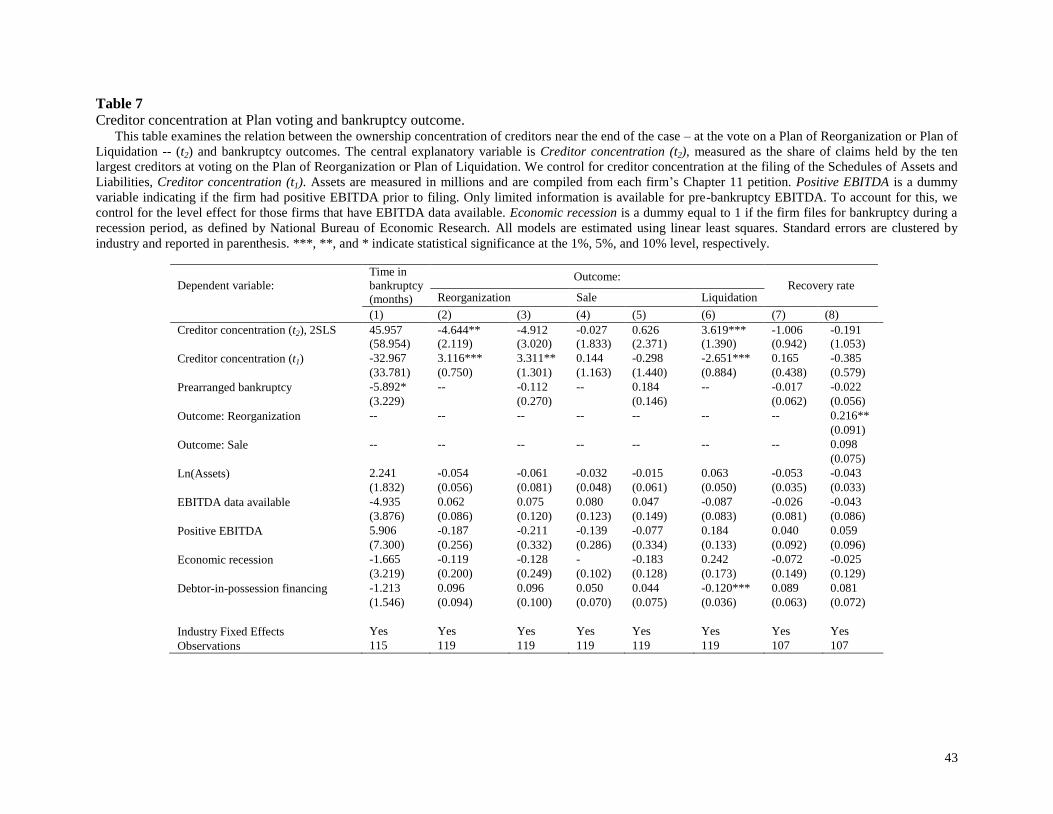
43
Table 7
Creditor concentration at Plan voting and bankruptcy outcome. This table examines the relation between the ownership concentration of creditors near the end of the case – at the vote on a Plan of Reorganization or Plan of
Liquidation -- (t2) and bankruptcy outcomes. The central explanatory variable is Creditor concentration (t2), measured as the share of claims held by the ten
largest creditors at voting on the Plan of Reorganization or Plan of Liquidation. We control for creditor concentration at the filing of the Schedules of Assets and
Liabilities, Creditor concentration (t1). Assets are measured in millions and are compiled from each firm’s Chapter 11 petition. Positive EBITDA is a dummy
variable indicating if the firm had positive EBITDA prior to filing. Only limited information is available for pre-bankruptcy EBITDA. To account for this, we
control for the level effect for those firms that have EBITDA data available. Economic recession is a dummy equal to 1 if the firm files for bankruptcy during a
recession period, as defined by National Bureau of Economic Research. All models are estimated using linear least squares. Standard errors are clustered by
industry and reported in parenthesis. ***, **, and * indicate statistical significance at the 1%, 5%, and 10% level, respectively.
Dependent variable:
Time in
bankruptcy
(months)
Outcome: Recovery rate
Reorganization Sale Liquidation
(1) (2) (3) (4) (5) (6) (7) (8)
Creditor concentration (t2), 2SLS 45.957 -4.644** -4.912 -0.027 0.626 3.619*** -1.006 -0.191
(58.954) (2.119) (3.020) (1.833) (2.371) (1.390) (0.942) (1.053)
Creditor concentration (t1) -32.967 3.116*** 3.311** 0.144 -0.298 -2.651*** 0.165 -0.385
(33.781) (0.750) (1.301) (1.163) (1.440) (0.884) (0.438) (0.579)
Prearranged bankruptcy -5.892* -- -0.112 -- 0.184 -- -0.017 -0.022
(3.229) (0.270) (0.146) (0.062) (0.056)
Outcome: Reorganization -- -- -- -- -- -- -- 0.216**
(0.091)
Outcome: Sale -- -- -- -- -- -- -- 0.098
(0.075)
Ln(Assets) 2.241 -0.054 -0.061 -0.032 -0.015 0.063 -0.053 -0.043
(1.832) (0.056) (0.081) (0.048) (0.061) (0.050) (0.035) (0.033)
EBITDA data available -4.935 0.062 0.075 0.080 0.047 -0.087 -0.026 -0.043
(3.876) (0.086) (0.120) (0.123) (0.149) (0.083) (0.081) (0.086)
Positive EBITDA 5.906 -0.187 -0.211 -0.139 -0.077 0.184 0.040 0.059
(7.300) (0.256) (0.332) (0.286) (0.334) (0.133) (0.092) (0.096)
Economic recession -1.665 -0.119 -0.128 -
0.213**
-0.183 0.242 -0.072 -0.025
(3.219) (0.200) (0.249) (0.102) (0.128) (0.173) (0.149) (0.129)
Debtor-in-possession financing -1.213 0.096 0.096 0.050 0.044 -0.120*** 0.089 0.081
(1.546) (0.094) (0.100) (0.070) (0.075) (0.036) (0.063) (0.072)
Industry Fixed Effects Yes Yes Yes Yes Yes Yes Yes Yes
Observations 115 119 119 119 119 119 107 107
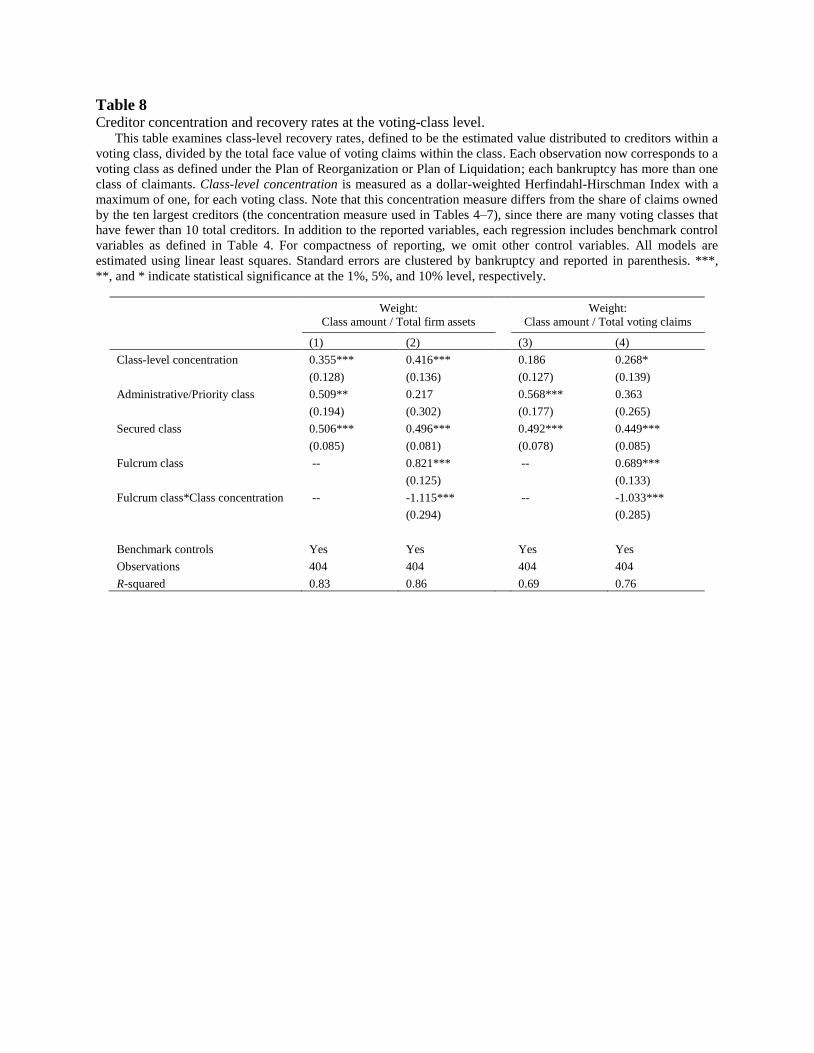
Table 8 Creditor concentration and recovery rates at the voting-class level.
This table examines class-level recovery rates, defined to be the estimated value distributed to creditors within a
voting class, divided by the total face value of voting claims within the class. Each observation now corresponds to a
voting class as defined under the Plan of Reorganization or Plan of Liquidation; each bankruptcy has more than one
class of claimants. Class-level concentration is measured as a dollar-weighted Herfindahl-Hirschman Index with a
maximum of one, for each voting class. Note that this concentration measure differs from the share of claims owned
by the ten largest creditors (the concentration measure used in Tables 4–7), since there are many voting classes that
have fewer than 10 total creditors. In addition to the reported variables, each regression includes benchmark control
variables as defined in Table 4. For compactness of reporting, we omit other control variables. All models are
estimated using linear least squares. Standard errors are clustered by bankruptcy and reported in parenthesis. ***,
**, and * indicate statistical significance at the 1%, 5%, and 10% level, respectively.
Weight:
Class amount / Total firm assets
Weight:
Class amount / Total voting claims
(1) (2) (3) (4)
Class-level concentration 0.355*** 0.416*** 0.186 0.268*
(0.128) (0.136) (0.127) (0.139)
Administrative/Priority class 0.509** 0.217 0.568*** 0.363
(0.194) (0.302) (0.177) (0.265)
Secured class 0.506*** 0.496*** 0.492*** 0.449***
(0.085) (0.081) (0.078) (0.085)
Fulcrum class -- 0.821*** -- 0.689***
(0.125) (0.133)
Fulcrum class*Class concentration -- -1.115*** -- -1.033***
(0.294) (0.285)
Benchmark controls Yes Yes Yes Yes
Observations 404 404 404 404
R-squared 0.83 0.86 0.69 0.76