the outlook for natural gas and lng in china in the war ... · december 2018 oies paper: ng139...
TRANSCRIPT

December 2018
OIES PAPER: NG139
The Outlook for Natural Gas and LNG in China in the War against Air Pollution
Akira Miyamoto, Executive Researcher, Osaka Gas Co., Ltd. & Chikako Ishiguro, Senior Analyst, Osaka Gas Co., Ltd.

i
The contents of this paper are the authors’ sole responsibility. They do not
necessarily represent the views of the Oxford Institute for Energy Studies or any of
its members.
Copyright © 2018
Oxford Institute for Energy Studies
(Registered Charity, No. 286084)
This publication may be reproduced in part for educational or non-profit purposes without special
permission from the copyright holder, provided acknowledgment of the source is made. No use of this
publication may be made for resale or for any other commercial purpose whatsoever without prior
permission in writing from the Oxford Institute for Energy Studies.
ISBN: 978-1-78467-124-2
DOI: https://doi.org/10.26889/9781784671242
Akira Miyamoto
Executive Researcher, Energy Resources and International Business Unit
Osaka Gas Co., Ltd.
e-mail:[email protected]
Chikako Ishiguro
Senior Analyst, Energy Resources and International Business Unit
Osaka Gas Co., Ltd.
e-mail:[email protected]

ii
Acknowledgements
The authors wish to express their sincere gratitude to all those for their help in the writing of this
paper. Our special thanks are due to those from the OIES: firstly, Professor Jonathan Stern not only
for arranging this writing opportunity but also for his valuable advice and helpful suggestions; and Dr
James Henderson, not only for his valuable comments and suggestions but also for undertaking the
publication of this report. Our special thanks also go to Ms. Kate Teasdale and Ms. Catherine Gaunt
for editing the final draft.
Finally, we would also like to express our warmest gratitude to Mr. Kunihiko Kashitani, Mr. Toyoshi
Matsumoto, Mr. Yi Ding, Mr. Makoto Matsumoto, Mr. Kohei Hata, Mr. Masaya Takamoto, Ms. Tomoko
Nakaie, Ms. Yoshie Shinbo, Ms. Kumie Hasebe of the Research Team of the Planning Department of
Osaka Gas’s Energy Resources and International Business Unit for their valuable assistance with the
visits made to China, information gathering, analysis of international LNG market trends and
improving the language.

iii
Preface
The outlook for gas demand in China is one of the most important questions facing the global gas
market, as it will have significant consequences for gas producers and consumers across the world.
The rapid rise in China’s gas demand has been catalysed by environmental concerns, in particular air
quality, in the country’s major cities and the authors of this report, Akira Miyamoto and Chikako
Ishiguro, provide a detailed analysis of the progress that has been made in introducing environmental
legislation to pursue the goal of cleaning up China’s skies. They consider the impact that his has had
on gas consumption in China over the past decade before analysing the major goals of the Blue Sky
Action Plan and outlining its potential consequences for gas demand over the next two to three years.
After briefly addressing the issue of domestic gas production, the authors then assess the key
question for global gas producers and exporters – what will China’s gas import requirement be and
from what sources will it come? Following the gas shortages in China during the winter of 2017/18 this
is clearly a highly relevant and topical question, and this paper provides both a detailed analysis of the
fundamental drivers of China’s rapid demand growth and import requirement and also an insightful
view of future trends. We thank them and their employer, Osaka Gas, for taking the time to provide
this comprehensive analysis of a vitally important topic.
James Henderson
Director, Natural Gas Programme
Oxford Institute for Energy Studies

iv
Contents
Acknowledgements .............................................................................................................................. ii
Preface .................................................................................................................................................. iii
Glossary ............................................................................................................................................... vii
1. Introduction ....................................................................................................................................... 1
2. Evolution of the war on air pollution in China ............................................................................... 2
2.1 History ........................................................................................................................................... 2
2.2 Strengthened measures against SO2 and NOx under the 11th Five-Year Plan (2006–10) .......... 3
2.3 Introduction of PM2.5 controls under the 12th Five-Year Plan (2011–15) ................................... 6
2.4 The Air Pollution Prevention and Control Action Plan (2013–17) and reduction of coal use ....... 8
2.4.1 The Air Pollution Prevention and Control Action Plan (2013–17) ........................................... 8
2.4.2 Measures to promote reduction of coal use ......................................................................... 10
2.4.3 Revision of the Environment Protection Law and administrative systems of responsibility for
environmental protection targets ................................................................................................... 11
2.4.4 The Action Plan for Preventing Air Pollution: the final step in strengthening air pollution
measures in Beijing–Tianjin–Hebei (after 2016) ............................................................................ 12
2.5 The 13th Five-Year Plan (2016–20) ............................................................................................ 16
2.6 The Winter Clean Heating Plan in Northern Area (2017–21) ..................................................... 17
2.7 The Action Plan to Win the Blue Sky Defence War (2018–20) .................................................. 18
2.8 Summary: air pollution now and in the future.............................................................................. 19
3. Trends in natural gas supply and demand ................................................................................... 21
3.1 Long-term trends in natural gas consumption ............................................................................ 21
3.1.1 Macro-level trends since 2000 .............................................................................................. 21
3.2 Background of stagnation in gas demand 2014–16 ................................................................... 23
3.2.1 Trends in natural gas and environmental policies: shortage of supply (around 2013) ......... 23
3.2.2 Natural gas price reforms and changes in price competitiveness (2014–16) ...................... 23
3.3 Impact of measures against air pollution on natural gas supply and demand (2017–18) .......... 25
3.3.1 Trends in supply and demand for natural gas in 2017–18 ................................................... 25
3.3.2 Impact of action on air pollution and the problem of gas shortages ..................................... 28
3.3.3 Outlook for full-year natural gas supply and demand in 2018 .............................................. 29
3.4 LNG import trends ....................................................................................................................... 30
4. Outlook for natural gas demand .................................................................................................... 33
4.1 Projections for long term natural gas supply and demand by various organizations ................. 33
4.1.1 Projections and assumptions ................................................................................................ 33
4.1.2 NDRC position document on establishing long-term stable natural gas supply system ...... 34
4.1.3 CNPC estimates of potential natural gas demand generated by coal-to-gas switching....... 35
4.1.4 Key figures in the Winter Clean Heating plan in the northern area ...................................... 36
4.1.5 Subsidies to promote use of natural gas under air pollution measures ............................... 38
4.2 Discussion on outlook for medium-term natural gas consumption (up to 2020)......................... 39
4.2.1 Approach to projecting natural gas consumption ................................................................. 39
5. Outlook for medium-term LNG demand and impact on the international market .................... 42
5.1 Outlook for indigenous natural gas production ........................................................................... 42
5.2 Outlook for pipeline gas imports ................................................................................................. 43
5.2.1 Pipeline capacity ................................................................................................................... 43
5.2.2 Pipeline gas import trends and outlook ................................................................................ 44
5.3 Outlook for LNG demand ............................................................................................................ 45
5.3.1 Capacity of LNG receiving terminals and LNG imports ........................................................ 45
5.3.2 Observations on the LNG demand outlook .......................................................................... 46
5.4 Impact on the international LNG market ..................................................................................... 47
5.4.1 Impact on international LNG supply and demand up to around 2020 .................................. 48
5.4.2 Long-term impacts up to around 2030 .................................................................................. 49
References ........................................................................................................................................... 51

v
Figures
Figure 2.1: Development of environmental policies and measures ........................................................ 2 Figure 2.2: Targeted area for the Action Plan 2013 ................................................................................ 9 Figure 2.3: Daily PM2.5 levels and targets in Beijing, Tianjin and Shijiazhuang (Hebei) ..................... 12 Figure 2.4: Targeted area for the Control Measures B–T–H ................................................................ 13 Figure 2.5: Daily PM2.5 levels and daily targets in Beijing, Tianjin and Shijiazhuang (Hebei) ............. 14 Figure 2.6: Targeted area for Work Plan B–T–H .................................................................................. 15 Figure 2.7: Targeted area for Winter Clean Heating ............................................................................. 18 Figure 2.8: Targeted area for the Blue Sky Action Plan ....................................................................... 19 Figure 2.9: Monthly PM2.5 levels in key cities in China ........................................................................ 20 Figure 3.1: Growth rate of GDP, total energy and natural gas consumption ........................................ 22 Figure 3.2: Historical data and outlook for LNG receiving capacity and utilization rate ....................... 32 Figure 5.1: LNG prices in East Asia ($/mmbtu) .................................................................................... 49 Figure 5.2: Outlook for LNG supply and demand in the global market ................................................. 49
Tables
Table 2.1: Targets and results for the 10FYP and the 11FYP ................................................................ 5
Table 2.2: National Air Quality Standard ................................................................................................. 5
Table 2.3: Targets and results for the 12FTP ......................................................................................... 6
Table 2.4: Air pollution reduction targets (%) in 19 key areas by 2015 (reduction percentage over
2010) ....................................................................................................................................................... 8
Table 2.5: The target for reduction for coal consumption and actual demand (mt) .............................. 11
Table 2.6: Annual targets for PM2.5 in 2017 regulated by the Intensive Air Pollution Prevention and
Control Measures for Beijing–Tianjin–Hebei (2016–17) ....................................................................... 14
Table 2.7: Target for the 13th Five-Year Plan....................................................................................... 17
Table 3.1: Averaged annual growth rate (%) ........................................................................................ 22
Table 3.2: Natural gas consumption by sector...................................................................................... 22
Table 3.3: Price competitiveness of natural gas against competing fuels ............................................ 25
Table 3.4: Supply and demand balance of natural gas (bcm) .............................................................. 26
Table 3.5: Growth rate of monthly natural gas consumption (% over the same month of the previous
year) ...................................................................................................................................................... 26
Table 3.6: Natural gas consumption by sector (bcm/y) ........................................................................ 26
Table 3.7: Electricity consumption (TWh) ............................................................................................. 27
Table 3.8: Generation volume by source (TWh) ................................................................................... 27
Table 3.9: Power generation capacity (GW) ......................................................................................... 27
Table 3.10: Various outlooks for natural gas consumption in 2018 ...................................................... 30
Table 3.11: LNG terminals as of 2020 .................................................................................................. 31
Table 3.12: LNG imports in China ......................................................................................................... 31
Table 3.13: Growth rate of LNG imports by region ............................................................................... 32
Table 3.14: Utilization rate of LNG terminals by region ........................................................................ 32
Table 4.1: Outlooks for natural gas demand by various organizations (Bcm) ...................................... 33
Table 4.2: Outlooks for natural gas supply by various organizations ................................................... 34
Table 4.3: Additional natural gas demand generated by coal-to-gas switching projects (From 2016 to
2020) ..................................................................................................................................................... 35
Table 4.4: Share of region regarding additional natural gas demand generated by coal-to-gas
switching projects .................................................................................................................................. 36
Table 4.5: The targets of the Winter Clean Heating Plan in the northern area ..................................... 37
Table 4.6: Heating area (in which gas is currently used) and gas consumption in the targeted regions
.............................................................................................................................................................. 38
Table 4.7: Targets and natural gas demand for natural gas heating systems in the ‘2+26’ ................. 38
Table 4.8: Targets for natural gas supply in 6 provinces as of 2021 .................................................... 38

vi
Table 4.9: Subsidy for using natural gas for residential heating ........................................................... 39
Table 4.10: Key data to predict natural gas demand by 2020 .............................................................. 40
Table 4.11: Scenarios for natural gas consumption by 2020 ................................................................ 41
Table 5.1: Outlook for indigenous gas production by 2020 .................................................................. 43
Table 5.2: Capacity of natural gas import pipelines .............................................................................. 44
Table 5.3: Outlook for pipeline gas imports (bcm/y) ............................................................................. 45
Table 5.4: Outlook for LNG demand in 2020 by natural gas consumption case .................................. 47

vii
Glossary
tce tonnes coal equivalent
mtce million tonnes coal equivalent
mt million tonnes
mt/y million tonnes per year
mcm million cubic metres
bcm billion cubic metres
tcm trillion cubic metres
bcm/y billion cubic metres per year
t/h ton of steam per hour
μg/m3 micro grammes per cubic metres
$/bbl US Dollars per barrel
$/mmbtu US Dollars per million British thermal unit
yuan/m3 Chinese Yuan per cubic metre
yoy year-on-year
GW gigawatt
TWh terawatt hour
m3/day cubic metres per day
bm2 billion square metres
SO2 Sulphur dioxide
NOX Nitrogen oxides
CBM Coalbed methane
SNG Synthetic natural gas
CNG Compressed natural gas
CCGT Combined Cycle Gas Turbine
CHP Combined heat and power
NOC National Oil Company
NDRC National Development and Reform Commission
CNOOC China National Offshore Oil Corporation
CNPC China National Petroleum Corporation
GHE Guanghui Energy Co.,LTD.
GIIGNL The International Group of Liquefied Natural Gas Importers
IHS IHS Markit
KOGAS Korea Gas Corporation
MOGE Myanmar Oil and Gas Enterprise
ONGC Oil and Natural Gas Corporation Limited
1
1. Introduction
All eyes in the international LNG market are on the future course of China’s surging growth in imports.
Since 2017, natural gas consumption in China has risen sharply as a result of strengthened action
against air pollution, which has cut the use of low-grade ‘dirty’ coal and vigorously promoted the use
of electricity and natural gas in place of coal – namely ‘coal-to-gas switching’. It is well-known in the
world that these measures triggered a natural gas supply shortage, which became a matter of social
concern in the winter of 2017/18. Many energy experts on China expected the sharp upward trend in
natural gas consumption to ease and growth to slow in 2018. As of August 2018, however, there were
no signs of this happening. How long and to what extent China’s ‘war on air pollution’ will continue,
how long the sharp upward trend in natural gas and LNG demand will continue, and what will happen
to the supply and demand balance of natural gas in the winter of 2018/19, are thus questions of major
interest.
This report has three objectives:
1. To review the measures taken against air pollution since the late 2000s and trace the impact
of such environmental action on demand for natural gas and LNG;
2. To analyse the facts, together with the background, that provoked the unexpected sharp rise
in natural gas and LNG imports during 2017 and the first half of 2018;
3. To consider the outlook for natural gas supply and demand and for LNG imports up to around
2020 on the basis of this analysis, and to assess the impact of trends in natural gas
consumption in China on the international LNG market.
2
2. Evolution of the war on air pollution in China
2.1 History
Focusing on balancing economic development and environmental protection, China began stepping
up action to tackle worsening air pollution in 1973. Action then got into full swing with the formation of
the National Environmental Protection Agency in 1984, followed by the enactment of the Environment
Protection Law (trialled in 1979) in December 1989.
Until the period of the 11th Five-Year Plan (11FYP) (NPC, Mar.2006) the main measures to tackle air
pollution were focused on the reduction of SO2 and NOx emissions and the results were fairly
successful. But a major turning point appeared in 2011–12 when data on PM2.5 emissions sent out
on Twitter from the US embassy in Beijing gradually began to draw people’s attention. This eventually
became a political issue and targets for PM2.5 emissions were added to the government’s policy
goals in the middle of the period of the 12th Five-Year plan (12FYP) (NPC, Mar.2011). Yet, the results
of the actual observation data of PM2.5 were fairly poor and the process of achieving these
environmental goals was expected to follow a rocky path.
The watershed year for environmental policy, however, was 2013. Until then, the aim had been to
achieve macro-level quantitative targets set under five-year plans that focused on enhanced efficient
use of energy and clean use of coal. This changed with the Air Pollution Prevention and Control
Action Plan (2013–17) (Action Plan 2013) (SCPRC, Sep.2013), which set more concrete numerical
targets for air pollution and laid out more robust policies to achieve them. Despite the contradictions
and dislocations that have accompanied these policies, China has determinedly moved to pursue a
course of switching from coal to other energy sources. Milestones in the development of air pollution
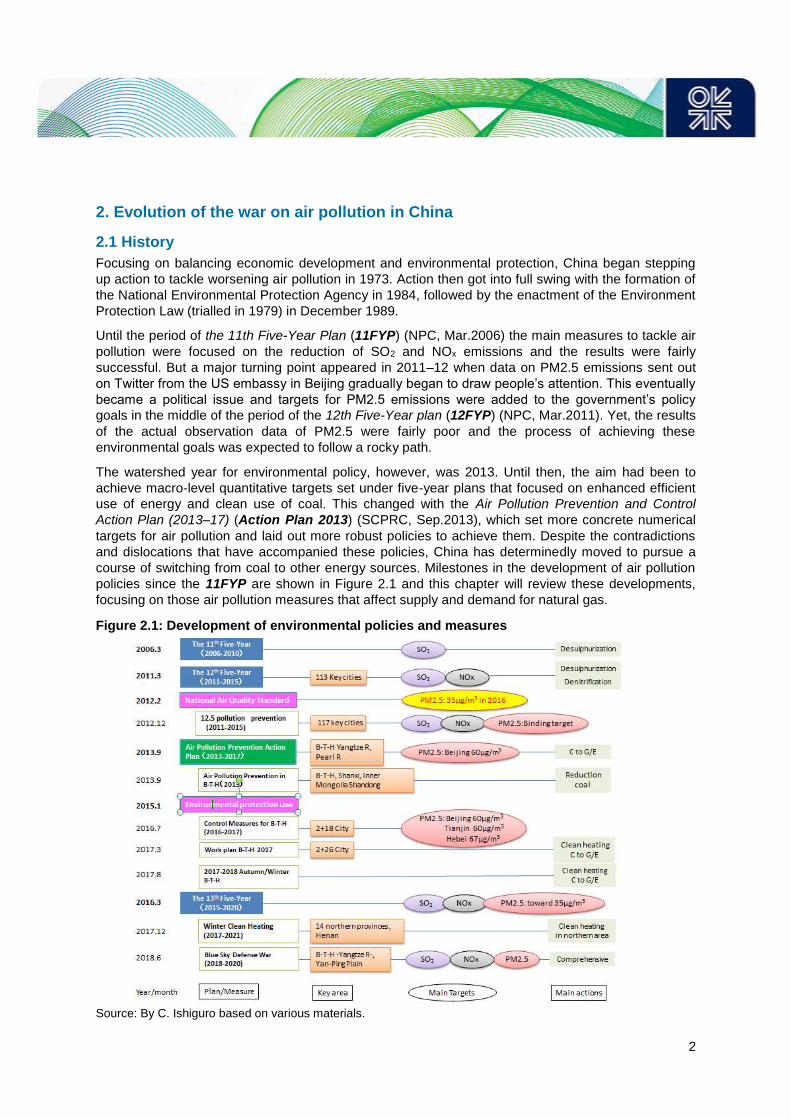
policies since the 11FYP are shown in Figure 2.1 and this chapter will review these developments,
focusing on those air pollution measures that affect supply and demand for natural gas.
Figure 2.1: Development of environmental policies and measures
Source: By C. Ishiguro based on various materials.

3
2.2 Strengthened measures against SO2 and NOx under the 11th Five-Year Plan (2006–10)
Starting with the 11FYP, which targeted the period 2006 to 2010, the main features of China’s energy
and environmental policies were mapped out as follows.
Energy efficiency: The 11FYP called for the promotion of energy conservation and set a binding
target of reducing energy consumption per unit of GDP by 20 per cent from the 2005 level. This was
the first time a numerical target for energy consumption had been set as a ‘binding’ target. However, it
was not intended to impose quantitative constraints, since targeted economic growth rate was set at
7.5 per cent per year, so even if energy efficiency improved by 20 per cent, total energy consumption
was projected to increase from 2,360 mtce to 2,700 mtce in the 11FYP, as shown in Table 2.1.
Environmental policy: the 11th Five-Year Plan for National Environmental Protection (11FYPE)
(MNEP, 2007), promulgated in November 2007, made environmental policy a core national strategy,
and presented solutions for balancing China’s excessive economic growth on the one hand and
growth-inhibiting resource depletion and deteriorating environmental problems on the other. During
this period, action on air pollution targeted SO2 but measures against NOx were in their infancy. The
priority areas identified under the 11FYPE included:
• the designation of 113 key cities1 for improvement of urban air quality in order to combat
SO2 and acid rain,
• promoting the installation of flue gas desulphurization systems at coal-fired power
generation plants,2
• the use of low-sulphur coal,
• equipping boilers with desulphurization systems.
Steps were also taken to reduce the number of inefficient small power generation plants and
overcapacity in the steel, nonferrous metal, and coal industries, and to enhance production efficiency
in energy-intensive industries.
The policy of achieving urban air quality superior to the Grade II National Air Quality Standard (see
Table 2.2) for more than 292 days per year in 75 per cent of key cities was adopted 3 as an
environmental target. Also, a reduction of SO2 emissions by 10 per cent from 2005 levels was
adopted as a priority binding target, due to the failure to achieve the target of reducing SO2 emissions
by 10 per cent from 2000 levels during the period covered by the 10th Five-Year Plan (instead,
emissions had risen by 27.8 per cent, see Table 2.1).
During this period, natural gas use was promoted in the power generation sector to reduce SO2
emissions. After that, however, the government’s policy priority for natural gas use shifted from the
power generation sector to other sectors such as the city gas and industrial sectors, mainly due to the
problem of the price competitiveness of natural gas.4
1 The municipalities of Beijing, Tianjin, Shanghai and Chongqing, the capital cities of 22 provincial and five autonomous
regions, together with another 82 cities. 2 Installation of flue gas desulphurization systems at 167 GW of existing power generating capacity and at 188 GW of new
capacity by 2009. The 11th Five-Year Plan for Sulphur Dioxide Emission Control in Existing Coal-fired Power Plants (NDRC
and MNEP, Mar.2017). 3 The target was based on the previous National Air Quality Standards set in 1996. 4 For details see Miyamoto and Ishiguro (2006).

4
Strengthening environmental obligations: owing to the perceived difficulty of achieving these
binding targets, various rules were introduced5 to make local governments and major firms ensure a
steady implementation of environmental measures.
In May 2010, the government published a document entitled Guidance on Joint Prevention and
Control Work for Air Pollution for Improving Regional Air Quality (Guidance) (SCPRC, May 2010).
This was China’s first comprehensive policy document on air pollution; it called for the development of
arrangements for planning, supervising, and managing measures to tackle air pollution at the regional
level, together with effective environmental action through joint implementation of plans. More
specifically, to achieve the target of meeting the Grade II National Air Quality Standard in the key
cities and regions by 2015, local governments should introduce regional laws and regulations and
establish regional cooperation mechanisms for the necessary control measures. Also, major firms
should attain national environmental standards. The designated key cities and regions were Beijing–
Tianjin–Hebei, the Yangtze River Delta, Central Liaoning, Shandong, and others.6 One important
point of the new guidance was that NOx and PM10 were added to the objectives of air pollution
measures, on top of SO2. Specific measures adopted included not only the mandatory installation of
flue gas desulphurization systems at coal-fired power plants, but also the nationwide installation of
denitrification equipment before the end of the 12FYP. In the key cities and regions, such measures
as: restrictions on the construction of new coal power plants, the promotion of clean coal in the power
generation and industrial sectors, the pursuit of pilot projects to control coal consumption, the
promotion of clean energy use including natural gas, and the development of air monitoring systems,
were introduced. Also, in the residential heating sector, procedures to remove small coal-fired heating
boilers and to install high-efficiency central heating systems were adopted.
As a result of the above efforts, the percentage of coal-fired power plants fitted with denitrification
equipment had risen to 90 per cent by the end of the 11FYP in 2010. While tighter administration
caused difficulties in some regions – including temporary forced shutdowns at brick and tile factories
due to worsened air pollution in the winter – the air pollution situation did improve and some targets
were achieved ahead of schedule during this period (see Table 2.1).
5 For example, the ‘one-vote veto’ system was introduced; this means that if someone in a responsible position missed an
environmental target, that person would fail a subsequent comprehensive personnel evaluation. Also, local governments are
required to report annually to the central government and to report on attainment in the final year of the plan. 6 Wuhan, Changsha, Zhuzhou, Xiangtan, Chengdu, and the Taiwan Strait coast.

5
Table 2.1: Targets and results for the 10FYP and the 11FYP
2000
10FYP
target
2005
result
11FYP
target
2010
result
GDP (trillion Yuan) 9.9 12.5 18.5 39.8
Annual growth rate (%) 7 9.5 7.5 11.2
Energy
Energy consumption per GDP
(tce/10000 yuan)
1.22 0.98 0.81
Change over the previous period
(%)
–15 to –17 –20*1 –19.1
TEC (mtce) 1,386 2,360 2,700 3,250
Annual growth rate (%) 10.5 4 6.6
Coal consumption (mt) 1,320 2,167 3,240
Annual growth rate (%) 10.4 6.6
Share of TEC (%) 61.0 –3.9 69.1 66.1 69.2
Natural gas consumption (bcm) 24.5 47.9 107.5
Annual growth rate (%) 14.4 14.0
Share of TEC (%) 3.3 2.8 5.3 4.4
Environment
SO2 emission (mt) 19.95 18.00 25.49 22.95 22.68
Change over the previous period
(%)
–10 +27.8 –10*1 –14.3
Achievement rate for Grade II
National Air Quality Standard (%)*2
36.5 50.0 54.0
Achievement rate for 292 days/y of
Grade II in AQS*2 in key cities (%)
69.4 75.0 72.0
Note: *1 Binding target. *2 The target was based on National Air Quality Standard in 1996.
Source: The 10th Five-Year Plan (NPC, Mar 2001); 11FYP; the 11th Five-Year-Plan for National Energy
Development; (NDRC, Apr.2007); 11FYPE; China Energy Statistical Yearbook 2017.
Table 2.2: National Air Quality Standard
Implementation in 1996*1 Amendment in 2012*2
Implementation in 2016
μg/m3 Grade I Grade II Grade III Grade I Grade II
Annual Daily Annual Daily Annual Daily Annual Daily Annual Daily
SO2 20 50 60 150 100 250 20 50 60 150
NO2 40 80 80 120 80 120 40 80 40 80
NOx 50 100 50 100
PM10 40 50 100 150 150 250 40 50 70 150
PM2.5 15 35 35 75
Note: *1. Initial National Air Quality Standards were set in 1996. *2. Revised in 2012 and implemented in 2016, as
described in the next section.
Source: Ministry of National Environmental Protection, the Ambient National Air Quality Standard (NEP, Feb.
2012).

6
2.3 Introduction of PM2.5 controls under the 12th Five-Year Plan (2011–15)
Following better-than-targeted performance during the 11FYP, the 12th Five-Year Plan (12FYP) went
further by setting targets for a 16 per cent reduction in energy consumption per unit of GDP and an 8
per cent reduction in SO2 emissions compared to 2010 by 2015. It also set new binding targets for
similar reductions of 10 per cent in NOx emissions.
Despite this strengthening of action to tackle air pollution in China, smog and similar phenomena in
Beijing and other major cities saw little improvement, while PM2.5 monitoring data published on
Twitter by the US Embassy in Beijing from around the autumn of 2011 increasingly caused an
international stir. Developments such as these put considerable pressure on the Chinese government,
leading Premier Li Keqiang to publicly announce the inclusion of PM2.5 in air pollution standards, at
an address during a conference on the environment at the end of 2011. The central government
committed itself to develop a PM2.5 monitoring system and to draw up new air pollution standards by
the end of 2012.
PM2.5 levels in certain areas became subject to controls under the 12th Five-Year Plan for National
Environmental Protection (12FYPE) (MNEP, 2011), and it was announced that PM2.5 would be
included in air quality monitoring in the Beijing–Tianjin–Hebei, Yangtze River Delta, and Pearl River
Delta regions. The number of key cities for air pollution control was additionally expanded from 113 to
333, and local governments were given a greater role and responsibility for implementation of
environmental measures.
Table 2.3: Targets and results for the 12th Five-Year Plan
2010
result
12FYP
target
Status 2015
result
GDP (trillion Yuan) 39.8 55.8 67.7
Annual growth rate (%) 11.2 7.0 7.8
Energy
Energy consumption per GDP
(tce/10,000yuan)
0.81 0.68 Binding 1.48
Over the previous period (%) –19.1 –16.0 Binding –18.2
TEC (mtce) 3,250*1 4,000 4,300
Annual growth rate (%) 4.3 3.6
Coal consumption (mt) 3,240 3,960
Share of TEC (%) 69.2 65.0 64.0
Natural gas consumption (bcm) 107.5 193.1
Share of TEC (%) 4.0 7.5 5.9
Environment
SO2 emission (mt) 22.68 20.86 Binding
Over the previous period (%) –14.3 –8.0 –18.0
NOx emission (mt) 22.73 20.46 Binding
Over the previous period –10.0 –18.6
Achievement rate for 292 days/y of Grade II
in AQS in key cities (%)
72.0 ≧80.0 69.4
Note: *1 Figure for TEC result in 2010 was revised to 3,610mtce in the document of the 13FYP, (NPC,
Mar.2016).
Source: 12FYP; the 12th Five-Year-Plan for National Energy Development (NDRC, Jan.2013a); 12FYPE; China
Energy Statistical Yearbook 2017.

7
It was against this backdrop that the amended National Air Quality Standard introducing new
standards on air quality (see Table 2.2) was announced in February 2012. Under the new standards,
the annual average Grade II PM10 limit was lowered from 100 μg/m3 to 70 μg/m3, and a new standard
for PM2.5 was set. The area subject to this new standard was initially limited to urban parts of
Beijing–Tianjin–Hebei, the Yangtze River Delta, and the Pearl River Delta, where PM2.5 pollution was
particularly severe. It was stipulated, however, that the coverage would subsequently be rolled out to
the 113 key cities in 2013, then to urban areas in each province in 2015, and ultimately nationwide in
January 2016. The new standard also stated that the key regions of Beijing–Tianjin–Hebei, the
Yangtze River Delta, and the Pearl River Delta would lead the way for other regions by actively
adopting the new standards, pursuing the adoption of clean energies in order to control coal
consumption, and making efforts to introduce tighter regulations against air pollution.
Under the 12th Five-Year Plan for the Prevention and Control of Air Pollution in Key Areas, published
in December 2012 (MNEP, Dec.2012), common PM10, SO2, NOx, and PM2.5 targets for attainment
by 2015 were set for designated regions. The targets consisted of a 10 per cent reduction in PM10,
10 per cent reduction in SO2, 7 per cent reduction in NOx, and 5 per cent reduction in PM2.5
compared to levels in 2010, and applied to 117 of above prefecture-level cities and seven other cities
in 19 of provinces, autonomous regions, and direct-controlled municipalities, including Beijing-Tianjin-
Hebei, the Yangtze River Delta, the Pearl River Delta. (These locations were spread in total, 13.8 per
cent of China’s land area.) As pollution was especially severe in the Beijing–Tianjin–Hebei, Yangtze
River Delta, and Pearl River Delta regions, the lowering of averaged annual concentrations by 6 per
cent compared to 2010 levels was made a binding target in these regions as a whole (see Table 2.4).
The plan incorporated a number of specific measures, including the closure of heavy emitters of
pollutants and/or excessive production capacity, expansion of the use of clean energies such as
natural gas, restraint of total coal consumption, adoption of clean coal technologies, enhanced action
against SO2 and NOx emissions, and development of air monitoring systems.7
Natural gas was positioned as an important solution for environmental protection and the plan laid out
strategies in accordance with the 12FYP including the development of infrastructure such as
pipelines, LNG receiving terminals, and city gas supply systems; however, it only included a moderate
expansion of natural gas-fired power generating capacity.
Regarding coal, the plan established a new goal of drawing up mid/long-term targets for individual
regions to curb total coal consumption. This was in addition to existing policy requiring the
decommissioning of coal-fired boilers in regions with central heating supply systems, and a
progressive shutdown of small coal-fired boilers with a capacity of 10 t/h or under in urban areas.
7 These measures had to be in place up to the end of 2012 in Beijing–Tianjin–Hebei, the Yangtze River Delta, and the Pearl
River Delta and up to the end of 2015 in other regions.

8
Table 2.4: Air pollution reduction targets (%) in 19 key areas by 2015 (reduction percentage
over 2010)
Region SO2 NOX PM10 PM2.5
B-T-H Beijing, –10 –7 –15 –15 binding
Tianjin –8 –9 –12 –6 binding
Hebei –11 –7 –12 –6 binding
Yangtze River
Delta
Shanghai –11 –9 –10 –6 binding
Jiangsu –12 –10 –14 –7 binding
Zhejiang –11 –10 –10 –5 binding
Pearl River Delta Guangdong –12 –9 –8 –5 binding
Liaoning –11 –9 –12 –6
Shandong –14 –10 –14 –7
Wuhan –7 –4 –10 –5
Changsha –9 –5 –10 –5
Chongqing –6 –4 –12 –6
Sichuan –9 –5 –10 –5
Taiwan Strait coast –6 –5 –8 –4
Shanxi –10 –7 –12 –4
Shaanxi –7 –5 –14 –4
Gansu –14 –8 –14 –4
Ningxia –10 –7 –10 –5
Urumqi –9 –9 –12 –4
Note: PM2.5 reduction targets were made mandatory for Beijing, Tianjin, Hebei, Shanghai, Jiangsu, Zhejiang,
and Guangdong for the first time, but remained non-binding targets for other regions. Averaged reduction target
was minus 6 per cent in Beijing, Tianjin, Hebei, Shanghai, Jiangsu, Zhejiang, and Guangdong as a whole.
Source: (MNEP, Dec.2012).
2.4 The Air Pollution Prevention and Control Action Plan (2013–17) and reduction of coal use
2.4.1 The Air Pollution Prevention and Control Action Plan (2013–17)
Placing limits on PM2.5 levels during the 12FYP thus necessitated stricter action on the environment
and on energy use, and the Air Pollution Prevention and Control Action Plan (Action Plan 2013)
(SCPRC Sep.2013) signalled a major shift of direction in energy use to restrict the use of coal.
Official PM2.5 figures released by China from January 2013 exceeded emission standards by a wide
margin.8 Public interest in air pollution increased and demands for stronger action arose in response,
leading to promulgation of the Action Plan 2013 in September 2013. In contrast to the macro-level
targets set by five-year plans hitherto, this plan focused solely on bringing down PM10 and PM2.5
levels and made provisions for various detailed countermeasures.
The following key binding targets were set with the aim of significantly improving the air quality
situation by 2017:
• a reduction in PM10 concentrations of at least 10 per cent from 2012 levels in 360 prefecture-
level cities nationwide;
8 According to MNEP (Aug.2013), the average concentration of PM2.5 in 74 cities (496 points) was 76 μg/m³ (between
24 μg/m³and 172 μg/m³), which exceeded the Grade II target of 35 μg/m³. As for PM10, the average concentration was
123 μg/m³ (between 43 μg/m³and 331 μg/m³) compared with the Grade II target of 70 μg/m³. As for SO2, the figure was
43 μg/m³ (6 μg/m³ to 138 μg/m³) against 60 μg/m³.

9
• reductions in PM2.5 concentrations (from 2012 levels) of:
- 25 per cent in Beijing–Tianjin–Hebei,
- 20 per cent in the Yangtze River Delta,
- 15 per cent in the Pearl River Delta;
• limitation of the concentration of PM2.5 in Beijing City to approximately 60 μg/m3.9
As for the measures relating to energy use, it should be noted that the Action Plan 2013 called
specifically for switching from ‘coal to gas’ and/or from ‘coal to electricity’ for small boilers, and it also
placed numerical limits on coal use by establishing mid- to long-term targets for reducing total coal
consumption and correspondingly reducing coal’s share of total primary energy consumption to not
more than 65 per cent by 2017. The Action Plan 2013 also stated that the natural gas pricing system
should be revised to secure price competitiveness that could facilitate coal-to-gas switching.
Figure 2.2: Targeted area for the Action Plan 2013
Source: Based on Action Plan 2013.
Based on the Action Plan 2013, the Implementation Rules for Action Plan for Air Pollution Prevention
in Beijing–Tianjin–Hebei and Surrounding Area (Action Plan B–T–H) (MNEP, Sep.2013) was
published in the same month. It mainly provided concrete measures and targets for Beijing–Tianjin–
Hebei and the surrounding areas (Shanxi, Inner Mongolia Autonomous Region, and Shandong
Province) and regions. These consisted of:
- Further lowering the PM2.5 targets10 from those set under the Action Plan 2013 and
broadening the geographical scope of regulation.
9 Although binding targets for PM2.5 emissions were set in (MNEP, Dec.2012), no methods of assessing attainment were
provided. In June 2014, however, methods and plans of assessing rates of attainment of PM2.5 and PM10 targets in each
sector were established. 10 It added the following targets for reductions in PM2.5 from 2012 levels by 2017: –25% in Beijing–Tianjin–Hebei, the Yangtze
River Delta, and the Pearl River Delta as a whole; –20% in the provinces of Shanxi and Shandong; and –10% in the Inner
Mongolia Autonomous Region.
10
- The complete phasing out of boilers with a capacity of 10 t/h or under in prefecture-level
cities in Beijing–Tianjin–Hebei and the surrounding area by the end of 2015, and the
conversion of all coal furnaces to other fuels in central Beijing.
- The decommissioning of coal-fired boilers up to a capacity of 35 t/h in the urban areas of
Beijing–Tianjin–Hebei, the decommissioning of coal-fired boilers up to a capacity of 10 t/h
in suburban areas, and the conversion of coal-fired boilers to natural gas use at chemical,
paper, printing, and other plants in Beijing, Tianjin, Hebei, Shanxi, and in the development
zones of Shandong by the end of 2017.
In addition, specific provision was made for reducing coal consumption by 83 mt in Beijing–Tianjin–
Hebei and Shandong by the end of 2017, by promoting energy conservation and conversion to clean
fuels (see Table 2.5).
As a result of various efforts to achieve the above concrete air pollution targets, there was a
considerable growth in demand for natural gas, as energy users moved away from coal use in key
cities. Accordingly, in the second and third quarters of 2013, CNPC restricted supplies of natural gas
to industrial customers, and the widening gap between supply and demand11 led to a severe natural
gas shortage in the winter of 2013/14. LNG imports consequently rose sharply, causing the
international LNG market to tighten temporarily.
2.4.2 Measures to promote reduction of coal use
This subsection reviews the developments of environmental policy since 2014, when the curbing of
coal use emerged as a clear policy objective.
In May 2014, the Reinforced Work Program for Air Pollution Prevention in Energy Industry (NDRC,
Mar.2014) was announced. This outlined environmental policy dedicated to the energy industry and
provided short, medium, and long-term plans for power generation plants and boilers.
It was followed by the announcement of the Strategic Action Plan for Energy Development (2014–20)
(Strategic Action Plan) (SCPRC, Nov.2014) in November. The plan established targets for energy
supply and demand for the six years up to 2020; its principal objective was to reduce coal
consumption and encourage users to switch to other fuels. The main elements of this plan are
summarized as follows:
• It aimed to reduce total primary energy consumption (to 4.8 billion tce in 2020) by
increasing energy efficiency. This was due to concern over energy security, triggered by
increased dependence on energy imports in 2013.
• The plan called for a reduction of coal consumption to 4.2 billion tons and a shrinking of
its share of total primary energy consumption to 62 per cent by 2020, in order to mitigate
air pollution and emissions of greenhouse gases. In particular, it strengthened curbs on
coal use in the Beijing–Tianjin–Hebei, Yangtze River Delta, and Pearl River Delta regions,
where consumption was to be reduced from 2012 levels; Beijing–Tianjin–Hebei was set
the especially demanding target of a 100 mt reduction.
• The plan also called for the promotion of city gas use in urban areas and an increase in
natural gas’s share of total primary energy consumption to at least 10 per cent in 2020. To
achieve this, the plan set targets for expanding domestic production of natural gas: raising
the production of conventional gas to 185 bcm/y, of shale gas to 30 bcm/y, and of CBM to
30 bcm/y. At the same time, it set out a policy of reforming energy prices and transitioning
to market prices.
11 Source: ( NDRC, Oct.2013), and also remarks at the ‘Natural Gas Supply in Peak Winter Coordination Meeting’; ‘Natural gas
demand growth during the peak season in 2013 was 13.5%, while production growth was 9.2%’.

11
December of the same year then saw the release of the Interim Measures for Management of
Substitution and Reduction of Coal Consumption in Key Areas (NDRC, Dec.2014). This plan broke
down the targets to be attained by regional governments to the level of individual companies and also
called for the key areas that had been assigned targets under the previously described Action Plan
B–T–H to formulate annual plans for concrete reductions. Furthermore, it required Shanghai, Jiangsu,
Zhejiang, and Fujian to set coal reduction targets and report to central government by the end of June
2015. These regulations thus expanded the regions where coal consumption had to be reduced and
strengthened their feasibility. In parallel, the plan made compulsory the adoption of renewables and
natural gas, as alternatives to coal.
The Strengthened Work Plan for Controlling Air Pollution and Total Coal Consumption in Key Cities
subsequently published in July 2015 (NDRC and MNEP, Jul.2015) revealed the names of the 10
worst cities12 for air pollution and called for stronger action to be taken by these cities to reduce coal
use.
Strengthened steps have thus been taken since 2013 to reduce coal use and break the impasse in
tackling air pollution. The reductions achieved as a result are summarized in Table 2.5.
Table 2.5: The target for reduction for coal consumption and actual demand (mt)
2012 actual 2017 reduction
target
2017 target 2016 actual
Beijing 23 –13 10 8.5
Tianjin 55 –10 45 42.3
Hebei 320 –40 280 281
Shandong 400 –20 380 409*1
Note: According to NDRC’s report, increased volume was 7 mt and 13 mt in Jiangsu compared with 2012.
Source: Action Plan B–T–H. *1 China Energy Statistical Year Book 2017.
2.4.3 Revision of the Environment Protection Law and administrative systems of responsibility for environmental protection targets
Measures to tackle air pollution were thus strengthened by being set out in more concrete detail, and
their robust implementation was ensured by the enforcement of the revised Environment Protection
Law on January 2015. The revised law stipulates that ‘environmental protection is a basic policy of the
state.’ It also strengthened the enforcement powers of the local government officers in charge of
environmental protection, and at the same time it provided for more severe punishment of offenders
by, for example, eliminating the ceiling on fines imposed on offenders and placing enforcement under
the authority of the police.
Revisions made to the Air Pollution and Control Law in August 2015 (which entered into force in
January 2016) incorporated stricter penalties against offenders under the Environment Protection
Law. As just described, it tightened compliance with environmental standards,13 it also provided a
legal foundation for clearer accountability. Systems of responsibility 14 were subsequently further
enhanced to ensure more robust implementation of environmental measures. This is thought to have
contributed indirectly to the social dislocation caused by the shortage of natural gas in 2017 that is
discussed below.
12 Seven cities in Hebei included: Shijiazhuang, Jinan in Shandong, Zhengzhou in Henan, and Tianjin. 13 For example, economic activities are suspended in the event of a worsening of air pollution. 14 For example, publicizing the attainment rate of air pollution improvement targets as a performance indicator of regional
government officials.

12
2.4.4 The Action Plan for Preventing Air Pollution: the final step in strengthening air pollution measures in Beijing–Tianjin–Hebei (after 2016)
Despite these significant efforts to counter air pollution, the actual state of air quality remained
disappointing (see Figure 2.3). In November 2015, shortly before the Air Quality Standard went into
effect on 1 January 2016, severe air pollution occurred over wide areas of the north-east and Beijing–
Tianjin–Hebei. The situation remained poor in December, when a ‘red alert’ was declared in Beijing.
As a result, many factories had to suspend operations, schools were closed, and even arrivals and
departures at Beijing Airport were affected.
Figure 2.3: Daily PM2.5 levels and targets in Beijing, Tianjin and Shijiazhuang (Hebei)
From Jan. 2015 to Aug. 2018
Source: Based on data published by Ministry of National Environmental Protection.
In July 2016, the Ministry of National Environmental Protection published its Interim Report on the Air
Pollution Prevention and Control Action Plan (2013) (MNEP, Jul.2016). Regarding air pollution in
urban areas, the report found that PM2.5 levels had improved in 74 cities from 72 μg/m3 in 2013 to
55 μg/m3 in 2015, and that interim targets for both PM2.5 and PM10 15 had been met in many
provinces. However, the pollution situation remained serious in winter, and further efforts were
needed in Beijing in particular to meet the 2017 target. The report observed that there was a particular
need for stronger action to reduce coal use during the autumn and winter months when heating
appliances were used, and it also noted that it was necessary to promote natural gas use throughout
the whole of Beijing–Tianjin–Hebei, reduce the use of coal in industry, promote the use of electricity
and gas in place of coal, and pursue measures to combat air pollution in winter.
Also in July 2016, the Ministry of National Environmental Protection and the governments of Beijing,
Tianjin, and Hebei announced the Intensive Air Pollution Prevention and Control Measures for
Beijing–Tianjin–Hebei (2016–17) (Control Measures B–T–H) (MNEP, 2016). These were designed
to achieve the new national standard targets for 2017 (see Table 2.6), and provided short-term
measures to enhance prevention of PM2.5 pollution in selected regions. The target area was
extended to ‘2+18’ and among these, the ‘2+4’ cities (Beijing, Tianjin, Baoding, Langfang, Tangshan,
15 See section 2.4.1.

13
and Zhangzhou) and the ‘1+2’ cities (Beijing, Baoding and Langfang) were given a particularly
important role in pollution prevention (see Figure 2.4). The main measures were as follows:
- Promoting conversion from coal to other fuels (gas and electricity) in rural areas. In
particular, the complete prohibition of coal use in Beijing by October 2017 and the
promotion of conversion from coal to electricity and gas in Baoding and Langfang.
- The phasing out of small boilers (boilers with capacities of up to 35 t/h in urban parts of
Beijing, Tianjin, and Hebei, and of 10 t/h boilers in other regions by the end of October
2017).
- Strengthened measures in the industrial sector (enhanced environmental action on coal-
fired power plants and reform of the iron and steel sector by the end of October 2016).
- Strengthened emergency measures in the event of a temporary worsening of air pollution
(such as temporary factory shutdowns).
- Adjustment of production at factories in urban areas between November and January.
- Tightened supervision and inspection (quarterly ranking by the Ministry of National
Environmental Protection of regions by air pollution, central government supervision of
‘2+4’ cities, and the introduction of liability for non-attainment of targets).
Figure 2.4: Targeted area for the Control Measures B–T–H
Source: Based on Control Measures B–T–H.
Despite these strengthened measures, however, serious air pollution occurred again in some cities in
the Beijing–Tianjin–Hebei region on 30 September and 1 October 2016, forcing the Ministry of
National Environmental Protection to convene an emergency meeting on 2 October in response. As
shown in Figure 2.5, the situation in winter 2016 was still severe in Beijing and the Tianjin area and
even worse in Hebei.

14
Figure 2.5: Daily PM2.5 levels and daily targets in Beijing, Tianjin and Shijiazhuang (Hebei)
From September 2016 to December 2016
Source: Based on the data published by Ministry of National Environmental Protection.
Table 2.6: Annual targets for PM2.5 in 2017 regulated by the Intensive Air Pollution Prevention
and Control Measures for Beijing–Tianjin–Hebei (2016–17)
Beijing 60 μg/m3
Fengtai, Tongzhou, Fangshan, Daxing 65 μg/m3
Tianjin 60 μg/m3
Wuqing District, Baodi District and Jixian County below 60 μg/m3
Hebei 67 μg/m3
Baoding 77 μg/m3
Langfang 65 μg/m3
Note: The annual standard for PM2.5 regulated by the National Air Quality Standard is 35 μg/m3.
Source: (MNEP, Jul.2016).
In March 2017, the Ministry of National Environmental Protection published its Work plan for air
pollution prevention and control in Beijing, Tianjin and Hebei and surrounding areas in 2017 (Work
Plan B–T–H) (MNEP, Mar.2017). This expanded the areas subject to strengthened action to ‘2+26’
cities (see Figure 2.6) and incorporated the following specific measures:
• reinforcement of the responsibility of local governments;
• development of natural gas and electricity supply systems to encourage the use of gas
and electricity instead of coal by CNPC, SINOPEC, CNOOC, and the State Grid
Corporation of China in cooperation with local governments;
• development and strengthening of scheduling and inspection mechanisms by the Ministry
of National Environmental Protection.
More importantly, the ‘2+26’ cities were designated to be the first to implement clean heating plans in
the winter in the northern region, and plans were put into effect to scale up to the replacement of
50,000–100,000 coal-fired home heaters by gas or electricity ones by October 2017. Phasing out of

15
coal-fired boilers with a capacity of up to 10 t/h was also pursued, and explicit policy-based incentives
were provided to assist in this process.
Figure 2.6: Targeted area for Work Plan B–T–H
Source: Based on Work Plan B–T–H.
However, the air pollution situation in Beijing–Tianjin–Hebei remained serious in the first half of 2017.
The Ministry of National Environmental Protection therefore promulgated a further measure, the
2017–18 Autumn/Winter Action and Inspection Plan for Tackling and Comprehensive Management of
Air Pollution in Beijing–Tianjin–Hebei and Surrounding Areas in August 2017 (2017 Autumn/Winter
B-T-C) (MNEP, Aug.2017a). This was set for implementation between October 2017 and March 2018,
which meant that it extended beyond the period covered by the Action Plan 2013. 2017
Autumn/Winter B-T-C laid out a detailed list of targets to be achieved by individual sectors and
regions, including:
• completion of the replacement of coal by gas or electricity in 3 million households
(including 300,000 in Beijing, 290,000 in Tianjin, and 1,800,000 in Hebei) by October
2017,
• the phasing out of coal-fired boilers (specifically, the complete phasing out of 10 t/h
boilers and the phasing out of boilers up to 35 t/h in urban areas),
• reduction of coal consumption.16
Along with the 2017 Autumn/Winter B-T-C, the 2017–18 Autumn/Winter Action and Inspection Plan
for Tackling and Comprehensive Management of Air Pollution in Beijing–Tianjin–Hebei and
Surrounding Areas – Strengthened Supervision Plan (MNEP, Aug.2017b) was published to
strengthen accountability and inspection-related arrangements. In concrete terms, this introduced a
system of ‘one-on-two responsibilities’ (under which two individuals were made responsible for one
16 The 44,000 boilers designated to be phased out in 2017 included: 1,500 boilers in Beijing, 5,640 boilers in Tianjin, and
17,000 boilers in Hebei. The actual replacement was 56,000.

16
event) and 102 inspection teams consisting of a total of 2,480 personnel were dispatched to the
‘2+26’ cities between September 2017 and January 2018. These inspections exposed numerous
employees and government officials who were responsible for air pollution.
According to data released by the Chinese government in March 2018, these strengthened measures
resulted in 4.74 million households (out of the 5.33 million households targeted) switching from coal to
gas or electricity by the end of 2017. The number exceeded the original plan, which had a target of
3.55 million households. Among them, 3.94 million households in Beijing–Tianjin–Hebei and the
surrounding areas switched from coal to gas or electricity.17
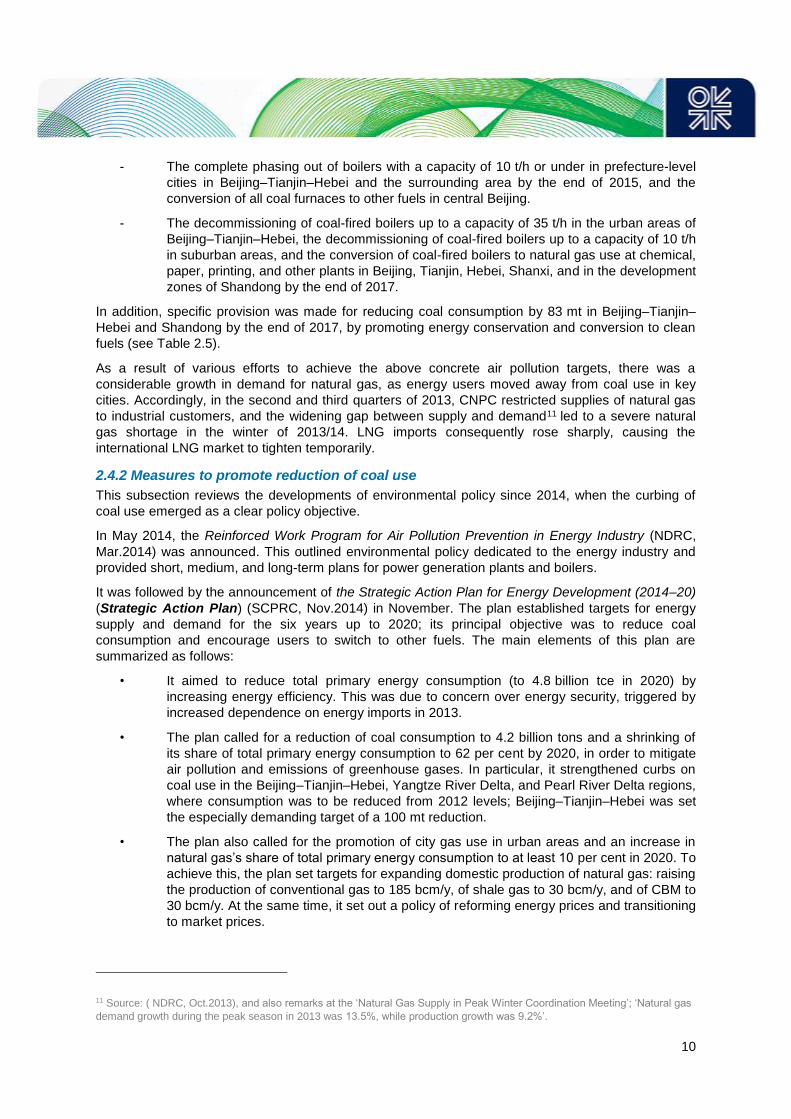
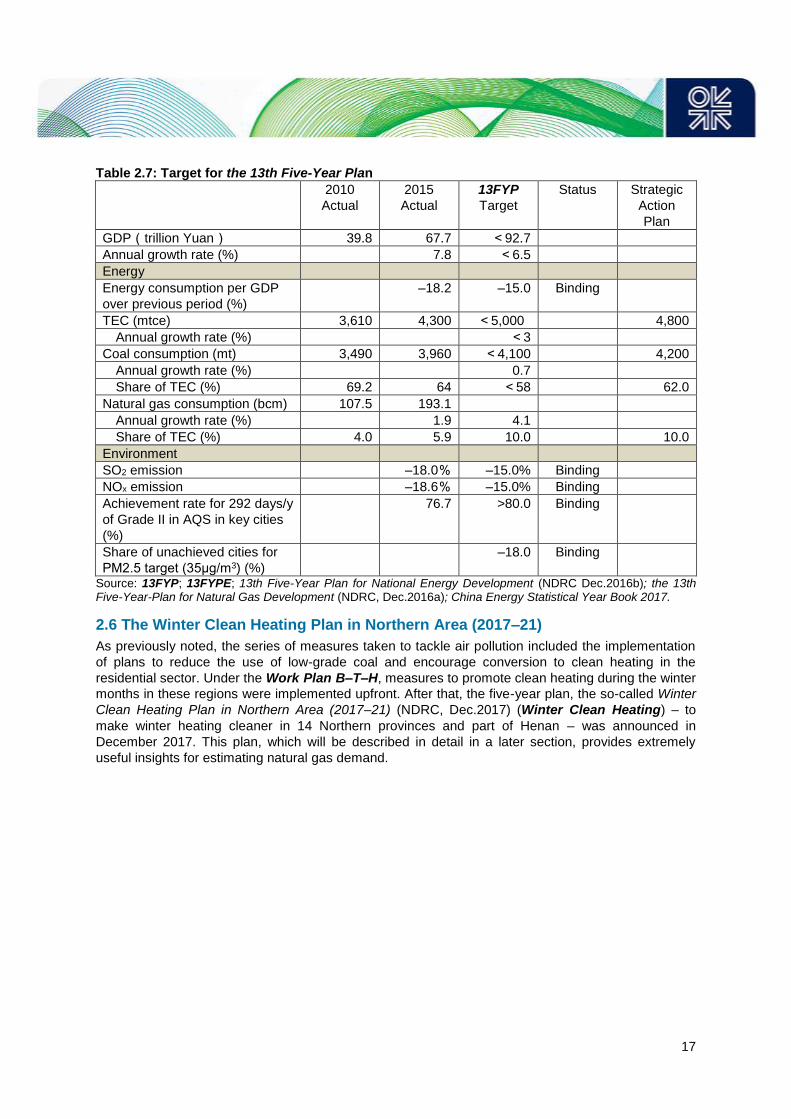
2.5 The 13th Five-Year Plan (2016–20)
The 13th Five-Year Plan (13FYP) (NPC, Mar.2016) announced in March 2016 set a binding target of
lowering both SO2 and NOx emissions by 15 per cent compared to levels in 2015, and a binding
target of lowering PM2.5 level by 18 per cent in cities that had failed to achieve a PM2.5 level of
35 μg/m3.
The 13th Five-Year-Plan for National Energy Development (NDRC, Dec.2016) published in December
of that year called for the control of total energy consumption, efficient use of energy, expansion of
clean energies, and energy market reform. One element that attracted particular attention was its
incorporation of plans to rapidly expand the use of renewables. The plan set binding targets for a
deceleration of the annual rate of growth in energy consumption to less than 3 per cent and a
reduction in total primary energy consumption to less than 5.0 billion tce by the final year of the plan.
It also set a binding target of reducing coal consumption’s share of total primary energy consumption
from 64 per cent to 58 per cent, along with a binding target of increasing non-fossil fuels’ share to 15
per cent. Coal consumption, which came to 3.96 billion tons in 2015, was consequently strictly limited
to not more than 4.1 billion tons, which was even less than the 4.2 billion tons set as a target under
the previously announced Strategic Action Plan (in 2014). The Beijing–Tianjin–Hebei, Yangtze River
Delta, and Pearl River Delta regions remained designated as the key regions for reduction of coal
use, and were newly joined by the North-east region. Under coal-to-gas switching projects,
189,000 t/h of boiler capacity is to be converted from coal to gas and this is expected to generate
natural gas demand of 45 bcm. The plan additionally called for coal-fired power generating capacity in
2020 to be reduced to 1,100 GW by cancelling plans for the construction of coal-fired power plants
and postponing the approval for construction of private coal-fired power generation plants.
17 According to Hebei government, the gas supply to about 180,000 households was shelved during 2017 due to the shortage
of natural gas supply in Hebei, where 2.54 million households had completed switching from coal. While gas demand had been
projected to reach 8.2 bcm during the heating season, the planned supply volume was only 6.5 bcm. There was thus an
estimated shortfall of 1.7 bcm.
17
Table 2.7: Target for the 13th Five-Year Plan
2010
Actual
2015
Actual
13FYP
Target
Status Strategic
Action
Plan
GDP(trillion Yuan) 39.8 67.7 <92.7
Annual growth rate (%) 7.8 <6.5
Energy
Energy consumption per GDP
over previous period (%)
–18.2 –15.0 Binding
TEC (mtce) 3,610 4,300 <5,000 4,800
Annual growth rate (%) <3
Coal consumption (mt) 3,490 3,960 <4,100 4,200
Annual growth rate (%) 0.7
Share of TEC (%) 69.2 64 <58 62.0
Natural gas consumption (bcm) 107.5 193.1
Annual growth rate (%) 1.9 4.1
Share of TEC (%) 4.0 5.9 10.0 10.0
Environment
SO2 emission –18.0% –15.0% Binding
NOx emission –18.6% –15.0% Binding
Achievement rate for 292 days/y
of Grade II in AQS in key cities
(%)
76.7 >80.0 Binding
Share of unachieved cities for
PM2.5 target (35μg/m3) (%)
–18.0 Binding
Source: 13FYP; 13FYPE; 13th Five-Year Plan for National Energy Development (NDRC Dec.2016b); the 13th Five-Year-Plan for Natural Gas Development (NDRC, Dec.2016a); China Energy Statistical Year Book 2017.
2.6 The Winter Clean Heating Plan in Northern Area (2017–21)
As previously noted, the series of measures taken to tackle air pollution included the implementation
of plans to reduce the use of low-grade coal and encourage conversion to clean heating in the
residential sector. Under the Work Plan B–T–H, measures to promote clean heating during the winter
months in these regions were implemented upfront. After that, the five-year plan, the so-called Winter
Clean Heating Plan in Northern Area (2017–21) (NDRC, Dec.2017) (Winter Clean Heating) – to
make winter heating cleaner in 14 Northern provinces and part of Henan – was announced in
December 2017. This plan, which will be described in detail in a later section, provides extremely
useful insights for estimating natural gas demand.

18
Figure 2.7: Targeted area for Winter Clean Heating
Source: Based on Winter Clean Heating.
2.7 The Action Plan to Win the Blue Sky Defence War (2018–20)
On 27 June 2018, the State Council of the People’s Republic of China published its Action Plan to
Win the Blue Sky Defence War (Blue Sky Action Plan) (SCPRC, Jun.2018) for the years 2018–20.
This is a three-year comprehensive action plan to tackle air pollution in line with the 13FYP, and it
designates Beijing–Tianjin–Hebei and surrounding areas, the Yangtze River Delta, and the Yan-Ping
Plain region as the key cities and regions.18
The plan sets a number of targets to be achieved by 2020. These include the reduction of SO2 and
NOx emissions by at least 15 per cent from 2015 levels, and the reduction of PM2.5 concentrations by
at least 18 per cent from 2015 levels and their maintenance within regulatory limits. The plan also
provides concrete details of a highly comprehensive set of measures for achieving these targets.
These include the transformation of industrial structures, the pursuit of plans to make heating cleaner
in the north, limitation of coal use, the phasing out of coal-fired boilers, improvement of energy
utilization efficiency, promoting the introduction of clean energies, and the reduction of emissions in
the transport sector. Other matters covered range from legal, regulatory, and supervisory
arrangements to administrative responses and information disclosure. In its breadth and depth of
scope, this three-year action plan provides evidence of the present administration’s strong
commitment to the war on air pollution.
18 For details, see Figure 2.8

19
Figure 2.8: Targeted area for the Blue Sky Action Plan
Source: Based on (SCPRC, Jun.2018).
2.8 Summary: air pollution now and in the future
This chapter concludes with some brief remarks on the current air pollution situation and how it may
evolve in the future.
Firstly, although various policy measures to reduce PM 2.5 emissions had been implemented on the
basis of the Action Plan 2013, there were few improvements in actual observed data as of the end of
2015. As a result, the government introduced a series of hard-hitting measures focused on Beijing–
Tianjin–Hebei and its surrounding areas by the end of 2017 – the final year of the Action Plan 2013.
Despite such serious efforts, air pollution failed to reach a satisfactory level. The average monthly
PM2.5 concentration exceeded 100 μg/m3 between the end of 2017 and March 2018 in designated
key cities in Hebei, the Yangtze River Delta, Shaanxi, Henan, Xinjiang, Uyghur, among others. (see
Figure 2.9).
Looking ahead, the focus of interest will be on the extent to which improvements are made as a result
of strengthened action on air pollution. Although the Blue Sky Action Plan sets targets for
improvement compared with 2015 levels, these figures remain relatively lax by international
standards.19 Therefore, it is highly likely that these targets will be made more stringent and strong
action will continue to be pursued, judging by the present administration’s strict stance on air pollution.
According to the Action Plan for Comprehensive Management of Air Pollution in Autumn and Winter in
Beijing–Tianjin–Hebei and surrounding areas 2018–19 (NDRC, MEE, and RG, Sep.2018), published
in September 2018, plans to remove small coal-fired boilers in the industrial sector and to replace
coal-fired space heating in the residential sector20 are scheduled to be implemented steadily on a
broad scale.
19 For example, the Japanese annual standard for PM2.5 is set at 15μg/m3 and at 35μg/m3 for daily bases. In 2018, it was
reported that the annual average number was12μg/m3 in Kanto region (Source: materials published by Japan Environment
Agency Council). In the USA, the annual standard is set 12μg/m3 (Source: US EPA’ Clean Air Act’). 20 Such replacements in around 3.6 million households in the region are scheduled for implementation.

20
In sum, when we assess the achievements of environmental policy in China, the reductions of SO2
and NOx emissions from the large power generation plants and industrial facilities were successfully
completed in a relatively short period, partly because counter-measures (installing desulphurization
and/or de-nitrification plants and facilities) were fairly simple.
However, as measures to reduce PM2.5 emissions have to cover all sectors including transportation,
and there are so many sources of emissions, the process may not be complete in a decade – as can
be seen by Japan’s experiences.21
Therefore, the anti-pollution steps taken in China can be considered to have been far from perfect, but
there has never been failure in the long term.
Yet, unexpected social problems arising from shortages of natural gas supply occurred during the
2017/18 winter season, and it has become obvious that reducing coal consumption remains an
important issue to be resolved. Natural gas is definitely one of the key solutions, but at the same time
it has become evident that there are constraints on its supply capacity, which we shall consider in the
following chapters.
Figure 2.9: Monthly PM2.5 levels in key cities in China
Source: Based on the data published by Ministry of National Environmental Protection.
21 For example, in Japan, the Automobile NOx Emission Law was revised in 2001 and PM2.5 (emission regulations on diesel
cars) was added to the targets. However, even after this, measures have had to be strengthened in polluted areas. Also in
China, it is expected that the focus of countermeasures will shift to NOx and PM 2.5 emissions in the transportation sector, as
described in Blue Sky Action Plan and in (NDRC, MEE, and RG Sep.2018). For example, the introduction of new energy or
clean energy vehicles has been promoted in Beijing city and there are already restrictions on vehicles fuelled by fossil fuels.

21
3. Trends in natural gas supply and demand
This chapter outlines trends in the natural gas market in China that have taken place over the past 20
years and then analyses their effect on the supply and demand of natural gas by examining the
confusion resulting from the country’s intensified war on air pollution.
3.1 Long-term trends in natural gas consumption
3.1.1 Macro-level trends since 2000
We begin by briefly reviewing the role played by natural gas in energy supply and demand as a
whole. Figure 3.1 shows trends in year-on-year rates of growth in GDP, total energy consumption,
and natural gas consumption. At the beginning of the 2000s, the main source of gas supply was
China’s indigenous gas production and this was consumed largely as a feedstock in industry, with
very little being used in the power generation and residential sectors. After that, however, the West–
East pipeline (which linked the gas fields of western China to demand centres on the east coast) had
started operation in 2005 and natural gas consumption posted double-digit annual growth rates. In
2006 the growth rate exceeded 20 per cent, when LNG began to be imported. Furthermore, this was
followed by the commencement of pipeline gas imports from Central Asia in 2010 and also by the
accelerated development of domestic trunk pipelines, including the expansion of capacity of the
Shaanxi–Beijing Pipeline and the construction of a second and third East–West Pipeline, which
significantly expanded the geographical extent of the natural gas market. As Figure 3.1 shows,
consumption of natural gas grew considerably faster than the economy, taking natural gas’s share of
primary energy consumption to 6.7 per cent22 by 2016.
Natural gas consumption during this period was characterized by fully fledged growth in all sectors.
This included growth in:
• use for power generation – alongside increasing adoption of high-efficiency power plants
such as CCGT,
• industrial, residential, and commercial use – with the development of supply
infrastructure, facilities, and appliances,
• use for CNG and LNG vehicles in the transport sector.
On the supply side, domestic production grew strongly at an annual rate of more than 10 per cent.
Nevertheless, this was insufficient to keep up with the vigorous growth in demand, and LNG and
pipeline gas imports rose sharply.
However, growth was not all plain sailing; the vast size of the energy market created its own
problems, causing consumption to stall in 2014–16. As Table 3.1 shows, there was a clear slowing of
growth during this period. Although partially attributable to macro-level factors such as the economic
downturn and changes in industrial structure, other particular factors were also involved. These
included:
• increased impacts of energy and environmental policies (including measures to tackle air
pollution),
• complex price adjustments in the supply chain of natural gas (this problem had emerged
with the significant growth of imports),
• ever-changing international energy prices.
These will be briefly considered in the following section.
22 By calorific value calculation, China Energy Statistical Yearbook 2017.

22
Following the temporary lull in growth, natural gas consumption spiked in 2017 and the upward trend
continued into the first half of 2018. This is clearly attributable to measures to tackle air pollution, and
may well mark major turning point natural gas consumption. At all events, natural gas has, over the
past 20 years, transformed from being a minor domestically produced resource, into a key energy
source that is fundamental to China’s huge energy market. Owing to its huge size, the changes in
LNG imports that partially support this supply will undoubtedly exert an enormous impact on the
international LNG market.
Figure 3.1: Growth rate of GDP, total energy and natural gas consumption
Source: China Energy Statistics Yearbook 2017; Articles published by NDRC.
Table 3.1: Averaged annual growth rate (%)
Year 2000–13 2014–16 2017
GDP 10.0 7.0 6.9
Total Energy Consumption 8.4 1.4 2.8
Natural Gas Consumption 16.2 6.8 15.1
Natural Gas production 12.8 1.8 8.5 Source: China Energy Statistics Yearbook 2017; Articles published by NDRC.
Table 3.2: Natural gas consumption by sector
Sector
2000 2005 2010 2016 Annual growth
rate 2000–16 (%) bcm share
(%) bcm
share
(%) bcm share (%) bcm
share
(%)
Industrial 19.3 78.6 31.0 66.5 51.1 47.3 93.1 44.8 10.3
Power
Generation 0.6 2.6 1.7 3.8 18.1 16.7 40.8 19.6 29.6
Residential 3.2 13.2 7.9 17.0 22.7 21.0 38.0 18.3 16.6
Commercial 1.4 5.6 5.9 12.7 16.2 15.0 36.0 17.3 22.7
Demand Total 24.5
46.6
108.0
207.8
14.3
Indigenous
Production 27.2 49.3 95.6 136.9 10.6
Source: China Energy Statistical Yearbook 2017.

23
3.2 Background of stagnation in gas demand 2014–16
The stagnating natural gas consumption during the period 2014–16 was a manifestation of the
structural problems that beset China’s natural gas market; the factors that gave rise to the stagnation
provide crucial clues to understanding how the natural gas market may develop in the future. The
main factors to consider are as follows:
- Promoting the consumption of natural gas was originally adopted as a long-term energy
policy goal for several reasons, that included:
• optimization of the energy mix,
• ensuring a stable energy supply,
• environmental protection (to combat air pollution, global warming, and so on).
- Deregulation and revisions to the price adjustment system were continuously pursued by
the government with the long-term aim of creating a natural gas market governed by
market mechanisms.23
- The state of supply and demand for natural gas meant, however, that imports had to be
increased due to the shortage of indigenous gas production. Contrary to its long-term
policy of deregulation, the government was consequently forced, in the short and medium
term, to allocate supplies and to adjust prices by an extremely complex fashion in order to
deal with the gaps between prices relating to upstream/downstream domestic pricing and
pipeline gas/LNG import prices.
- The slump in demand between 2014 and 2016 appears to have been attributable in part
to the unsuccessful ‘comprehensive adjustments’ made in the context of the above.
Below, we will consider the situation at the time from the perspective of policy and prices.
3.2.1 Trends in natural gas and environmental policies: shortage of supply (around 2013)
As described in the previous chapter, coal-to-gas switching projects were pursued under the 12FYP
and a temporary shortage of supply occurred in 2013 (see section 2.4 for details). This was due to
insufficient supplies of domestically produced gas and led to a spike in LNG imports. Evidently,
however, quantitative adjustments were made on the domestic market by, for example, limiting
supplies of natural gas to specific sectors and sharing supplies between regions. In addition, price
adjustments had to be made when high-priced LNG imports increased.
3.2.2 Natural gas price reforms and changes in price competitiveness (2014–16)
Next, we consider the situation at the time from the point of view of the price competitiveness of
natural gas relative to competing fuels.
Firstly, focusing on the government’s policy on natural gas prices, a number of basic goals were
adopted during the 12FYP. These included:
1. developing a natural gas pricing mechanism that can reflect resource shortages and the
balance of supply and demand in the market,
23 In reality, however, it is very difficult for the government to promote deregulation of the natural gas market under the current
market environment – which is dominated by severe gas supply shortages. When we look at the confusion in the gas market in
winter 2017, we can easily understand that stable gas supplies would never be achieved by deregulation but only by the
application of government controls in terms of both supply volumes and prices.
More concretely, the gas supply had to be diverted from the south and the east to the northern regions and also from the power
generation and industrial sectors to the residential sector, by complex administrative adjustments. In such a situation, market
reforms and/or deregulation introducing market mechanism may simply increase the number of problems and the confusion.
Therefore, we can assume that the current government is promoting gas market reforms from the long-term point of view.

24
2. establishing natural gas pricing that can reflect a more reasonable relationship between
natural gas and alternative energies,
3. developing a rational price transmission mechanism extending from upstream to
downstream,
4. considering policy-led pricing – introducing a new price mechanism that could reduce
seasonal gaps in natural gas demand and/or special contracts to allow the interruption of
gas supplies.
The actual revisions made to natural gas prices are shown in Table 3.3. As can be seen, the Chinese
government raised the City Gate Price in July 2013 and September 2014 to address the shortage of
supply of natural gas and the high energy prices that were mainly due to high crude oil prices.
Regarding trends in the price of crude oil, on the other hand, the price per barrel began to decline
from above $100/bbl from around the fourth quarter of 2014. The following year it sank to between
$40/bbl and $50/bbl, and it then fell below $30/bbl in the first half of 2016. (In fact, the price of crude
oil began to fall immediately after the price of natural gas price had been increased.) Although the City
Gate price was subsequently revised in April 2015 (when the crude oil price was in a downward
phase) only to abolish the comparatively higher gas price paid by new users, the City Gas price
remained high and was not lowered until December 2015.
The changes in the price competitiveness of natural gas relative to competitor fuels are shown in
Table 3.3.
We consider firstly steam coal, which is a competitor to natural gas in the power generation and
industrial sectors. At this time, China’s coal industry was undergoing structural reforms, including the
closure of unprofitable coal mines. On the other hand, demand increased as the economy recovered
from the downturn precipitated by the bankruptcy of Lehman Brothers, and in 2010, the tight coal
supply and demand situation caused the price of coal to spike sharply. From 2012, however, the trend
was reversed and the price plunged24 as supply and demand for coal eased due to the slump in coal
demand resulting from the economic slowdown, changes in industrial structure, and also the problem
of excess production capacity.
The price of fuel oil,25 which competes with natural gas in industry and other sectors, followed largely
the same trend as that outlined for crude oil above. It thus headed downward from the fourth quarter
of 2014.
Thus, while steam coal and fuel oil prices were trending downward between 2014 and 2016, the price
of natural gas was not lowered until the end of 2015. The price competitiveness of natural gas against
these fuels consequently clearly worsened during this period, and this was undoubtedly one reason
for the slump in natural gas consumption, particularly in the power generation and industrial sectors.
Price competitiveness against other fuels is therefore an important factor to take into account when
considering future demand for natural gas.
24 The annual average price of Bohai Rim steam coal (5500k) decreased from 817 yuan/t in 2011to 703 yuan/t in 2012,
589 yuan/t in 2013, 523 yuan/ton in 2014, and 427 yuan/t in 2015. Source: CCRI (2016). 25 Annual average prices of imported fuel oil are quoted here because it was difficult to obtain information about domestic prices
of fuel oil.

25
Table 3.3: Price competitiveness of natural gas against competing fuels
Period Demand Beijing City Gate Price (yuan/m3)
vs Steam Coal*1
vs Fuel Oil*2
Brent ($/bbl)
Prior to July 2013 1.98 1.67 0.49 119.2
Jul. 2013 – Aug. 2014 Exist. 2.26 2.27 0.62
114.3 Incr. 3.14 3.15 0.87
Sep. 2014 – Mar. 2015 Exist. 2.66 3.01 0.77
102.5 Incr. 3.14 3.55 0.91
Apr. 2015 – Nov. 2015 2.70 3.74 1.44 54.2
Dec.2015 – Aug. 2017 2.00 2.78 1.42 44.7
After Sep. 2017 1.90 NA NA 54.2
Note: *1 Bohai Rim steam coal: Annual average price.Figures in the table are calculated by dividing natural gas
prices by the heat-equivalent price of coal. *2 Imported fuel oil prices: Annual average price. Figures in the table
are calculated by dividing natural gas prices by the heat-equivalent price of fuel oil.
Source: Beijing City Gate Price: NDRC; Steam coal price: China Coal Research Institute; Fuel oil price: World
Trade Atlas; Brent: BP, Statistical Review of World Energy, 2018.
3.3 Impact of measures against air pollution on natural gas supply and demand (2017–18)
Following the various developments outlined above, natural gas consumption has increased sharply
since 2017. This section reviews the changes in natural gas supply and demand and their
backgrounds.
3.3.1 Trends in supply and demand for natural gas in 2017–18
<Trends in 2017>
In 2017, natural gas consumption increased by 15.3 per cent from the previous year (see Table 3.4).
Domestic production, on the other hand, grew by only around 8.5 per cent and then imports surged by
27.6 per cent. A breakdown of imports reveals that there was markedly stronger growth in imports of
LNG (up 47.1 per cent) than of pipeline gas (up 9.4 per cent). On a monthly basis (see Table 3.5)
2017 saw very high growth in natural gas consumption from the spring in the off-season, followed by
a slowdown in growth in the winter. This appears to have been due to the constraints on supply
capacity described in a later section.
From the point of view of consumption, although there are considerable differences among the latest
statistical data,26 rough trends during the period can be observed as follows:
- A breakdown of consumption by sector, shown in Table 3.6, reveals double-digit growth in
all sectors except the use of natural gas as a feedstock in the chemical industry.
- In the city gas sector, strengthened action on air pollution caused rapid growth in
consumption for residential heating (considered in detail in the following section).
26 For example, the figures for natural gas consumption by sector shown below are considerably different from the data shown
in Table 3.4.
2016
(bcm)
2017
(bcm)
Growth rate
(yoy,%)
City Gas 72.9 93.7 28.5
Industrial 73.0 76.0 4.1
Power generation 36.6 42.7 16.7
Chemical feedstocks 25.3 26.2 3.5
Total 207.8 238.6 14.8
Source: PIP (2018).

26
- In the industrial sector, growth has been partly attributed to buoyant economic growth and
the improved price competitiveness resulting from a lowering of the natural gas price.
However, vigorous promotion of coal-to-gas switching for small boilers in the key cities
and regions appears to have been a major factor (details are described in chapter 2).
- The situation in the power generation sector was as follows. The rate of growth of total
electricity consumption was relatively high (6.5 per cent, see Table 3.7). Although this was
due at least in part to buoyant economic growth and growth in electricity consumption in
tertiary industry, observers have also noted that the replacement of coal by electricity,
together with the growth in electric vehicles, accelerated consumption in the consumer
sector.27 Electricity generated using natural gas rose by 7.7 per cent from a year earlier –
its highest rate of growth in the previous few years. Natural gas-fired thermal power
generation capacity increased to 75.7 GW in 2017, and the utilization rate simply based
on the total electricity generated was around 30 per cent (Table 3.8, 3.9).
- In the chemical industry, it is highly probable that growth (see Figure 3.6) was relatively
low owing to the restrictions placed on supply capability.
However, the unnaturally low rate of year-on-year consumption growth in December 2017 and
January/February 2018 described above is presumed to have been due to the constraints on supply
of natural gas. As already widely reported, supplies to some users were suspended and supply
volumes were reduced in the winter demand period. While it is extremely difficult to ascertain
quantitatively the extent to which consumption might have grown if there had been sufficient supply
availability, this is a crucial point to consider if reliable projections about the future are to be made.
Table 3.4: Supply and demand balance of natural gas (bcm)
2016 2017 Growth rate (yoy) (%)
2018 H1 Growth rate (yoy) (%)
Supply
Domestic Production 137.1 148.7 8.5 77.6 4.6
Imports 72.1 92.0 27.6 58.5 39.3
Pipeline gas 37.3 40.8 9.4 25.4 23.9
LNG 34.8 51.2 47.1 33.1 54.0
Total 209.2 240.7 15.1 136.1 17.1
Consumption 205.8 237.3 15.3 134.9 17.9 Source: ‘Monthly Overview on Natural Gas Market’, NDRC.
Table 3.5: Growth rate of monthly natural gas consumption (% over the same month of the
previous year)
Jan. Feb. Mar. Apr. May June July Aug. Sep. Oct. Nov. Dec.
2018 7.0 7.0 11.5 28.4 38.1 23.5 25.8 28.2 23.1 - - -
2017 1.3 11.0 18.9 21.6 18.5 27.0 23.6 30.2 24.5 21.3 10.6 0.2
Source: ‘Monthly Overview on Natural Gas Market’, NDRC.
Table 3.6: Natural gas consumption by sector (bcm/y)
2016 2017 Growth rate (yoy) (%)
City gas 78 89 14.2
Industrial 61 73 20.2
Power generation 38 47 22.9
Chemical feedstock 25 27 9.2
Note: Data for 2016 are estimated based on data for 2017.
Source: CNPC ETRI (Apr. 2018).
27 China Electricity Council (2018).

27
Table 3.7: Electricity consumption (TWh)
2013 2014
Growth
rate
(%)
2015
Growth
rate
(%)
2016
Growth
rate
(%)
2017
Growth
rate
(%)
Total 5,342.3 5,563.7 4.1 5,693.3 2.3 5,974.7 4.9 6,362.4 6.5
Industrial 4,663.4 4,870.1 4.4 4,964.8 1.9 5,167.6 4.1 5,492.3 6.3
Residential
& Commercial 678.9 693.6 2.2 728.5 5.0 807.1 10.8 870.3 7.8
Source: Basic data from China Electricity Council’s ‘Power Industry in China’.
Table 3.8: Generation volume by source (TWh)
2013 2014
Growth
rate
(%)
2015
Growth
rate
(%)
2016
Growth
rate
(%)
2017
Growth
rate
(%)
Total 5,372.1 5,604.5 4.3 5,739.9 2.4 6,022.8 4.9 6,417.9 6.6
Hydro power 892.1 1,060.1 18.8 1,112.7 5.0 1,174.8 5.6 1,194.5 1.7
Thermal power 4,221.6 4,227.4 0.1 4,230.7 0.1 4,327.3 2.3 4,551.3 5.2
Coal 3,980.5 3,951.0 –0.7 3,897.7 –1.3 3,945.7 1.2 4,149.6 5.2
Natural Gas 116.4 133.3 14.5 166.9 25.2 188.3 12.8 202.8 7.7
Oil 5.2 4.4 –15.1 4.2 –6.1 2.8 –33.0 NA NA
Nuclear 111.5 133.2 19.5 171.4 28.6 213.2 24.4 248.3 16.5
Wind 138.3 159.8 15.5 185.6 16.2 240.9 29.8 305.7 26.9
PV others 8.7 24.0 –15.1 39.6 64.8 66.7 68.2 118.2 77.3
Source: Basic data from China Electricity Council’s ‘Power Industry in China’.
Table 3.9: Power generation capacity (GW)
2013 2014 2015 2016 2017
Total 1,257.7 1,370.2 1,525.3 1,650.5 1,777.1
Hydro 280.4 304.9 319.5 332.1 343.6
Thermal 870.1 923.6 1005.5 1060.9 1104.9
Coal 795.8 832.3 900.1 946.2 981.3
Natural Gas 42.8 57.0 66.0 70.1 75.7
Oil 5.9 5.1 4.3 2.1
Nuclear Power 14.7 20.1 27.2 33.6 35.8
Wind 76.5 96.6 130.8 147.5 163.7
Solar 15.9 24.9 42.2 76.3 130.3
Source: Basic data from China Electricity Council’s ‘Power Industry in China’.
<Trends in the first half of 2018>
The trends set in 2017 continued into the first half of 2018. While year-on-year growth in domestic
consumption remained high at 17.9 per cent, domestic production grew by a relatively low 4.6 per
cent and imports of pipeline gas and LNG surged by 23.9 per cent and 54.0 per cent respectively
(Table 3.4). On a month-by-month basis (Table 3.5), there was strong year-on-year growth in

28
consumption even in the off-season. Information available from various sources as of the beginning of
August 2018 indicates that the following were having an impact:
- Demand for power appears to have been driven by buoyant growth in electricity demand,
which rose 9.4 per cent from a year earlier in the first half of 2018. This was due to two
main factors:
1. growth in industrial demand propelled by strong growth in industries such as
manufacturing (up 7.3 per cent) and IT (up 25.5 per cent),
2. strong growth in the commercial and residential sectors (up 13.2 per cent) due to the
cold spell at the start of the year and high temperatures from May onwards.28
On the electricity supply side, the poor performance of hydroelectric plants due to
drought, together with the closure of some ageing thermal power plants, also appear to
have contributed to a higher capacity factor for LNG power plants.29
- The buoyant economy drove growth in both industrial and commercial demand for natural
gas, with industrial demand in particular bouncing back from supply constraints in the
winter of 2017. Although more detailed observations and analysis are required, it also
appears possible that there was some increase in gas procurement for storage triggered
by the natural gas supply shortage the previous winter.
- As coal-to-gas boiler switching (for industrial use) has been promoted not only around
Beijing–Tianjin–Hebei, but also in key cities and regions across the country to combat air
pollution, this is likely to have buoyed natural gas demand during the off-season. LNG
road tanker demand is strong, as indicated by rising road tanker prices.
3.3.2 Impact of action on air pollution and the problem of gas shortages
As noted in the preceding chapter, measures against PM2.5 air pollution were stepped up in Beijing–
Tianjin–Hebei and the surrounding areas in 2017. Underlying this move was the high priority allocated
by the Xi administration to tackling environmental problems at the 19th five-yearly National Congress
of the Communist Party of China, in October 2017. Strong political pressure was exerted by the
administration throughout the duration of the 12FYP, and moves to strengthen environmental
measures appear to have permeated local government. Symbolic of this was the wave of dismissals
of local government heads who had failed to achieve environmental targets during the period covered
by the 12FYP.
Against this political backdrop, it began to be feared that PM2.5 targets would fail to be achieved in
Beijing and the surrounding area during the winter of 2017/18. Failure to achieve the target in 2017,
the final year of the Action Plan 2013, would undoubtedly have created a major problem politically,
and the barrage of measures taken against air pollution in Beijing–Tianjin–Hebei and the surrounding
areas in 2017 appears to have arisen from these political considerations.
Local governments responded by stepping up their own action against PM2.5 pollution. Concrete
measures such as coal-to-electricity and coal-to-gas switching projects were vigorously promoted,
and the effects of projects implemented consequently surpassed planned targets (as described in
subsection 2.4.4).
As these projects to phase out coal-fired industrial boilers and to increase the use of gas or electricity
instead of coal for residential heating were worked out in detail, and implemented at the district and
municipal levels, balancing the extra demand generated with gas and electricity supply capabilities
28 Source: Material submitted by China Electricity Council, 30 July 2018. 29 ‘Shortages of electricity supply occur in Zhejiang province and LNG demand in the power generation sector is increasing.
‘Interview with an expert on energy market, 3 August 2018.

29
over wide areas proved difficult at times. Below are some of the social problems that arose in central
and southern regions, as well as in northern China.
- In cold regions in the north, no natural gas was supplied and homes were left without
heating during the winter.
- Households were impoverished by the much higher cost of electricity compared to coal.
- Some factories had to temporarily shut down or shorten their operating hours due to gas
shortages.
- The soaring cost of LNG sold from road trucks severely affected some industrial users’
operations.
- Gas shortages led to drivers of CNG vehicles forming long queues at filling stations.
In response to such social problems, the NDRC published the following emergency measures to
secure natural gas supply in December 2017.30
- As of December 2017, indigenous gas production had already increased by 3.7 million
m3/day but a further 3.3 mcm/day were added to the production from January 2018.
- In the initial annual plan for LNG imports, 24.8 bcm (248 cargoes) had been scheduled to
be imported, during the winter season, a further 3.5 bcm (39 cargoes) were added to the
plan.
- Diversion of 14 mcm/day natural gas supply from the southern provinces such as
Guangdong, Fujian, and Zhejiang to the northern region had already been implemented
as of December 2017 and this was increased by 5 mcm/day.
- Natural gas supplies of 10 mcm/day to power generation plants were diverted to
residential use in the northern region, by starting emergency operation of coal-fired power
plants.
- Natural gas supplies of 15 mcm/day to the industrial sector were diverted to residential
use in the northern region, and also for feedstock in the chemical industry, from gas
supply companies such as CNPC, by reducing ‘own use’.
- Natural gas supply from underground storage was increased to 80 mcm/day, which was
30 per cent higher than the previous year.
In addition to these emergency measures, when natural gas supply shortages emerged as a
significant problem at the end of 2017, the central government began to demand that coal-to-gas
switching projects only be pursued once access to natural gas supplies had been secured.
Policies on air pollution such as the Winter Clean Heating (NDRC Dec.2017) and the Blue Sky
Action Plan (SCPRC Jun.2018) in fact stipulated that local governments should only pursue
measures having first secured supplies of natural gas, signalling a stronger recognition of the
importance of pursuing action against air pollution while avoiding natural gas supply shortages.
3.3.3 Outlook for full-year natural gas supply and demand in 2018
In light of this situation, let us briefly consider how natural gas supply and demand may unfold over
the course of 2018 as a whole.
Starting with consumption, expert opinion on the outlook for natural gas consumption varies extremely
widely (Table 3.10). Projections of the highest growth (around 15 per cent) appear to assume that
action on air pollution will cause the current growth trend to continue throughout the second half of
2018, while projections of low growth (not more than 10 per cent) appear to assume that supply and
30 Material submitted at NDRC’s Regular Press Conference on 18 December 2017.

30
demand adjustments will be made and consumption will be limited by constraints on the supply side.
What is certain, however, is that consumption in winter 2018/19 will at least be on a par with the high
level reached last year in regions where coal-to-gas switching is already complete, and this year plans
exist to convert another 4 million households from coal to gas.31 Consumption of gas has already
grown by at least 17.9 per cent in the first half of the year (compared with the previous year) and it
appears unlikely that growth will slow dramatically in the second half of the year.
Regarding the situation on the supply side, domestic production of natural gas in 2018 is expected to
grow by a record rate of about 8.5 per cent.32 Pipeline gas imports too are showing more robust
growth than in the previous year, and LNG imports remain high.
Assuming, then, that consumption in 2018 as a whole will grow to the maximum extent permitted by
supply,33 it will grow at a rate of between 15 and 16 per cent over the previous year. In reality,
therefore, it is highly likely that growth will settle down to a level not in excess of this rate.
Table 3.10: Various outlooks for natural gas consumption in 2018
Source Growth rate (yoy) (%) Published date
CNPC 10.5 Beijing, 4 April 2018
CNOOC 14.5 AGMF Beijing, 7 June 2018
IHS 9.0 Beijing, 6 June 2018
1st half of 2018 (Actual) 17.9 NDRC monthly statistics
3.4 LNG import trends
China’s first receiving terminal was Guangdong Dapeng LNG Terminal, which entered service in
2006. After that, terminals developed by China’s three state-owned oil majors (CNOOC, CNPC, and
SINOPEC) started operation and recently new entrants such as JOVO, ENN, and others have been
active in the terminal business. As of August 2018, China had 18 receiving terminals with a nominal
receiving capacity of around 60 mt/y (see Table 3.11).
Construction of LNG receiving terminals is overseen by the central government. It is pursued
systematically through various processes, including approval by NDRC, and receiving capacity has
grown steadily to date. LNG imports have risen in tandem with this growth in receiving capacity. As
previously noted, however, import growth slowed when natural gas consumption stalled in 2014–15,
and terminal capacity utilization has fallen to 50–60 per cent (see Figure 3.2 and Table 3.12).
Two new terminals entered operation in 2017 and four in 2018, and terminal capacity has grown by at
least 12 mt/y. This is another reason for the rapid growth in LNG imports since 2017.
China has thus grown to become the world’s second-largest importer of LNG after Japan. As imports
have grown, their role in the domestic natural gas market gas has changed. When LNG first began to
be imported, supplies of gas produced from LNG were limited to the provinces in which terminals
were located. However, as trunk pipelines have been developed to handle increased domestic output
and pipeline gas imports from Central Asia, LNG has evolved to play an important role in sustaining
natural gas supplies throughout China from the coast. During last year’s natural gas supply shortages
in Beijing–Tianjin–Hebei and the northern regions, for example, the situation was dealt with by both
increasing LNG imports in the south-east so that pipeline gas supplies to the north could be
temporarily boosted, and by transporting supplies from the south-east to the north by road tanker.
LNG has thus ceased to be used solely as a means of meeting demand in coastal regions.
As shown in Table 3.11, China’s LNG terminals can be divided into four regions, and regional trends
in LNG imports and terminal capacity utilization rates examined. Regarding, firstly, trends in LNG
31 Information published by the Ministry of Ecology and Environment. 32 Based on the outlook by the National Energy Administration as of May 2018. 33 The assumption of the maximum capacity is estimated based on 50 mt of LNG imports, 55 bcm/y of pipeline gas import
capacity, and 5% year-on-year growth of indigenous gas production. (For details, see chapter 4.)

31
imports (Table 3.13), the north saw strong growth of over 80 per cent throughout 2017 and the first
half of 2018. This was due to a combination of the increase in receiving capacity resulting from the
expansion of existing terminals and entry into operation of new terminals, together with rapid growth
in natural gas demand generated by active promotion of coal-to-gas switching projects. In the east,
growth appears to have been driven by growth in receiving capacity combined with increased road
tanker shipments to the north in the winter of 2017/18 and strong demand for power generation use
from 2017 to the first half of 2018. Growth in the south, on the other hand, was modest compared to
that in the north and east.
Table 3.11: LNG terminals as of 2020
Block Province City Main company Capacity (mt/y)
North
Liaoning Dalian CNPC 6.0
23.7
Hebei Tangshan CNPC 8.0
Tianjin Tianjin CNOOC 2.2
Tianjin SINOPEC 3.0
Shandong Qingdao SINOPEC 4.5
East
Jiangsu Rudong CNPC 6.5
19.1
Qidong GHE 1.6
Shanghai Shanghai CNOOC 4.5
Zhejiang Ningbo CNOOC 3.5
Zhoushan ENN 3.0
South
Fujian Putin CNOOC 4.5
22.0 Guangdong
Shenzhen Dapeng CNOOC 7.0
Dongguan JOVO 1.0
Zhuhai CNOOC 3.5
Yuedong CNOOC 2.0
Shenzhen CNOOC 4.0
Others Hainan Hainan CNOOC 2.0
5.0 Guangxi Beihai SINOPEC 3.0
Total 69.8
Source: Information published by terminal owners and others.
As for terminal capacity utilization (Table 3.14), rates rose dramatically in the north and east from
2016 to the first half of 2018. In the south, the utilization rate stayed comparatively high consistently
throughout this period, while utilization rates of ‘Other’ terminals (serving local markets) remained low
at 30–40 per cent.
Given the above trends, it is likely that supplies of indigenous production and pipeline gas/LNG
imports will be further optimized as pipelines and other supply infrastructure continue to expand; it is
expected that LNG can play a more important role in the natural gas market.
Table 3.12: LNG imports in China
Year 2010 2011 2012 2013 2014 2015 2016 2017
bcm 9.46 12.58 14.77 18.51 19.81 19.77 27.08 39.59
Source: GIIGNL ‘Annual Report’.

32
Table 3.13: Growth rate of LNG imports by region
Region 2017 (%) 2018 1stH (%)
North 86.3 81.4
East 71.3 73.9
South 9.4 17.3
Others 48.6 11.8
Total 48.1 53.7
Note: Regions divided by the following definition taking account of natural gas supply systems in China:
North: North of Shandong province;
East: Jiangsu, Shanghai, Zhejiang;
South: Fujian, Guangdong.
Source: Estimations based on Customs Statistics of China and Waterborne Trade Data.
Table 3.14: Utilization rate of LNG terminals by region
2016 (%) 2017 (%)
First half of 2018
(%)
North 57.4 80.5 82.7
East 62.8 87.2 110.0
South 77.7 79.4 72.0
Others 30.6 31.8 32.9
Total 63.6 77.2 82.1 Sources: Estimated based on Customs statistics of China and Waterborne Trade Data.
Figure 3.2: Historical data and outlook for LNG receiving capacity and utilization rate
Note: Left axis for terminal capacity and import (mt/year), Right axis for utilization rate of terminal (%).
Source: Import volumes are based on GIIGNL data, Utilization rates are estimated based on the import volume
and nameplate terminal capacity published in various sources.
0%
10%
20%
30%
40%
50%
60%
70%
80%
90%
100%
0
20
40
60
80
100
120
2010201120122013201420152016201720182019202020212022202320242025
Imports Terminal capacity Utlization Rate

33
4. Outlook for natural gas demand
4.1 Projections for long term natural gas supply and demand by various organizations
4.1.1 Projections and assumptions
Table 4.1 shows a comparison of the long-term projections made to date for natural gas consumption
in China. The purpose of this comparison is to explore the assumptions upon which these projections
are based. It is interesting to consider, for example, whether the projections made by CNPC at around
the time that the 13FYP was being drafted took national policies of this kind into account.
Investigating whether what is actually happening at the moment coincides with the national policies
and projections formulated in the past, should make it easier to predict what may happen in the future.
The figures in the tables below compare the main projections over time in this context, and are
intended to facilitate the reader’s understanding of the following sections.
Table 4.1: Outlooks for natural gas demand by various organizations (Bcm)
Source 2015 2016 2017 2020 2030
12th Five year plan 230
13th Five year plan*1 High
193.2 207.8 237.3
376
Middle 312
Action Plan to win Blue Sky*2 376
CNPC published in2010
High 318 438
Middle 297 392
Low 279 341
CNPC published in2014
High 334 541
Middle 298 454
Low 269 381
CNPC published in 2016
High 320 520
Middle 290 440
Low 260 370
CNPC published in 2018*3 400 600
Note: Data for 2015–17are actual consumption, except the 12FYP. *1 In the 13FTP, the target for natural gas
consumption is described as a share in total energy consumption from 8.3% to 10%. *2 In the document of the
Blue Sky Action Plan the share of natural gas in total primary energy is to be 10%. *3 The figure is not
described as ‘an outlook’ but as a ‘huge potential’.
Source: NDRC, CNPC

34
Table 4.2: Outlooks for natural gas supply by various organizations
Supply source Actual
The
Strategic
Plan*1
The
13FYP CNPC 2010
CNPC
2016
CNPC
2018
2015 2016 2017 2020 2020 2020 2030 2020 2030 2020 2030
Indigenous
production
Conventional 124 121 131 185 157
170 240 170 240
CBM 4.4 6.5 7 30 10
20 30 16 50
Shale 4.3 7.9 9 30 30
20 50 30 80
SNG 1 1.5 2 NA 10
10 20 4 20
Sub-total 134.6 137.1 148.7 207 210 300 220 340 220 390
Imports Pipeline gas 34 37 41
65 130 65 130
LNG 27 35 52
55 70 60 70
Sub-total 61 72 93 153 90 100 120 200 125 200
Total 194 209 242 360 300 400 340 540 345 590 Source: *1 Strategic Action Plan, NDRC, CNPC.
4.1.2 NDRC position document on establishing long-term stable natural gas supply system (April 2014)
This document on long-term natural gas supply arrangements was published by the NDRC in April
2014; its publication appears to have been intended to coincide with the natural gas supply shortages
caused in some regions by the additional demand from coal-to-gas switching projects. It deals with
the following goals:
- Achieving a natural gas supply capacity of 400 bcm/y (and, if possible, 420 bcm/y) by
2020.
- Securing supplies of gas for the residential sector, including gas for use by households,
public facilities, central heating services, local buses, and taxis.
- Replacement of coal-fired boilers with natural gas in the industrial sector.
- Preparing an action programme to meet the 112 bcm/y of natural gas demand expected
to be generated from coal-to-gas switching projects by 2020.
Specific measures described in the document include the following:
- On the supply side, the bolstering of policy support for the development of unconventional
natural gas resources such as shale gas.
- The implementation of coal-to-gas switching projects, having first ensured access to gas
resources.
- The expansion of gas storage capacity.
- The enhancement of arrangements to manage supply and demand for natural gas.
- The avoidance of ‘unplanned’ coal-to-gas switching projects and in particular the
tightening of controls on construction of new gas-fired power generation plants.
- The reform of the natural gas market – specifically the introduction of third-party access
(TPA) at pipelines and LNG terminals, together with development of the natural gas
pricing system.
It is therefore apparent that measures to deal with dislocations of the kind that occurred in the natural
gas market in 2017/18 had already been considered, and advice on their implementation circulated,
within the Chinese government, in 2014. Quantitative estimates of the additional demand for natural
gas generated by coal-to-gas switching projects also appear to have been calculated.

35
4.1.3 CNPC estimates of potential natural gas demand generated by coal-to-gas switching (2016)
Estimates produced by CNPC also provide useful information for projecting future natural gas
consumption. As noted, the additional natural gas demand generated by coal-to-gas switching
projects implemented to tackle air pollution is an extremely important factor to take into consideration
when estimating future consumption.
The results of an analysis of natural gas demand published by CNPC in 2016 are shown in Table 4.3.
These indicate that the potential additional demand for natural gas, generated by coal-to-gas
switching projects from 2016 to 2020, will reach 112 bcm. Industry will account for the largest portion
(47.3 per cent) of this total, followed by the power generation (36.7 per cent) and residential sectors
(16.1 per cent). Broken down by region (see Table 4.4), Beijing–Tianjin–Hebei, and Shandong will
account for 27.3 per cent, the Yangtze River Delta for 28.1 per cent, Guangdong for 11.3 per cent,
and other regions for 33.3 per cent. The amount of additional demand generated thus appears to be
correlated more with how much action is taken against pollution in urban areas than with natural gas
market size. In addition, it should be noted that these estimates are based on projects implemented
up to 2020, and it is also estimated that an additional 160 bcm of demand will be generated if similar
measures continue to be implemented between 2020 and 2025.
Table 4.3: Additional natural gas demand generated by coal-to-gas switching projects (From
2016 to 2020)
Year Sector Use bcm Region bcm
2016–20
Power generation
CCGT etc. 41 (36.7%)
Beijing–Tianjin–Hebei/ Shandong
11.2
Yangtze River Delta 12.4
Guangdong 5.0
Others 12.7
Industrial
Gas CHP 53 (47.3%)
Beijing–Tianjin–Hebei/ Shandong
14.0
Yangtze River Delta 11.9
Gas-fired boiler Guangdong 7.1
Others 20.0
Residential heating
Gas CHP
18 (16.1%)
Beijing–Tianjin–Hebei/ Shandong
5.6
Yangtze River Delta 7.3
Gas-fired Boiler Guangdong 0.6
Others 4.8
Total 112.0
2020–25 Total 160.0
Source: CNPC (2016), ‘China’s Natural Gas Market Overview’.

36
Table 4.4: Share of region regarding additional natural gas demand generated by coal-to-gas
switching projects
Region Additional natural gas demand generated by coal to gas switching (%)
Natural Gas consumption in 2016 (%)
Beijing–Tianjin–Hebei/Shandong 27.3 19.5
Yangtze River Delta 28.1 18.2
Guangdong 11.3 8.1
Others 33.3 54.2
Source: Natural gas demand by coal to gas switching; based on the amount described in Table 4.3
Natural gas consumption in 2016; China Energy Statistical Yearbook 2017.
4.1.4 Key figures in the Winter Clean Heating plan in the northern area
Next, we explain in outline the figures contained in the Winter Clean Heating (2017–21) plan,
promulgated in December 2017, that are relevant for estimating future natural gas demand.
The purpose of this plan is to reduce emissions from winter heating systems in 14 northern provinces
and part of Henan. Coal-fired appliances provided 83 per cent of all heating in these regions in 2016,
and environmentally friendlier energies (including clean coal) accounted for only 33 per cent of the
total area of the spaces which are required to be heated (the ‘heating area’). This ‘clean’ heating area
is to be expanded to meet the targets (shown in Table 4.5) by 2021, and this will be achieved mainly
by phasing out the use of ‘dirty’ low-grade coal and using natural gas, electricity, geothermal
resources, biomass, solar energy, power generated from waste, nuclear power, and clean coal
instead. Beijing–Tianjin–Hebei and surrounding areas (in other words, the ‘2+26’ region) are
designated as the key regions from the point of view of PM2.5 emissions, and the ways in which they
have moved towards switching from coal to gas and electricity are identified as being the main
measures to be used in reducing emissions in these regions.
We first summarize the northern region’s characteristics in terms of natural gas consumption. Table
4.6 shows the heating area (in billions of square metres) in which gas is presently used, together with
the gas consumption of the northern region in 2016. As the total heating area of this region is
20.6 bm2, the area in which gas heating is presently used (2.2 bm2) represents a comparatively small
10.7 per cent. The total gas consumption of the northern region, on the other hand, accounts for 47.9
per cent of the Chinese total. It is thus a heavy consumer of natural gas compared with other regions.
Heating accounts for 26 per cent of this natural gas consumption, and industrial, power generation,
and transportation sectors are also assumed to consume considerable amounts.
Next, we consider the distinguishing features of the ‘2+26’, designated as the key regions under this
plan. As this region was selected for priority implementation of measures to lower PM2.5 levels from
around 2016, it sheds light on possible future directions in natural gas consumption. The total heating
area of this region comes to 5 bm2, which corresponds to 24.3 per cent of the northern region. The
gas heating area (1.24 bm2) covers 24.8 per cent of this area, which is high compared with other parts
of the northern region.
The ‘2+26’ region accounts for large proportions of both total gas consumption (42.2 per cent) and
consumption for heating use (61.8 per cent) in the northern region. In addition, total natural gas
consumption by the ‘2+26’ region accounts for 20.3 per cent of the Chinese total. Beijing, Tianjin,
Hebei and the surrounding areas (where action on air pollution has been stepped up) thus constitute
about one fifth of the entire market for natural gas in China.
The specific measures available in the key ‘2+26’ region under the Winter Clean Heating plan are
shown in Table 4.7. It can be seen that implementing these measures would generate 23 bcm/y of
additional natural gas demand in the key ‘2+26’ region as a whole. For regions other than the ‘2+26’
region, on the other hand, the plan allows a choice of clean heating measures according to the
availability of alternative energies (including natural gas), and no explicit figures are given regarding
how much natural gas demand would be generated. Judging from statistics for 2016, however, the

37
fact that non-‘2+26’ regions account for more than 75 per cent of the total heating area and 58 per
cent of total natural gas consumption in the north as a whole, suggests that the amount of additional
natural gas demand that they will generate is unlikely to be negligible.34 As this demand will depend
on the timing and extent of action on air pollution – including the extent of development of the natural
gas supply infrastructure and natural gas supply capacity – the quantities involved cannot feasibly be
estimated in further detail at present.
Another interesting aspect of this plan is its inclusion of figures on volumes of supply of natural gas to
the six provinces (Beijing, Tianjin, Hebei, Shandong, Henan, and Shanxi) that encompass the ‘2+26’
(Table 4.8). According to these figures, there are plans for 124 bcm/y of natural gas to be supplied to
the six provinces in 2021. Natural gas consumption in the region came to 51.4 bcm/y in 2016. If
124 bcm/y is to be supplied, therefore, the increase in this five-year period will be 72.6 bcm/y.
Consequently, it can be assumed that in addition to a little over 23 bcm/y of additional demand for
clean heating in the residential sector,35 the power generation, industrial, and transportation sectors
are expected to generate considerable additional demand. Given also the amount of potential
demand (estimated by CNPC in 2016) that will be generated by coal-to-gas switching projects in each
region, as indicated in Table 4.4, it is estimated that the six provinces’ share of the total will be
approximately 38 per cent. Based on this figure, natural gas demand in the whole of China in 2021
will come to 399bcm/y.36
Table 4.5: The targets of the Winter Clean Heating Plan in the northern area
Targeted Region 2019 2021 Reference
Northern area total
Rate of Clean Heating >50% >70%
Reduction of low-grade coal
74 mt 150 mt
‘2+26’ area
Urban area >90% 100%
Full-phase out of coal-fired boilers less than 35 t/h
Suburban area >70% >80%
Full-phase out of coal-fired boilers less than 20 t/h
Rural area >40% >60%
Other than ‘2+26’ area
Urban area >60% >80%
Full-phase out of coal-fired boilers less than 20 t/h
Suburban area >50% >70%
Full-phase out of coal-fired boilers less than 10 t/h
Rural area >20% >40%
Source: Winter Clean Heating
34 As quantitative targets of gas demand are described only for the ‘2+26’ regions in the plan, there is quite a large amount of
additional potential gas demand in the non-‘2+26’ regions. 35 As 23 bcm/y is the demand for just the urban area of the ‘2+26’, additional demand for the rural area of the ‘2+26’ and the
south part of Henan province should be added to give the total demand of the six provinces. 36 See the figure given in note 3 of Table 4.10: 399 bcm is the gas demand in 2021 and it is calculated by the same method as
that described in note 3.

38
Table 4.6: Heating area (in which gas is currently used) and gas consumption in the targeted regions
Region
Heating area currently served by gas
Natural gas consumption as of 2016
bm2 Share in northern region
Consumption Heating
(bcm/y)
Share in northern region
Consumption Total
(bcm/y)
Share in northern region
Share in China total
Northern overall 2.2 100% 25.9 100% 99.6 100% 47.9%
6 Provinces 1.4 63.6% 18.5 71.4% 51.4 51.6% 24.7%
‘2+26’
Urban area
1.18 53.6% 15.1 58.3%
Rural area
0.6 27.3% 0.9 3.4% -
Total 1.24 56.4% 16.0 61.8% 42.1 42.2% 20.3%
Note: Total heating area of northern region is 20.6 bm2 (urban area 14.1 bm2, rural area 6.5 bm2). Natural gas
consumption of China total in 2016 was 207.8 bcm/y. Source: Winter Clean Heating.
Table 4.7: Targets and natural gas demand for natural gas heating systems in the ‘2+26’
Means
Actual result in 2016 Targets by 2021
Heating area
(bm2)
Gas consumption
(cm/y)
Share (%)
Target Additional Gas demand
(bcm/y)
Share (%)
Gas cogeneration 0.22 6.4 40.0% 110MW 7.5 32.6%
Gas-fired boilers 0.82 7.6 47.5% 50,000 t/h 5.6 24.3%
Wall-hung gas-fired boilers
0.2 1.9 11.9% 12 million households
9.0 39.1%
Distributed gas systems 0.003 0.1 0.6% 12MW 0.9 3.9%
Total 1.24 16.0 - 23.0 *1 Note: *1 Additional gas demand; 14.5bcm/y in urban area and 8.5bcm/y in rural area Source: Winter Clean Heating
Table 4.8: Targets for natural gas supply in 6 provinces as of 2021
Natural gas supply (bcm/y)
NOC 3 majors 103
Other than 3 NOCs 11
Total 124
Emergency gas storage capacity (mcm)
Beijing 170
Tianjin 120
Hebei 210
Shandong 230
Henan 160
Shanxi 140
Total 1,030 Source: NDRC
4.1.5 Subsidies to promote use of natural gas under air pollution measures
Lastly, we focus on the economic feasibility of coal-to-gas switching projects, which is a key factor to
consider in estimating future natural gas demand.
Table 4.9 outlines the subsidies that are available for switching from coal to gas for residential
heating. Although not shown in the table, subsidies are also provided by local governments to help

39
cover the equipment and installation costs37 incurred by converting industrial coal-fired boilers to run
on natural gas. These subsidies are funded in part by the central government, which provides
financial support to provinces to help them tackle air pollution.38
Steps are thus being taken to reduce the financial burden faced by ordinary citizens and users, and
subsidization of gas prices will likely have a major impact on future natural gas consumption. In
Tianjin, for example, the price of gas for residential users is 2.4 yuan/m3, of which half (1.2 yuan/m3) is
subsidized; while in Jinan and Shandong, one third (1 yuan/m3) of the price (3 yuan/m3) is
subsidized.39 Residential users in these regions thus effectively pay 1.2 yuan/m3 ($4.9/mmbtu) and
2 yuan/m3 ($8.2/mmbtu) for their gas during the winter season.40 In both cases, a negative margin
between the price paid by users and the cost of supply of imported LNG is highly likely.
Table 4.9: Subsidy for using natural gas for residential heating
Object Contents
Piping & Appliance /Facility
Pipework Subsidy of 3,000–6,000 yuan/household (441–882 $/household *1 is provided for pipe laying and pipework by local governments. The amount of subsidy differs among provinces.
Appliance & facility
Subsidy of 2,000–6,000 yuan/household (294–882$/household *1 is provided for payments of appliance/facility and installation by local governments. The amount of subsidy differs among provinces.
Payment for gas tariffs
During winter season, subsidy of 1.0–1.4 yuan/m3(4.1–5.7 $/m3) is provided for gas tariffs by local governments. The subsidy is applied to the amount used within the upper ceiling of around 1,000–1,200 m3/year. The amount of subsidy and upper ceiling differs among provinces.
Note: *1 Calculated by exchange rate of 6.8 yuan/$.
Source: Notification documents issued by local governments.
4.2 Discussion on outlook for medium-term natural gas consumption (up to 2020)
4.2.1 Approach to projecting natural gas consumption
Next, we consider the outlook for natural gas consumption by 2020 in light of the above information.
We start with the 13FYP, which forms the basis of national policy, and the current Blue Sky Action
Plan. These provide a guide to the level of natural gas consumption in 2020 by stipulating that natural
gas should account for 10 per cent of energy consumption in 2020. The first question is: to what
extent (if any) do these plans take account of the over 15 per cent year-on-year growth in natural gas
consumption that occurred in 2017–18 and the measures against air pollution that are actually being
implemented? Let us consider, therefore, how much natural gas will be consumed if all policies and
measures (including all coal-to-gas switching projects) are implemented as planned.
Table 4.10 summarizes the key data needed to answer this question. The relevant details presented
in the preceding section are summarized below.
- The quantitative implications of the coal-to-gas switching projects currently underway had
already been calculated as of 2014. These calculations indicate that 112 bcm/y of
additional demand will be generated and that 400–420 bcm/y of natural gas supply will
therefore be required if these projects are to be implemented as planned.
37 As for industrial users, it is unclear whether subsidies for gas tariffs are provided or not, but it was reported that such
subsidies are applied to some users. Source: Interviews with energy experts in China, June 2018. 38 In 2017, around 16 billion yuan was distributed from the Ministry of Finance to local provinces as spending for
countermeasures against air pollution. 39 As of the end 2017. Gas tariffs described here are the lowest prices in the household rate sheet. Source: Materials published
by local governments. 40 It is reported that such subsidies will continue to be provided at least until 2020.

40
- CNPC’s 2016 outlook subsequently largely confirmed these figures and provided details
of coal-to-gas switching by region and sector.
- The potential demand of 400 bcm/y estimated in CNPC’s 2018 outlook coincides with
these figures.
- Regarding specifically the switching of coal-fired boilers to natural gas, which is a prime
means of replacing coal with gas, the natural gas demand generated by the coal-fired
boiler conversions called for by the 13FYP (45 bcm) largely matches the natural gas
demand generated by the industrial coal-to-gas projects outlined in CNPC’s 2016 outlook
(53 bcm).
- Lastly and importantly, coal-to-gas switching projects will, as CNPC’s 2016 outlook
indicates, continue to generate considerable additional demand in the years leading up to
2025 (160 bcm as shown in Table 4.3, and the evidence suggests that action will continue
to be expanded from 2020 onward).
From the above, it may be presumed that the target figure of 400 bcm/y set for 2020 represents the
amount of natural gas demand that will be generated if coal-to-gas projects are implemented as
originally planned. The focus of interest moving forward, then, should be on the extent to which these
plans are actually implemented and at what pace. The key question here is: to what extent will natural
gas supply capacity expand as described above?
Table 4.10: Key data to predict natural gas demand by 2020
Published
year/month Category of target
Amount of
natural gas
(bcm/y)
NDRC position document 2014/4
Supply capacity 400–
420
Demand generated by coal-to-gas
switching 112
13FPY 2016
8.3–10% share in total primary energy 312–
372
Generated by coal-to-gas switching of
coal-fired boilers in key regions *1 45
Blue Sky Action Plan 2018/7 10% share in total primary energy 372
Outlook by CNPC (2016) 2016/11
Total consumption – Mid case 290
Potential additional
demand by coal-to-gas
*2
Total 110
Industrial 53
Outlook by CNPC (2018) 2018/4 Potential demand 400
Winter Clean Heating 2017/12 Estimates of total consumption *3 350–
392-
Note: *1 Coal-to-gas switching projects are to be promoted in key regions of Beijing–Tianjin–Hebei, Yangtze
River Delta, Pearl River Delta, and North-east area. The target amount of coal-fired boilers is 1,890 thousand t/h
and additional natural gas demand is estimated to be 45 bcm/y. *2 See details in section 4.1.3.
*3 Total gas demand in 2020 is estimated to be 392 bcm/y if we calculate based on the gas supply of 124 bcm/y
to 6 Provinces in 2021 and its share in total Chinese gas demand. And if we calculate based on the increased
natural gas demand of 72.6 bcm/y (from 2016 to 2021) and its share of gas demand generated by coal-to-gas
switching in that of Chinese total (see Table 4.3), the total gas demand in China in 2020 is estimated to be
350 bcm/y.
Source: Materials described in the previous sections

41
Table 4.11: Scenarios for natural gas consumption by 2020
Case Natural gas demand in 2020
(bcm/y) Annual growth rate from 2016
Maximum
Coal-to-gas switching 400 17.8%
10% share in total primary
energy 372 15.7%
Medium
Coal-to-gas switching 330 12.3%
Minimum
Coal-to-gas switching 300 9.6%
Note: The growth rate in 2017 was 15.1% and in 1H of 2018 was 17.9%. Source: Authors’ estimates.

42
5. Outlook for medium-term LNG demand and impact on the international market
Finally, let us consider the LNG demand outlook and the consequences for the international LNG
market. LNG demand is basically defined by subtracting the supply volume of pipeline gas from total
natural gas consumption. As natural gas consumption was considered in the previous chapter, we
begin here by considering the volume of supply of pipeline gas (domestic production and pipeline gas
imports).
5.1 Outlook for indigenous natural gas production
Due to difficulties in projecting the upstream development and production of national gas (from both a
technological standpoint and given the trends in investment by suppliers), we adopt a simplified
approach to estimating output, taking into account current trends based on plans and projections
published by the government and other relevant agencies (see Table 4.2). As previously indicated,
natural gas production in China is being expanded by the development of unconventional resources
(such as CBM and shale gas) as well as conventional resources. As the latest five-year plan sets
production targets for these resources, these are taken into consideration in the following review.
Regarding, firstly, conventional resources, these exist in abundance41 and output is largely trending
upward. Recently, however, there has been an incontrovertible slowing of growth in conventional
output. The data on supply and demand for natural gas since 2010 also indicates that, except during
the temporary slump in demand in 2014–15, gas has tended to be in short supply during the demand
season. This being the case, it is unlikely that conventional domestic output will increase dramatically
to keep pace with the current double-digit growth in natural gas consumption. Moreover, output
appears highly likely to fall short of the production targets and/or projected volume for 2020 shown in
Table 4.2.
As for coalbed methane (CBM), the 12FTP set a production target of 16 bcm/y in 2015. In reality,
however, output fell short of this target and only reached approximately 4.4 bcm/y.42 Nevertheless,
according to the National Bureau of Statistics, output increased to 6.48 bcm/y in 2016, and grew
further by 8.2 per cent to 7.02 bcm/y in 2017.43 For comparison, the 13FYP set a target of 10 bcm/y in
2020. Production is subsidized by the government due to its high cost. This subsidy was raised from
0.2 yuan/m3 to 0.3 yuan/m3 in March 2016, and is set to continue until 2020.
Considering next shale gas, actual output in 2015 reached 4.3 bcm/y compared to a target under the
12FYP of 6.5 bcm/y. While the 13FYP sets a production target for 2020 of 30 bcm/y, actual output
came to 7.9 bcm/y44 in 2016 and 9 bcm/y45 in 2017. As in the case of CBM, production costs are high
and production is subsidized by the government. The subsidy was 0.4 yuan/m3 until 2015 and
0.3 yuan/m3 between 2016 and 2018, and will be 0.2 yuan/m3 between 2019 and 2020.46
Output of unconventional natural gas will thus probably struggle to reach the 2020 target set by the
13FYP, and is extremely unlikely to exceed this target by any significant amount.
41 Recoverable natural gas resources are: 50 tcm of conventional gas, 22 tcm of shale gas and 12.5 tcm of CBM. Source:
Development Research Center of State Council, 6th Asian Gas Market Forum, 7 June 2018. 42 Materials published by National Energy Administration. 43 Interfax, 23 January 2018. 44 Ministry of Land and Resources, February 2018. 45 Reuters, 17 April 2018. 46 Bloomberg, 29 April 2015.
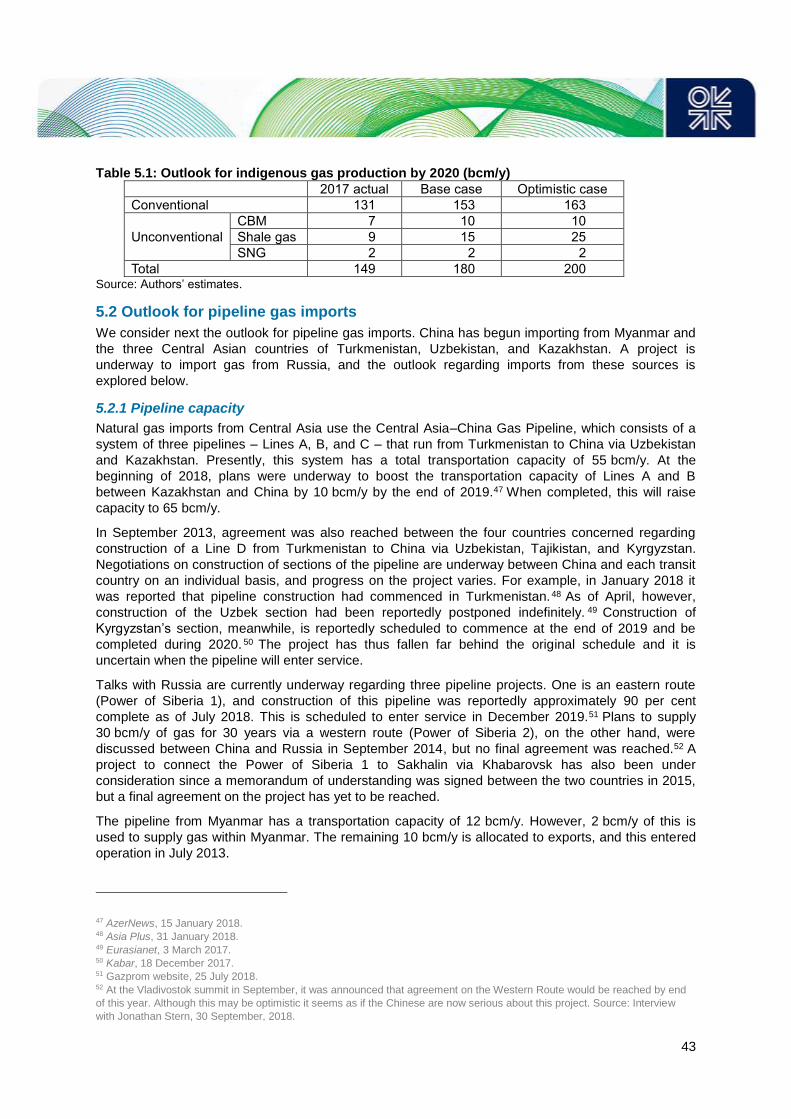
43
Table 5.1: Outlook for indigenous gas production by 2020 (bcm/y)
2017 actual Base case Optimistic case
Conventional 131 153 163
Unconventional
CBM 7 10 10
Shale gas 9 15 25
SNG 2 2 2
Total 149 180 200 Source: Authors’ estimates.
5.2 Outlook for pipeline gas imports
We consider next the outlook for pipeline gas imports. China has begun importing from Myanmar and
the three Central Asian countries of Turkmenistan, Uzbekistan, and Kazakhstan. A project is
underway to import gas from Russia, and the outlook regarding imports from these sources is
explored below.
5.2.1 Pipeline capacity
Natural gas imports from Central Asia use the Central Asia–China Gas Pipeline, which consists of a
system of three pipelines – Lines A, B, and C – that run from Turkmenistan to China via Uzbekistan
and Kazakhstan. Presently, this system has a total transportation capacity of 55 bcm/y. At the
beginning of 2018, plans were underway to boost the transportation capacity of Lines A and B
between Kazakhstan and China by 10 bcm/y by the end of 2019.47 When completed, this will raise
capacity to 65 bcm/y.
In September 2013, agreement was also reached between the four countries concerned regarding
construction of a Line D from Turkmenistan to China via Uzbekistan, Tajikistan, and Kyrgyzstan.
Negotiations on construction of sections of the pipeline are underway between China and each transit
country on an individual basis, and progress on the project varies. For example, in January 2018 it
was reported that pipeline construction had commenced in Turkmenistan.48 As of April, however,
construction of the Uzbek section had been reportedly postponed indefinitely. 49 Construction of
Kyrgyzstan’s section, meanwhile, is reportedly scheduled to commence at the end of 2019 and be
completed during 2020. 50 The project has thus fallen far behind the original schedule and it is
uncertain when the pipeline will enter service.
Talks with Russia are currently underway regarding three pipeline projects. One is an eastern route
(Power of Siberia 1), and construction of this pipeline was reportedly approximately 90 per cent
complete as of July 2018. This is scheduled to enter service in December 2019.51 Plans to supply
30 bcm/y of gas for 30 years via a western route (Power of Siberia 2), on the other hand, were
discussed between China and Russia in September 2014, but no final agreement was reached.52 A
project to connect the Power of Siberia 1 to Sakhalin via Khabarovsk has also been under
consideration since a memorandum of understanding was signed between the two countries in 2015,
but a final agreement on the project has yet to be reached.
The pipeline from Myanmar has a transportation capacity of 12 bcm/y. However, 2 bcm/y of this is
used to supply gas within Myanmar. The remaining 10 bcm/y is allocated to exports, and this entered
operation in July 2013.
47 AzerNews, 15 January 2018. 48 Asia Plus, 31 January 2018. 49 Eurasianet, 3 March 2017. 50 Kabar, 18 December 2017. 51 Gazprom website, 25 July 2018. 52 At the Vladivostok summit in September, it was announced that agreement on the Western Route would be reached by end
of this year. Although this may be optimistic it seems as if the Chinese are now serious about this project. Source: Interview
with Jonathan Stern, 30 September, 2018.
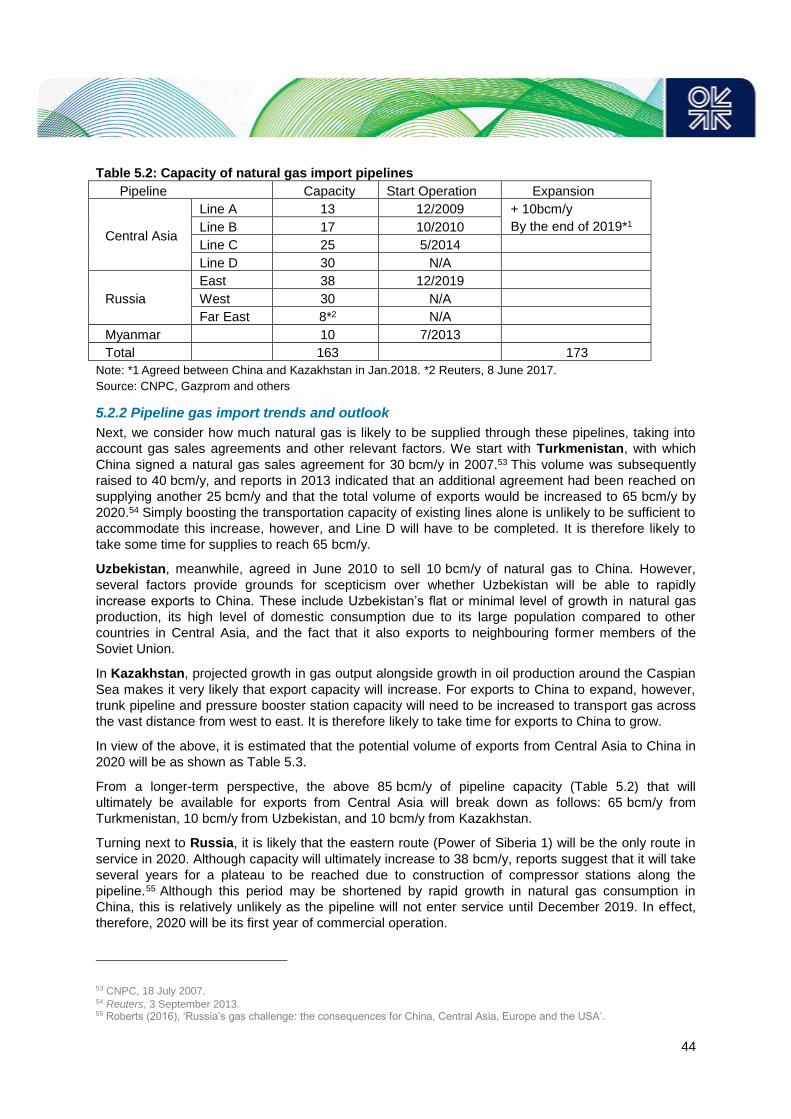
44
Table 5.2: Capacity of natural gas import pipelines
Pipeline Capacity Start Operation Expansion
Central Asia
Line A 13 12/2009 + 10bcm/y
By the end of 2019*1 Line B 17 10/2010
Line C 25 5/2014
Line D 30 N/A
Russia
East 38 12/2019
West 30 N/A
Far East 8*2 N/A
Myanmar 10 7/2013
Total 163 173
Note: *1 Agreed between China and Kazakhstan in Jan.2018. *2 Reuters, 8 June 2017.
Source: CNPC, Gazprom and others
5.2.2 Pipeline gas import trends and outlook
Next, we consider how much natural gas is likely to be supplied through these pipelines, taking into
account gas sales agreements and other relevant factors. We start with Turkmenistan, with which
China signed a natural gas sales agreement for 30 bcm/y in 2007.53 This volume was subsequently
raised to 40 bcm/y, and reports in 2013 indicated that an additional agreement had been reached on
supplying another 25 bcm/y and that the total volume of exports would be increased to 65 bcm/y by
2020.54 Simply boosting the transportation capacity of existing lines alone is unlikely to be sufficient to
accommodate this increase, however, and Line D will have to be completed. It is therefore likely to
take some time for supplies to reach 65 bcm/y.
Uzbekistan, meanwhile, agreed in June 2010 to sell 10 bcm/y of natural gas to China. However,
several factors provide grounds for scepticism over whether Uzbekistan will be able to rapidly
increase exports to China. These include Uzbekistan’s flat or minimal level of growth in natural gas
production, its high level of domestic consumption due to its large population compared to other
countries in Central Asia, and the fact that it also exports to neighbouring former members of the
Soviet Union.
In Kazakhstan, projected growth in gas output alongside growth in oil production around the Caspian
Sea makes it very likely that export capacity will increase. For exports to China to expand, however,
trunk pipeline and pressure booster station capacity will need to be increased to transport gas across
the vast distance from west to east. It is therefore likely to take time for exports to China to grow.
In view of the above, it is estimated that the potential volume of exports from Central Asia to China in
2020 will be as shown as Table 5.3.
From a longer-term perspective, the above 85 bcm/y of pipeline capacity (Table 5.2) that will
ultimately be available for exports from Central Asia will break down as follows: 65 bcm/y from
Turkmenistan, 10 bcm/y from Uzbekistan, and 10 bcm/y from Kazakhstan.
Turning next to Russia, it is likely that the eastern route (Power of Siberia 1) will be the only route in
service in 2020. Although capacity will ultimately increase to 38 bcm/y, reports suggest that it will take
several years for a plateau to be reached due to construction of compressor stations along the
pipeline.55 Although this period may be shortened by rapid growth in natural gas consumption in
China, this is relatively unlikely as the pipeline will not enter service until December 2019. In effect,
therefore, 2020 will be its first year of commercial operation.
53 CNPC, 18 July 2007. 54 Reuters, 3 September 2013. 55 Roberts (2016), ‘Russia’s gas challenge: the consequences for China, Central Asia, Europe and the USA’.

45
Regarding lastly Myanmar, a 30-year gas sales agreement was signed in December 2008 between
CNPC and a consortium (consisting of Myanmar Oil and Gas Enterprise, Daewoo of South Korea,
and ONGC and GAIL of India) formed to develop the Shwe gas field off the coast of Myanmar,56 and
actual gas exports commenced in 2013. The Shwe gas field currently produces about 5 bcm/y and
exports over the past few years have remained at around 3.1 bcm/y, which is below the contracted
volume (4.1 bcm/y). Given production plans for this gas field, it is unlikely that exports will increase to
the point that they reach the pipeline capacity limit, and there are no reports of additional exports from
neighbouring gas fields. It is therefore highly likely that exports from Myanmar will remain at around
2–5 bcm/y for the time being.
Table 5.3: Outlook for pipeline gas imports (bcm/y)
Country 2020 Long-term outlook
Turkmenistan 35–45 65
Uzbekistan 5 10
Kazakhstan 5 10
Russia 6 68+
Myanmar 4 10–
Total 55–65 163 Source: Figures for 2020 are estimated by author. Long-term outlook is based on various materials.
5.3 Outlook for LNG demand
5.3.1 Capacity of LNG receiving terminals and LNG imports
As stated above, China had 19 LNG receiving terminals in operation as of August 2018, and these
have an annual receiving capacity of approximately 59.6 million tons. Looking ahead to 2020,
capacity generated by the new terminals entering service, combined with the construction of tanks at
currently operational terminals, will raise receiving capacity to around 69–70 mt/y (see chapter 3).
Considering next the upper limit on the volume of LNG imports, there are several uncertainties to bear
in mind:
The LNG receiving capacities indicated in Figure 3.2 and Table 3.11 represent the nominal
capacities published by terminal operators. If the capacity utilization rate is calculated on the
basis of these capacities, it is possible that terminals may actually operate at a rate exceeding
100 per cent.57
As previously noted, if terminals are used to serve closed regional markets such as Hainan
Island, for example, it will be impossible for them to receive more than the amount of demand
in the regional market.
Similarly, it is possible that without sufficient development of the pipeline network, receiving
capacity may be limited by demand-side constraints.58
Nominal receiving capacity is thus subject to both positive and negative factors. However, given that
receiving terminals were operating at near full capacity in the first half of 2018 and overall terminal
56 Source: CNPC. Note: Currently the members of the consortium are POSCO DAEWOO 51%, ONGC 17%, MOGE 15%, KOGAS 8.5%, GAIL 8.5%. 57 Annual terminal capacity is basically determined by how many times the storage tanks can be used (namely how much LNG
can be withdrawn and/or consumed during a certain period) and/or how many times the berth can be used for unloading LNG
annually. Therefore, it should be noted that actual handing volumes can differ considerably even if storage tank capacities and
the number of berths are the same. But, we assume here that the nameplate capacity published by the terminal owners is
estimated by taking account of their operation. 58 As described in the previous footnote, the receiving capacity of each terminal will be determined by how quickly the natural
gas produced from the LNG will be absorbed in regional markets. In relation to this point, it should be noted that
unprecedentedly large amount of LNG are being sent out from receiving terminals by road tankers at present, due to insufficient
pipeline supply networks.

46
capacity utilization came to approximately 82 per cent, the capacity utilization rate will probably
remain at around 85 per cent even if pushed up by infrastructure development. 59 Based on this
assumption, the upper limit on LNG imports in 2020 is estimated to be around 60 mt.
5.3.2 Observations on the LNG demand outlook
Then, let us consider the outlook for LNG demand in 2020. As described in the previous chapters, the
following two key assumptions can be made:
- The 13FYP and various other energy and environmental policies announced by the
government and other agencies suggest that natural gas consumption in 2020 is
estimated to be between 300 and 400 bcm/y.
- The volume of pipeline gas supply (domestic natural gas output plus pipeline gas imports)
is very likely to enter the 240–260 bcm/y range.
Calculating LNG demand (required volume) under four consumption scenarios and two pipeline gas
supply scenarios based on the above assumptions yields the results shown in Table 5.4.
This clearly shows that it will be virtually impossible to meet projected demand under the ‘(A)
maximum coal-to-gas switching’ and ‘(B) 10 per cent share of primary energy’ scenarios due to
constraints on LNG receiving terminal capacity.
Under the ‘(C) intermediate coal-to-gas switching’ scenario, around 66 mt of LNG will be required if
the supply of pipeline gas is low. As this exceeds the upper limit on LNG imports indicated above, it is
highly uncertain whether this will be attainable. In the remainder of the scenarios, receiving capacity
will be physically sufficient to handle the required volumes of LNG imports.
Based on the above, the LNG demand outlook for 2020 may be summarized as follows:
- If coal-to-gas switching projects and other measures against air pollution are implemented
to the maximum practical extent (insofar as permitted by natural gas supply
commitments), the maximum physically receivable volume of LNG will need to be
imported to meet demand for LNG. Given the amount of receiving terminal capacity
available, this maximum is estimated to be in the region of 60 mt/y. However, this
physically limited amount may fluctuate as indicated in footnote 57.
- The first half of 2018 saw growth in excess of 50 per cent from a year earlier and, if
existing terminals in the north and east continue to operate at near full capacity as in the
second half of 2017, total imports in 2018 will come to around 50 mt/y (an increase of
26.3 per cent from the previous year60). Even assuming that approximately the same
volume is received in the second half of 2018 as in the first half, imports for the whole of
in 2018 will come to around 50 mt/y as well. Therefore, if we allow for the occurrence of
supply shortages on the natural gas market around this period, it can be assumed that
imports were almost equal to the maximum receivable volume between the second half of
2017 and first half of 2018.
- If the supply of pipeline gas under the ‘(C) intermediate coal-to-gas switching’ scenario is
high, on the other hand, 52 mt of LNG will be required in 2020. In this case, while the
government’s energy and environmental policy strictly orders that coal-to-gas switching
projects should only be implemented having first secured supplies of natural gas, it is also
evident that projects have not been implemented on the scale planned. It is therefore
59 For example, low utilization rates of terminals are expected in ‘other regions’ and there are operational and/or capacity
restrictions on the supply systems needed to reallocate the natural gas produced from LNG more widely. For reference, the
amount of imported LNG is estimated to be around 60 mt with a (total) terminal utilization rate of around 85–86% in 2020, when
we assume utilization rates of 95% in the North and East, 80% in the South, and 30% in other regions. 60 In comparison with the data of GIIGNL ‘Annual Report’.

47
highly likely61 that imports will be raised to the physical receivable limit of 60 mt and coal-
to-gas projects will continue to be pursued. If this occurs, natural gas consumption will
grow more than projected. (The results of scenario ‘(D) Minimum coal-to-gas switching’
are the same as this case.)
- Although the upper limit on LNG imports is put at 60 mt, this may decrease depending on
LNG prices. While coal-to-gas switching projects in the north will increase natural gas
demand during the winter season, the shortage of storage capacity will make it necessary
to increase procurements of LNG on the spot market in the winter, which will push up
winter spot LNG prices. As noted, coal-to-gas switching projects are heavily subsidized by
the government and it is quite possible that an increase in fuel costs would act as a brake
on such projects. A rise in LNG prices could thus make it more likely that the volume of
LNG imports falls short of 60 mt. The question of international prices is considered in the
next section.
- However, uncertainty in the event of a rise in LNG prices is magnified by growth in LNG
road tanker sales – and there has recently been rapid growth in road tanker sales from
the LNG receiving terminals, relative to LNG imports.62 This is an indication of the general
extent of deregulation of the market for LNG sold in liquid form and of tight supply and
demand on the domestic market which is driving up prices.63 Under these conditions, LNG
will not be sold at a negative margin even if LNG prices rise on the international market,
and LNG imports destined for sale in liquid form may increase.
Table 5.4: Outlook for LNG demand in 2020 by natural gas consumption case
Case NG Consumption
(bcm/y) Pipeline gas supply
(bcm/y) LNG
(mt/year) Supply Capability
A Maximum Coal-to-gas switching
400 260 103 ×
240 118 ×
B 10% share in total primary energy
372 260 82 ×
240 97 ×
C Intermediate Coal-to-gas switching
330 260 52 〇
240 66 △
D Minimum Coal-to-gas switching
300
260 29 〇
240 44 〇
Notes: × Insufficient receiving terminal capacity.△ uncertainty over receiving terminal capacity.
〇 sufficient receiving terminal capacity.
5.4 Impact on the international LNG market
In closing, we consider what such an increase in imports by China would mean for the international
LNG market.
61 If we consider various measures on coal-to-gas switching projects which have already been implemented and also those that
will be implemented by 2020, natural gas supply is (and will be) far below the demand and definitely insufficient, as explained in
chapter 4. 62 For example, 1 million tons of the total LNG imports in 2016 and 1.57 million tons out of the total 2 million tons imported in
2017 were sent out by road tankers at Tianjin terminal. Source: Interview by authors with an expert on the Chinese natural gas
industry, 4 July 2018. It is also reported that LNG supply by road tankers from terminals in the South and the East to the
northern region has increased substantially. The Maritime Executive, 5 June 2018. 63 For example, prices of domestic LNG sales temporarily increased beyond 10,000 yuan/ton in the Northern regions during the
winter of 2017/18.
48
5.4.1 Impact on international LNG supply and demand up to around 2020
We begin by reviewing projections of international LNG supply and demand formulated in mid-2017
before the 2017/18 winter seasons, when China experienced a marked surge in demand for LNG.
These indicated that:
- The wave of new LNG liquefaction projects coming on stream mainly from Australia and
the USA will ease international supply and demand for LNG from 2018 and create excess
supply capacity in the market that will last until around 2023.
- This excess supply capacity will accumulate to reach a fairly high level of 44 mt in 2020.
- The slackening of the supply and demand situation makes it highly likely that spot prices
will stabilize below the average of term-contracted prices.
Recent changes in LNG prices in East Asia are shown in Figure 5.1. From this it can be seen that
whereas spot prices rose from winter 2017 to the first half of 2018 (when Chinese and South Korean
imports of LNG rose sharply), they were only marginally above term prices and the market did not
tighten significantly. The market thus appeared to have sufficient supply capacity to absorb rapid
growth in LNG demand among countries in East Asia.
Next we look at projections of international LNG supply and demand that were made in August 2018,
taking into account these latest changes in LNG supply and demand. These projections revised
Chinese LNG demand in 2020 upward from the previously forecast 41 mt to 60 mt.
- LNG demand is increasing rapidly in China, South Korea, and other East Asian countries,
and global LNG demand in 2020 will increase by around 21 mt compared with the amount
projected last year.
- Supply capacity, on the other hand, has also been revised upward. As a result, the
international LNG market is projected to still have around 28 mt of excess supply
capacity64 in 2020.
- However, rapid growth in LNG demand in China and other countries will shorten the
period of slackness on the international LNG market and thus accelerate progress in new
liquefaction projects. If these projects do not come on stream when needed, the supply
and demand situation on the international market will be more likely to tighten temporarily.
This may occur after 2020.
- As this will have the effect of reducing excess supply capacity on the international LNG
market for the duration of the supply glut period, it is quite possible that supply and
demand will either enter equilibrium or tighten temporarily during the winter demand
season. As seasonal gaps in gas demand are getting larger, due to increased natural gas
demand in particular it is thus more likely that spot prices will increase during the demand
season.
64 The outlook for the international LNG market’s supply and demand is revised every year by the Osaka Gas’s Research
Team. In their latest outlook, the global demand in 2020 is estimated to be 352 million tons, which is the sum of demand in
each importing country estimated individually, on the basis of each country’s latest situation. The global supply in 2020 is
estimated to be 380 million tons, which consists of the existing projects plus post-FID new projects as of August 2018, while the
latest situation of each liquefaction project is reflected in the estimates.

49
Figure 5.1: LNG prices in East Asia ($/mmbtu)
Source: Japan customs, The ICE, NYMEX.
Figure 5.2: Outlook for LNG supply and demand in the global market
Source: Osaka Gas proprietary research.
5.4.2 Long-term impacts up to around 2030
As a supplementary consideration, several key implications for long-term projections deriving from
medium-term projections are now considered. These are as follows.
- Of the various measures that China is taking to combat air pollution, the coal-to-gas
projects that have increasingly been promoted since 2017 to reduce PM2.5 emissions will
very probably become a sustained campaign.

50
- This may be proven by the fact that the current air quality in many cities (shown in Figure
2.3) has yet to be improved to reach the national target level, which is still lax in
comparison with international standards.
- As this campaign will not be completed in the next few years, the high rate of growth in
natural gas consumption is very likely to continue.
- Supply capacity will need to be secured to feed this growth in consumption, and natural
gas supply capacity will be crucial. As there is little likelihood of major growth in domestic
production of conventional gas resources, the key consideration will be whether, among
the unconventional options, shale gas development proceeds smoothly.
- However, LNG demand will depend above all on steady growth in natural gas imports
from Russia from 2020 onward. If imports from Russia grow steadily, this makes it more
likely that LNG imports will slow from 2020. Conversely, if natural gas imports from Russia
do not, for some reason, grow as planned, dependence on LNG will increase further.
- Yet, as the coal-to-gas switching projects currently underway are heavily subsidized,
central and local governments may face financial constraints. Although various
possibilities exist – such as the possibility of an increase in both oil prices and term prices
for LNG, and the possibility of a tightening of the LNG market and rise in spot prices – it is
consequently also quite possible that the implementation of coal-to-gas switching projects
will slow.
51
References
BP, Statistical Review of World Energy.
CCRI (2016), ‘An Analysis of Coal Trends in China’, China Coal Research Institute, December 2016.
Chen, Jainghua (2018), ‘Shale Gas Exploration and Development Progress in China and the way forward’, IOP Conference Series: Earth & Environmental Science 113, IOP publishing.
China Coal Cap Project (2017), ‘China Coal Consumption Cap Plan and Policy Research Project’, China’s low-grade coal comprehensive treatment research report November 2017.
China Electricity Council (2018), ‘Outlook and review on China’s supply and demand of electricity in 2017–2018’, 1 February.
China Electricity Council, ‘Power Industry in China’.
China Statistics press, China Energy Statistical Yearbook 2017.
CNPC (2016), ‘China’s Natural Gas Market Overview’, presentation, 9 November 2016, Tokyo.
CNPC ETRI (Apr.2018), ‘China Natural Gas Market Status and Outlook’, presentation, 26 April.
GIIGNL, ‘Annual Report’, The International Group of Liquefied Natural Gas Importers.
Miyamoto, Akira and Ishiguro Chikako (2006), ‘Pricing and Demand for LNG in China: Consistency between LNG and Pipeline Gas in a Fast Growing Market’, OIES paper, NG 9, Oxford Institute for Energy Studies, January. Available at: https://www.oxfordenergy.org/wpcms/wp-content/uploads/2010/11/NG9PricingandDemandForLNGinChinaConsistencyBetweenLNGandPipelineGasInAFastGrowingMarket-AkiraMiyamotoandChikakoIshiguro-2005.pdf.
MNEP (2007), ‘11th Five-Year Plan for National Environmental Protection’, (11FYPE), Ministry of National Environmental Protection, November.
MNEP (2011), ‘12th Five-Year Plan for National Environmental Protection’, (12FYPE). Ministry of National Environmental Protection, December.
MNEP (Feb.2012), ‘Ambient National Air Quality Standards’, Ministry of National Environmental Protection, February.
MNEP (Dec.2012), ‘12th Five-Year Plan for the Prevention and Control of Air Pollution in Key Areas’, Ministry of National Environmental Protection, December.
MNEP (Aug.2013), ‘National environmental quality situation in the first half of 2013’, Ministry of National Environmental Protection, August.
MNEP (Sep.2013), ‘Implementation Rules for Action Plan for Air Pollution Prevention in Beijing–Tianjin–Hebei and Surrounding Area’, (Action Plan B–T–H), Ministry of National Environmental Protection.
MNEP (Jul.2014), ‘Emission Standard of Air Pollutants for Boiler’, Ministry of National Environmental Protection.
MNEP (2016), ‘Intensive Air Pollution Prevention and Control Measures for Beijing–Tianjin–Hebei (2016–2017)’, (Control Measures B–T–H), Ministry of National Environmental Protection and the governments of Beijing, Tianjin, and Hebei.
MNEP (Jul.2016), ‘Interim Report on the Air Pollution Prevention and Control Action Plan (2013)’, Ministry of National Environmental Protection.
MNEP (Mar.2017), ‘Work plan for air pollution prevention and control in Beijing, Tianjin and Hebei and surrounding areas in 2017’, (Work Plan B–T–H), Ministry of National Environmental Protection,.

52
MNEP (Apr.2017), ‘13th Five-Year Plan for National Environmental Protection’, (13FYPE). Ministry of National Environmental Protection.
MNEP (Jul.2017), ‘Air Pollution Control Action Plan Implementation Assessment Method’, Ministry of National Environmental Protection.
MNEP (Aug.2017a) ‘2017–18 Autumn/Winter Action and Inspection Plan for Tackling and Comprehensive Management of Air Pollution in Beijing–Tianjin–Hebei and Surrounding Areas’, (2017 Autumn/Winter B-T-C), Ministry of National Environmental Protection.
MNEP (Aug.2017b), ‘2017–2018 Autumn/Winter Action and Inspection Plan for Tackling and Comprehensive Management of Air Pollution in Beijing–Tianjin–Hebei and Surrounding Areas – Strengthened Supervision Plan’, Ministry of National Environmental Protection.
MNEP, Chinese Environmental Status Bulletin, Ministry of National Environmental Protection.
NDRC (Apr.2007), ‘11th Five-Year Plan for National Energy Development’, National Development and Reform Commission.
NDRC (Jan.2013a), ‘12th Five-Year Plan for National Energy Development’, National Development and Reform Commission.
NDRC (Jan.2013b), ‘12th Five-Year Plan for Natural Gas Development’, National Development and Reform Commission.
NDRC (Oct.2013), ‘Opinion on the winter work of the natural gas system in 2013’, National Development and Reform Commission, 12 October 2013.
NDRC (Mar.2014), ‘Reinforced Work Program for Air Pollution Prevention in Energy Industry’, National Development and Reform Commission.
NDRC (Dec.2014), ‘Interim Measures for Management of Substitution and Reduction of Coal Consumption in Key Areas’, National Development and Reform Commission.
NDRC (Dec.2016a), ‘13th Five-Year Plan for Natural Gas Development’, National Development and Reform Commission.
NDRC (Dec.2016b), ‘13th Five-Year Plan for National Energy Development’, National Development and Reform Commission.
NDRC (2016), ‘13th Five-Year Plan for Key projects for ecological construction and environmental protection’, National Development and Reform Commission.
NDRC (Apr.2017), ‘Revolutionary Strategy for Energy production and consumption’, National Development and Reform Commission.
NDRC (Jun.2017), ‘13th Five-Year Plan for Power development’, National Development and Reform Commission.
NDRC (Dec.2017), ‘Winter Clean Heating Plan in Northern Area (2017–21)’, (Winter Clean Heating), National Development and Reform Commission.
RNDC, ‘Monthly Overview on Natural Gas Market’, National Development and Reform Commission.
NDRC and MNEP (Jul.2015), ‘Strengthened Work Plan for Controlling Air Pollution and Total Coal Consumption in Key Cities’, National Development and Reform Commission and Ministry of National Environmental Protection.
NDRC and MNEP (Mar. 2017), ‘11th Five-Year Plan for Sulfur Dioxide Emission Control in Existing Coal-fired Power Plants’, National Development and Reform Commission and Ministry of National Environmental Protection.
NDRC, MEE, and RG (Sep.2018), ‘Action Plan for Comprehensive Management of Air Pollution in Autumn and Winter in Beijing–Tianjin–Hebei and surrounding areas 2018–2019, National Development and Reform Commission, Ministry of Ecology and Environment and Regional Governments.

53
NPC (Mar.2001), ‘10th Five-Year Plan for Economic and Social Development of the People’s Republic of China’, (10FYP), The National People’s Congress.
NPC (Mar.2006), ‘11th Five-Year Plan for Economic and Social Development of the People’s Republic of China’, (11FYP), The National People’s Congress.
NPC (Mar.2011), ‘12th Five-Year Plan for Economic and Social Development of the People’s Republic of China’, (12FYP), The National People’s Congress.
NPC (Mar.2016), ‘13th Five-Year Plan for Economic and Social Development of the People’s Republic of China, The National People’s Congress’, (13FYP).
PIP (2018), ‘China Natural Gas Development Report 2018’, Petroleum Industry Press, August 2018.
Roberts, John (2016), ‘Russia’s gas challenge: the consequences for China, Central Asia, Europe and the USA’, Journal of World Energy Law & Business, 9 (2), 22 January, pages 83–104.
RUC (Sep.2017), ‘Coal-fired combustion control in Beijing–Tianjin–Hebei’, Research report, Renmin University of China.
SCPRC (May.2007), ‘Comprehensive work plan for energy saving and emission reduction’, The State Council of the People’s Republic of China.
SCPRC (May,2010), ‘Guidance on Joint Prevention and Control Work for Air Pollution for Improving Regional Air Quality’, (Guidance), The State Council of the People’s Republic of China.
SCPRC (Sep.2013), ‘Air Pollution Prevention and Control Action Plan (2013–2017)’, (Action Plan 2013), The State Council of the People’s Republic of China.
SCPRC (Nov. 2014), ‘Strategic Action Plan for Energy Development (2014–2020)’, (Strategic Action Plan), The State Council of the People’s Republic of China.
SCPRC (Jun.2018), ‘Action Plan to Win the Blue Sky Defence War’, The State Council of the People’s Republic of China (Blue Sky Action Plan).
The Air Pollution and Control Law (revision in Aug. 2015).
US EPA ‘Clean Air Act’, US Environmental Protection Agency.
Asia Plus
AzerNews
Bloomberg
China Daily
China News Service
Eurasianet
Global Trade Atlas
Interfax
International Gas Report
Kaba
People’s Daily
Reuters
The Beijing News
Waterborne Trade Data
World Gas Intelligence
Xinhua News
Ministry of Environment (Japan) Website
National Bureau of Statistics Website
Gazprom Website
CNPC Website
CNOOC Website
China Economic Information Network Website