the outlook for energy - ihs markit · youtlook for nigeria? iraq? iran? venezuela? ... shell...
TRANSCRIPT
Copyright 2007 © Global Insight, Inc.
The Outlook for Energy
Toronto, Ontario, Canada19 September 2007
Mary NovakManaging DirectorEnergy Services
2Copyright 2007 © Global Insight, Inc.
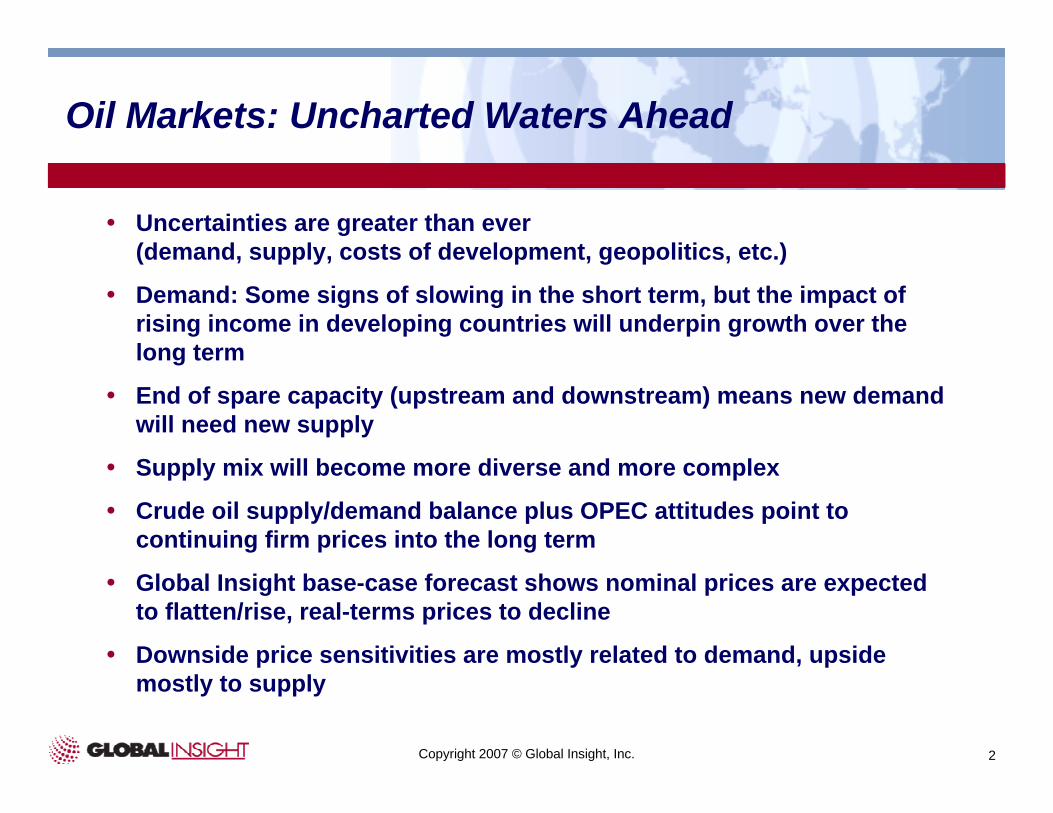
Oil Markets: Uncharted Waters Ahead
Uncertainties are greater than ever(demand, supply, costs of development, geopolitics, etc.)
Demand: Some signs of slowing in the short term, but the impact of rising income in developing countries will underpin growth over the long term
End of spare capacity (upstream and downstream) means new demandwill need new supply
Supply mix will become more diverse and more complex
Crude oil supply/demand balance plus OPEC attitudes point to continuing firm prices into the long term
Global Insight base-case forecast shows nominal prices are expected to flatten/rise, real-terms prices to decline
Downside price sensitivities are mostly related to demand, upside mostly to supply
3Copyright 2007 © Global Insight, Inc.
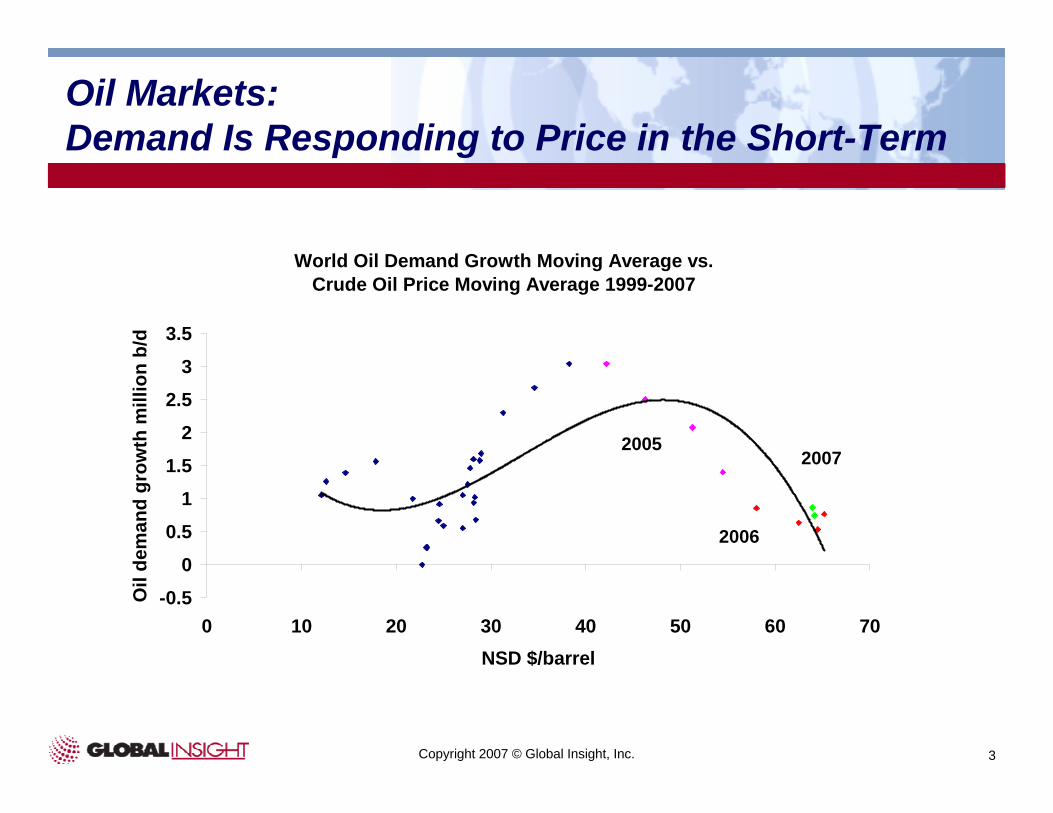
Oil Markets: Demand Is Responding to Price in the Short-Term
World Oil Demand Growth Moving Average vs. Crude Oil Price Moving Average 1999-2007
-0.5
0
0.5
1
1.5
2
2.5
3
3.5
0 10 20 30 40 50 60 70NSD $/barrel
Oil
dem
and
grow
th m
illio
n b/
d
2005
2006
2007
4Copyright 2007 © Global Insight, Inc.
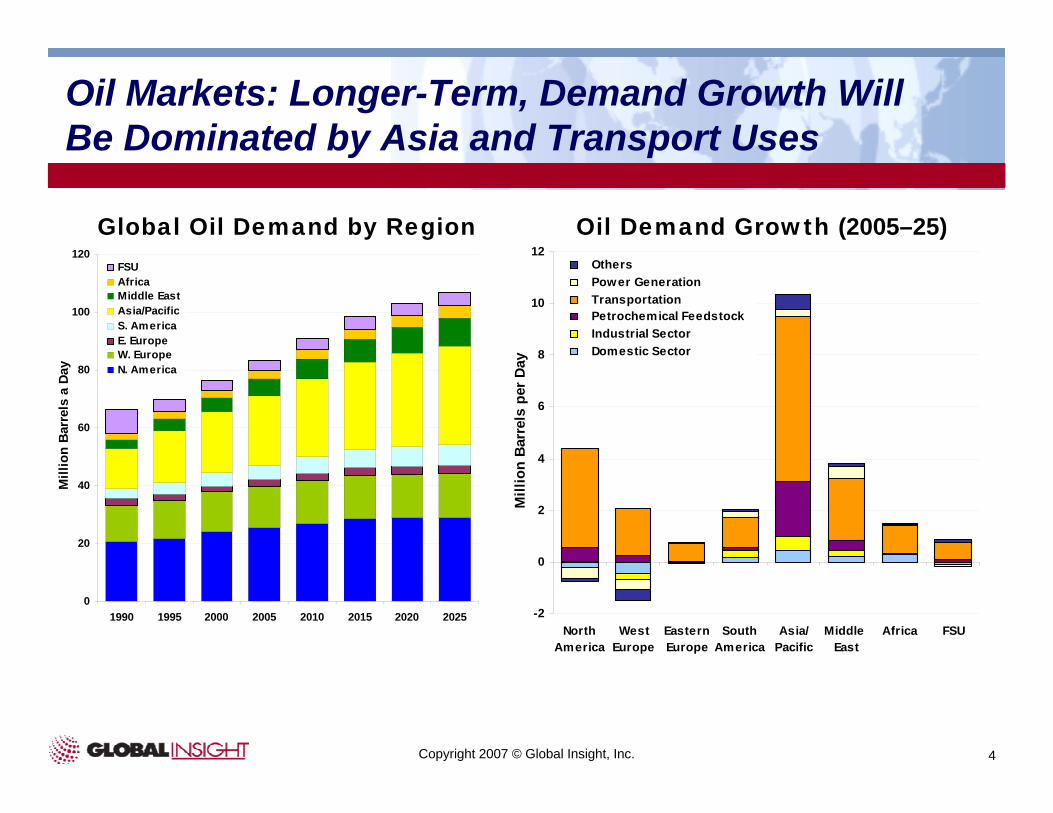
Oil Markets: Longer-Term, Demand Growth Will Be Dominated by Asia and Transport Uses
0
20
40
60
80
100
120
1990 1995 2000 2005 2010 2015 2020 2025
Mill
ion
Bar
rels
a D
ay
FSUAfricaMiddle EastAsia/PacificS. AmericaE. EuropeW. EuropeN. America
-2
0
2
4
6
8
10
12
NorthAmerica
WestEurope
EasternEurope
SouthAmerica
Asia/Pacific
Middle East
Africa FSU
Mill
ion
Bar
rels
per
Day
Others Power Generation Transportation Petrochemical Feedstock Industrial Sector Domestic Sector
Global Oil Demand by Region Oil Demand Growth (2005–25)
5Copyright 2007 © Global Insight, Inc.
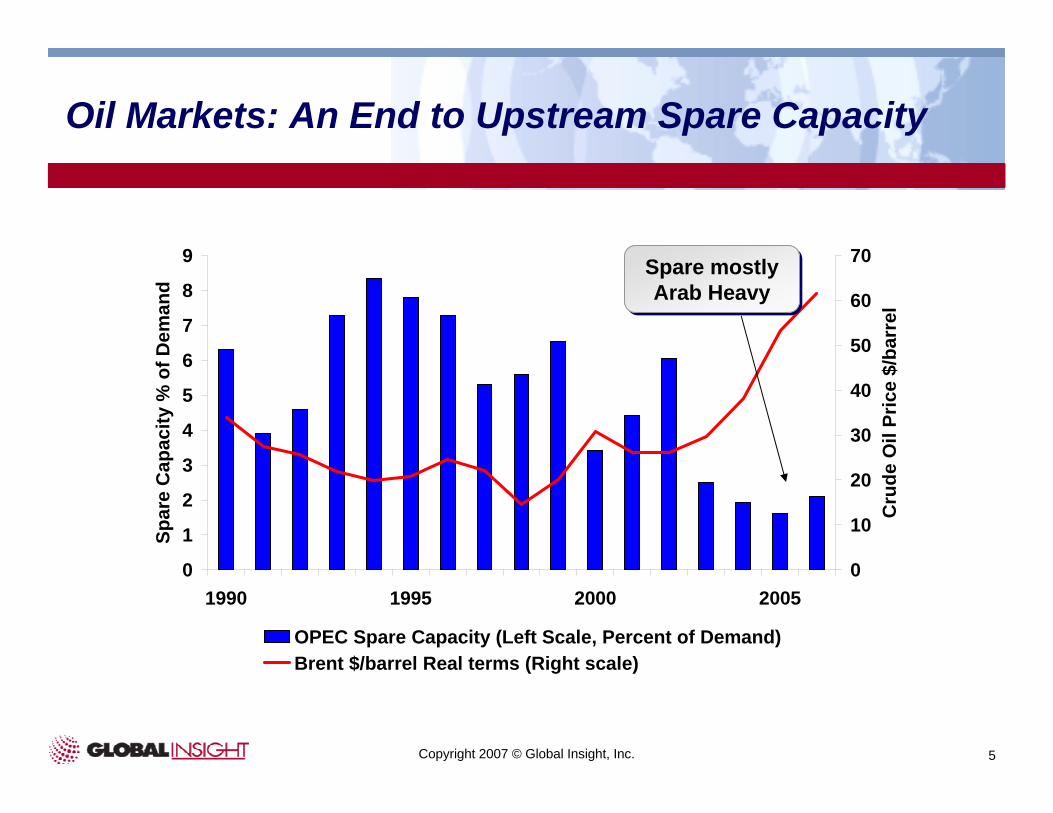
Oil Markets: An End to Upstream Spare Capacity
0
1
2
3
4
5
6
7
8
9
1990 1995 2000 2005
Spar
e C
apac
ity %
of D
eman
d
0
10
20
30
40
50
60
70
Cru
de O
il Pr
ice
$/ba
rrel
OPEC Spare Capacity (Left Scale, Percent of Demand)Brent $/barrel Real terms (Right scale)
Spare mostly Arab Heavy
Spare mostly Arab Heavy
6Copyright 2007 © Global Insight, Inc.
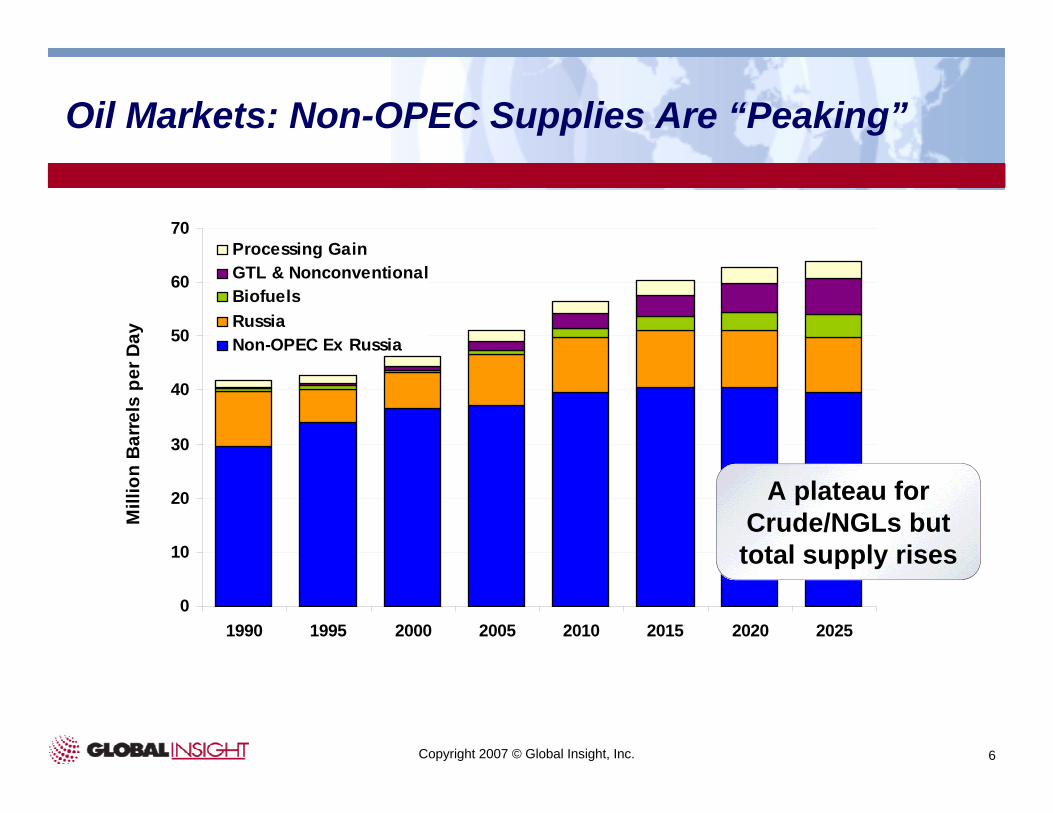
Oil Markets: Non-OPEC Supplies Are “Peaking”
0
10
20
30
40
50
60
70
1990 1995 2000 2005 2010 2015 2020 2025
Mill
ion
Bar
rels
per
Day
Processing GainGTL & NonconventionalBiofuelsRussiaNon-OPEC Ex Russia
A plateau for Crude/NGLs but total supply rises
7Copyright 2007 © Global Insight, Inc.
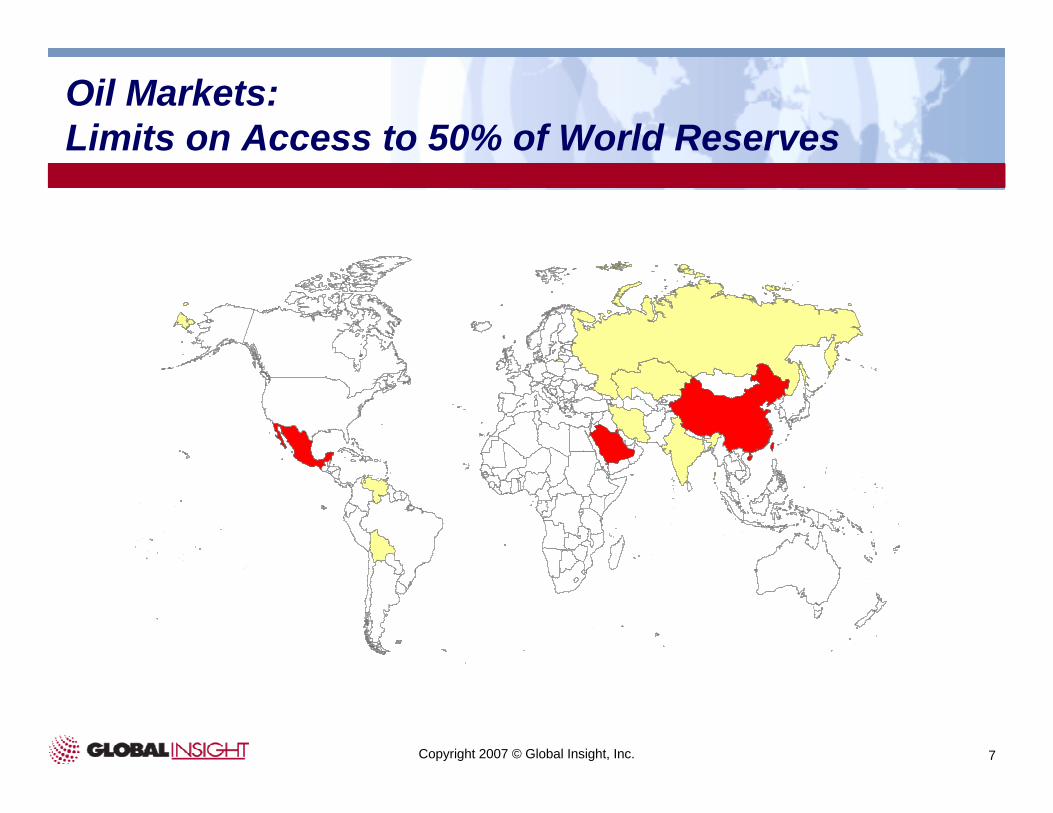
Oil Markets: Limits on Access to 50% of World Reserves
8Copyright 2007 © Global Insight, Inc.
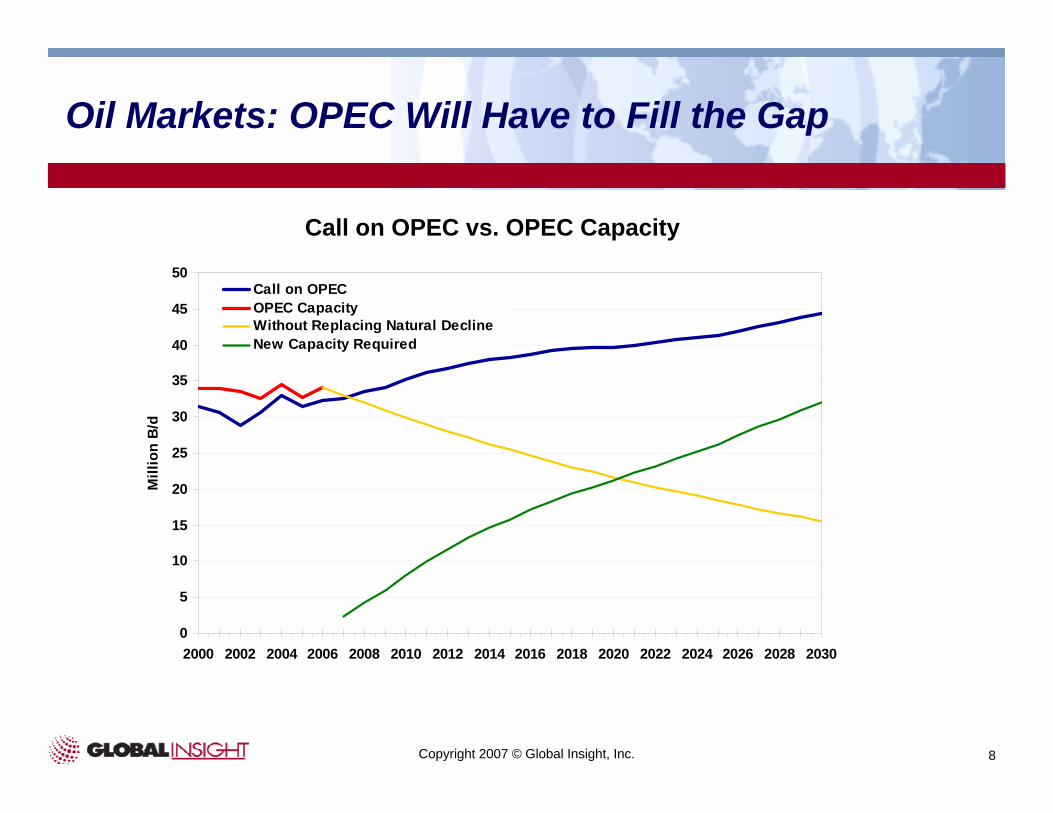
Oil Markets: OPEC Will Have to Fill the Gap
0
5
10
15
20
25
30
35
40
45
50
2000 2002 2004 2006 2008 2010 2012 2014 2016 2018 2020 2022 2024 2026 2028 2030
Mill
ion
B/d
Call on OPECOPEC Capacity Without Replacing Natural DeclineNew Capacity Required
Call on OPEC vs. OPEC Capacity
9Copyright 2007 © Global Insight, Inc.
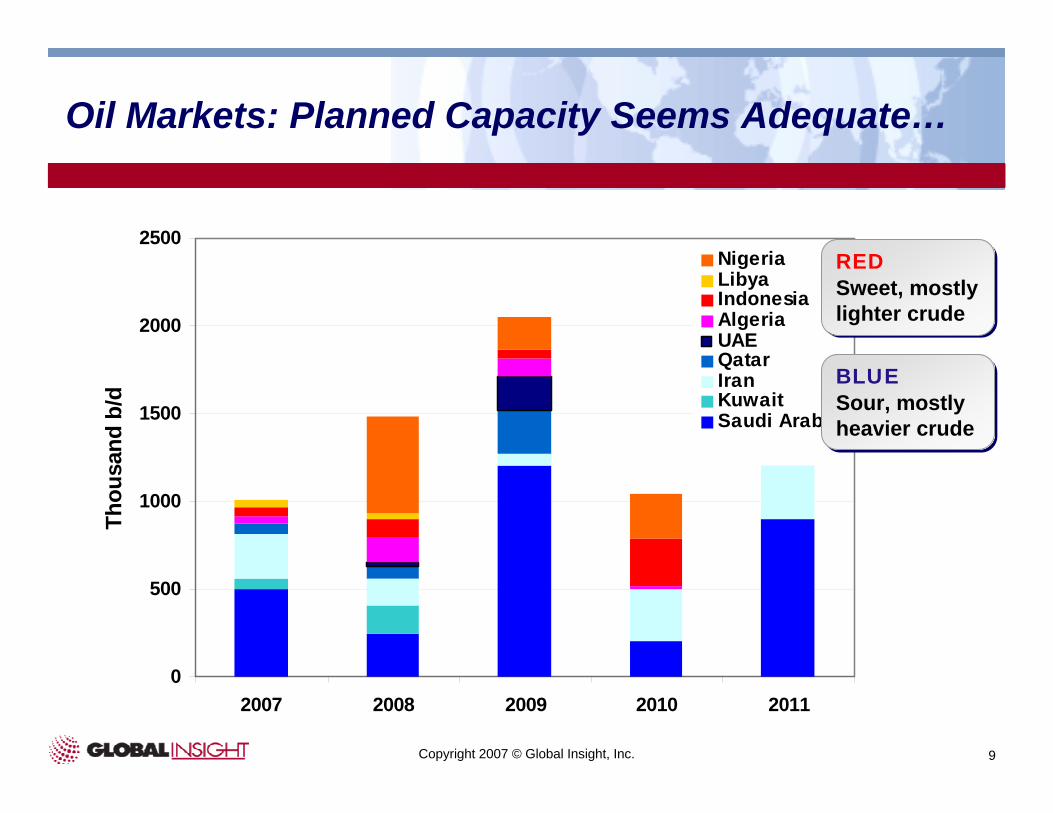
Oil Markets: Planned Capacity Seems Adequate…
0
500
1000
1500
2000
2500
2007 2008 2009 2010 2011
Thou
sand
b/d
NigeriaLibyaIndonesiaAlgeriaUAEQatarIranKuwaitSaudi Arabia
REDSweet, mostly lighter crude
REDSweet, mostly lighter crude
BLUESour, mostly heavier crude
BLUESour, mostly heavier crude
10Copyright 2007 © Global Insight, Inc.
Oil Markets: …But, Will Supply Respond?
Peak oil? Could the pessimists be right?
OPEC reserves? OPEC policies/aspirations?
Outlook for Nigeria? Iraq? Iran? Venezuela?
Non-OPEC: not much on the shelf beyond 2009?
Increasing resource nationalism and access?
Outlook for “non-conventionals” (tar sands, biofuels, GTLs)
Technological/cost breakthroughs?
11Copyright 2007 © Global Insight, Inc.
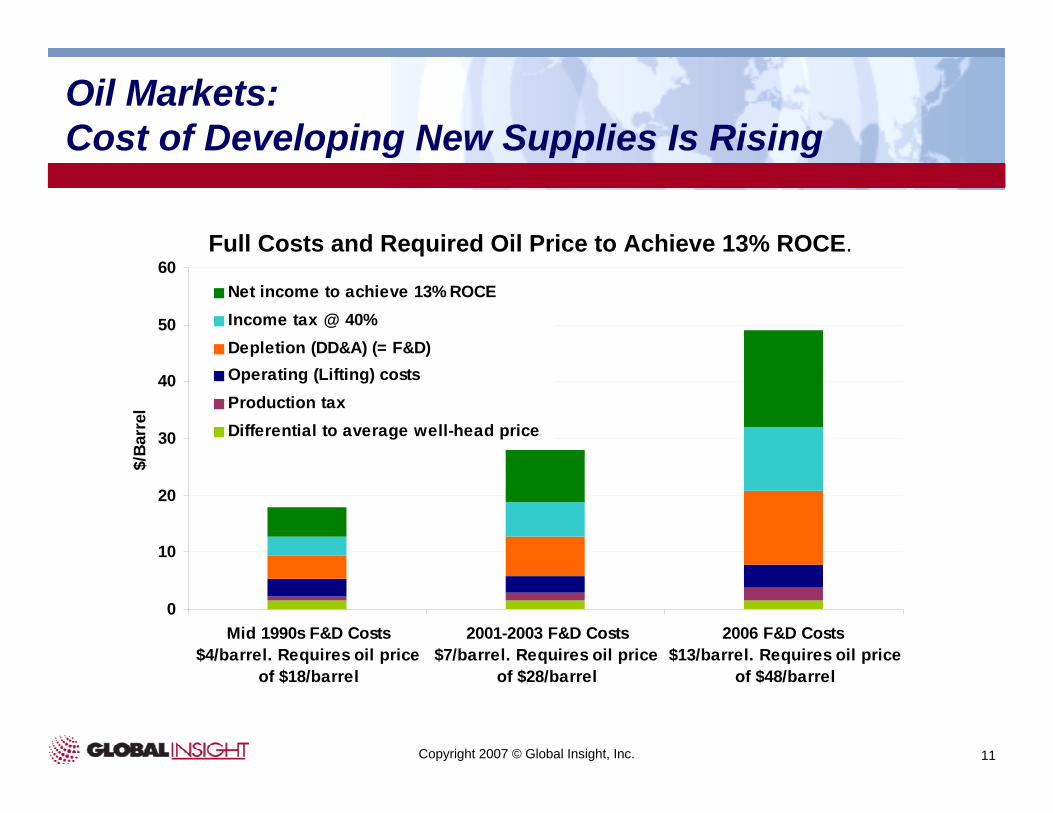
Oil Markets: Cost of Developing New Supplies Is Rising
0
10
20
30
40
50
60
Mid 1990s F&D Costs$4/barrel. Requires oil price
of $18/barrel
2001-2003 F&D Costs$7/barrel. Requires oil price
of $28/barrel
2006 F&D Costs $13/barrel. Requires oil price
of $48/barrel
$/B
arre
l
Net income to achieve 13% ROCEIncome tax @ 40%Depletion (DD&A) (= F&D)Operating (Lifting) costsProduction taxDifferential to average well-head price
Full Costs and Required Oil Price to Achieve 13% ROCE.
12Copyright 2007 © Global Insight, Inc.
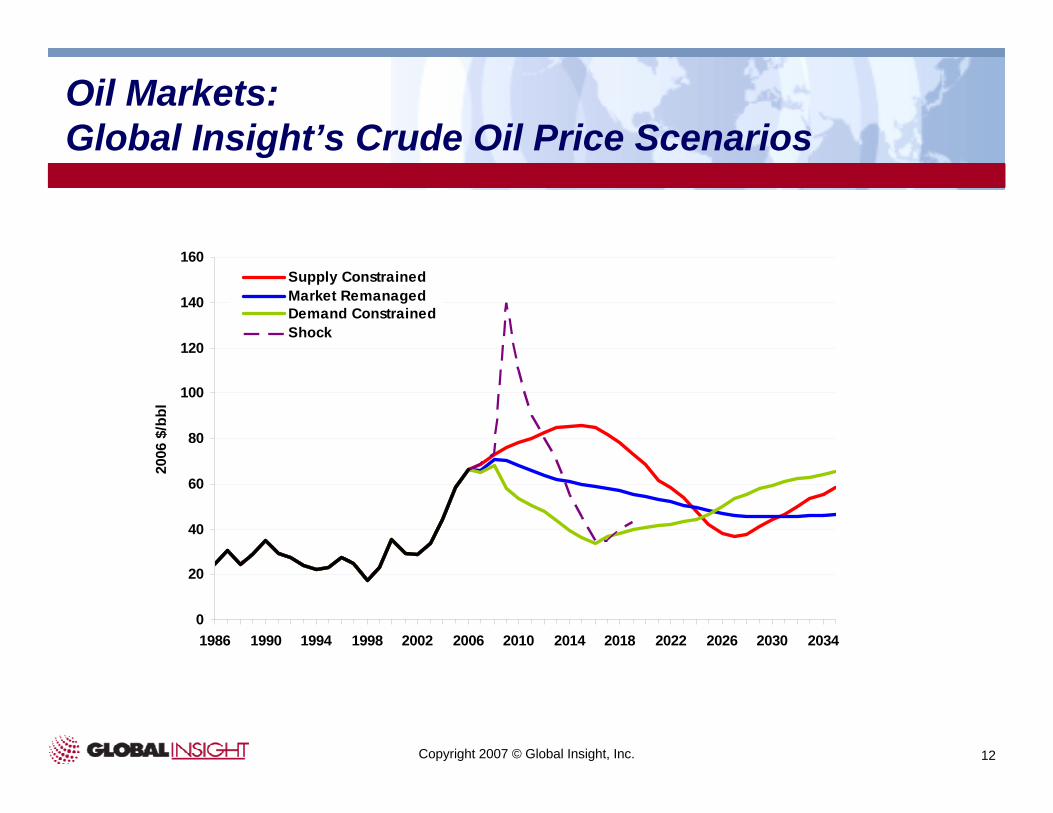
Oil Markets: Global Insight’s Crude Oil Price Scenarios
0
20
40
60
80
100
120
140
160
1986 1990 1994 1998 2002 2006 2010 2014 2018 2022 2026 2030 2034
2006
$/b
bl
Supply ConstrainedMarket RemanagedDemand ConstrainedShock

13Copyright 2007 © Global Insight, Inc.
Oil Markets: Prospects for Oil Resources
Aging resource base25 biggest fields hold 33% of discovered reserves; top 100 hold 53%; only two of the giant fields discovered post-1970 — Shell Global Scenarios to 2025
Graph at right illustrates that discoveries since 1999 have fallen 50% short of consumption —Shell Global Scenarios to 2025
Rise of non-conventionalsIt is clear for the for hydrocarbon age to continue technology in the form of non-conventional oil and gas will be required
But unclear if cost and, as importantly, timing will be sufficient
14Copyright 2007 © Global Insight, Inc.
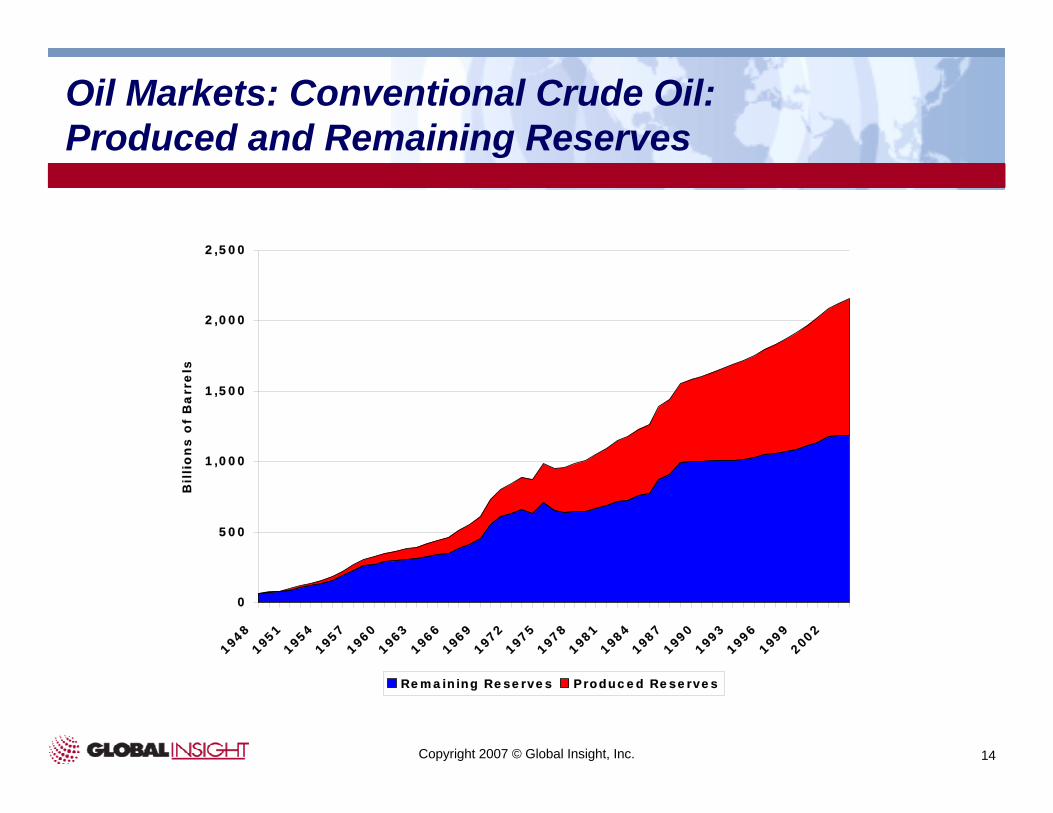
Oil Markets: Conventional Crude Oil: Produced and Remaining Reserves
0
500
1,000
1,500
2,000
2,500
1948
1951
1954
1957
1960
1963
1966
1969
1972
1975
1978
1981
1984
1987
1990
1993
1996
1999
2002
Bil
lio
ns
of
Ba
rre
ls
Remaining Reserves Produced Reserves
15Copyright 2007 © Global Insight, Inc.
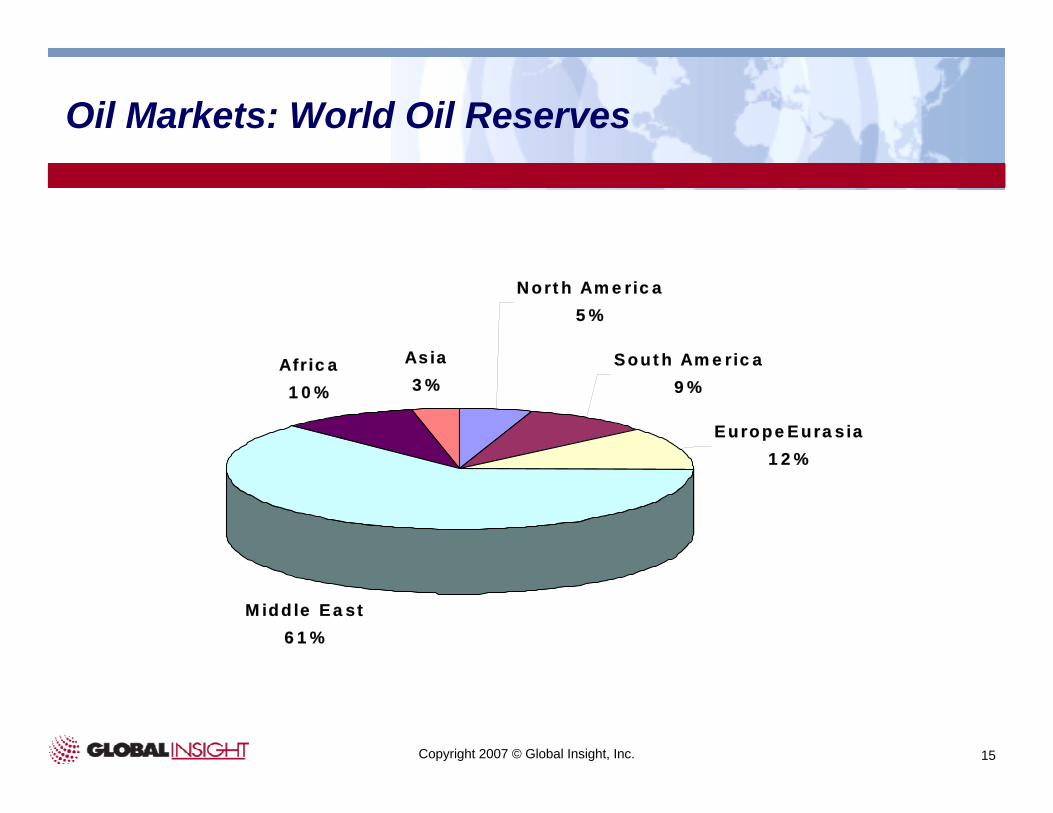
Oil Markets: World Oil Reserves
North America5%
South America9%
EuropeEurasia12%
Middle East61%
Africa10%
Asia3%

16Copyright 2007 © Global Insight, Inc.
Oil Markets: Accelerating Declines?
Part of the reason for the struggle of non-OPEC production to grow has been the apparent acceleration of decline rates
Acceleration can perhaps best be illustrated in areas with relatively little new field development
The graph at the right shows acceleration from 1% p.a. decline to nearly 5% in a relatively few short years
Aging fields, better technology and rate acceleration economics appear to be the culprits
0
2000
4000
6000
8000
10000
12000
14000
16000
18000
20000
1996 1997 1998 1999 2000 2001 2002 2003 2004 2005 2006-6.00%
-5.00%
-4.00%
-3.00%
-2.00%
-1.00%
0.00%
MB
OP
D
Year-on
-Year D
ecline (%
)
17Copyright 2007 © Global Insight, Inc.
Oil Markets: …the Resource Base Is Not the Issue
Conventional oil and gas reserves continue at stable levels of the last several years
Unconventional resources are huge with costs largely below oil prices of the last six months
Conventional oil supplies and reserves heavily concentrated in high risk countries
Low spare capacity has focused the market’s attention on real and perceived risk of oil exporters
18Copyright 2007 © Global Insight, Inc.
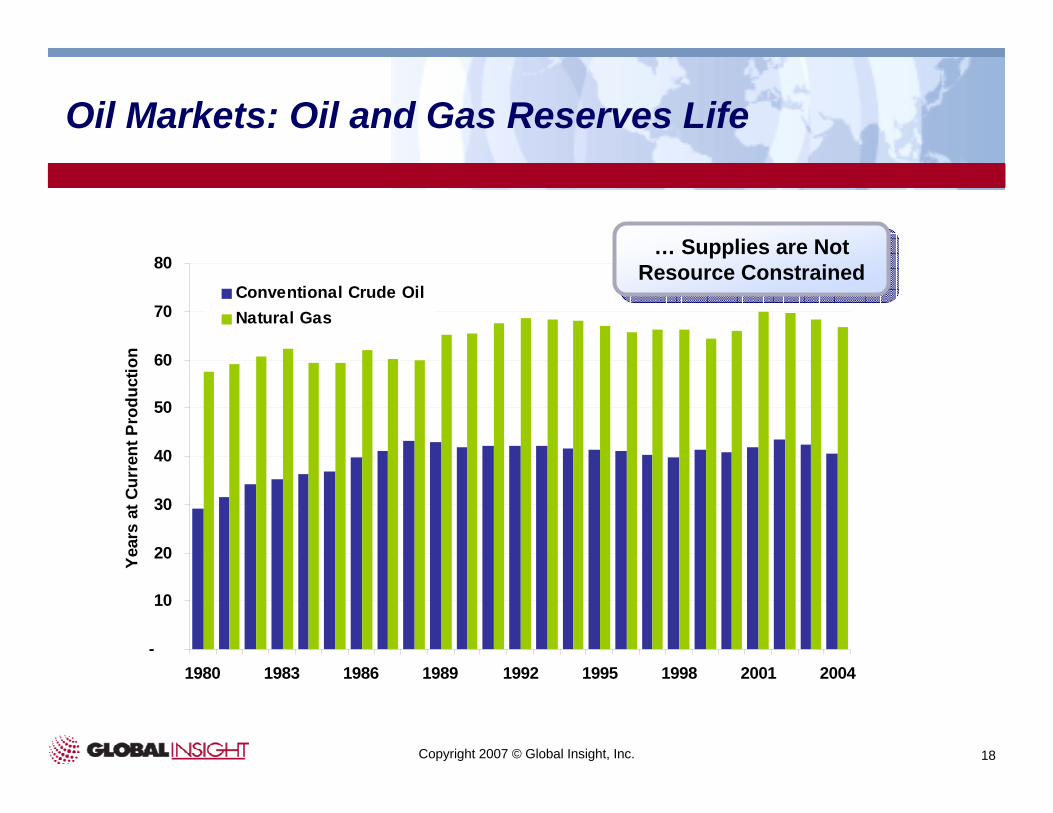
Oil Markets: Oil and Gas Reserves Life
-
10
20
30
40
50
60
70
80
1980 1983 1986 1989 1992 1995 1998 2001 2004
Year
s at
Cur
rent
Pro
duct
ion
Conventional Crude OilNatural Gas
… Supplies are Not Resource Constrained… Supplies are Not
Resource Constrained
19Copyright 2007 © Global Insight, Inc.
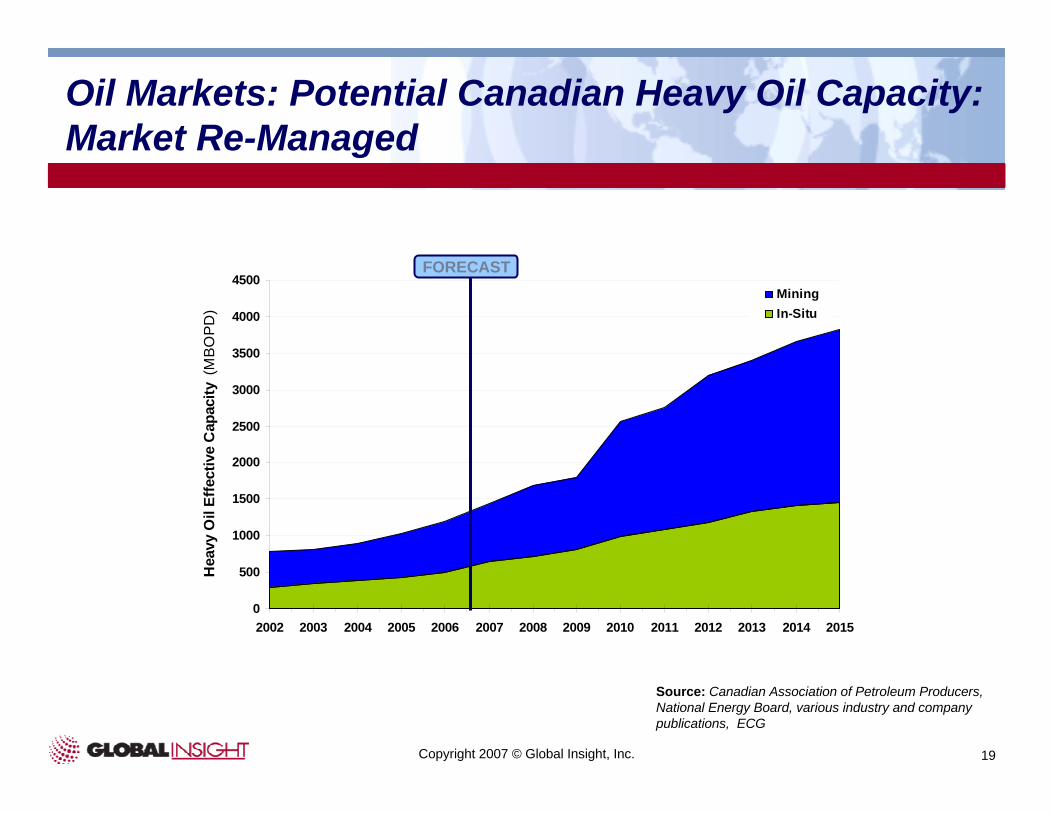
Oil Markets: Potential Canadian Heavy Oil Capacity: Market Re-Managed
0
500
1000
1500
2000
2500
3000
3500
4000
4500
2002 2003 2004 2005 2006 2007 2008 2009 2010 2011 2012 2013 2014 2015
Hea
vy O
il Ef
fect
ive
Cap
acity
(M
BO
PD
)
MiningIn-Situ
Source: Canadian Association of Petroleum Producers, National Energy Board, various industry and company publications, ECG
FORECAST