the origins of gender roles: women and the plough...
TRANSCRIPT

The Origins of Gender Roles:
Women and the Plough∗
(Preliminary)
Alberto Alesina† Paola Giuliano‡ Nathan Nunn§
October 2010
Abstract: This paper studies the historic origins of current differences
in norms and beliefs about the role of women in society. We show that,
consistent with anthropological hypotheses, societies with a tradition
of plough agriculture tend to have the belief that the natural place for
women is inside the home and the natural place for men is outside the
home. Using ethnicity to link individuals today to their ancestors’ past
plough use, we document a link between traditional plough-use and a
number of outcomes today, including female labor force participation,
female participation in politics, female ownership of firms, the sex ratio
and self-expressed attitudes about the role of women in society. Our
identification exploits variation in the historic suitability of the envi-
ronment of ancestors for growing crops that differentially benefitted
from the adoption of the plough. We examine culture as a mechanism
by looking at first and second generation immigrants with different
cultural backgrounds living within the US.
∗We thank Samuel Bowles and seminar participants at Brown, MIT, Science Po, and Stanford’s SITE conference forvaluable comments.
†Harvard University, IGIER Bocconi and NBER. (email: [email protected])‡University of California Los Angeles and NBER. (email: [email protected])§Harvard University, NBER and BREAD. (email: [email protected])
1

1. Introduction
The role of women in the family, in society and in the work force varies across nations and
cultures. In some, women are expected to stay at home, care for the children, and specialize in
home production. In others, women work outside the household almost as much as men and
participate in various degrees in the production of income for the family and in other public and
political activities.
Female labor force participation has increased strongly in many countries in the last few
decades and proximate causes of this dramatic change have been extensively examined.1 However
large cross-country differences still persist and remain very important. To illustrate this point,
Table 8 reported in the appendix, shows that the vast majority of the variation in female labor
force participation across countries and and over time between 1980 and 2008 is explained by
time-invariant country characteristics. The table shows that either a linear time trend or flexible
year fixed effects explain 2% of the total variation in the sample (columns 1–2). Time and country
varying factors, like per capita income and the share of manufacturing or services in the economy,
together account for an additional 27% of the variation (columns 3–5). However, the vast majority
of the variation – 68% – is explained by explained by time-invariant country characteristics
(column 6). Our point here is that even accounting for changes in gender attitudes over time,
and changes associated with economic development, the vast majority of the variation arise from
fixed differences across countries. A recent line of research – e.g., Alesina and Giuliano, 2010;
Fernandez (2007); Fernandez and Fogli (2009); and Fortin (2005) – has emphasized the importance
of cultural norms about the perception of women in society as a relevant factor that could explain
these persistent differences across countries.
Although the link between culture and economic outcomes like female labor force participation
is rather clear, little is known about the origin of these cultural differences. This paper tackles
this question. We are therefore not concerned with the short-term cultural changes in female
labor force participation, but with broad historic-based differences that may still affect the role
of women today. Our primary focus is on these deep, long-term, historic determinants of social
organization.
The hypothesis tested in this paper is whether at least part of the current differences in gender
1See Iversen and Rosenbluth (2010), Goldin (2006), Albanesi and Olivetti (2007, 2009) amongst others.
2
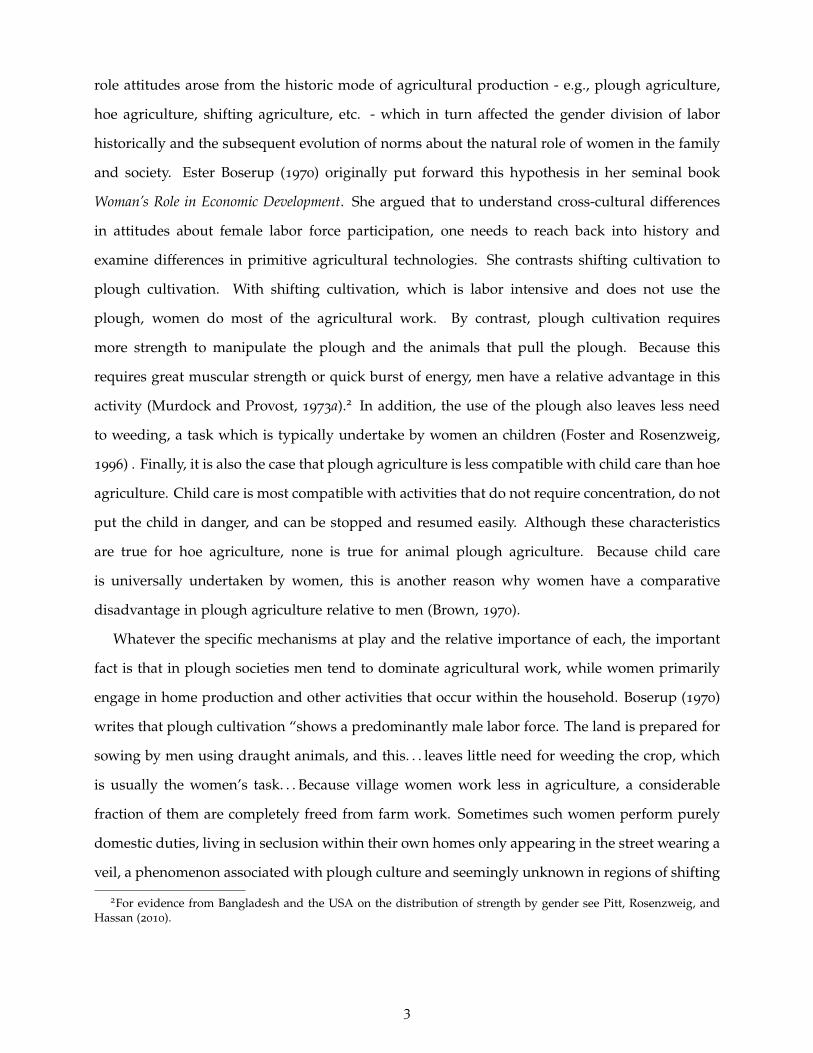
role attitudes arose from the historic mode of agricultural production - e.g., plough agriculture,
hoe agriculture, shifting agriculture, etc. - which in turn affected the gender division of labor
historically and the subsequent evolution of norms about the natural role of women in the family
and society. Ester Boserup (1970) originally put forward this hypothesis in her seminal book
Woman’s Role in Economic Development. She argued that to understand cross-cultural differences
in attitudes about female labor force participation, one needs to reach back into history and
examine differences in primitive agricultural technologies. She contrasts shifting cultivation to
plough cultivation. With shifting cultivation, which is labor intensive and does not use the
plough, women do most of the agricultural work. By contrast, plough cultivation requires
more strength to manipulate the plough and the animals that pull the plough. Because this
requires great muscular strength or quick burst of energy, men have a relative advantage in this
activity (Murdock and Provost, 1973a).2 In addition, the use of the plough also leaves less need
to weeding, a task which is typically undertake by women an children (Foster and Rosenzweig,
1996) . Finally, it is also the case that plough agriculture is less compatible with child care than hoe
agriculture. Child care is most compatible with activities that do not require concentration, do not
put the child in danger, and can be stopped and resumed easily. Although these characteristics
are true for hoe agriculture, none is true for animal plough agriculture. Because child care
is universally undertaken by women, this is another reason why women have a comparative
disadvantage in plough agriculture relative to men (Brown, 1970).
Whatever the specific mechanisms at play and the relative importance of each, the important
fact is that in plough societies men tend to dominate agricultural work, while women primarily
engage in home production and other activities that occur within the household. Boserup (1970)
writes that plough cultivation “shows a predominantly male labor force. The land is prepared for
sowing by men using draught animals, and this. . . leaves little need for weeding the crop, which
is usually the women’s task. . . Because village women work less in agriculture, a considerable
fraction of them are completely freed from farm work. Sometimes such women perform purely
domestic duties, living in seclusion within their own homes only appearing in the street wearing a
veil, a phenomenon associated with plough culture and seemingly unknown in regions of shifting
2For evidence from Bangladesh and the USA on the distribution of strength by gender see Pitt, Rosenzweig, andHassan (2010).
3
cultivation where women do most of the agricultural toil” (Boserup, 1970, pp. 13–14).3
In plough societies, a gender division of labor both in the field and in the family becomes
predominant. Because women specialize in work in the domestic domain, the home comes to
be seen as the “natural” place for women, rather than outside the home in the fields or in the
workforce. Interestingly enough, Boserup maintains that this division of roles persisted even after
a country moved out of agriculture: factory work appears to be avoided by married women in
many part of the developing world and there is considerable evidence that this social norm is
widely accepted. The correlation with female employment appears to be strong. For example, in
India “. . . the regional distribution of women’s industrial employment has changed considerably
in favour of the South. It was seen that women are much more active in agriculture in Southern
India than in the North. This pattern is now seen to be repeated in the modern industrial sector.”
Since Boserup’s initial hypothesis, others have also examined the effect that the plough has had
on gender attitudes historically. For example, Fernand Braudel (1998) makes a similar argument
in his description of the evolution of Mesopotamia, where the plough was likely introduced in
about 4,000 to 6,000 BC. He writes: “Until now, women had been in charge of the fields and
gardens where cereals were grown: everything had depended on their tilling the soil and tending
the crop. Men had been first hunters, then herdsmen. But now men took over the plough,
which they alone were allowed to use. At a stroke, it might seem that the society would move
from being matriarchal to patriarchal: that there would be a shift away from the reign of the
all-powerful mother goddesses. . . and towards the male gods and priests who were predominant
in Sumer and Babylon. Developments were long-term: domestication of large animals like asses
and oxen, followed by horses and camels took centuries and was accompanied with a move
towards male domination of society and its beliefs, from a queen resembling the Earth Mother to
a king resembling Jupiter, as Jean Przyluski put it”. (Braudel, 1998, p. 71).
Our hypothesis is that long-lasting cultural values regarding the role of women in society
and therefore the organization of work in the market and at home may depend on the initial
technology and its evolution. With the persistence typical of cultural values, even technologies
3It is interesting to note that the evidence suggests that this difference in agricultural technology also leads to adifferent organization of marriage. In areas with shifting technologies women are an asset for men who pay a pricefor them. In fact polygamy is common since the first wife welcomes other helpers in the field and at home. In ploughintensive cultivation instead the wife’s family pays a dowry to marry their daughter and polygamy is rare (Goody,1976, Burton and Reitz, 1981). Although interesting and worthy of a detailed analysis, because of space constraints wedo not pursue this specific aspect of plough societies here.
4
adopted long time ago may still have an influence on current cultures.
We test whether differences in gender roles today originate in different societies’ historic use
of the plough by combining historic ethnographic data reporting whether societies traditionally
used animal plough agriculture with contemporary female involvement in market work as well
as information on attitudes about gender roles.
We look across countries, across regions, across individuals within countries and across immi-
grants from different cultural backgrounds living within the US to test for our hypothesis. We
find a strong and robust negative relationship between the historic use of the plough and female
labor force participation as well as gender role attitudes.
One concern with our approach is that the choice of technology may have been endogenous to
the pre-existing cultural values about women, and these may continue to persist until today.
For example it could be that societies with attitudes favoring gender inequality were more
likely to adopt the plough historically and that these attitudes continue to persist today. We
address this causality problem by instrumenting for the historic use of the plough with certain
characteristics of the soil. As Pryor (1985) shows the plough tended to be used with certain type
of cultivations , such as teff, wheat, barley, rye and wet rice, which require the land be prepared
in a very short period of time. Pryor names these crops as ‘plough-positive’, as opposed to
‘plough-negative’ crops, such as maize and various types of root and tree crops. (More details
are given below.) Based on Pryor’s insights, we examine plough-positive cereals – wheat and rye
– and plough-negative cereals – millet and sorghum. Using data from the FAO, we identify
the relative suitability of finely defined locations globally for growing these plough-positive
and plough-negative cereals. We then use the relative differences in ethnic groups’ geo-climatic
conditions for growing plough-positive and plough-negative cereals as instruments for historic
plough use. We also control for other determinants of plough use.
The first stage of our IV estimates show that being endowed with a plough-positive environ-
ment increase the likelihood that the plough was adopted. The second stage shows that the effect
of the plough on our outcomes of interest is qualitatively similar to the OLS estimates.
Our analysis then turns to mechanisms. It is possible that part of the long-term effect of the
plough we identify arises because historic plough-use facilitated the development of different
5

policies that are more or less conducive to the participation of women in market activities.4 This
would reinforce the impact that the plough may have on gender attitudes. To isolate the impact
of the long lasting effects of the plough on individual’s attitudes and beliefs (i.e. culture), we
examine variation among immigrants within the US. Specifically, we test whether first and second
female generation immigrants from countries that historically used the plough have lower rates
of labor force participation in the US. The benefit of studying immigrants is that although they
have different cultural backgrounds, they arguably face a very similar institutional environment.
Our paper is not the first to examine the relationship between technology and gender roles.
Ross (2008) for instance argues that the technology involved in oil production crowds out women
from the labor force: women exit the labor force, are excluded from positions of power, and
assume a unequal role in society. Ross (2008) provides evidence that it is not Islam per se but
the prevalence of oil production which determines variations in women conditions within oil
producing countries. However, the causal mechanism we identify is different from that proposed
by Ross. Also our analysis, focusing on culture, is interested in its historical origins. Our
paper complements a small number of empirical studies on historic determinants and long-term
persistence of cultural values. For instance, Tabellini (2010) looks at how certain moral values are
more or less conducive to growth promoting policies. Guiso, Sapienza, and Zingales (2008b) test
Putnam’s hypothesis of the historic origins of regional differences of social capital and trust within
Italy.5 Nunn and Wantchekon (2011) examine the historic roots of mistrust within sub-Saharan
Africa. Grosjean (2010a) examines the historical origins of a ‘culture of honor’ in the US South and
Grosjean (2010b) and Becker, Boeckh, Hainz, and Woessman (2010) examine the lasting impact
that historic empires had on cultural outcomes.
The paper is organized as follows. In section 2 we describe how we measure the historic
plough use among the ancestors of individuals living in different countries and districts within
countries. We also describe how we construct our instruments - the historic suitability of
ancestors’ climates for cultivating plough-positive and plough-negative crops. Section 3 presents
OLS and IV estimates, examining variation across countries, subnational districts and individuals.
Section 4 examines first and second generation immigrants to test whether the effect of historic
plough-use continues to persist even when individuals face the same external environment.
4Alesina, Algan, Cahuc, and Giuliano (2010), Guiso, Sapienza, and Zingales (2008a) and Tabellini (2008) investigatefeedback effects between culture and institutions.
5See also Guiso, Sapienza, and Zingales (2004) on social capital and financial development.
6
Section 5 concludes.
2. Data sources, variable definition and data matching
A. Data sources
Our analysis will use four primary data sources: the Ethnographic Atlas, which contains infor-
mation on ethnic groups’ historic use of the plough; the World Value Survey, which has data on
current attitudes about gender roles and on female labor force participation; the Current Population
Survey, which includes information from 1994 to 2009 on female labor force participation of
US first and second generation immigrants; and the Ethnologue and the Geo-Referencing of Ethnic
Groups which reports the current geographic locations of ethnic groups globally and are used
to link the historical plough use (as found in the Ethnographic Atlas data) to current female
labor force participation and gender role attitudes obtained from the World Value Survey and the
Current Population Survey.
We describe each data source, and the variables we construct below.
a. Historic plough use and the Ethnographic Atlas
We obtain data on the historic plough use from the Ethnographic Atlas, a world wide ethnicity-
level database constructed by George Peter Murdock and containing a wealth of ethnographic
information for 1267 ethnic groups across the globe. Information for societies in the sample has
been coded for the earliest period for which satisfactory ethnographic data are available or can
be reconstructed. The earliest observation dates are for Old World groups where early written
evidence is available. For the rest of the world, most evidence is taken from observations and doc-
umentation that occurred in the nineteenth century. The dataset should capture, to the maximum
extent possible, the indigenous characteristics of various ethnic group prior to European contact.
The database contains a measure of the historic use of animal plough agriculture, classifying
groups in one of the following three mutually exclusive categories: (i) the plough was absent,
ii) the plough existed at the time the group was observed but it was not aboriginal, and (iii) the
plough was aboriginal and found in the society prior to contact. The are data for 1,158 of the
1,267 societies in the database.
7
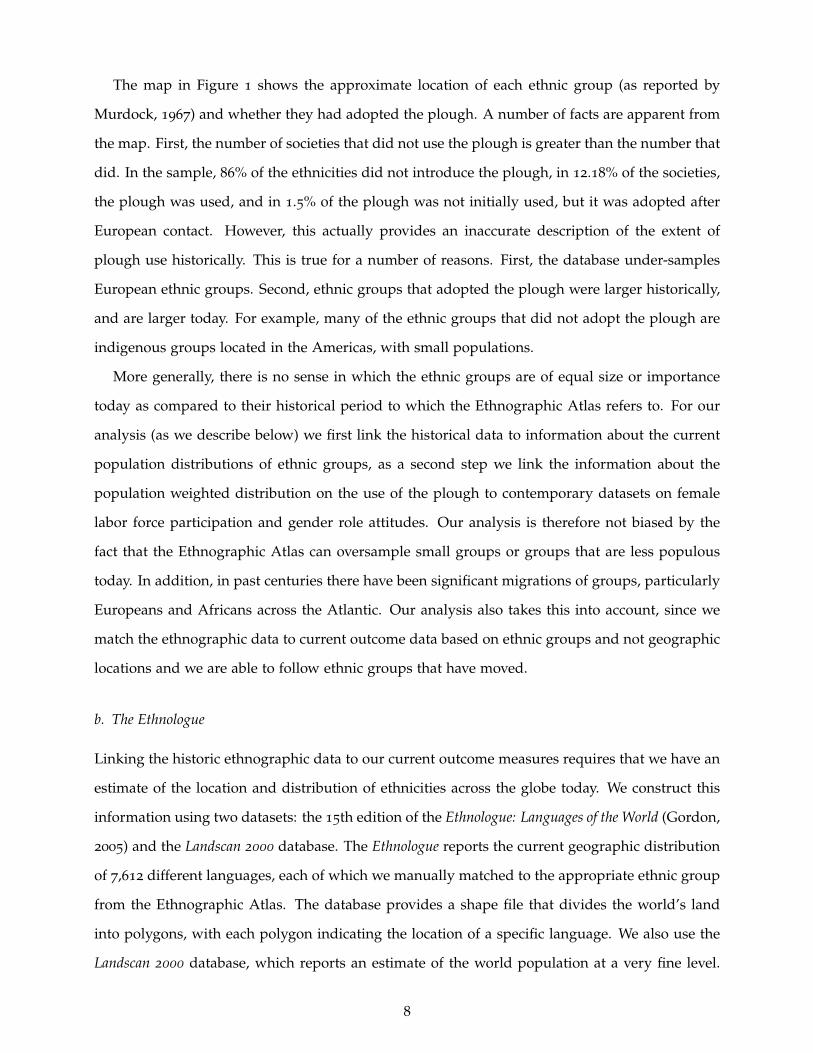
The map in Figure 1 shows the approximate location of each ethnic group (as reported by
Murdock, 1967) and whether they had adopted the plough. A number of facts are apparent from
the map. First, the number of societies that did not use the plough is greater than the number that
did. In the sample, 86% of the ethnicities did not introduce the plough, in 12.18% of the societies,
the plough was used, and in 1.5% of the plough was not initially used, but it was adopted after
European contact. However, this actually provides an inaccurate description of the extent of
plough use historically. This is true for a number of reasons. First, the database under-samples
European ethnic groups. Second, ethnic groups that adopted the plough were larger historically,
and are larger today. For example, many of the ethnic groups that did not adopt the plough are
indigenous groups located in the Americas, with small populations.
More generally, there is no sense in which the ethnic groups are of equal size or importance
today as compared to their historical period to which the Ethnographic Atlas refers to. For our
analysis (as we describe below) we first link the historical data to information about the current
population distributions of ethnic groups, as a second step we link the information about the
population weighted distribution on the use of the plough to contemporary datasets on female
labor force participation and gender role attitudes. Our analysis is therefore not biased by the
fact that the Ethnographic Atlas can oversample small groups or groups that are less populous
today. In addition, in past centuries there have been significant migrations of groups, particularly
Europeans and Africans across the Atlantic. Our analysis also takes this into account, since we
match the ethnographic data to current outcome data based on ethnic groups and not geographic
locations and we are able to follow ethnic groups that have moved.
b. The Ethnologue
Linking the historic ethnographic data to our current outcome measures requires that we have an
estimate of the location and distribution of ethnicities across the globe today. We construct this
information using two datasets: the 15th edition of the Ethnologue: Languages of the World (Gordon,
2005) and the Landscan 2000 database. The Ethnologue reports the current geographic distribution
of 7,612 different languages, each of which we manually matched to the appropriate ethnic group
from the Ethnographic Atlas. The database provides a shape file that divides the world’s land
into polygons, with each polygon indicating the location of a specific language. We also use the
Landscan 2000 database, which reports an estimate of the world population at a very fine level.
8

The Landscan 2000 database has been produced by Oakridge Laboratories in cooperation with the
US Government and NASA. Based on detailed maps and satellite imagery, a roughly 1 km by
1km (30 arc-second by 30-arc second) raster file covering the globe has been created. For each 1
km grid-cell, an estimated population count is reported. By overlaying the Ethnologue with the
Landscan raster file, we obtain an estimate of the full population distribution of ethnic groups
across the globe today. This information is then used to link the historic ethnicity-level data to
our current outcomes of interest.
We also test the robustness of our results by using an alternative dataset containing information
on the location of ethnicities across the globe, the Geo-Referencing of Ethnic Groups (GREG) database
(Weidmann, Rod, and Cederman, 2010). Like the Ethnologue, the GREG database provides a shape
file that divides the world’s land into polygons, with each polygon indicating the location of a
specific ethnicity. The shortcoming of the GREG database is that ethnic groups are much less
finely identified relative to the Ethnologue database. The GREG database identifies 1,364 ethnic
groups, while the Ethnologue identifies 7,612 ethnic groups. Because of the finer level of ethnic
identification, the linking to the Ethnographic Atlas ethnic groups was much cleaner and more
precise when the Ethnologue was used.
Although we use the Ethnologue to construct our baseline measure, as we report in the online
appendix, we find that the results are broadly consistent when we use the GREG measure.
c. Data Matching
The core difficulty facing our analysis is that our outcomes of interest -attitudes toward gender
equality and female labor force participation- are all measured across locations, either regions
or countries, but the historic ethnographic information on historic plough use is measured at
the ethnicity/society level. To link the two sources, we need information on the current spatial
distribution of ethnic groups globally. As described above, we will obtain this by combining
information from the Ethnologue and the Landscan 2000 database.
To illustrate how we match the data among the various datasets, we discuss the case of
Ethiopia. The map in Figure ?? shows the land inhabited by various ethnic groups, taken from
the 15th Edition of the Ethnologue; the map also shows an estimate of the number of individual
living on the land (obtained by the Landscan raster file). In the figure a darker shade indicates
more inhabitants in each 30 arc second grid-cell, whereas the Ethnologue ethnicity boundaries are
9
")")
#*
")
")
")
")")
")
")")
") ")
")
")
#*
#*")
")
!( ")")
!(!(
!(
")
!(")
!(
!(
!(
")
!(
")
")
!(
!(")
!(
")
!(")
")
")")
")
")
")
!(
")
!(!(
")
")
")
") ")
")")
")
")
")")
")
")
")
")
")
")
")
")
")
")
")
") ")
")
")
")
")
")
")
")")
")
")
")
")
")
")
")
")
") ")
")
")
")
")
")
")
")")")
")")
")")
")
")
")")
")
")
")
")
!(
")
")
!(
!(
!(
!(
!(
")
!(
!(
")!(
!(
")
!(
")
!(
!(
!(
")
")
")
")
!(")
")
!( ")
")
!(
!(
")")
")")
")")
")
")")
")
")")
")
")
")
")")
") ")
")
")
")
")
")
")")
")
")
")
")")
")
")
") ")
#*
")
")
")
")")
")
")
")
")
")
")")
")
")
")
") ")")
")
")
")
")
")
")")
")
")
")
!(
!(
!( !(
!(
!(
!( !(
!(
")
")
!(
!(
!(
!(!(")
!(
")#*
!(")")
#*
!( ")
")
")
")
")
")")
") ")
")
")
")
")
")") ")
")")
")
")
")")
")")
")
")
#*
")
")
")")
")") ")
")
")") ")
")
")
")
")")
")
")
")")
")
#*
")
")
")
")
")
")
")
")
")")
")")
")
")
")")
")
")
!(
!(
!(
")
!(
!(
!( !( ")")
")
")
")")
")
")
")
")
")
#*
")
")
")
")
")
")
")
")
")")
")
!(
")
")
!(
!(!(
")
")
!(
!(
")
")
")
")
")
")
")
")
")
")
")
")
")
")")
")")
")
")
")")
")")
")")")
")
")")
")")
")
#*#*
")
") #*") ")
")")
!(
")
!(!(
#*#*
")")")")")
")
")
")
")
")
")
")#*#*")")
")")")
")")")")
")")")")
")")
")")
")
")
")
")
")
")
")
")
")")
")
")")
")
")")")
")")")")")")")
")")")")
")
")
")
")
")
")
")")
")")
")
")
") ")")
") ")
") ") ")")
")
")
")")")")
")")")")")")")")")")")")
")")")")")")")
")")")")")")")")
")")")")")
") ")")")")")")
")") ")
")
")
")")
")")")") ")
")")")")")")")")")
")")")")")")")")")")") ")")")")")
")")")
")
")")
")") ")")") ")
")")")
")
")")
") ")
")")
")
")
!(
!(
")
")
")
")
")")
")") ")
")
")
")
")
")")
")
")
!(
")
")
")
")
")
")
")
")
")
")
")")
")")")
")
")
")
")")
!( !(
")
")
")")
")")
")")
")
")
")")
")
")")
")")
")") ")
")
")
")
!(")
")") ")
")
!(
!(
!(
!( ")
")
")
")
")
")")
")
")
")
")
")
")
")
")
")
")
")
!(
!(
!(
")
!(
")
")
")
")
")
")
")
")
")
")
")
")
")
")
")
")
")
")")")
")")")")
")")")
")")
")
")
")")
")")
")")")
")") ")")
")")
")")
")
")")")")
")")")")")")
")")
")")")
")
")")
")")
")")")
")
")
")")
")")
")
")")")
")")")
")")")
")") ")")
")")")
")")
")")
")
")
")
")
")")")")")")")
")
")
!(!(!(
")")")")")")")")")")")")")
")
")!(!(
!(
!(!(
")
")")
") !(")
")")") ")
")")
")")
")
")
")
")
")
")")
")
!(
")") ")
!(
!(
!(
!(
!(
")
!( !(
!(!(!(
!(
!(
")
!(
!(
!(!(!(!(
!(
!(!(
!(
")")")")")")
") ")")")")")")
")")")")")
")")")
")")")") ")")")")
")")")
")")")")")
") ")")")
")")")")")")") ")
")")
")
")")
")
")")")
")")
")")
")
")")")")")")
")
")")
")")")
")")")")")
")")
")")")
")")")")")
")
")")")")")")")")")")")")")")")")
")
")")")")")")")")
")
")")") ")
") ")")") ")")
")")")
")")")")")")")
")")")")
")")")")
")
")")")
")")")
")
")")")
")
")
")
")
")")
")")")
")
")
!(
!(
!(
!(
!(")!(
!(
")
")
")")
")
")
!(
")
")
")
!(
!(
")
")
")")
!(
")
")
")
")
")
")
")
")
")
")
")
")
")
!(
!(
!(
!( !(
")
")
")
")
")
")")
")
")
")")")")
")
")")")
")")
")
")
")")
")
#*") #*
")
")
")
")
")
")
")")")
!(
")
")
") ")
")
")
")
")
")
")
")
!(
")
")
")
")
")
")
")")
!(
")
")
")
")
!(
")
")
")
!(
!(
!( ")
!(
!(
")
")
!(
Ethnicities and Historic Plough Use
Legend
!( Aboriginal plough use#* Plough existed, but not aboriginal") Plough absent
Missing data
Figure 1: Historic plough use among ethnic groups in Murdock’s Ethnographic Atlas.
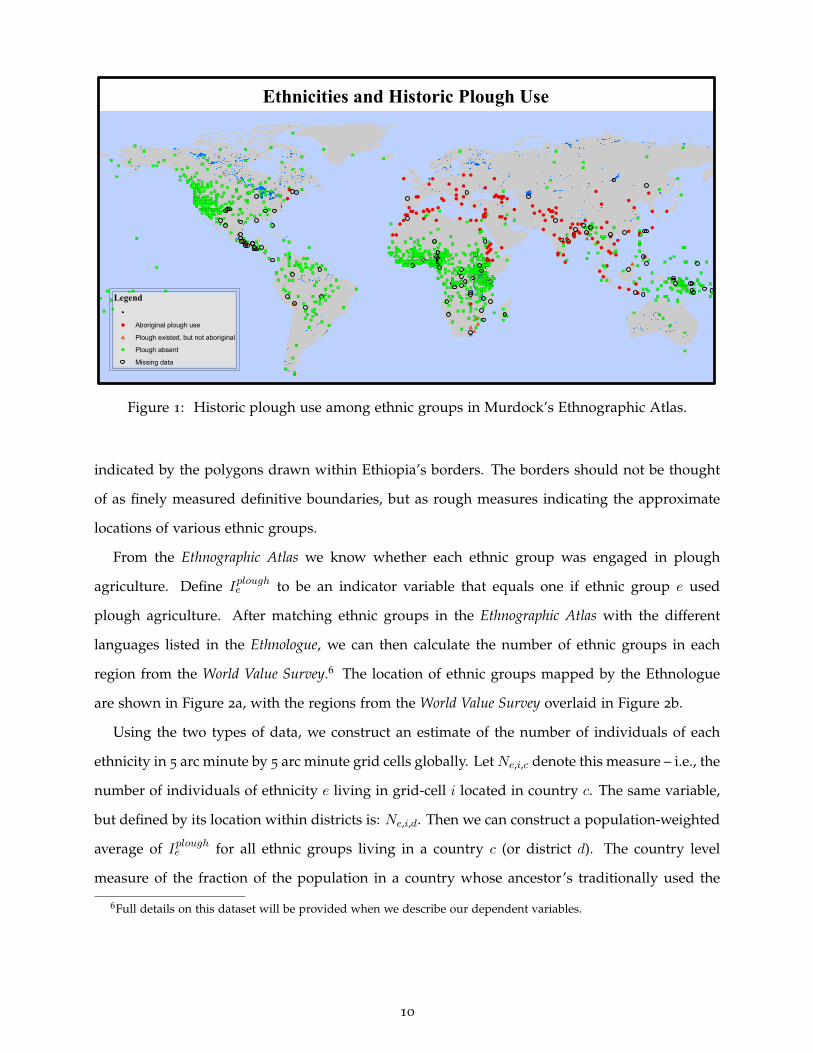
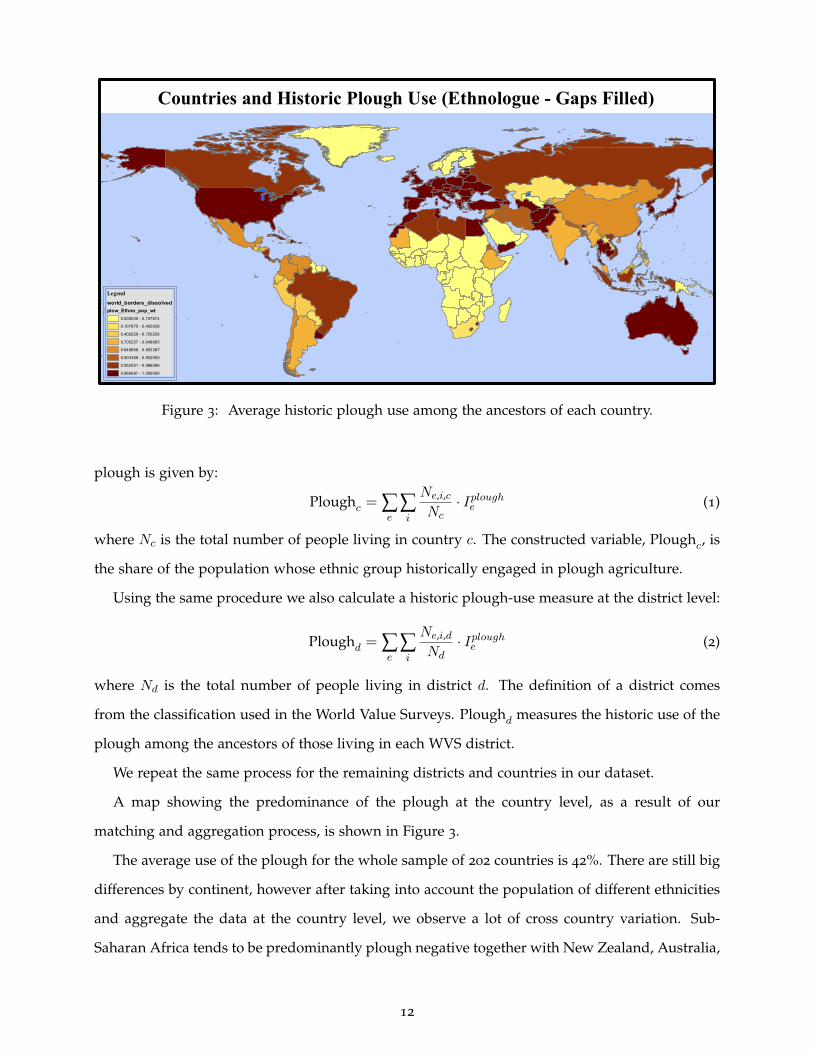
indicated by the polygons drawn within Ethiopia’s borders. The borders should not be thought
of as finely measured definitive boundaries, but as rough measures indicating the approximate
locations of various ethnic groups.
From the Ethnographic Atlas we know whether each ethnic group was engaged in plough
agriculture. Define Iploughe to be an indicator variable that equals one if ethnic group e used
plough agriculture. After matching ethnic groups in the Ethnographic Atlas with the different
languages listed in the Ethnologue, we can then calculate the number of ethnic groups in each
region from the World Value Survey.6 The location of ethnic groups mapped by the Ethnologue
are shown in Figure 2a, with the regions from the World Value Survey overlaid in Figure 2b.
Using the two types of data, we construct an estimate of the number of individuals of each
ethnicity in 5 arc minute by 5 arc minute grid cells globally. LetNe,i,c denote this measure – i.e., the
number of individuals of ethnicity e living in grid-cell i located in country c. The same variable,
but defined by its location within districts is: Ne,i,d. Then we can construct a population-weighted
average of Iploughe for all ethnic groups living in a country c (or district d). The country level
measure of the fraction of the population in a country whose ancestor’s traditionally used the
6Full details on this dataset will be provided when we describe our dependent variables.
10
4
LegendEthnologue languages
(a) Population density and ethnic groups
4
LegendEthnic boundaries
Ethnic boundariesDistrict boundaries
District boundaries
(b) Population density, ethnic groups, and WVS district boundaries
Figure 2: Populations, ethnic groups, and WVS districts within Ethiopia.
11
Countries and Historic Plough Use (Ethnologue - Gaps Filled)
Legendworld_borders_dissolvedplow_Ethno_pop_wt
0.000000 - 0.1076740.107675 - 0.4020280.402029 - 0.7052560.705257 - 0.8488650.848866 - 0.9033870.903388 - 0.9525500.952551 - 0.9860860.986087 - 1.000000
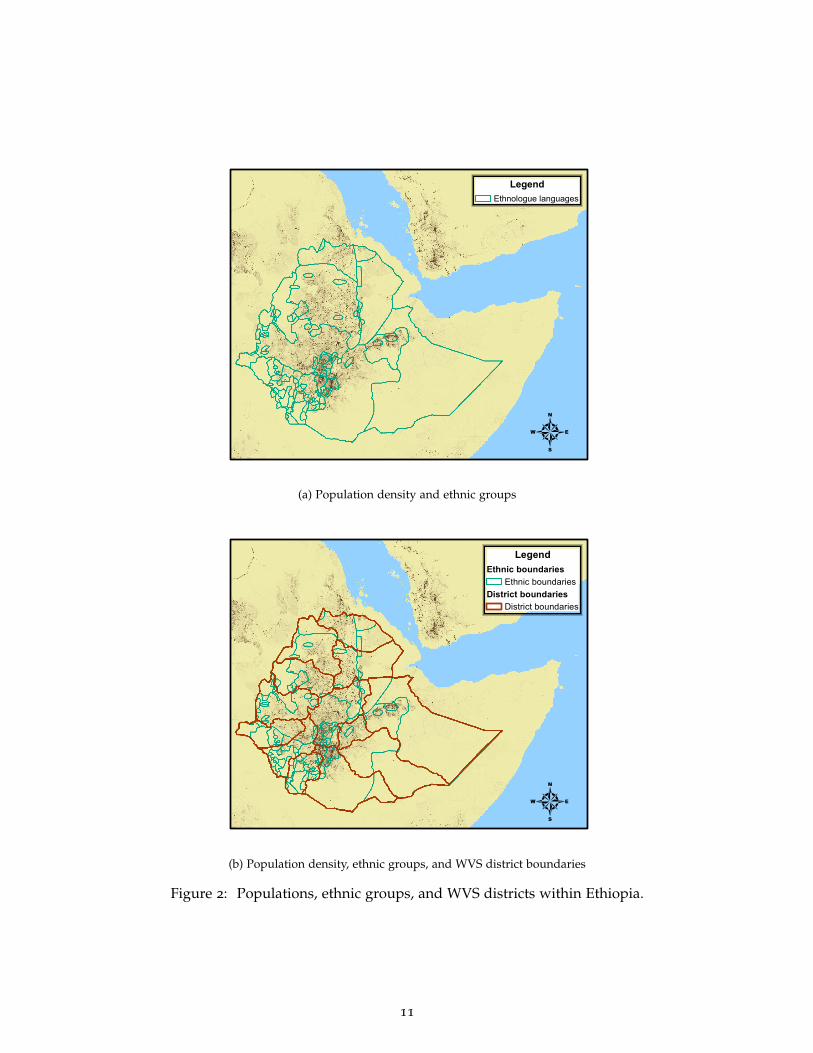
Figure 3: Average historic plough use among the ancestors of each country.
plough is given by:
Ploughc = ∑e
∑i
Ne,i,c
Nc· Iploughe (1)
where Nc is the total number of people living in country c. The constructed variable, Ploughc, is
the share of the population whose ethnic group historically engaged in plough agriculture.
Using the same procedure we also calculate a historic plough-use measure at the district level:
Ploughd = ∑e
∑i
Ne,i,d
Nd· Iploughe (2)
where Nd is the total number of people living in district d. The definition of a district comes
from the classification used in the World Value Surveys. Ploughd measures the historic use of the
plough among the ancestors of those living in each WVS district.
We repeat the same process for the remaining districts and countries in our dataset.
A map showing the predominance of the plough at the country level, as a result of our
matching and aggregation process, is shown in Figure 3.
The average use of the plough for the whole sample of 202 countries is 42%. There are still big
differences by continent, however after taking into account the population of different ethnicities
and aggregate the data at the country level, we observe a lot of cross country variation. Sub-
Saharan Africa tends to be predominantly plough negative together with New Zealand, Australia,
12

Greenland and most of the Northern European countries.7 At the other extreme, the majority
of the European countries used the plough historically, together with many Northern African
countries and many Asian countries such as Afghanistan, Armenia, Bhutan, Japan, Pakistan,
Korea. Countries in with plough-use that varied among the populations include South Africa,
Bolivia, the Philippines, Ethiopia, Myanmar, Kyrgyz Republic, Malaysia, Mongolia, Mauritania,
India, China, Eritrea and Syria.
B. Historic plough-positive and plough-negative environments (instruments)
The anthropological literature has identified three determinants for the adoption of the plough.
Hans Bobek (1962) focuses on certain geographic endowments: if these preconditions are met,
the plough is adopted. In particular he focuses on the availability of large domesticated animals
and the existence of an appropriate land surface that is not too steep, rocky, swampy, frozen
or obstructed by vegetation. The second determinant, which has been emphasized by Boserup
(1970), is population density together with the degree of fallowing. Both are important deter-
minants of plough adoption. The third determinant is the physical conditions of the soil and
climate which determine the type of crops that could grow in different locations (Pryor, 1985).
Because the plough requires a high up-front fixed cost, it is best suited to specific-crops, referred
to as plough-positive crops, that produce relatively low yields on larger plots of land. Example
of plough-positive crops include wheat, teff, barley and rye. Plough-negative crops, on the other
hand, yield high outputs on small plots of land, and therefore benefit less from the use of the
plough. Examples of plough-negative crops include sorghum, maize, millet, roots and tubers,
and tree crops.
There has been a lively debate about which determinant is the “correct” one, but most likely
all three determinants are important. Our IV strategy uses the suitability of the geo-climatic con-
ditions of an ethnic groups historic location for cultivating plough-positive and plough-negative
crops, while controlling for a locations overall agricultural suitability. Our identification relies on
the assumption that holding overall crop productivity, the type of crops a location is endowed
with only impacts long-term gender attitudes through the adoption of the plough for cultivation.
7It is interesting to note that female labor force participation today is the highest in Europe in Northern Europeancountries; their original ethnic group was one of the few who did not adopt the plough historically in Western Europe.
13
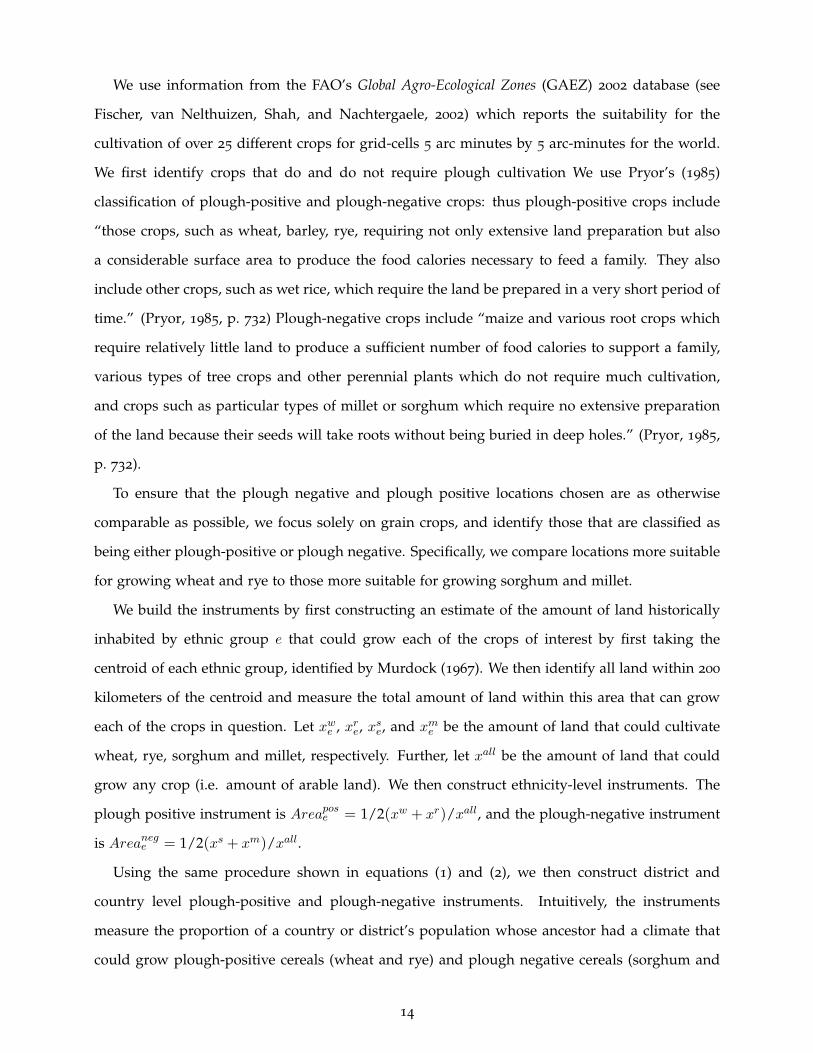
We use information from the FAO’s Global Agro-Ecological Zones (GAEZ) 2002 database (see
Fischer, van Nelthuizen, Shah, and Nachtergaele, 2002) which reports the suitability for the
cultivation of over 25 different crops for grid-cells 5 arc minutes by 5 arc-minutes for the world.
We first identify crops that do and do not require plough cultivation We use Pryor’s (1985)
classification of plough-positive and plough-negative crops: thus plough-positive crops include
“those crops, such as wheat, barley, rye, requiring not only extensive land preparation but also
a considerable surface area to produce the food calories necessary to feed a family. They also
include other crops, such as wet rice, which require the land be prepared in a very short period of
time.” (Pryor, 1985, p. 732) Plough-negative crops include “maize and various root crops which
require relatively little land to produce a sufficient number of food calories to support a family,
various types of tree crops and other perennial plants which do not require much cultivation,
and crops such as particular types of millet or sorghum which require no extensive preparation
of the land because their seeds will take roots without being buried in deep holes.” (Pryor, 1985,
p. 732).
To ensure that the plough negative and plough positive locations chosen are as otherwise
comparable as possible, we focus solely on grain crops, and identify those that are classified as
being either plough-positive or plough negative. Specifically, we compare locations more suitable
for growing wheat and rye to those more suitable for growing sorghum and millet.
We build the instruments by first constructing an estimate of the amount of land historically
inhabited by ethnic group e that could grow each of the crops of interest by first taking the
centroid of each ethnic group, identified by Murdock (1967). We then identify all land within 200
kilometers of the centroid and measure the total amount of land within this area that can grow
each of the crops in question. Let xwe , xre, xse, and xme be the amount of land that could cultivate
wheat, rye, sorghum and millet, respectively. Further, let xall be the amount of land that could
grow any crop (i.e. amount of arable land). We then construct ethnicity-level instruments. The
plough positive instrument is Areapose = 1/2(xw + xr)/xall, and the plough-negative instrument
is Areanege = 1/2(xs + xm)/xall.
Using the same procedure shown in equations (1) and (2), we then construct district and
country level plough-positive and plough-negative instruments. Intuitively, the instruments
measure the proportion of a country or district’s population whose ancestor had a climate that
could grow plough-positive cereals (wheat and rye) and plough negative cereals (sorghum and
14
millet).
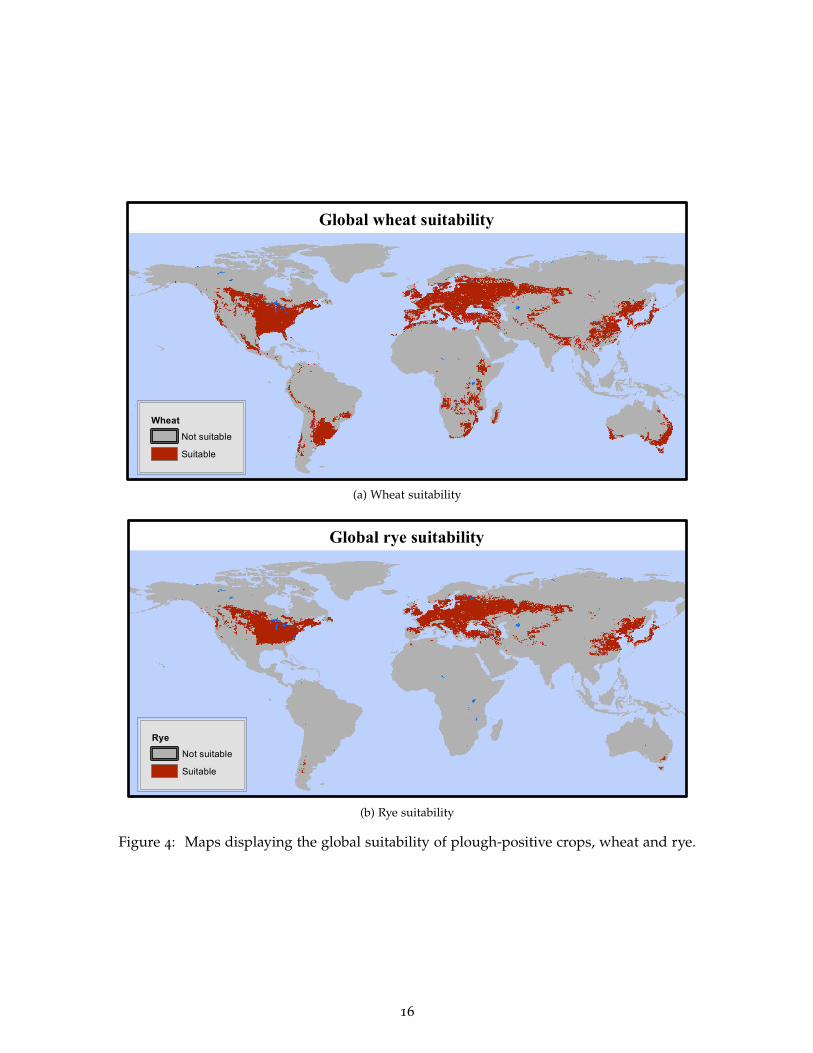
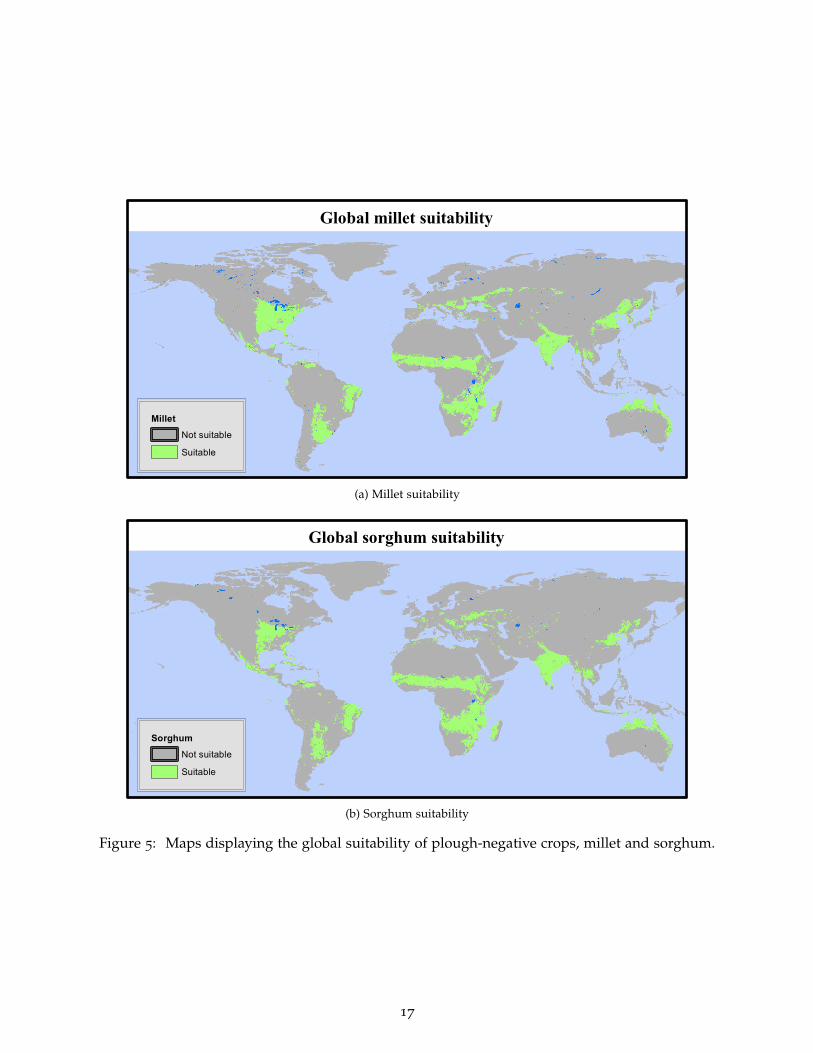
The geographic locations suitable for the cultivation of plough-positive and plough-negative
crops are shown in Figures 4 and 5. Figure 4 shows the locations in the world that are classified
as being suitable for the cultivation of wheat and rye, while Figure 5 shows suitability for millet
and sorghum. A number of points are clear from the maps. First, there are many parts of
the world that can grow plough-positive crops, but not plough-negative crops and vice versa.
Therefore, since there is variation in locations relative suitability for growing each crop-type, there
is potential for some predictive power. Second, relative to plough-positive crops, plough-negative
crops appear to be relatively well suited for tropical and subtropical climates and plough-positive
crops for temperate climate. If these differences in climates caused other important differences
between societies which affect gender attitudes today, then the exclusion restriction will not be
satisfied. Motivated by this concern, throughout our analysis, we control for the proportion of
land historically inhabited by an ethnic group that was either tropical or subtropical. We also
control for a number of historic measures of political/economic development, which may have
been correlated with tropical climate.
Finally, we also control for the other determinants of plough use that have been identified in
the literature. Specifically, we control for a measure of historic population density as measured by
settlement patterns. We also control for overall agricultural suitability, which it has been argued,
affected the adoption of the plough.
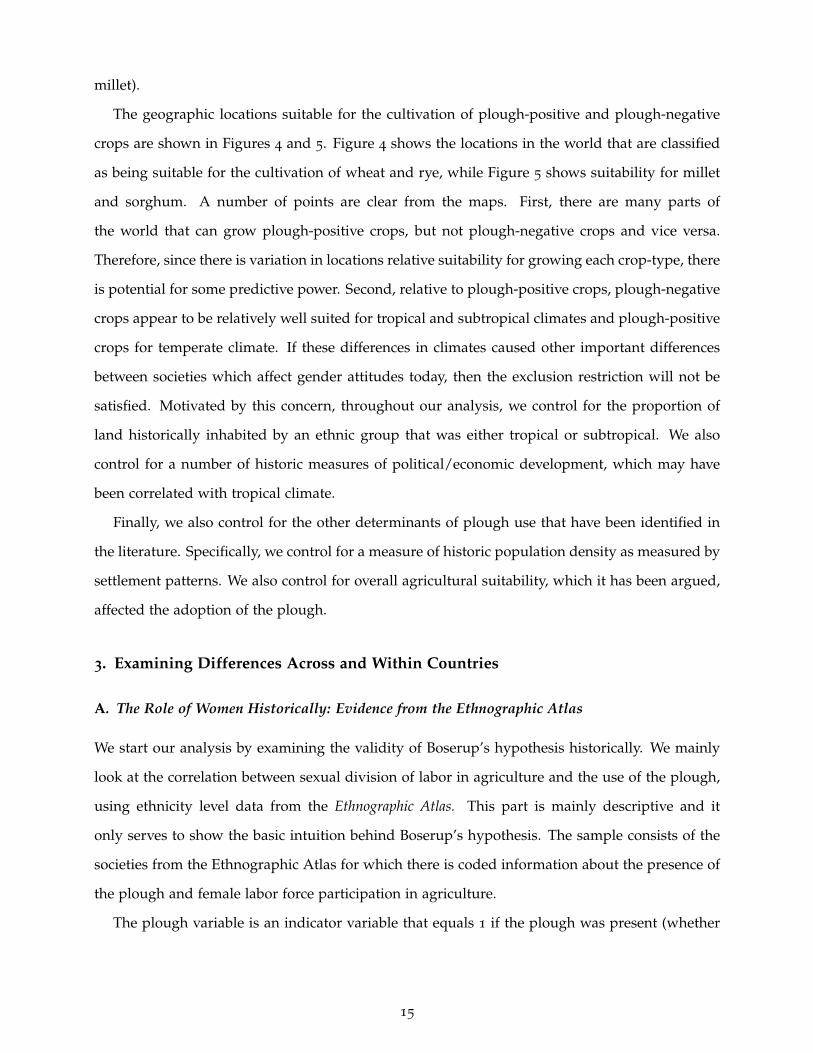
3. Examining Differences Across and Within Countries
A. The Role of Women Historically: Evidence from the Ethnographic Atlas
We start our analysis by examining the validity of Boserup’s hypothesis historically. We mainly
look at the correlation between sexual division of labor in agriculture and the use of the plough,
using ethnicity level data from the Ethnographic Atlas. This part is mainly descriptive and it
only serves to show the basic intuition behind Boserup’s hypothesis. The sample consists of the
societies from the Ethnographic Atlas for which there is coded information about the presence of
the plough and female labor force participation in agriculture.
The plough variable is an indicator variable that equals 1 if the plough was present (whether
15
Global wheat suitability
WheatNot suitableSuitable
(a) Wheat suitability
Global rye suitability
RyeNot suitableSuitable
(b) Rye suitability
Figure 4: Maps displaying the global suitability of plough-positive crops, wheat and rye.
16
Global millet suitability
MilletNot suitableSuitable
(a) Millet suitability
Global sorghum suitability
SorghumNot suitableSuitable
(b) Sorghum suitability
Figure 5: Maps displaying the global suitability of plough-negative crops, millet and sorghum.
17
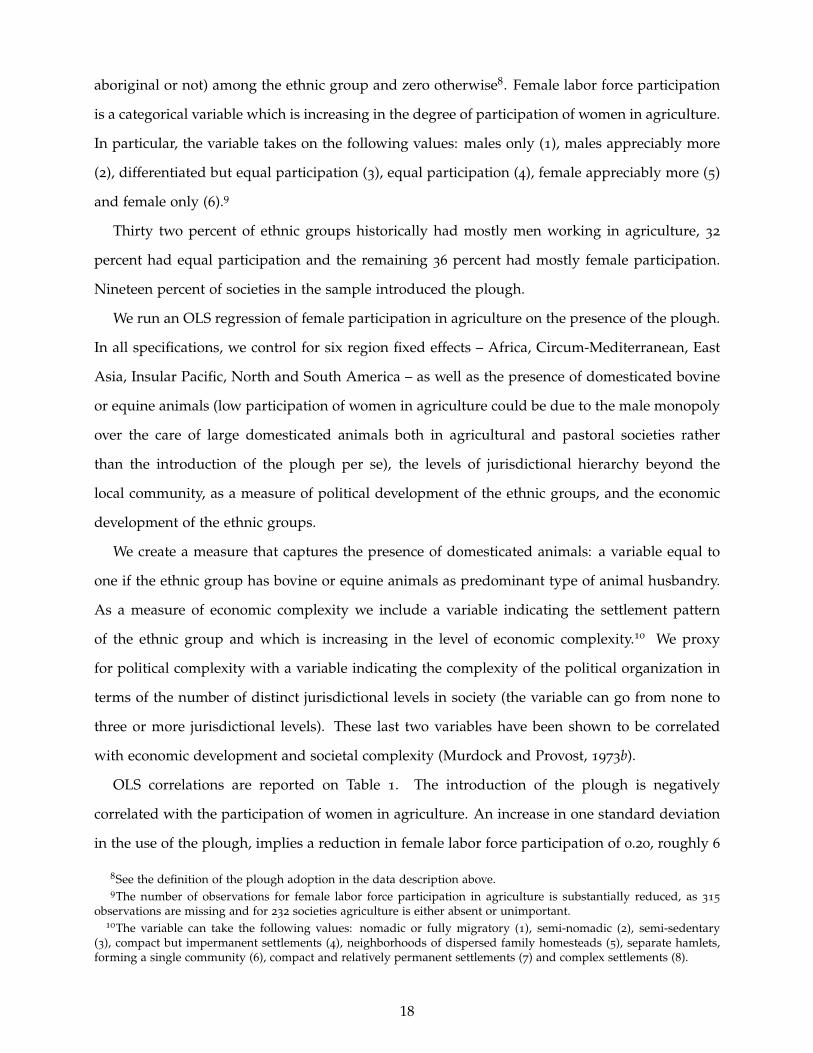
aboriginal or not) among the ethnic group and zero otherwise8. Female labor force participation
is a categorical variable which is increasing in the degree of participation of women in agriculture.
In particular, the variable takes on the following values: males only (1), males appreciably more
(2), differentiated but equal participation (3), equal participation (4), female appreciably more (5)
and female only (6).9
Thirty two percent of ethnic groups historically had mostly men working in agriculture, 32
percent had equal participation and the remaining 36 percent had mostly female participation.
Nineteen percent of societies in the sample introduced the plough.
We run an OLS regression of female participation in agriculture on the presence of the plough.
In all specifications, we control for six region fixed effects – Africa, Circum-Mediterranean, East
Asia, Insular Pacific, North and South America – as well as the presence of domesticated bovine
or equine animals (low participation of women in agriculture could be due to the male monopoly
over the care of large domesticated animals both in agricultural and pastoral societies rather
than the introduction of the plough per se), the levels of jurisdictional hierarchy beyond the
local community, as a measure of political development of the ethnic groups, and the economic
development of the ethnic groups.
We create a measure that captures the presence of domesticated animals: a variable equal to
one if the ethnic group has bovine or equine animals as predominant type of animal husbandry.
As a measure of economic complexity we include a variable indicating the settlement pattern
of the ethnic group and which is increasing in the level of economic complexity.10 We proxy
for political complexity with a variable indicating the complexity of the political organization in
terms of the number of distinct jurisdictional levels in society (the variable can go from none to
three or more jurisdictional levels). These last two variables have been shown to be correlated
with economic development and societal complexity (Murdock and Provost, 1973b).
OLS correlations are reported on Table 1. The introduction of the plough is negatively
correlated with the participation of women in agriculture. An increase in one standard deviation
in the use of the plough, implies a reduction in female labor force participation of 0.20, roughly 6
8See the definition of the plough adoption in the data description above.9The number of observations for female labor force participation in agriculture is substantially reduced, as 315
observations are missing and for 232 societies agriculture is either absent or unimportant.10The variable can take the following values: nomadic or fully migratory (1), semi-nomadic (2), semi-sedentary
(3), compact but impermanent settlements (4), neighborhoods of dispersed family homesteads (5), separate hamlets,forming a single community (6), compact and relatively permanent settlements (7) and complex settlements (8).
18

Table 1: Historic female participation in agriculture.
(1) (2) (3)
Historic plough use -‐1.199*** -‐0.926*** -‐0.479***
(0.124) (0.179) (0.184)
Absolute Latitude -‐0.011*** 0.001
(0.004) (0.001)
Domesticated animals 0.040 -‐0.016
(0.122) (0.132)
Political hierarchies -‐0.016 -‐0.023
(0.055) (0.056)
Economic complexity -0.098*** -‐0.106***
(0.038) (0.038)
Region fixed effects No Yes
Observations 713 698 698
R-squared 0.11 0.11 0.16
Dep var: Historic female participation in agriculture
Notes: The unit of observation is an ethnicity. Coefficients are reported with robust standard errorsin brackets.
percent of the sample average of labor force participation in agriculture.
B. Country-level OLS estimates
We begin by examining the relationship between current measures of gender attitudes and historic
plough use at the country level. Our country estimating equations take the following form:
yc = α+ β Ploughc + XCcΓ + XH
cΠ + εc (3)
where c denotes countries, Ploughc is our measure of the historic use of the plough among the
ancestors of the citizens in country c, and XCc and XH
c are vector of country-level current and
historic ethnographic control variables. XCc includes the natural log of a country’s real per capita
GDP measured in 2000, as well as the variable squared. Controlling for per capita income is im-
portant since cultural evolution within each culture is influenced by economic development. Here
we are after the cross cultural differences which despite economic development, persist over time.
We also include an indicator variable that equals one if the country was formerly communist. The
latter is important because the communist ideology minimized the role of the family and made
gender equality a critical prescription.11 The historic ethnographic controls included in XHc are
11Alesina (2007) show how the impact of communist regimes on individual beliefs can be long lasting.
19

agricultural suitability, the presence of domesticated bovine or equine animals, the presence of a
tropical climate (either tropical or subtropical), the levels of jurisdictional hierarchy beyond the
local community, and the economic development of the ethnic groups currently living within the
country (defined above). The variables are meant to capture important historic characteristics of
ethnic groups, which if uncontrolled for, may bias our estimates. We construct these in exactly
the same manner as we construct the historic plough use variable. Using the structure of either
equation (1) or (2), we constructing a population weighted country average of the variable in
question.
Table 2 shows the results. In column 1 the dependent variable is a measure of gender attitudes
in a country. We examine two questions that quantify individuals’ attitudes about gender roles.
In the first question respondents are given the following statement: “When jobs are scarce, men
should have more right to a job than women”. The respondents are then asked to choose between
(i) agree, (ii) neither (iii) disagree. We drop the observations in which the respondents answer
‘neither’, and code ‘disagree’ as 0 and ‘agree’ as 1. In the second question, respondents are given
the following statement “Being a housewife is just as fulfilling as working for pay”. Respondents
then chose among the following responses that best represented their view: (1) strongly disagree,
(2) disagree, (3) agree, and (4) strongly disagree. We then combine both variables into a single
measure using a principal components analysis. The measure is constructed so that it is increasing
in beliefs that women should specialize in home production rather than market work (i.e. unequal
gender roles).
The data are taken from the World Value Survey, a compilation of national individual-level
surveys on a wide variety of topics and carried out five times (in 1981-1984, 1990-1993, 1995-1997,
1999-2004 and 2005–2007). The coverage varies depending on the wave (starting with 22 countries
in 1980, reaching 81 countries in the fourth wave and 57 in the fifth). The questionnaire contains
information on different types of attitudes and preferences, as well as information on standard
demographic characteristics, such as gender, age, education, labor market status, income, religion,
etc. For the cross country analysis we use the fourth wave as it maximizes the number of countries
in which the questions in which we are interested in are asked. We collapsed the data at the
country level using the weights provided in the survey.
In column 2, the dependent variable is a country’s female labor force participation rate in
2000. The dependent variable in column 3 is the share of non-production workers in the economy
20
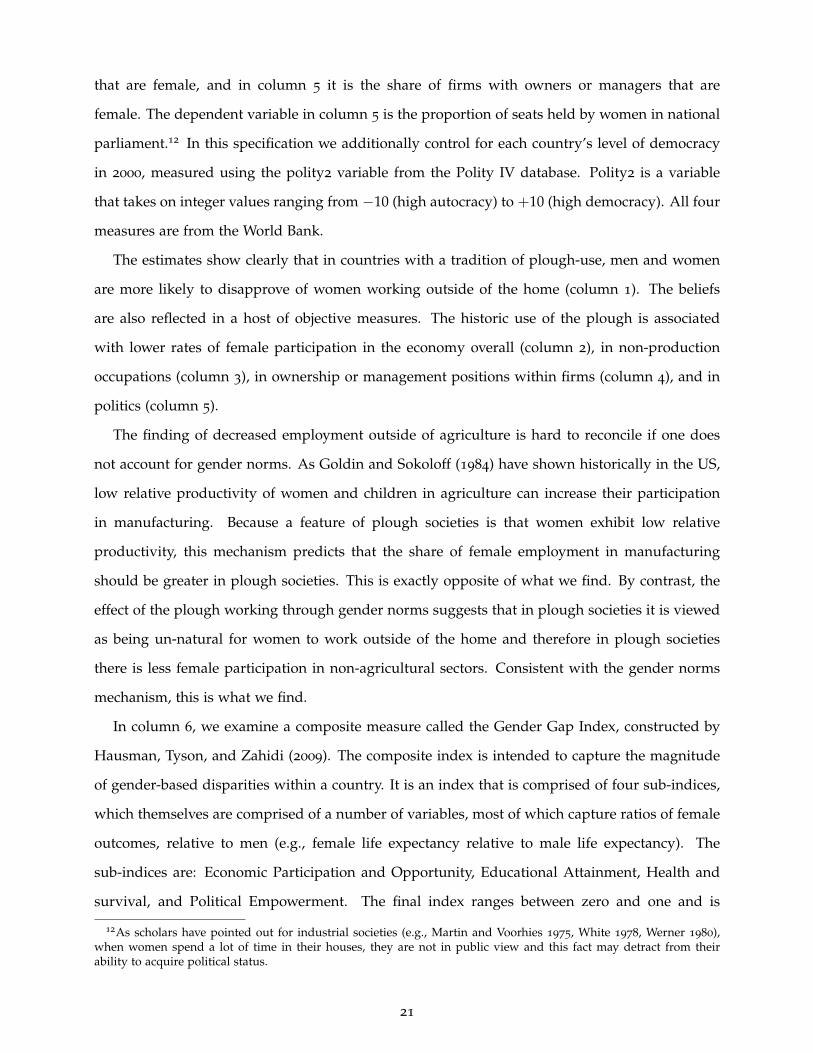
that are female, and in column 5 it is the share of firms with owners or managers that are
female. The dependent variable in column 5 is the proportion of seats held by women in national
parliament.12 In this specification we additionally control for each country’s level of democracy
in 2000, measured using the polity2 variable from the Polity IV database. Polity2 is a variable
that takes on integer values ranging from −10 (high autocracy) to +10 (high democracy). All four
measures are from the World Bank.
The estimates show clearly that in countries with a tradition of plough-use, men and women
are more likely to disapprove of women working outside of the home (column 1). The beliefs
are also reflected in a host of objective measures. The historic use of the plough is associated
with lower rates of female participation in the economy overall (column 2), in non-production
occupations (column 3), in ownership or management positions within firms (column 4), and in
politics (column 5).
The finding of decreased employment outside of agriculture is hard to reconcile if one does
not account for gender norms. As Goldin and Sokoloff (1984) have shown historically in the US,
low relative productivity of women and children in agriculture can increase their participation
in manufacturing. Because a feature of plough societies is that women exhibit low relative
productivity, this mechanism predicts that the share of female employment in manufacturing
should be greater in plough societies. This is exactly opposite of what we find. By contrast, the
effect of the plough working through gender norms suggests that in plough societies it is viewed
as being un-natural for women to work outside of the home and therefore in plough societies
there is less female participation in non-agricultural sectors. Consistent with the gender norms
mechanism, this is what we find.
In column 6, we examine a composite measure called the Gender Gap Index, constructed by
Hausman, Tyson, and Zahidi (2009). The composite index is intended to capture the magnitude
of gender-based disparities within a country. It is an index that is comprised of four sub-indices,
which themselves are comprised of a number of variables, most of which capture ratios of female
outcomes, relative to men (e.g., female life expectancy relative to male life expectancy). The
sub-indices are: Economic Participation and Opportunity, Educational Attainment, Health and
survival, and Political Empowerment. The final index ranges between zero and one and is
12As scholars have pointed out for industrial societies (e.g., Martin and Voorhies 1975, White 1978, Werner 1980),when women spend a lot of time in their houses, they are not in public view and this fact may detract from theirability to acquire political status.
21

Table 2: Country level OLS estimates.
Gender role attitudes FLFP
Share of female full-time non-
production workers
Share of firms with some
female ownership
Females in politics
Gender score gap
Sex ratio at birth
(1) (2) (3) (4) (5) (6) (7)
Historic plough use 0.713*** -15.578*** -4.376*** -13.799*** -6.535*** -0.027* 0.020***(0.173) (3.767) (1.259) (4.511) (2.186) (0.015) (0.005)
Historic controls:Agricultural suitability yes yes yes yes yes yes yesDomesticated animals yes yes yes yes yes yes yesTropics yes yes yes yes yes yes yesPolitical hierarchies yes yes yes yes yes yes yesEconomic complexity yes yes yes yes yes yes yes
Contemporary controls:ln income, ln income2 yes yes yes yes yes yes yesCommunism indicator yes yes yes yes yes yes yesPolity 2 no no no no yes no no
Observations 81 153 83 103 122 123 151R-squared 0.40 0.39 0.53 0.19 0.33 0.37 0.31Notes : OLS estimates are reported with robust standard errors in brackets. The unit of observation is a country. ***, ** and * indicatesignificance at the 1, 5 and 10% levels.
Dependent variable
increasing in gender equality. The estimates in column 6 show that countries with a history
of plough agriculture have a lower score, indicating greater gender inequality.
The final outcome variable considered, reported in column 7, is the male-to-female sex ratio at
birth. Sex ratio at birth has recently emerged as an indicator of certain kinds of sex discrimination
in some countries. For instance, high sex ratios at birth in some Asian countries are now attributed
to sex-selective abortion and infanticide due to a strong preference for sons. By this measure as
well, the results indicate there is a greater bias towards men in countries that historically relied
on plough agriculture.
The coefficients for our control variables are generally as expected. For example we find
evidence of a U-relationship between per capita income and female participation in the labor
force participation, as well as the other outcomes. This is consistent with previous studies that
also find this same non-monotonic relationship (see e.g., Goldin, 1995). We also consistently find
that countries that experience a period of communism have higher rates of female labor force
participation.
22

C. Country-level IV estimates
Our IV strategy relies on the use of the historic suitability of ethnic groups’ locations for the
cultivation of plough-positive cereal crops or plough-negative crops. Table 3 reports IV estimates
of the specifications from Table 2. The first stage estimates are in the lower panel and the second
stage estimates are in the top panel. Suitability for the cultivation of plough-positive cereals
is positively correlated with the adoption of the plough, while suitability for the cultivation
of plough-negative cereals is negatively correlated with the plough. In all specifications, the
difference between the two coefficients is statistically significant, while they are both jointly
different from zero. In most of the specifications but one, the Hausman test cannot reject the
consistency of OLS at a 5% level or less.
The IV coefficients confirm the OLS estimates. Historic plough use is association with less
female participation in non-household activities, attitudes of gender inequality, and a sex ratio
that is biased towards boys. The magnitude of the IV coefficients is greater than the OLS
coefficients. This is most likely explained by the presence of omitted factors that bias the OLS
coefficient towards zero. All else equal, historically advanced societies would have been more
likely to adopt the plough. Further, historically advanced societies are more likely to also be
advance today with higher per capita incomes and with more progressive attitudes about gender
roles. Therefore, omitted factors introduce a negative relationship between the historic plough use
and unequal gender attitudes that attenuate the true positive effect. Therefore, the OLS estimates
are biased towards zero relative to the IV estimates. A similar explanation also applies to our
other outcomes of interest.
Our IV strategy raises a number of concerns and potential caveats. One concern is that
environments relatively more suitable for the cultivation of plough-positive cereals tend to be
disproportionately located in temperate regions. However, recall that in all specifications, we
control for the existence of a tropical climate.
An important caveat for our IV strategy arises from the fact that the plough-positive and
plough-negative cereals that we use when constructing our instruments were all originally grown
in the Eastern hemisphere and were not cultivated in the Americas until after 1500. This is not
a concern to identification, but it is a fact that makes the first stage relationship weaker than it
would be otherwise. For the large proportion of the population in the Americas whose ancestors
are from the Eastern hemisphere, the instrument will provide predictive power. It is only for the
23

Table 3: Country level IV estimates.
Gender role attitudes FLFP
Share of female full-time non-
production workers
Share of firms with
some female
ownershipFemale in
politicsGender
score gapSex ratio at
birth(1) (2) (3) (4) (5) (6) (7)
Historic plough use 1.249* -31.94** -6.88** -17.40 -26.14** -0.080** 0.045**(0.664) (13.49) (3.15) (10.66) (11.07) (0.040) (0.021)
Historic controls:Agricultural suitability yes yes yes yes yes yes yesDomesticated animals yes yes yes yes yes yes yesTropics yes yes yes yes yes yes yesPolitical hierarchies yes yes yes yes yes yes yesEconomic complexity yes yes yes yes yes yes yes
Contemporary controls:ln income, ln income2 yes yes yes yes yes yes yesCommunism indicator yes yes yes yes yes yes yesPolity 2 no no no no yes no no
Observations 80 151 82 102 121 121 149R-squared 0.41 0.31 0.50 0.50 -0.04 0.25 0.21
Plough-positive environment 0.249* 0.381*** 0.625*** 0.714*** 0.427*** 0.380*** 0.379***(0.134) (0.124) (0.183) (0.164) (0.140) (0.130) (0.124)
Plough-negative environment -0.155 -0.068 -0.069 -0.038 -0.056 -0.254** -0.082(0.123) (0.093) (0.105) (0.102) (0.107) (0.098) (0.095)
Equal coeff (p-value) 0.01 0.00 0.00 0.00 0.00 0.00 0.00F -stat (excl instr) 3.32 5.93 7.07 10.34 5.74 9.41 6.06Hansen-J 0.24 0.21 0.06 0.00 0.88 0.06 0.24Hausman test (p-value) 0.229 0.073 0.324 0.662 0.024 0.073 0.235Notes : IV estimates are reported with robust standard errors in brackets. The unit of observation is a country. ***, ** and * indicatesignificance at the 1, 5 and 10% levels.
Second Stage
First Stage. Dependent variable: Historic plough use
24
indigenous populations of the Americas for which the instrument will not vary plough adoption.
This point should be kept in mind when interpreting the IV estimates as a local average treatment
effect (LATE). In other words, the estimates are an average effect among the ethnic groups whose
plough adoption was affected by the geo-climatic suitability for growing the cereal crops. Because
the crops were not indigenous to the Americas, we would not necessarily expect the indigenous
groups from the Americas to be within the group.
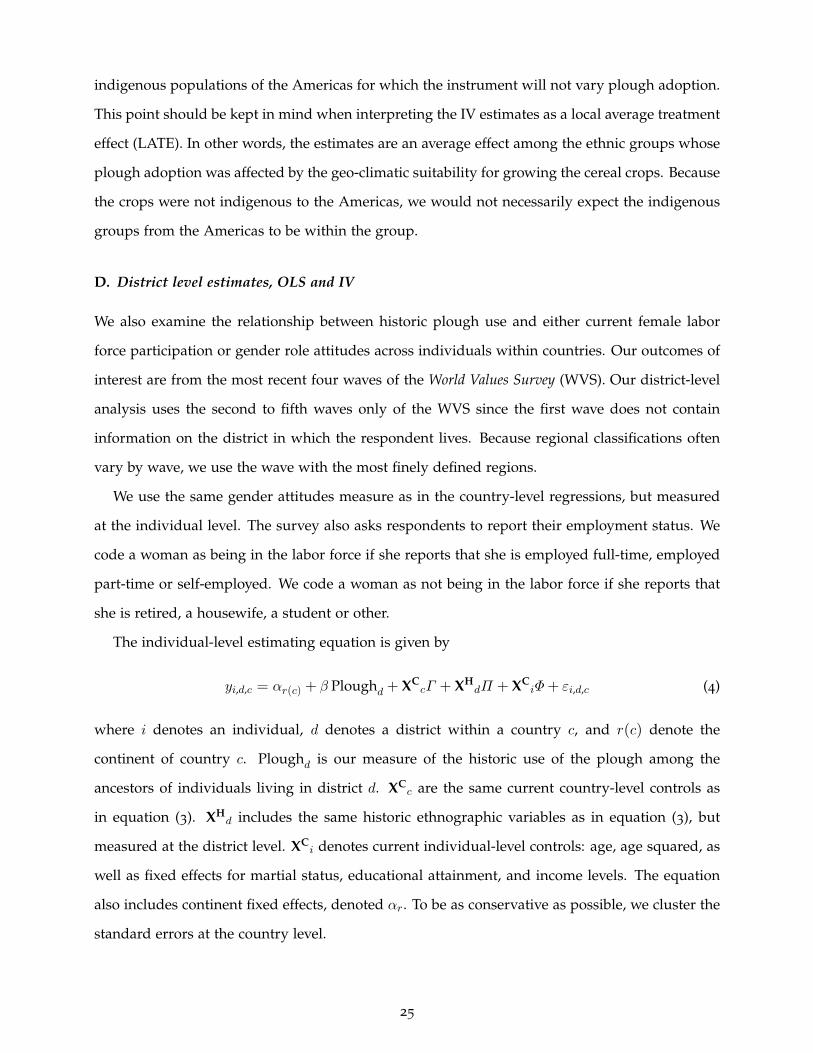
D. District level estimates, OLS and IV
We also examine the relationship between historic plough use and either current female labor
force participation or gender role attitudes across individuals within countries. Our outcomes of
interest are from the most recent four waves of the World Values Survey (WVS). Our district-level
analysis uses the second to fifth waves only of the WVS since the first wave does not contain
information on the district in which the respondent lives. Because regional classifications often
vary by wave, we use the wave with the most finely defined regions.
We use the same gender attitudes measure as in the country-level regressions, but measured
at the individual level. The survey also asks respondents to report their employment status. We
code a woman as being in the labor force if she reports that she is employed full-time, employed
part-time or self-employed. We code a woman as not being in the labor force if she reports that
she is retired, a housewife, a student or other.
The individual-level estimating equation is given by
yi,d,c = αr(c) + β Ploughd + XCcΓ + XH
dΠ + XCiΦ+ εi,d,c (4)
where i denotes an individual, d denotes a district within a country c, and r(c) denote the
continent of country c. Ploughd is our measure of the historic use of the plough among the
ancestors of individuals living in district d. XCc are the same current country-level controls as
in equation (3). XHd includes the same historic ethnographic variables as in equation (3), but
measured at the district level. XCi denotes current individual-level controls: age, age squared, as
well as fixed effects for martial status, educational attainment, and income levels. The equation
also includes continent fixed effects, denoted αr. To be as conservative as possible, we cluster the
standard errors at the country level.
25

Table 4: Individual-level OLS and IV estimates.
OLS IV OLS IV(1) (2) (3) (4)
Historic plough use -‐0.317*** -‐0.754*** 0.945*** 1.564***(0.045) (0.234) (0.115) (0.537)
Individual controls yes yes yes yes
Current country controls yes yes yes yes
Historic district controls yes yes yes yes
ObservaIons 38,376 38,034 62,379 62,379
R-‐squared 0.19 0.17 0.18 0.18
FLFP Gender aQtudes
Notes: The table reports IV and OLS esImates, with standard errors clustered at the district level. Theinstruments for the IV esImates are plough-‐posiIve climate and plough-‐negaIve cliamte. Individualcontrols are age, age squared, educaIon, gender (for gender aQtudes only), marital status, andincome. Current country controls include ln income, ln income squared and a communism indicatorvariable. Historic district controls include agricultural suitability, domesIcated animals, tropical areas,poliIcal hierarchies, and economic complexity. ***, ** and * indicate significance at the 1, 5 and 10%levels.
Table 4 reports the OLS and IV estimates of equation (4) are. The historic use of the plough is
associated with lower female labor force participation and less symmetric gender role attitudes.
Since the variation in the variable of interest is at the district level, we check that our results
hold if one aggregates all data from the individual to the district level and estimate a district level
version of equation (4).13 Table 5 reports the results. The results continue to hold looking across
district averages.
4. The Persistence of Culture: Evidence from US immigrants
It is possible that part of the long term effect of the historic use of the plough we have identified
may arise because historic plough-use may have facilitated the development of different forms of
welfare systems that are more or less conducive to the participation of women in market activities.
This channel could also reinforce the impact of the plough on female labor force participation and
gender role attitudes. To isolate the impact of the long lasting effects of the plough on individual’s
attitudes, beliefs, and preferences (i.e. culture) from impacts on the evolution of institutions,
we examine variation among immigrants within the US. Immigrants face the same institutional
13In the district level specification, we do not control for individual characteristics.
26
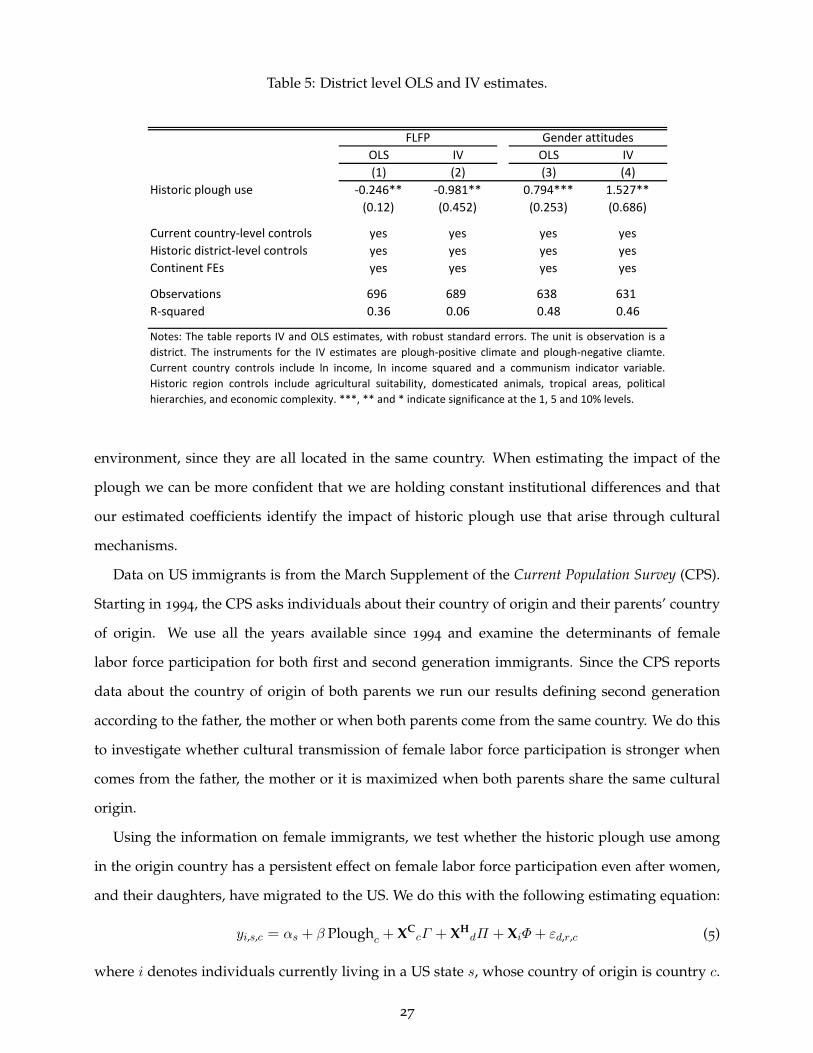
Table 5: District level OLS and IV estimates.
OLS IV OLS IV(1) (2) (3) (4)
Historic plough use -0.246** -0.981** 0.794*** 1.527**(0.12) (0.452) (0.253) (0.686)
Current country-level controls yes yes yes yesHistoric district-level controls yes yes yes yesContinent FEs yes yes yes yes
Observations 696 689 638 631R-squared 0.36 0.06 0.48 0.46
Notes: The table reports IV and OLS estimates, with robust standard errors. The unit is observation is adistrict. The instruments for the IV estimates are plough-positive climate and plough-negative cliamte.Current country controls include ln income, ln income squared and a communism indicator variable.Historic region controls include agricultural suitability, domesticated animals, tropical areas, politicalhierarchies, and economic complexity. ***, ** and * indicate significance at the 1, 5 and 10% levels.
FLFP Gender attitudes
environment, since they are all located in the same country. When estimating the impact of the
plough we can be more confident that we are holding constant institutional differences and that
our estimated coefficients identify the impact of historic plough use that arise through cultural
mechanisms.
Data on US immigrants is from the March Supplement of the Current Population Survey (CPS).
Starting in 1994, the CPS asks individuals about their country of origin and their parents’ country
of origin. We use all the years available since 1994 and examine the determinants of female
labor force participation for both first and second generation immigrants. Since the CPS reports
data about the country of origin of both parents we run our results defining second generation
according to the father, the mother or when both parents come from the same country. We do this
to investigate whether cultural transmission of female labor force participation is stronger when
comes from the father, the mother or it is maximized when both parents share the same cultural
origin.
Using the information on female immigrants, we test whether the historic plough use among
in the origin country has a persistent effect on female labor force participation even after women,
and their daughters, have migrated to the US. We do this with the following estimating equation:
yi,s,c = αs + β Ploughc + XCcΓ + XH
dΠ + XiΦ+ εd,r,c (5)
where i denotes individuals currently living in a US state s, whose country of origin is country c.
27

As in equation (3), Ploughc denotes the historic plough-use of those in country c. XCc denotes the
same vector of current country-level controls as in equation (3), and XHd includes the same historic
ethnographic variables as in equation (3). Xi indicates a vector of individual level controls, which
includes dummies for education, a quadratic for age and real personal income. The equation also
includes state of residence fixed effects, denoted αs. Because our variable of interest Ploughc only
varies at the country of origin-level, we cluster all standard errors at this level.
We estimate equation (5) using two different samples: all women and married women. For
each group, we run the specification for first generation and second generation, this last group is
identified by looking at father country of origin, mother country of origin and when both parents
come from the same country. We split the sample between all women and married women,
because married women normally display largest variation in work outcomes. In addition, when
we run our regressions only for married women we can control for the characteristics of the
husbands, that can play an important role in the decision of the wife to enter the labor market. In
particular we control for a quadratic in age, husband’s education and real income.
The OLS estimates show that female immigrants who have an ancestry of historic plough-use
have lower rates of female labor force participation within the US. The estimates also show that
the estimated effect fades over time for second generation when this is identified by looking at the
father country of origin. Further amongst second generation immigrants, the mother country’s
historic plough use appears to be a stronger determinant than the father’s. This is consistent with
norms about female behavior being most strongly transmitted from the mother to the daughter.
The strongest effect is felt when both parents are from the same country.
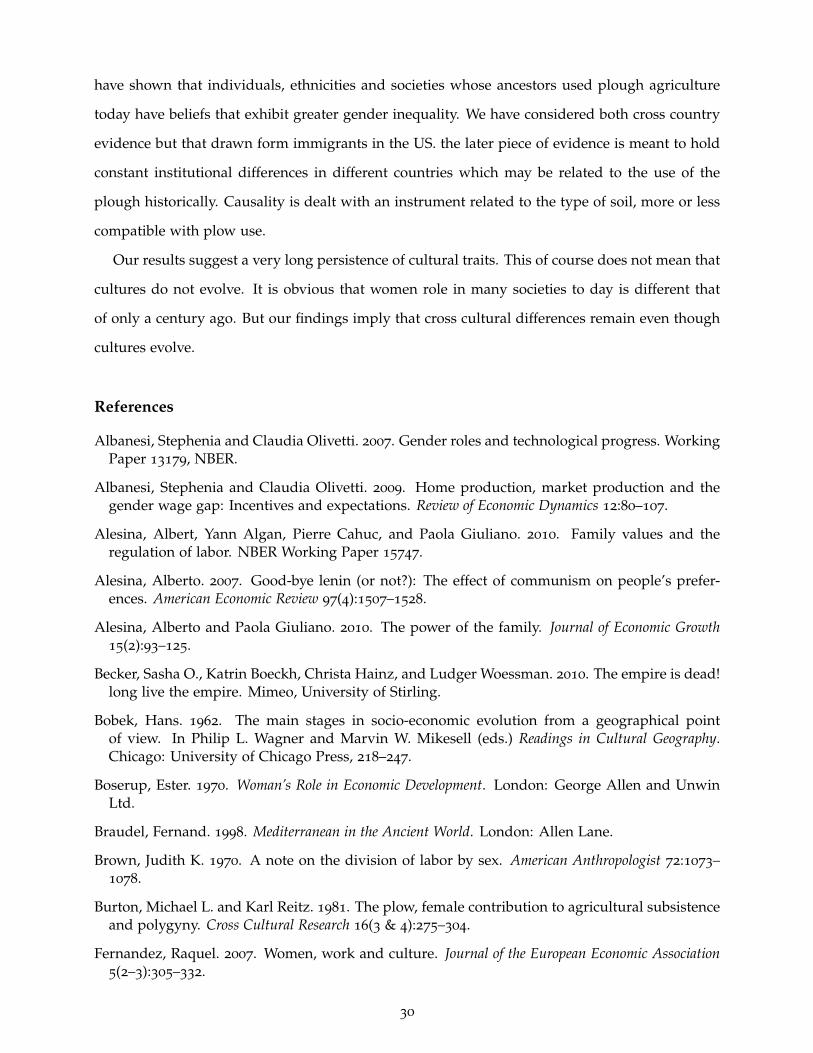
In columns 5–8 of Tables 6 and 7, we re-estimate the specification from columns 1–4, but restrict
the sample of female immigrants to only include women that are married. Because the historic
use of the plough is intimately connected to the division of labor within the family, we want to be
sure that the effects exist amongst females that are in a traditional family setting. The estimates
show that female immigrants from a country with historic plough use have lower levels of labor
force participation.
5. Conclusions
We have provided empirical evidence suggesting that contemporary cultural differences in atti-
tudes about the role of women in society have been shaped by historical forces. Specifically, we
28
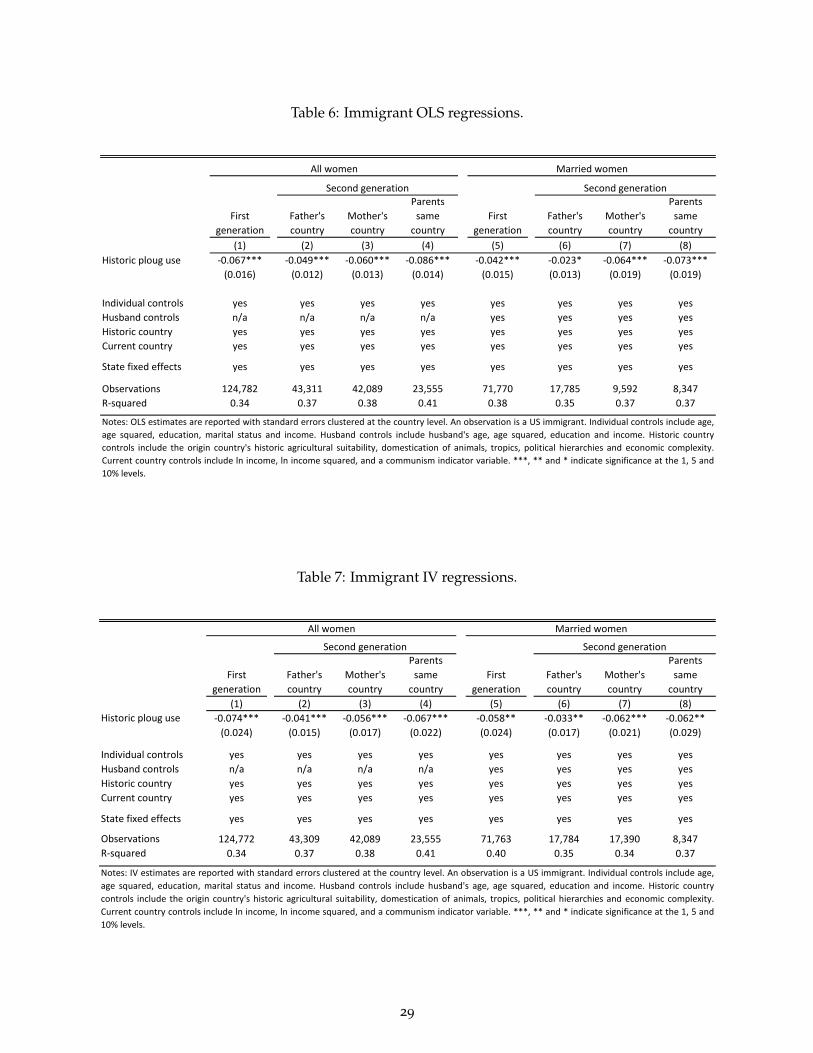
Table 6: Immigrant OLS regressions.
First generation
Father's country
Mother's country
Parents same
countryFirst
generationFather's country
Mother's country
Parents same
country(1) (2) (3) (4) (5) (6) (7) (8)
Historic ploug use -0.067*** -0.049*** -0.060*** -0.086*** -0.042*** -0.023* -0.064*** -0.073***(0.016) (0.012) (0.013) (0.014) (0.015) (0.013) (0.019) (0.019)
Individual controls yes yes yes yes yes yes yes yesHusband controls n/a n/a n/a n/a yes yes yes yesHistoric country yes yes yes yes yes yes yes yesCurrent country yes yes yes yes yes yes yes yes
State fixed effects yes yes yes yes yes yes yes yes
Observations 124,782 43,311 42,089 23,555 71,770 17,785 9,592 8,347R-squared 0.34 0.37 0.38 0.41 0.38 0.35 0.37 0.37
Notes: OLS estimates are reported with standard errors clustered at the country level. An observation is a US immigrant. Individual controls include age,age squared, education, marital status and income. Husband controls include husband's age, age squared, education and income. Historic countrycontrols include the origin country's historic agricultural suitability, domestication of animals, tropics, political hierarchies and economic complexity.Current country controls include ln income, ln income squared, and a communism indicator variable. ***, ** and * indicate significance at the 1, 5 and10% levels.
All women Married women
Second generation Second generation
Table 7: Immigrant IV regressions.
First generation
Father's country
Mother's country
Parents same
countryFirst
generationFather's country
Mother's country
Parents same
country(1) (2) (3) (4) (5) (6) (7) (8)
Historic ploug use -0.074*** -0.041*** -0.056*** -0.067*** -0.058** -0.033** -0.062*** -0.062**(0.024) (0.015) (0.017) (0.022) (0.024) (0.017) (0.021) (0.029)
Individual controls yes yes yes yes yes yes yes yesHusband controls n/a n/a n/a n/a yes yes yes yesHistoric country yes yes yes yes yes yes yes yesCurrent country yes yes yes yes yes yes yes yes
State fixed effects yes yes yes yes yes yes yes yes
Observations 124,772 43,309 42,089 23,555 71,763 17,784 17,390 8,347R-squared 0.34 0.37 0.38 0.41 0.40 0.35 0.34 0.37
Notes: IV estimates are reported with standard errors clustered at the country level. An observation is a US immigrant. Individual controls include age,age squared, education, marital status and income. Husband controls include husband's age, age squared, education and income. Historic countrycontrols include the origin country's historic agricultural suitability, domestication of animals, tropics, political hierarchies and economic complexity.Current country controls include ln income, ln income squared, and a communism indicator variable. ***, ** and * indicate significance at the 1, 5 and10% levels.
Second generation Second generation
All women Married women
29
have shown that individuals, ethnicities and societies whose ancestors used plough agriculture
today have beliefs that exhibit greater gender inequality. We have considered both cross country
evidence but that drawn form immigrants in the US. the later piece of evidence is meant to hold
constant institutional differences in different countries which may be related to the use of the
plough historically. Causality is dealt with an instrument related to the type of soil, more or less
compatible with plow use.
Our results suggest a very long persistence of cultural traits. This of course does not mean that
cultures do not evolve. It is obvious that women role in many societies to day is different that
of only a century ago. But our findings imply that cross cultural differences remain even though
cultures evolve.
References
Albanesi, Stephenia and Claudia Olivetti. 2007. Gender roles and technological progress. WorkingPaper 13179, NBER.
Albanesi, Stephenia and Claudia Olivetti. 2009. Home production, market production and thegender wage gap: Incentives and expectations. Review of Economic Dynamics 12:80–107.
Alesina, Albert, Yann Algan, Pierre Cahuc, and Paola Giuliano. 2010. Family values and theregulation of labor. NBER Working Paper 15747.
Alesina, Alberto. 2007. Good-bye lenin (or not?): The effect of communism on people’s prefer-ences. American Economic Review 97(4):1507–1528.
Alesina, Alberto and Paola Giuliano. 2010. The power of the family. Journal of Economic Growth15(2):93–125.
Becker, Sasha O., Katrin Boeckh, Christa Hainz, and Ludger Woessman. 2010. The empire is dead!long live the empire. Mimeo, University of Stirling.
Bobek, Hans. 1962. The main stages in socio-economic evolution from a geographical pointof view. In Philip L. Wagner and Marvin W. Mikesell (eds.) Readings in Cultural Geography.Chicago: University of Chicago Press, 218–247.
Boserup, Ester. 1970. Woman’s Role in Economic Development. London: George Allen and UnwinLtd.
Braudel, Fernand. 1998. Mediterranean in the Ancient World. London: Allen Lane.
Brown, Judith K. 1970. A note on the division of labor by sex. American Anthropologist 72:1073–1078.
Burton, Michael L. and Karl Reitz. 1981. The plow, female contribution to agricultural subsistenceand polygyny. Cross Cultural Research 16(3 & 4):275–304.
Fernandez, Raquel. 2007. Women, work and culture. Journal of the European Economic Association5(2–3):305–332.
30

Fernandez, Raquel and Alessandra Fogli. 2009. Culture: An empirical investigation of beliefs,work, and fertility. American Economic Journal: Macroeconomics 1(1):146–177.
Fischer, Gunther, Harrij van Nelthuizen, Mahendra Shah, and Freddy Nachtergaele. 2002. GlobalAgro-Ecological Assessment for Agriculture in the 21st Century: Methodology and Results. Rome:Food and Agriculture Organization of the United Nations.
Fortin, Nicole. 2005. Gender role attitudes and the labour market outcomes of women across oecdcountries. Oxford Review of Economic Policy 21:416–438.
Foster, Andrew D. and Mark R. Rosenzweig. 1996. Comparative advantage, information andthe allocation of workers tasks: Evidence from agricultural labour market. Review of EconomicStudies 63(3):347–374.
Goldin, Claudia. 1995. The u shaped female labor force function in economic development. InT. Paul Schultz (ed.) Investment in Women Human Capital. Chicago: University of Chicago Press,61–90.
Goldin, Claudia. 2006. The quiet revolution that transformed women’s employment educationand family. American Economic Review Papers and Proceedings 96(2):1–23.
Goldin, Claudia and Kenneth Sokoloff. 1984. The relative productivity hypothesis of industrial-ization: The american case, 1820 to 1850. Quarterly Journal of Economics 99(3):461–487.
Goody, Jack. 1976. Production and Reproduction. Cambridge, UK: Cambridge University Press.
Gordon, Raymond G. 2005. Ethnologue: Languages of the World, 15th Edition. SIL International.
Grosjean, Pauline. 2010a. A history of violence: Testing the “culture of honor” in the us south.Mimeo, University of San Francisco.
Grosjean, Pauline. 2010b. The determinants of cultural integration: A gravity approach. Mimeo,University of San Francisco.
Guiso, Luigi, Paola Sapienza, and Luigi Zingales. 2004. The role of social capital in financialdevelopment. American Economic Review 94(3):526–556.
Guiso, Luigi, Paola Sapienza, and Luigi Zingales. 2008a. Social capital as good culture. Journal ofthe European Economic Association 6(2-3):295–320.
Guiso, Luigi, Paola Sapienza, and Luigi Zingales. 2008b. Long-term persistence. Mimeo.
Hausman, Ricardo, Laura D. Tyson, and Saadia Zahidi. 2009. The Gender Gap Report. Geneva:World Economic Forum.
Iversen, Torben and Francis Rosenbluth. 2010. Women, Work, and Politics: The Political Economy ofGender Inequality. New Haven: Yale University Press.
Murdock, George Peter. 1967. Ethnographic Atlas. Pittsburgh: University of Pittsburgh Press.
Murdock, George Peter and Caterina Provost. 1973a. Factors in the division of labor by sex.Ethnology 12(4):203–225.
Murdock, George Peter and Caterina Provost. 1973b. Measurement of cultural complexity. Eth-nology 12(4):379–392.
31

Nunn, Nathan and Leonard Wantchekon. 2011. The slave trade and origins of mistrust in Africa.American Economic Review :forthcoming.
Pitt, Mark M., Mark R. Rosenzweig, and Nazmul Hassan. 2010. Human capital investment andthe gender division of labor in a brawn-based economy. Mimeo.
Pryor, Frederic. 1985. The invention of the plow. Comparative Studies in Society and History27(4):727–743.
Ross, Michael L. 2008. Oil, islam and women. American Political Science Review 102(1):107–123.
Tabellini, Guido. 2008. The scope of cooperation: Values and incentives. Quarterly Journal ofEconomics 123(3):905–950.
Tabellini, Guido. 2010. Culture and institutions: Economic development in the regions of europe.Journal of the European Economic Association 8(4):677–716.
Weidmann, Nils B., Jan Ketil Rod, and Lars-Erik Cederman. 2010. Representing ethnic groups inspace: A new dataset. Journal of Peace Research 47(4):491–499.
Appendix A. Data Appendix
A.. Dependent variables
The data on female labor force participation and measures of gender roles are taken from the most
recent four waves of the World Value Survey (WVS), which is a compilation of national surveys on
values and norms on a wide variety of topics. It has been carried out five times, in 1981–1984,
1990–1993, 1995–1997, 1999–2004 and 2005–2007. The coverage varies depending on the wave,
starting with 22 countries in 1980 and covering 81 countries in the fourth wave. The fifth wave has
been carried out in 57 countries in the World. The questionnaires contain information on different
types of attitudes, religion and preferences, as well as information on standard demographic
characteristics, such as sex, age, education, labor market status, and income.
Our analysis uses the last four waves of the WVS since the first wave does not contain
information on the district of origin of the respondent which is essential for our subnational
estimates. Because district classifications often vary by wave, we use the wave with the most
finely defined districts.
We examine two questions that quantify individuals’ attitudes about gender roles. In the first
question respondents are given the following statement: “When jobs are scarce, men should have
more right to a job than women”. The respondents are then asked to choose between (i) agree,
32

(ii) neither (iii) disagree. We drop the observations in which the respondents answer “neither”,
and code ‘disagree’ as 0 and ‘agree’ as 1.
In the second question, respondents are given the following statement “Being a housewife is
just as fulfilling as working for pay”. Respondents then chose among the following responses
that best represented their view: (1) strongly disagree, (2) disagree, (3) agree, and (4) strongly
disagree.
We then combine both variables into a single measure using principal components. The
constructed gender attitudes variable takes on higher values for more unequal beliefs about the
role of women, namely that their natural place is in the home.
Female labor force participation measured at the country level is taken from the World Bank’s
World Development Indicator’s. The variable is measured in the standard way, as the percentage of
women in the labor force. The variable, measured at the district level, is taken from the WVS.
The survey asks respondents to report their employment status. We code a woman as being in
the labor force if she reports that she is employed full-time, employed part-time or self-employed.
We code a woman as not being in the labor force if she reports that she is retired, a housewife, a
student or other.
B.. Plough-positive and plough-negative climatic conditions
We construct our geo-climate instruments using information comes from the FAO’s Global Agro-
Ecological Zones (GAEZ) 2002 database. The data are publicly available from:
http://www.iiasa.ac.at/Research/LUC/SAEZ/index.html. The database reports the suitability
for the cultivation of over 25 different crops for grid-cells 5 arc minutes by 5 arc-minutes (approx-
imately 56 km by 56 km) for the world. From the database we extract the raster files for sorghum,
millet, wheat and rye. For each crop, we know whether it can be grown in each grid globally.
This information is used to construct our instrument, as described in the body of the text.
C.. US Immigrants
Our main datasets are the March Supplement of the Current Population survey and the American
Time Use Survey. The March Supplement of the Current Population Survey is the only recent
available dataset in which individuals were asked (starting from 1994) about their parents’
country of origin. We pool fifteen years of data to obtain the maximum sample size. We use
33

the CPS to study female labor force participation of second generation immigrant women in the
US.
D.. Ethnographic Controls
The measure of historic economic development is from question v30 of the Ethnographic Atlas.
Each ethnic group is identified as falling within one of the following settlement pattern categories:
nomadic or fully migratory (80 ethnicities), semi-nomadic (187), semi-sedentary (93), compact, but
temporary settlements (15), neighborhoods of dispersed family homes (149), separated hamlets
forming a single community (106), compact and relatively permanent (504), complex settlements
(29). We construct a variable that takes on the values of 1 to 8, with 1 indicating fully nomadic
groups and 8 groups with complex settlement. We then construct an average measure among the
ethnic groups of individuals living in each district or country as described in Section 2.1.
As an alternative measure of development, we quantify the political sophistication of ethnic
group. We use the number of jurisdictional hierarchies beyond the local community (question
v33). Our control for the historic existence of domesticated bovine or equine animals is con-
structed from question v40 of the Ethnographic Atlas.
The two ethnographic controls that measure the historic geographic environment are con-
structed in the following manner. We first identify the centroid of each ethnic group, which
is reported in the Atlas. We then identify land that is within 200 kilometers of the centroid.
Using information on global geo-climatic conditions for crop cultivation from the FAO’s GAEZ
2002 database, we calculate the fraction of this land that is suitable for the cultivation of crop
for human consumption. We use this measure to construct the average suitability of the land
historically inhabited by a location’s ancestors. We also identify the proportion of this land that
is classified as having either a tropical or sub-tropical climate. This is then used to construct a
measure of how tropical the land historically inhabited by a location’s ancestors was.
34

Appendix B. Appendix tables
Table 8: The importance of time-invariant country characteristics.
(1) (2) (3) (4) (5) (6)
ln income -5.204 -52.37 -52.43 -6.98(0.925) (11.46) (12.41) (6.62)
ln income squared 2.817 2.786 0.408(0.673) (0.724) (0.397)
Time trend 0.269(0.060)
Manuf. Share of GDP No No No No Yes YesServices share of GDP No No No No Yes YesYear FEs No Yes Yes Yes Yes YesCountry FEs No No No No No Yes
R-squared 0.02 0.02 0.17 0.26 0.29 0.97Observations 3,743 3,743 3,743 3,743 3,743 3,743Notes: An observation is a country and year. The sample includes 168 countries from 1980 to 2008. Coefficientsare reported with standard errors clustered at the country level.
Dependent variable: female labor force participation
35