the origin of modern frogs (neobatrachia) was accompanied by
TRANSCRIPT

Irisarri et al. BMC Genomics 2012, 13:626http://www.biomedcentral.com/1471-2164/13/626
RESEARCH ARTICLE Open Access
The origin of modern frogs (Neobatrachia) wasaccompanied by acceleration in mitochondrialand nuclear substitution ratesIker Irisarri1, Diego San Mauro2, Federico Abascal1,3, Annemarie Ohler4, Miguel Vences5 and Rafael Zardoya1*
Abstract
Background: Understanding the causes underlying heterogeneity of molecular evolutionary rates among lineagesis a long-standing and central question in evolutionary biology. Although several earlier studies showed thatmodern frogs (Neobatrachia) experienced an acceleration of mitochondrial gene substitution rates compared tonon-neobatrachian relatives, no further characterization of this phenomenon was attempted. To gain new insightson this topic, we sequenced the complete mitochondrial genomes and nine nuclear loci of one pelobatoid(Pelodytes punctatus) and five neobatrachians, Heleophryne regis (Heleophrynidae), Lechriodus melanopyga(Limnodynastidae), Calyptocephalella gayi (Calyptocephalellidae), Telmatobius bolivianus (Ceratophryidae), andSooglossus thomasseti (Sooglossidae). These represent major clades not included in previous mitogenomic analyses,and most of them are remarkably species-poor compared to other neobatrachians.
Results: We reconstructed a fully resolved and robust phylogeny of extant frogs based on the new mitochondrialand nuclear sequence data, and dated major cladogenetic events. The reconstructed tree recovered Heleophryne assister group to all other neobatrachians, the Australasian Lechriodus and the South American Calyptocephalellaformed a clade that was the sister group to Nobleobatrachia, and the Seychellois Sooglossus was recovered as thesister group of Ranoides. We used relative-rate tests and direct comparison of branch lengths from mitochondrialand nuclear-based trees to demonstrate that both mitochondrial and nuclear evolutionary rates are significantlyhigher in all neobatrachians compared to their non-neobatrachian relatives, and that such rate acceleration startedat the origin of Neobatrachia.
Conclusions: Through the analysis of the selection coefficient (ω) in different branches of the tree, we foundcompelling evidence of relaxation of purifying selection in neobatrachians, which could (at least in part) explain theobserved higher mitochondrial and nuclear substitution rates in this clade. Our analyses allowed us to discard thatchanges in substitution rates could be correlated with increased mitochondrial genome rearrangement ordiversification rates observed in different lineages of neobatrachians.
Keywords: Substitution rate, Selection, Molecular dating, Mitochondrial genome, Mitogenomics, Anura,Neobatrachia, Evolution
BackgroundIt has been long acknowledged that character change inevolution occurs at different rates, which can vary ex-tremely between different lineages [1]. Although initiallydescribed for morphological characters, among-lineagerate heterogeneity also occurs at the molecular level, and
* Correspondence: [email protected] of Biodiversity and Evolutionary Biology, Museo Nacional deCiencias Naturales, CSIC, José Gutiérrez Abascal 2, 28006 Madrid, SpainFull list of author information is available at the end of the article
© 2012 Irisarri et al.; licensee BioMed Central LCommons Attribution License (http://creativecreproduction in any medium, provided the or
evolutionary biologists have been long interested inquantifying molecular evolutionary rates as well as de-termining which are the underlying mechanisms thattrigger their acceleration or slowdown in differentlineages [2]. However, uncovering the causes of lineage-specific rate variation has proven to be challenging, andprevious studies reached different conclusions, whichattempted to explain rate heterogeneity through correl-ation with species body size, generation time, populationdynamics, metabolic rates, or habits (e.g., [2-4]).
td. This is an Open Access article distributed under the terms of the Creativeommons.org/licenses/by/2.0), which permits unrestricted use, distribution, andiginal work is properly cited.

Irisarri et al. BMC Genomics 2012, 13:626 Page 2 of 19http://www.biomedcentral.com/1471-2164/13/626
Furthermore, molecular evolutionary rates have alsobeen correlated with diversification [5-7], but given themultiple factors that shape diversification patterns, thegeneralization of this correlation is elusive, and there-fore, the cause-effect between rates of genome evolutionand cladogenesis remain largely unknown [2].At the molecular level, the fixation of mutations in an evo-
lutionary lineage (i.e., substitution events), is a complex dy-namic process determined by the interaction betweenevolutionary (selection) and demographic (drift) forces [8].Comparative studies of relative substitution rates have beenparticularly useful in providing insights into particular con-straints of specific genetic systems, such as e.g. mitochon-drial (mt) genomes [9]. Mitochondrial DNA has been widelyused as a marker in molecular systematics during past dec-ades [10,11]. As data accumulated, it has become apparentthat animal mt DNA evolves at a rate 5 to 10 times fasterthan single-copy protein coding nuclear genes, although thisvaries extremely across genes and taxa [10,12,13]. Mitochon-drial DNA suffers from high mutational pressure [14] likelydue to the inaccuracy of its DNA repair system [15], the ab-sence of histone-like proteins [14], the particular replica-tion model with single-strand intermediates [16], and thepresence of reactive oxidative compounds produced in themitochondria [17]. This high mutational pressure, to-gether with a reduced population size [18] and the ab-sence of substantial recombination [19] (but see [20]),leads to an increase of substitution rate in mt DNA. Thecomparison of evolutionary rates among lineages permitsthe identification of events of acceleration and slowdownof rates, which can be further studied to uncover theunderlying process (or processes) that produced theobserved patterns [2].Furthermore, phylogeneticists are particularly interested
in understanding evolutionary rate variation because theunequal substitution rates among lineages are a well-known source of phylogenetic artifacts [21,22]. Rapidlyevolving lineages may appear closely related (and oftenplaced close to outgroups) regardless of their true evolu-tionary relationships (long-branch attraction; [23]),whereas short branches may also attract each otherbecause of the “leftover” similarity of symplesiomorphicstates that “eroded” away in rapid-evolving lineages [24].Previous studies have shown that rates of molecular evolu-
tion, both for mt DNA and some nuclear genes are un-equally distributed among lineages of frogs [25].Neobatrachian frogs exhibit higher mt substitution ratescompared to their non-neobatrachian relatives [25-29]. Yet,it is neither clear when the shifts in substitution rates oc-curred during the evolutionary history of modern frogs norwhether rate changes are exclusive to the mt genome. More-over, the heterogeneous distribution of mt substitution rates,together with the high genetic divergence between frogs andtheir closest living sister taxa (i.e., salamanders; [30]) are the
source of several phylogenetic artifacts in previous studies,such as the monophyly of non-neobatrachian frogs(“Archaeobatrachia”: [29,31,32]) or the incorrect phylogen-etic placement of Neobatrachia due to long-branch attrac-tion effects [27]. The unequal distribution of mt substitutionrates across the anuran tree has also been suggested to yieldconsiderably older time estimates for divergences amongneobatrachians [33].Neobatrachia (modern frogs) is acknowledged as the
most derived lineage of frogs [34,35] and the sister groupof Pelobatoidea [36,37]. Modern frogs constitute an evo-lutionarily highly successful clade that contains over 96%of the overall species diversity of extant amphibians[38-40]. Most of this diversity is concentrated in twomajor clades: Ranoides (= Ranoidea), which comprisesthree well-supported monophyletic groups (Afrobatra-chia, Microhyloidea, Natatanura), and Nobleobatrachia[39,41]. Neobatrachia` also includes the followingspecies-poor families: Calyptocephalellidae, Heleophryni-dae, Limnodynastidae, Myobatrachidae, Nasikabatrachi-dae, and Sooglossidae, whose relative position is still acontentious issue in anuran phylogeny [39,41]. Most ofthe diversity of Ranoides and Nobleobatrachia is locatedin the Old World and the Neotropics, respectively [25],whereas the abovementioned species-poor neobatrachianfamilies show a relict distribution [40]. It was suggestedthat the shift in mt substitution rates in Neobatrachiacould be related with the higher diversification ratesobserved in Ranoides and Nobleobatrachia, providedthat further data and analyses could possibly assign shortbranches to species-poor lineages [25]. To validate suchpossibility, it is necessary to precisely delimit the node inthe anuran phylogeny at which the shift in evolutionaryrates took place.In this study, we newly determined the mt genomes and
partial sequences of nine nuclear genes of several key repre-sentatives of species-poor neobatrachian families outsideRanoides and Nobleobatrachia. These new sequence datatogether with previously available orthologous sequence datafrom other anurans were used to infer a robust phylogenyand a timetree of major lineages of frogs. The new sequencedata and the phylogeny were used to (i) confirm that mtsubstitution rates are (statistically) significantly higher in thedifferent neobatrachian lineages; (ii) localize the rate shift inthe phylogeny; (iii) explore whether substitution rates of nu-clear genes are also accelerated in modern frogs; and (iv) de-termine whether changes in substitution rates could becorrelated with life-history traits, an increase in mt genomerearrangement, or an increase in diversification rates.
MethodsTaxon sampling and DNA sequencingTaxon sampling in this study was designed to representall major groups of frogs with particular emphasis on

Irisarri et al. BMC Genomics 2012, 13:626 Page 3 of 19http://www.biomedcentral.com/1471-2164/13/626
neobatrachian lineages outside Ranoides and Nobleoba-trachia. For phylogeny reconstruction, we used Leio-pelma and Ascaphus as outgroup taxa. For timetreeinference, the outgroup included three salamanders,three caecilians, a lizard, a bird, and a mammal. Theseextra outgroup taxa were included to provide additionalcalibration points, and thus to infer more accurate time-tree estimates. In-group frog species were largely chosenbased on available complete mt genomes, and to allowdirect comparison and combination of mt and nucleardata. Available frog mt genomes were expanded withnewly determined complete sequences for one peloba-toid (Pelodytes sp., from the southwest of the IberianPeninsula, probably representing an undescribed speciescurrently under study; in this paper, we name it P. punc-tatus following current taxonomy) and the followingneobatrachians: Heleophryne regis (Heleophrynidae),Lechriodus melanopyga (Limnodynastidae), Calyptoce-phalella gayi (Calyptocephalellidae), Telmatobius bolivia-nus (Ceratophryidae), Sooglossus thomasseti (Sooglossidae).The nearly complete sequence of another Sooglossidae,Sooglossus sechellensis, was also determined. A nuclearDNA data set of partial sequences of nine protein-codinggenes was compiled, including the recombination-activatinggenes 1 and 2 (rag1 and rag2), brain-derived neutro-trophic factor (bdnf ), proopiomelanocortin (pomc), che-mokine receptor type 4 (cxcr4, exon 2), members 1 and 3of the solute carrier family 8 (slc8a1, exon 2, and slc8a3,exon2), rhodopsin (rho exon 1), and histone 3 (h3a). Thenuclear matrix was generated expanding a recent dataset[37] with new data for the aforementioned species. Sinceour phylogenetic analyses were focused mainly on thefamily level or above, and in order to maximize the com-pleteness of the nuclear data set, sequences from congen-eric anuran species (for which there is strong evidencefor the monophyly of the genus) were merged in fewcases see (e.g., [42-44]). Similarly, chimerical sequenceswere also used to represent some non-anuran major evo-lutionary lineages in the outgroup of the timetree ana-lysis. Detailed information on the studied species and thecorresponding GenBank accession numbers can be foundin Additional file 1.Total DNA was prepared from ethanol-preserved muscle
tissue by proteinase k digestion, phenol-chloroform extrac-tion, and ethanol precipitation [45]. The complete mt gen-ome of Pelodytes was amplified in several overlappingfragments by PCR using the primers and conditions reportedin [46]. The remaining mt genomes, corresponding to neoba-trachians, were partially amplified using the same set of pri-mers (from 5’-trnF to 3’-cox3) (abbreviations of mt genesfollow [47]). Due to the gene rearrangements found in neo-batrachians (see Results and discussion), the remaininghalves of the mt genomes (from 5’-cox3 to 3’-trnF) wereamplified using the primers and conditions reported in [48].
Partial sequences of nuclear genes were amplified using theprimers and conditions reported in the literature: rag1 [46],rag2 [25,49], slc8a1 [36], bdnf and pomc [50], rho [25], h3a[51]. In all cases, PCR cycling conditions were experimentallyadjusted from those reported in the original publications.Specific primers were designed when general primers didnot work (mainly for control regions), and to sequence long-PCR products by primer walking (available from authorsupon request). PCR reactions of fragments up to 1500 bpwere carried out with 5PRIME Taq DNA polymerase(5PRIME GmbH, Hamburg, Germany), and longer frag-ments were amplified using LATaq polymerase (TaKaRa BioInc., Otsu, Shiga, Japan), following manufacturer’s instruc-tions. PCR amplicons were purified by ethanol precipitation[45] or directly from electrophoresis gels using the Speed-tools PCR clean-up kit (Biotools B&M Labs. S.A., Madrid,Spain). The long-PCR products containing the control regionof L. melanopyga and T. bolivianus were digested with PstIat 37°C for four hours, obtaining two fragments from each ofthe original amplicons. These four fragments as well as allother PCR products containing the control regions of theremaining species were cloned into pGEM-T vectors (Pro-mega, Madison, WI, USA). PCR fragments and positive re-combinant clones were cycle-sequenced with the ABI PrismBigDye Terminator v3.1 cycle sequencing ready reaction kit(Applied Biosystems, Foster City, CA, USA) using PCR andM13 universal primers, and following manufacturer’s instruc-tions. Cycle sequencing products were run on ABI Prism3700 and 3130xl DNA Analyzers (Applied Biosystems, FosterCity, CA, USA).The new mt sequences were annotated by comparison
with other reported frog mt genomes using DOGMA[52]. In this web-based tool, genes are identified byBLAST searches, open reading frames of protein-codinggenes are translated using the appropriate genetic code(vertebrate mt code), and transfer RNA (tRNA) genesare further identified based on their putative cloverleafsecondary structure. The gene arrangements of the newmt genomes were compared against the Mitozoa data-base release 7.1 [53].
Sequence alignmentMitochondrial and nuclear protein-coding genes wereanalyzed at the nucleotide and amino acid levels. Align-ments were generated using TranslatorX [54]. First,amino acids of deduced proteins were aligned usingMAFFT L-INS-i [55] and default settings. Then, am-biguously aligned positions were removed usingGblocks, v.0.19b [56] and the following settings: mini-mum number of sequences for a conserved position 29,minimum number of sequences for a flanking position29, maximum number of contiguous non-conservedpositions 8, minimum length of an initial block 5, mini-mum length of a block 5, allowed gap positions with

Irisarri et al. BMC Genomics 2012, 13:626 Page 4 of 19http://www.biomedcentral.com/1471-2164/13/626
half. Finally, trimmed protein alignments were used asguide for a codon-based alignment of nucleotide sequences.Mitochondrial tRNA gene nucleotide sequences werealigned manually based on their putative secondary struc-ture, whereas mt ribosomal RNA (rRNA) gene nucleotidesequences were aligned with MAFFT L-INS-i [55] andcorrected by eye for any obvious misalignment. Ambigu-ously aligned positions in both mt tRNA and rRNA genealignments were excluded with Gblocks v.0.19b [56] usingthe following settings: minimum number of sequences fora conserved position 31, minimum number of sequencesfor a flanking position 36, maximum number of contigu-ous non-conserved positions 5, minimum length of ablock 10, allowed gap positions with half.
Phylogenetic reconstructionPrevious studies (e.g., [27]) showed long-branch attractionartifacts in phylogenetic reconstruction of the anuran treedue to high rates of evolution of mt DNA in neobatra-chians. In order to avoid such phylogenetic inferenceartifacts, especially those caused by possible saturationin the fast-evolving lineages, first and third codon posi-tions of mt protein-coding genes, and third codon posi-tions of nuclear protein-coding genes were excludedfrom the corresponding nucleotide alignments. Forphylogenetic and dating analyses, protein-coding genealignments at the nucleotide or amino acid level werecombined together with tRNA and rRNA genes into twomatrices, hereafter the combined nucleotide and aminoacid data sets, respectively.The combined nucleotide and amino acid data sets were
analyzed by maximum likelihood (ML; [57]) using RAxMLv.7.0.4 [58], and by Bayesian inference (BI; [59]) usingMrBayes v.3.1.2 [60,61]. ML searches used the rapid hill-climbing algorithm [62] starting from 100 randomizedmaximum-parsimony trees. RAxML optimized parametersof the GTR+I+Γ model in all partitions independently. ForBI, two independent runs were performed, each with 4 sim-ultaneous Markov chains for 20 million generations, sam-pling every 1000 generations. Convergence was checked aposteriori using Tracer v.1.5 [63] and the online tool AWTY[64]. The first 1 million generations were discarded as burn-in to prevent sampling before the Markov chains reachedstationarity. Support for internal branches was evaluatedperforming 1000 replicates of non-parametric bootstrapping[65] (ML) and by posterior probabilities (BI). The generaLeiopelma and Ascaphus were used as outgroups, as theyare confidently identified as the sister taxa of all other extantfrogs [26,39,41,66,67].The Akaike information criterion (AIC; [68]) was used
to select the best partition schemes as well as best-fitnucleotide and amino acid models for each partition.The best partitioning scheme for the combined nucleo-tide data set was determined with PartitionFinder [69]
and included five partitions: (i) second codon positionsof all mt protein-coding genes, (ii) mt rRNA genes,(iii) mt tRNA genes, (iv) first codon positions of all nu-clear genes, and (v) second codon positions of all nu-clear genes. For the combined amino acid data set,partitions had to be determined separately for aminoacid (PartitionFinderProtein; [69]) and nucleotide (Parti-tionFinder) data. The best partition scheme favored indi-vidual protein-coding gene partitions, a single mt rRNApartition and a single mt tRNA gene partition.
Estimation of divergence timesWe used BEAST v.1.6.1 [70] to estimate divergence timesamong major frog lineages based on molecular data. Thisprogram implements a Bayesian dating method, andassumes a relaxed uncorrelated clock in which the ratefor each branch is drawn independently from an under-lying lognormal distribution [71]. We used the combinednucleotide data set, and constrained the tree topology tothe best ML tree (Figure 1) by removing the operatorsthat act on tree topology from the .xml file. The Yuleprocess [72] was used to describe cladogenesis, and inde-pendent GTR+I+Γ models were applied for each of thefive data partitions. The final Markov chain was run twicefor 100 million generations, sampling every 10,000 gen-erations and the first 1 million was discarded as part ofthe burn-in process, according to the convergence ofchains checked with Tracer v.1.5. [63]. The effective sam-ple size of all the parameters was above 200 [70].Seven calibration points were used as priors for diver-
gence times of certain splits, using a lognormal distribu-tion of prior probability. Calibration points were chosenbased on previous literature and the online resourceLisanfos KMS v.1.2 [73] that compiles data on amphibianfossils. Fossils provided hard minimum bounds (offset)and mean and standard deviations (SD) were chosen sothat the 95% probability limit corresponds to a softmaximum bound. Details on fossil dates and prior dis-tribution parameters for each calibration point are pro-vided in Additional file 2.
Evolutionary rate heterogeneity analysesTopological congruenceTo examine among-lineage rate heterogeneity patterns,we reconstructed phylogenetic trees based on mt andnuclear data, separately, and compared their topologicalcongruence and branch length patterns. In these com-parative analyses, we were not interested in recoveringthe species phylogeny (as above) but in evidencing theempirical differences in evolutionary rates between neo-batrachian and non-neobatrachian lineages as inferredbased on the two types of molecular markers. Therefore,all codon positions of protein-coding genes wereincluded in the analyzed nucleotide data matrices.

Pipa pipa
Rhinophrynus
Discoglossus
Alytes
Bombina
Leiopelma
Ascaphus
Pipa carvalhoi
Hymenochirus
Pelodytes
Silurana
Xenopus
Pseudhymenochirus
Sooglossus sechellensisSooglossus thomasseti
Duttaphrynus
Telmatobius
Hyla
Calyptocephalella
Lechriodus
Heleophryne
Rhacophorus
Mantella
Fejervarya
Kaloula
Microhyla
Polypedates
Pelobates
Heleophrynidae
HylidaeLimnodynastidae
Calyptocephalellidae
BufonidaeCeratophrydae
Sooglossidae
Myobatrachoidea
Rhacophoridae
MantellidaeDicroglossidae
Microhylidae
AMPHICOELA
NEOBATRACHIA
PELOBATOIDEA
DISCOGLOSSOIDEA
Nobleobatrachia
Sooglossoidea
Microhyloidea
NatatanuraRanoides
PIPOIDEA
cob CR
V L I M
Q O
WNC S
D
K G
atp6
R H L
S
rrnS rrnL cox1 nad4 nad5
F
A Y
E T
P
nad1
nad2
cox2
atp8
cox3
nad3
nad4
L
nad6
cob CR
ET
P
nad6nad5
F
cob CR
H
S
nad5
E
T
P
nad6
L
F
cob CR
H
S
nad5
E
T
P
nad6
L
nad2
I
Q
M W
cox1
OL
Y
C
N
A
W
nad2
I
Q
M
cox1
M
C
N
A
OL
Y
nad2
I
Q
M
M
F
nad5
T P
L
rrnS
atp6
K
cox3
I
M
F
cob
H
S
nad5
E
P
nad6
L
CR
1
rrnS rrnL nad1
nad2
CR
2
V L M Q
T M
F
cob CR
H
S
nad5
E T
P
nad6
L
F
T P
L
cob
H
S
nad5
E
nad6
CR
1
rrnS
CR
2
Vertebrate consensus mitochondrial gene orderL
further rearrangements
96/1.00
100/1.00
98/1.00
100/1.00 100/1.00
100/1.00100/1.00
100/1.00
100/1.00
100/1.00
100/1.00
99/1.00
100/1.00
73/1.00
100/1.00
100/1.00
100/1.00
100/1.00
100/1.00
99/1.00
100/1.00
99/1.00
58/1.00
63/1.00
100/1.00
further rearrangements
further rearrangements
100/1.00
0.05
Figure 1 Phylogenetic relationships of extant frogs. The ML phylogram inferred from the combined nucleotide data set is shown. Theinferred tree based on the combined amino acid data set arrived at the same topology, which represents our best hypothesis for anuranphylogenetic relationships. Numbers at nodes are support values from ML (bootstrap proportions; left) and BI (posterior probabilities; right).Names of major clades of frogs are shown in capitals, Neobatrachia is highlighted in blue, and familial and supra-familial assignments areindicated for neobatrachians. Scale bar is substitutions/ site. The consensus gene order of the vertebrate mt genome is shown as well asvariations of this gene order along the phylogeny. Genes encoded by the light strand are underlined. Different colors are used to indicate theorigin of replication of the light strand (grey), translocated protein-coding genes (orange) and transfer RNA genes (blue). Abbreviations of mtgenes follow [47].
Irisarri et al. BMC Genomics 2012, 13:626 Page 5 of 19http://www.biomedcentral.com/1471-2164/13/626
Phylogenetic analyses were based on the concatenationof the nucleotide sequences of all mt single-gene align-ments (hereafter the mt nucleotide data set) or all nu-clear single-gene alignments (hereafter the nuclearnucleotide data set), as well as on the same alignmentsbut with open reading frames translated into proteins(hereafter the mt amino acid and the nuclear amino aciddata sets). Trees were reconstructed under ML asexplained in the phylogenetic reconstruction sectionabove. Protein-coding genes were partitioned by codonposition in the mt and nuclear nucleotide data sets, orby gene in the mt and nuclear amino acid data sets. Themt nucleotide and amino acid data sets had two add-itional partitions corresponding to combined rRNA andtRNA genes, respectively.
Relative-rate testsIn order to compare substitution rates of mt and nucleargenes, relative-rate tests (RRTs; [74]) were performedwith the program RRTree [75]. This program extendsthe method of Li and Bousquet [76] and compares meanrates between lineages relative to the outgroup, takingphylogenetic relationships into account by topologicalweighting [77]. RRTs were performed for each single-gene alignment (note that all tRNA genes, due to theirshort length, were concatenated, and here consideredlike a single-gene alignment for analytic purposes), aswell as for the mt and nuclear data sets at both thenucleotide and amino acid levels. In the case ofprotein-coding genes at the nucleotide level, tests werecarried out (i) taking into account all codon positions

Irisarri et al. BMC Genomics 2012, 13:626 Page 6 of 19http://www.biomedcentral.com/1471-2164/13/626
and (ii) without first and third-codon positions of mtgenes and third positions of nuclear genes. Genetic dis-tances were estimated with K2P [78] and Poisson [75]models at the nucleotide and amino acid levels, re-spectively. We defined the three salamander speciesused in the timetree analysis as outgroup, and dividedfrogs into three assemblages: species-rich clades withinNeobatrachia (Ranoides and Nobleobatrachia), species-poor neobatrachian lineages (Heleophryne, Calyptocepha-lella, Lechriodus and Sooglossus), and non-neobatrachianrelatives (Amphicoela, Discoglossoidea, Pipoidea, andPelobatoidea). RRTs were performed among these threeassemblages, as well as between all neobatrachians versusnon-neobatrachians.
Branch length comparisonsWe optimized model parameters and branch lengthsseparately for the mt and nuclear data sets both at thenucleotide and amino acid levels using RA × ML v.7.0.4[58], and constraining the topology to the preferred MLtree as recovered based on the combined nucleotide andamino acid data sets. In order to compare the branch-specific bias of mt versus nuclear branch lengths, theratios between branch lengths (mt / nuclear) were calcu-lated for each individual internal and terminal branch inthe nucleotide- and amino acid-based trees, separately.The estimated ratios were subjected to one-way ANO-VAs, after being log-transformed to meet the assump-tions of normality and homogeneity of variance. Thefirst ANOVAs compared neobatrachians against non-neobatrachians. For the second ANOVAs, neobatrachianswere further divided into species-rich and species-poorlineages (following the scheme of RRT analyses; seeabove), and orthogonal contrasts were used to comparethe three groups. All statistical analyses were performedwith IBM SPSS Statistics, release 19.0.0.1.
Detecting changes in selective pressureSimulation studies have shown that analyses of selectioncoefficients are rather robust to sequence divergence[79] (as is the case in the present study), having beensuccessfully used in various studies with highly divergentspecies (e.g., [80]). In order to understand whether accel-eration of evolutionary rates in neobatrachians is due tochanges in selective pressure, we tested alternativemodels with different assumptions about ratios of non-synonymous/ synonymous substitution rates (ω). Thesoftware PAML v.3.15 [81] was used to estimate thelikelihood and the ω values of different models derivedfrom the preferred topology (Figure 1) and sequenceinformation from single-gene alignments with allcodon positions, as well as the mt and nuclear nucleo-tide data sets. Branch lengths were first optimized foreach data set assuming a single ω for the whole tree,
and they were fixed when all other parameters wereestimated under alternative models. The null modelhad a single ω value for all branches, and it was com-pared against four alternatives, which allowed a secondω value on (i) the stem branch of Neobatrachia, (ii) allneobatrachian branches, (iii) Ranoides, or (iv) Noble-obatrachia (including their stem branch). Given thatthe alternative hypotheses nest the null model, a likeli-hood ratio test (LRT) was used to determine their signifi-cance [82]. To gain insight into the obtained results, weadditionally allowed ω to vary on main non-neobatrachianlineages (including their stem branch): (v) Amphicoela,(vi) Discoglossoidea, (vii) Pipoidea, (viii) Pelobatoidea, or(ix) the stem branch of Pelobatoidea. These additional fivemodels were compared against the null model by LRT,and, in addition, all 10 (non nested) models werecompared simultaneously using the AIC [68].
Functional analysis of neobatrachian amino acidsynapomorphiesAncestral character states were reconstructed usingMrBayes v3.1.2 [61] based on single-gene protein align-ments, for (i) Neobatrachia, (ii) its closer sister group(Pelobatoidea), and (iii) their last common ancestor. Thethree hypothetical ancestral sequences were comparedagainst each other to identify synapomorphic amino acidchanges in Pelobatoidea and Neobatrachia, taking onlyinto account the sites with reliably reconstructed states(we empirically found that p > 0.75 offered a goodbalance between the number of predictions and theircorresponding reliability). A two-sided binomial testwas used to assess the asymmetrical distribution ofmolecular synapomorphies between the two clades. Inaddition, to further understand if molecular synapo-morphies of neobatrachians (or pelobatoideans) wereassociated to particular regions of the proteins, wepredicted the accessibility to solvent and the occurrenceat the different trans-membrane regions for each of theidentified synapomorphic sites. Solvent accessibility wascalculated through BLAST searches against the PDBFIN-DER2 database [83], and trans-membrane helices ofgenes were predicted with TMHMM v.2.0 [84].
Data availabilityThe newly determined mt (JF703228-34) and nuclear(JF703235-51) sequences are available at NCBI (http://www.ncbi.nlm.nih.gov/genbank/). The data sets used inthis study (combined nucleotide, combined amino acid,mt nucleotide, mt amino acid, nuclear nucleotide, andnuclear amino acid data sets) as well as the .xml fileused for the BEAST analyses can be accessed in theDryad Digital Repository (doi:10.5061/dryad.3qd54).

Irisarri et al. BMC Genomics 2012, 13:626 Page 7 of 19http://www.biomedcentral.com/1471-2164/13/626
Results and discussionNew mitochondrial genomes and nuclear dataWe newly determined the complete nucleotide sequenceof the light strand of the mt genome of one pelobatoid(Pelodytes punctatus; JF703231) and five neobatrachianspecies (Helephryne regis, JF703229; Lechriodus melano-pyga, JF703230; Calyptocephalella gayi, JF703228; Tel-matobius bolivianus, JF703234; Sooglossus thomasseti,JF703233), as well as the nearly complete mt genome ofSooglossus sechellensis (JF703232). We also determinedpartial sequences of several nuclear genes (seeAdditional file 1 for details) in order to construct a nu-clear data matrix that complemented the mt sequencedata set. Main structural features of the newly sequencedmt genomes are highlighted below, and other featurescan be found in Additional file 2.The gene order of the mt genome in Pelodytes punctatus
follows the consensus of vertebrates and other reportedpelobatoids [27,47] (Figure 1). Calyptocephalella gayi,Telmatobius bolivianus, Sooglossus thomasseti and S.sechellensis conform to the consensus mt gene order ofneobatrachians (Figure 1). The neobatrachian and verte-brate consensus mt gene orders differ in the relative pos-ition of the trnL(CUN), trnT and trnP genes, which inneobatrachian mt genomes are found next to the trnFgene (forming the LTPF tRNA cluster) downstream thecontrol region [85] (Figure 1). The mt genome ofLechriodus melanopyga follows the consensus neobatra-chian gene order with the only exception of the locationof the putative origin of replication of the light strand ina 218 bp-long intergenic spacer between the genes trnYand cox1 (Figure 1). Heleophryne regis departs from theconsensus order of neobatrachians in two regions. ThetrnM gene is pseudogenized (Figure 1; ΨM) in its ances-tral location (IQM tRNA gene cluster) because the anti-codon has a deletion. The functional trnM appearswithin the WANCY tRNA gene cluster, which is rear-ranged as ANCMWY, without changes in the codingstrands (Figure 1). The putative origin of the replicationof the light strand (Figure 1; OL) is located in a 165 bp-long intergenic spacer between trnW and trnY genes(Figure 1). Interestingly, the two described new mt generearrangements are associated with origins of replication,which are considered hot spots for gene order change inthe vertebrate mt genome [26,86,87].These two newly reported gene rearrangements are
consistent with the tandem duplication-random lossmodel [88,89], which is considered the main mechanismof gene order change in vertebrate mt genomes [26,87].The tandem duplication-random loss model is rein-forced by the presence of the trnM pseudogene, whichremains in the ancestral location of trnM in H. regis(Figure 1). Other trnM pseudogenes have been reportedin mt genomes of several members of the frog family
Mantellidae [90,91], and several fishes including parrotfishes of the family Scaridae [92], Carapus bermudensis(Ophidiiformes; [93]), and Diaphus splendidus (Mycto-phiformes; [94]). It has been suggested that thesepseudogenes are maintained because they are neededfor the posttranscriptional processing of the nad2gene [91,92].The mt gene order of Heleophryne regis is key for
understanding the evolution of mt genome rearrange-ments in neobatrachians given that this species is basalin this clade (see reconstructed phylogeny in Figure 1).The mt gene order of H. regis has the characteristicLTPF tRNA gene cluster, which can, thus, be confidentlyconsidered a molecular synapomorphy of all neobatra-chians. We speculate that the long intergenic spacer be-tween trnP and trnF genes found in H. regis could be aremnant of the ancestral tandem duplication and ran-dom loss event by which the trnL(CUN), trnT and trnPgenes moved to the LTPF tRNA cluster in the origin ofNeobatrachia [85].
Phylogenetic relationshipsDue to reported long-branch attraction effects in recon-structed anuran phylogenies based on mt sequence data[27], the concatenated data set of all mt and all nuclearsingle-gene alignments was trimmed to only retain mostconserved positions (combined nucleotide data set:11,136 positions). Based on the combined nucleotidedata set with five partitions, both ML (-lnL=76,155.99)and BI (-lnL=76,547.00 for run 1; -lnL=76,548.29 for run2) arrived at an identical topology (Figure 1), which isour best hypothesis for frog phylogenetic relationships.Phylogenetic analyses based on the combined aminoacid data set (data not shown) also recovered the sametopology (Figure 1). Five major clades of frogs wererecovered with high support: non-neobatrachian lineagesbranched off successively as (i) Amphicoela (Ascaphus +Leiopelma), (ii) Discoglossoidea, (iii) Pipoidea and (iv)Pelobatoidea, which was the sister group of (v) Neoba-trachia, in agreement with recent molecular studies[36,37,39,66]. Internal relationships within Discoglossoi-dea [28], Pipoidea [36,37,39,66], and Pelobatoidea [95]fully agreed with recent morphological and molecularanalyses.Neobatrachia has traditionally been acknowledged as
monophyletic [96,97], a fact that has been corroboratedby most morphological [34,35] and molecular [36,37,39]studies, including the present work (Figure 1). Thereconstructed tree recovered Heleophryne as sister groupto all other neobatrachians, as reported by most recentmolecular studies [25,41,66], and this placement receivedmoderate support from ML and maximal from BI(Figure 1). The Australasian Lechriodus and the SouthAmerican Calyptocephalella were recovered together in

Irisarri et al. BMC Genomics 2012, 13:626 Page 8 of 19http://www.biomedcentral.com/1471-2164/13/626
the same clade, and both as sister group to Nobleobatra-chia (Figure 1). The two Seychellois Sooglossus specieswere grouped together as sister group of Ranoides (as earlysuggested by Savage [98]) (Figure 1). Although support forthis relationship was maximal for BI, it received only mod-erate support for ML. Notably, other recent molecularstudies failed to resolve the relative position of sooglossidswith confidence [25,39,41,66].
Estimation of divergence timesThe two independent BEAST analyses gave very similarestimates of divergence times for each node (mean dif-ference between runs was 0.638 ± 0.687 million years),and these estimates roughly agreed with other recentstudies of divergence times among anurans [66,67,99].The obtained estimates of divergence among amphibianswere especially in agreement with those of a recentBEAST analysis [99], despite the differences in taxonsampling, choice of molecular markers, and calibrationpoints. The origin of crown-group Anura was inferred inthe Middle Triassic (about 230 mya) (Figure 2), and theinitial diversification of non-neobatrachian frogs (succes-sive branching of Amphicoela, Discoglossoidea, Pipoi-dea, and Pelobatoidea) in the Late Triassic – Early
Neobatrachi
ANURA
A
D
B
F
E
Pipoidea
Discoglossoidea
Amphicoela
JurassTriassicPermianCarboniferousDevonian
400 My 200250300350
Ear
ly
Mid
dle
Late
Ear
ly
Mid
dle
Late
Ear
ly
Lopi
ngia
nG
uada
lupi
an
Cis
ural
ian
Pen
nsyl
vani
an
Mis
siss
ippi
an
Figure 2 Timetree with age estimates of major divergence events ammethods (BEAST) and based on the combined nucleotide data set. Outgrorepresent 95% credibility intervals of relevant nodes, and calibration constrfile 2). Scale axis is in millions of years (My).
Jurassic (about 210–192 mya) (Figure 2), confirmingother recent molecular dating studies [43,99]. The splitbetween Neobatrachia and Pelobatoidea was dated inthe Late Triassic – Early Jurassic, before the initialbreak-up of Pangaea (mean 192 mya; 95% CI 219–166),and the initial neobatrachian diversification that led toRanoides and Nobleobatrachia in the Late Jurassic –Early Cretaceous (160–130 mya) (Figure 2) in agreementwith divergence time estimates of other recentstudies [33,67,99-101].Our estimates were younger than those inferred by
earlier studies [67,99,100] that used MultiDivtime[102,103], even though the 95% credibility intervals(CI) mostly overlapped. These discrepancies could bedue to differences of both programs in methodologicalassumptions of rate change (auto-correlated in Multi-Divtime, uncorrelated in BEAST), implementation ofevolutionary models and prior calibrations, and techni-ques to calculate credibility intervals [104]. Moreover,molecular dating estimates are much older than the firstneobatrachian fossils (dated in the Early Cretaceous; [105]),indicating either that currently available fossils might be apoor indicator of this particular branching event [105] orthat the molecular dating could be overestimated [106].
Human
P. pipa
RhinophrynusDiscoglossusAlytes
BombinaLeiopelmaAscaphus
Caudata
Gymnophiona
LizardBird
P. carvalhoi
Hymenochirus
PelobatesPelodytesSiluranaXenopusPseudhymenochirus
S. sechellensisS. thomassetiDuttaphrynus
TelmatobiusHyla
CalyptocephalellaLechriodus
Heleophryne
Polypedates
MantellaFejervarya
KaloulaMicrohyla
Rhacophorus
a
C
G
Pelobatoidea
Microhyloidea
Natatanura
Nobleobatrachia
Sooglossoidea
Mi
Olig
ocen
e
Mid
dle
CenozoicCretaceous
Ear
ly
Late
Eoc
ene
Mio
cene
Pal
eoce
ne
ic
Late
150 100 050
y
ong frogs. The tree was estimated using Bayesian relaxed datingup species are depicted with grey branches, horizontal blue barsaints are indicated on the corresponding nodes (A to G; see Additional

AMPHICOELA
NEOBATRACHIA
PELOBATOIDEA
DISCOGLOSSOIDEA
Sooglossoidea
PIPOIDEA
Sooglossoidea
0.5 0.05
a b
Nob
LiHe
Nt
Mh
Nt
Mh
Nob
LiHe
Ca
Ca
Figure 3 ML phylograms derived from separate (a) mt and (b) nuclear nucleotide data sets. Neobatrachian lineages are abbreviated as Ca,Calyptocephalellidae, He, Heleophrynidae; Li, Limnodynastidae; Nob, Nobleobatrachia; Mh, Microhyloidea; and Nt, Natatanura. Note that the mostconspicuous differences between both trees are (i) the relative phylogenetic position of Sooglossoidea, (ii) the scale bar (substitutions/ site),which is proportionally 10 times larger in (a) than in (b), and (iii) that neobatrachian branches are distinctively longer in (a) than in (b).
Irisarri et al. BMC Genomics 2012, 13:626 Page 9 of 19http://www.biomedcentral.com/1471-2164/13/626
Congruence between mt- and nuclear-based phylogeniesSeparate phylogenetic analyses of the mt (13,580 posi-tions) and nuclear (7,083 positions) nucleotide data setsrendered two almost identical topologies (see Figure 3)with levels of support only slightly lower than thoseobtained in the phylogenetic analysis based on the com-bined nucleotide and amino acid data sets (not shown).The recovered phylogenetic tree based on the mt nucleo-tide data set (Figure 3a) placed sooglossids as the mostbasal neobatrachians (branching off before Heleophryne),which is likely an artifact due to the attraction of theextremely long branch leading to sooglossids towardsthat of Heleophryne and the stem branch of Neobatrachia(which is the longest branch in the tree) [23]. Addition-ally, this phylogenetic tree (Figure 3a) favored with lowstatistical support alternative relationships for (Duttaph-rynus + (Telmatobius + Hyla)) within Nobleobatrachia.Interestingly, the phylogenetic analysis of the mt aminoacid data set differed from our best hypothesis (Figure 1)only in the basal position of sooglossids within Neobatra-chia (not shown). The phylogenies reconstructed basedon the nuclear nucleotide (Figure 3b) and nuclear aminoacid (not shown) data sets recovered our best hypothesisfor frog phylogenetic relationships (Figure 1).In addition to assessing topological congruence, the
separate analyses of the mt and nuclear data sets (bothat nucleotide and amino acid levels) offer further infor-mation on the mode of evolution of these two differentgenetic systems. The comparison of mt- and nuclear-based trees (Figure 3) reveals that branch lengths in themt tree (Figure 3a), which ultimately correspond to theunderlying substitution rates, are on average 3.29 (0.42 –12.15) and 2.82 (0.31-18.19) times longer than those inthe nuclear tree (Figure 3b) at the nucleotide and aminoacid levels, respectively. This confirms previous evidence
of higher substitution rates in the mt DNA of metazoans[10,12,13]. More importantly, neobatrachians exhibitmuch longer branches in the mt trees compared to theirnon-neobatrachian relatives, with Heleophryne, Sooglos-sus, and natatanuran species having the longest branches.In contrast, neobatrachians do not display such conspicu-ous long branches in the nuclear tree, and a lineage-specificpattern of branch lengths is only subtle (Figure 3b).
Relative-rate tests and comparison of branch lengthsIn order to test whether the mt substitution rate issignificantly higher in neobatrachians, and to study puta-tive lineage-specific rate changes in nuclear genes, weconducted RRTs, as well as a direct comparison of theratios of the lengths of the same branch in the mt- andnuclear-based phylogenies (both at the nucleotide andamino acid levels). Overall, RRTs clearly showed thatneobatrachians had significantly higher mt substitutionrates compared to non-neobatrachians (K2 versus K1;Table 1). RRTs were applied to 16 individual mt genealignments (13 protein-coding genes, 2 rRNA genes, anda single alignment combining all tRNA genes) at thenucleotide level, and neobatrachians had higher meanrelative rates in all cases but the nad3 gene (Table 1).Differences were significant (p < 0.05) for 12 out of 16mt genes, and highly significant (p < 0.001) for theconcatenation of all mt genes (mt nucleotide data set;Table 1). RRTs of individual nuclear genes at the nucleo-tide level showed that six out of nine genes had highermean substitution rates for neobatrachians (although sig-nificant only in the case of the genes rag2 and slc8a1).Genes h3a, pomc, and rho showed lower rates for Neoba-trachia, but differences were non-significant (Table 1).Notably, the concatenation of all nuclear genes (nuclear
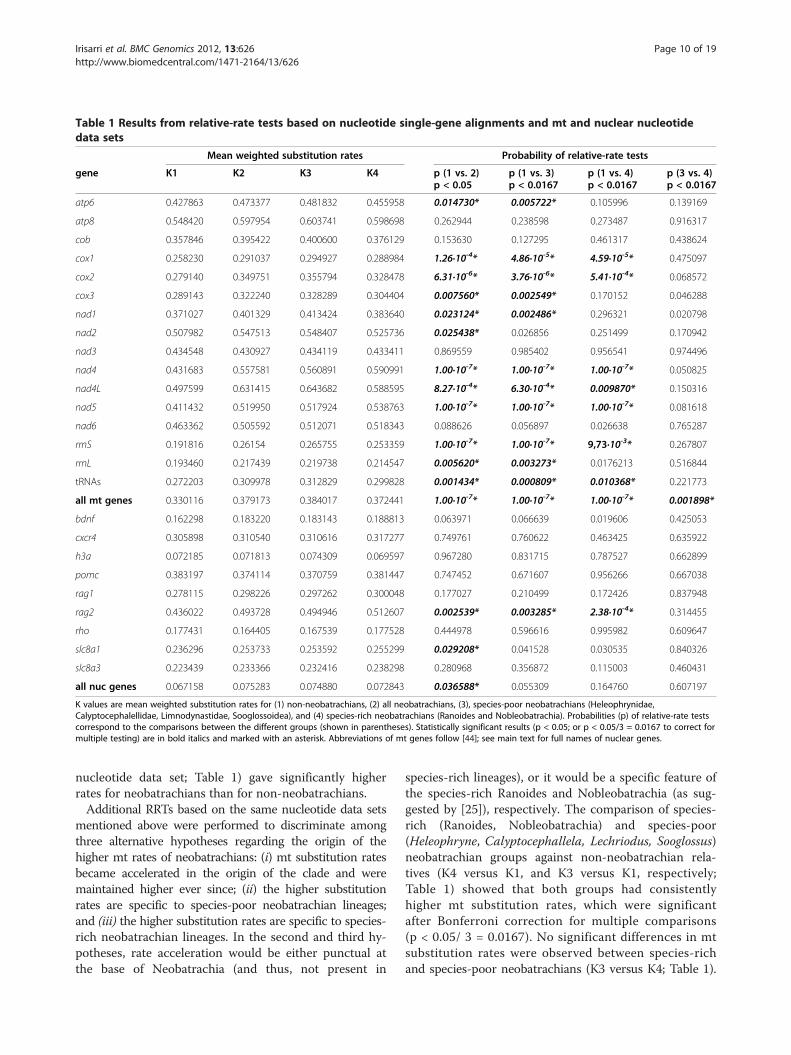
Table 1 Results from relative-rate tests based on nucleotide single-gene alignments and mt and nuclear nucleotidedata sets
Mean weighted substitution rates Probability of relative-rate tests
gene K1 K2 K3 K4 p (1 vs. 2)p < 0.05
p (1 vs. 3)p < 0.0167
p (1 vs. 4)p < 0.0167
p (3 vs. 4)p < 0.0167
atp6 0.427863 0.473377 0.481832 0.455958 0.014730* 0.005722* 0.105996 0.139169
atp8 0.548420 0.597954 0.603741 0.598698 0.262944 0.238598 0.273487 0.916317
cob 0.357846 0.395422 0.400600 0.376129 0.153630 0.127295 0.461317 0.438624
cox1 0.258230 0.291037 0.294927 0.288984 1.26·10-4* 4.86·10-5* 4.59·10-5* 0.475097
cox2 0.279140 0.349751 0.355794 0.328478 6.31·10-6* 3.76·10-6* 5.41·10-4* 0.068572
cox3 0.289143 0.322240 0.328289 0.304404 0.007560* 0.002549* 0.170152 0.046288
nad1 0.371027 0.401329 0.413424 0.383640 0.023124* 0.002486* 0.296321 0.020798
nad2 0.507982 0.547513 0.548407 0.525736 0.025438* 0.026856 0.251499 0.170942
nad3 0.434548 0.430927 0.434119 0.433411 0.869559 0.985402 0.956541 0.974496
nad4 0.431683 0.557581 0.560891 0.590991 1.00·10-7* 1.00·10-7* 1.00·10-7* 0.050825
nad4L 0.497599 0.631415 0.643682 0.588595 8.27·10-4* 6.30·10-4* 0.009870* 0.150316
nad5 0.411432 0.519950 0.517924 0.538763 1.00·10-7* 1.00·10-7* 1.00·10-7* 0.081618
nad6 0.463362 0.505592 0.512071 0.518343 0.088626 0.056897 0.026638 0.765287
rrnS 0.191816 0.26154 0.265755 0.253359 1.00·10-7* 1.00·10-7* 9,73·10-3* 0.267807
rrnL 0.193460 0.217439 0.219738 0.214547 0.005620* 0.003273* 0.0176213 0.516844
tRNAs 0.272203 0.309978 0.312829 0.299828 0.001434* 0.000809* 0.010368* 0.221773
all mt genes 0.330116 0.379173 0.384017 0.372441 1.00·10-7* 1.00·10-7* 1.00·10-7* 0.001898*
bdnf 0.162298 0.183220 0.183143 0.188813 0.063971 0.066639 0.019606 0.425053
cxcr4 0.305898 0.310540 0.310616 0.317277 0.749761 0.760622 0.463425 0.635922
h3a 0.072185 0.071813 0.074309 0.069597 0.967280 0.831715 0.787527 0.662899
pomc 0.383197 0.374114 0.370759 0.381447 0.747452 0.671607 0.956266 0.667038
rag1 0.278115 0.298226 0.297262 0.300048 0.177027 0.210499 0.172426 0.837948
rag2 0.436022 0.493728 0.494946 0.512607 0.002539* 0.003285* 2.38·10-4* 0.314455
rho 0.177431 0.164405 0.167539 0.177528 0.444978 0.596616 0.995982 0.609647
slc8a1 0.236296 0.253733 0.253592 0.255299 0.029208* 0.041528 0.030535 0.840326
slc8a3 0.223439 0.233366 0.232416 0.238298 0.280968 0.356872 0.115003 0.460431
all nuc genes 0.067158 0.075283 0.074880 0.072843 0.036588* 0.055309 0.164760 0.607197
K values are mean weighted substitution rates for (1) non-neobatrachians, (2) all neobatrachians, (3), species-poor neobatrachians (Heleophrynidae,Calyptocephalellidae, Limnodynastidae, Sooglossoidea), and (4) species-rich neobatrachians (Ranoides and Nobleobatrachia). Probabilities (p) of relative-rate testscorrespond to the comparisons between the different groups (shown in parentheses). Statistically significant results (p < 0.05; or p < 0.05/3 = 0.0167 to correct formultiple testing) are in bold italics and marked with an asterisk. Abbreviations of mt genes follow [44]; see main text for full names of nuclear genes.
Irisarri et al. BMC Genomics 2012, 13:626 Page 10 of 19http://www.biomedcentral.com/1471-2164/13/626
nucleotide data set; Table 1) gave significantly higherrates for neobatrachians than for non-neobatrachians.Additional RRTs based on the same nucleotide data sets
mentioned above were performed to discriminate amongthree alternative hypotheses regarding the origin of thehigher mt rates of neobatrachians: (i) mt substitution ratesbecame accelerated in the origin of the clade and weremaintained higher ever since; (ii) the higher substitutionrates are specific to species-poor neobatrachian lineages;and (iii) the higher substitution rates are specific to species-rich neobatrachian lineages. In the second and third hy-potheses, rate acceleration would be either punctual atthe base of Neobatrachia (and thus, not present in
species-rich lineages), or it would be a specific feature ofthe species-rich Ranoides and Nobleobatrachia (as sug-gested by [25]), respectively. The comparison of species-rich (Ranoides, Nobleobatrachia) and species-poor(Heleophryne, Calyptocephallela, Lechriodus, Sooglossus)neobatrachian groups against non-neobatrachian rela-tives (K4 versus K1, and K3 versus K1, respectively;Table 1) showed that both groups had consistentlyhigher mt substitution rates, which were significantafter Bonferroni correction for multiple comparisons(p < 0.05/ 3 = 0.0167). No significant differences in mtsubstitution rates were observed between species-richand species-poor neobatrachians (K3 versus K4; Table 1).

Irisarri et al. BMC Genomics 2012, 13:626 Page 11 of 19http://www.biomedcentral.com/1471-2164/13/626
However, for the concatenation of all mt genes (mt nu-cleotide data set), species-poor neobatrachian lineagesshowed overall significantly higher rates compared tospecies-rich neobatrachians. In the case of the differentnuclear genes, the separate comparison of species-rich andspecies-poor neobatrachians against non-neobatrachiansgave similar results: the rag2 gene had consistently highermean rates for both neobatrachian groups, but the higherneobatrachian rates found for the slc8a1 gene failed to besignificant due to the lower significance threshold. No dif-ferences in nuclear substitution rates were observed amongneobatrachians (K3 versus K4; Table 1). The concatenationof all nuclear genes (nuclear nucleotide data set) renderednon-significant comparisons (Table 1). All previously men-tioned RRTs were also performed with protein-codinggenes translated into amino acids, and produced consis-tent results with those obtained based on nucleotides (seeAdditional file 3).In order to disentangle the contribution of the differ-
ent codon positions to evolutionary rate acceleration inneobratrachians, we performed additional RRTs basedon the mt (lacking first and third codon positions) andnuclear (lacking third codon positions) portions ofthe combined nucleotide data set, respectively (seeAdditional file 3). As expected, exclusion of most vari-able positions from the analyses produced lower meanweighted substitution rates in both mt and nucleargenes. This would in part explain the better performanceof the combined nucleotide data set in resolving anuranphylogeny. Nevertheless, RRT results showed that con-served codon positions also contribute significantly toneobatrachian-specific rate acceleration, displaying simi-lar trends to those experienced by more variable codonpositions (see Additional file 3).In order to compare the branch-specific rate bias of
mt versus nuclear genes and quantify the acceleration ofmt rates in Neobatrachia, we calculated the ratio of thelengths of each branch in the mt- and nuclear-basedtrees (both at the nucleotide and amino acid levels). Forthe ANOVAs, the ratios were log-transformed to meetthe assumptions of normality (Shapiro-Wilk’s test onresiduals p > 0.05) and homogeneity of variance(Levene’s test p > 0.05). A first set of ANOVAs sup-ported a significant difference of the ratios of all neoba-trachian versus all non-neobatrachian branches (p =0.012 and 0.001 for nucleotide- and amino acid-basedtrees, respectively). The higher mt / nuclear ratios of neo-batrachians (mean ± standard deviation for nucleotide-and amino acid-based trees, respectively: 3.90 ± 2.38 and3.90 ± 3.67) compared to those of non-neobatrachians(2.66 ± 2.66 and 1.67 ± 1.27), showed that relative to thenuclear genome, the mt genome is approximately 46 and130% more accelerated in Neobatrachia at the nucleotideand amino acid levels, respectively. The striking difference
in percentage estimates between nucleotide and aminoacid levels could be explained by saturation of more vari-able codon positions in the former. A second set of ANO-VAs found significant differences in branch length ratiosbetween species-poor neobatrachians, species-rich neoba-trachians, and non-neobatrachians (p = 0.039 and 0.002for nucleotide and amino acids, respectively). Further or-thogonal contrasts found significant differences whennon-neobatrachians were compared against species-poor (p = 0.027 and 0.001; nucleotide and amino acidlevels, respectively) and species-rich (p = 0.049 and0.011) neobatrachians. However, no significant differ-ences were found between neobatrachian groups (p =0.650 and 0.291).Estimation of branch length ratios based on the mt
(lacking first and third codon positions) and nuclear(lacking third codon positions) portions of the combinednucleotide data set rendered the same patterns of rateheterogeneity as derived from comparative analysesbased on all codon positions and amino acids. Interest-ingly, however, when considering only conserved codonpositions, we inferred that the mt genome is approxi-mately 88% more accelerated in Neobatrachia relative tothe nuclear genome. This percentage is closer to thatobtained based on amino acid data, and further supportsthat the one based on all positions may be underesti-mated due to saturation.Overall, RRTs support a statistically significant acceler-
ation of the mt substitution rate at the origin of neoba-trachians, which is shared by both species-poor andspecies-rich lineages. This result not only corroboratesprevious studies that suggested an unequal distributionof mt substitution rates between non-neobatrachian andneobatrachian frogs [25-28,33], but also characterizesthe evolutionary dynamics of the shift in rates withinneobatrachians. The inferred evolutionary pattern is fur-ther corroborated by ANOVA results indicating thatneobatrachian mt lineages are evolving 88 to 130% fasterthan non-neobatrachian mt lineages with respect to nu-clear rates. Nuclear genes also exhibited an overall sig-nificant substitution rate acceleration, although muchlower in absolute terms than the one experienced by themt genome. In fact, the nuclear pattern was not as evi-dent as that of the mt genes, since neobatrachian-specifichigher substitution rates were found to be significant inonly two out of nine nuclear genes. This might be the re-sult of the different properties of mt and nuclear gen-omes, such as the recombination rate (very limited in mtDNA; [18]) or the different effective population size(smaller in mt DNA; [18]), which can influence the ef-fectiveness of selection upon these two genetic systems[107]. An alternative explanation is that although substi-tution rate acceleration is general for both mt and nucleargenomes, our results are biased by the use of particular

Irisarri et al. BMC Genomics 2012, 13:626 Page 12 of 19http://www.biomedcentral.com/1471-2164/13/626
nuclear genes, which cannot represent the complexity ofthe entire nuclear genome, with genes obviously subjectedto very disparate selective regimes [108].
Changes in selective pressure and molecularsynapomorphiesThe assumption of a single selective coefficient (ω) forthe frog tree (Figure 1) (null model) rendered ω valueswell below 1 for all different mt and nuclear genes(0.005-0.16) (Table 2), indicating the action of purifyingselection to maintain gene function [14]. To understandwhether observed acceleration of the mt substitutionrate in neobatrachians could be due to changes in select-ive pressure, and to compare the strength of selectionacting on the mt and nuclear genomes, we tested for pu-tative changes in the selective regime under four differ-ent scenarios for the Neobatrachia. All outcomes are
Table 2 Results from branch models that assume branch-specNeobatrachia, based on nucleotide single-gene alignments an
models null model "Neob-stem" "Al
gene Backgr Backgr Branch Backgr
atp6 0.03086 0.03076 0.03585 0.03045
atp8 0.1481 0.14592 1.50841 0.13361
cob 0.03357 0.03313 0.06875 0.03302
cox1 0.01129 0.011 0.03737 0.00783
cox2 0.02236 0.02224 0.02642 0.02186
cox3 0.02741 0.02704 0.08793 0.02482
nad1 0.03005 0.02977 0.05077 0.02823
nad2 0.02817 0.02813 0.03252 0.02803
nad3 0.06499 0.06457 0.14425 0.06435
nad4 0.03632 0.03622 0.0392 0.0358
nad4L 0.04471 0.04458 0.04792 0.04662
nad5 0.03516 0.03503 0.03793 0.03459
nad6 0.02901 0.02895 0.03107 0.02753
all mt genes 0.04693 0.04632 0.08313 0.04483
bdnf 0.04595 0.04723 0.01186 0.04393
cxcr4 0.06461 0.06454 0.06745 0.06028
h3a 0.00476 0.00483 0.0001 0.00599
pomc 0.08214 0.0808 0.23558 0.09098
rag1 0.05736 0.05778 0.03692 0.05249
rag2 0.16003 0.15849 0.24864 0.16786
rho 0.0903 0.092 0.02424 0.07483
slc8a1 0.03996 0.04067 0.0001 0.03588
slc8a3 0.02649 0.02684 0.0144 0.02623
all nuc genes 0.06908 0.06922 0.06195 0.06426
The table shows ω values estimated for the whole frog tree (null model) and valuesunder the four alternative models tested. Bold italics highlight results that are signidetails.
available in the Additional file 3, and main results arehere highlighted.For all mt genes, the independent ω values inferred for
the stem branch of Neobatrachia were always higher thanthose estimated when a single ω was assumed for thefrog tree (null model) (Table 2). These differences wereonly significant (LRT p < 0.05) for the genes cob, cox1,cox3, and nad1, as well as for the combination of all mtgenes (Table 2). The independent ω estimates of mtgenes under alternative models for “all Neobatrachia”,“all Ranoides” and “all Nobleobatrachia” branches weregenerally higher than those of the null model, but unlikethe model of the stem branch Neobatrachia, ω was nothigher for every mt gene, and fewer individual genes gavesignificant results (3, 1, and none for the three alternativemodels, respectively; see Table 2). These outcomes sug-gest that purifying selection acting on mt proteins couldhave been relaxed in neobatrachians.
ific changes in the selection coefficient (ω) ind mt and nuclear nucleotide data sets
l Neob" "All Nobleob" "All Ranoides"
Branch Backgr Branch Backgr Branch
0.03126 0.03086 1.1225 0.03082 0.04203
0.16694 0.14838 0.13614 0.14683 0.35429
0.0342 0.03347 0.04419 0.03353 0.0431
0.0144 0.01122 0.02381 0.01115 0.03898
0.02271 0.02234 0.0236 0.02227 0.03366
0.03046 0.02727 0.03895 0.02733 0.05843
0.03211 0.03001 0.03416 0.02996 0.04253
0.02835 0.02818 0.02814 0.02814 0.03007
0.06582 0.06467 0.10545 0.06499 0.93185
0.03675 0.03626 0.04061 0.0363 0.03703
0.04311 0.04474 0.04294 0.04468 0.04637
0.03571 0.0351 0.03749 0.03511 0.03836
0.03081 0.02897 0.03286 0.02895 0.03359
0.04914 0.04673 0.06435 0.04667 0.07065
0.04979 0.04577 0.05385 0.04545 0.11214
0.07344 0.06588 0.03076 0.06441 0.0748
0.00283 0.005 0.0001 0.00488 0.0001
0.07043 0.08298 0.05716 0.08548 0.02649
0.06532 0.05772 0.0438 0.05802 0.01704
0.1515 0.16003 0.0001 0.1612 0.04584
0.11389 0.09175 0.02681 0.09226 0.04981
0.04702 0.0402 0.03164 0.04055 0.01522
0.02707 0.02664 0.01996 0.0268 0.01046
0.07719 0.06976 0.04153 0.06984 0.03298
estimated for specific (Branch) and remaining background (Backgr.) branchesficantly different to the null model (LRT p < 0.05). See Additional file 3 for full

Irisarri et al. BMC Genomics 2012, 13:626 Page 13 of 19http://www.biomedcentral.com/1471-2164/13/626
In order to understand the relative support of the firstfour models tested (within Neobatrachia), and to furtherinvestigate the relevance of the obtained results, wecompared all 10 models using the AIC. For the combin-ation of all mt genes, the model of relaxed selection inthe stem branch of Neobatrachia was clearly better thanthe remaining models (Table 3). All other modelsshowed a difference of AIC values (ΔAIC) higher than10: ΔAIC=48 for the second best model (independent ωfor Pipoidea), ΔAIC=56 for the third (independent ωshared by all neobatrachian branches), ΔAIC=61 for thefourth (independent ω for Ranoides), etc. (Table 3). Anotable exception to the above pattern was the genecox1; despite evidence of relaxed selection in the stembranch of Neobatrachia, the comparison of all 10 modelsfor cox1 strongly favored the relaxation along allbranches of Neobatrachia (ΔAIC to the rest of modelswas always >10, and up to 44; Table 3).
Table 3 Comparison of all 10 branch models that assume bra(including the null model), based on nucleotide single-gene a
nullmodel
“Neob-stem” “All Neob” “All Ranoides” “All N
genes
atp6 0 2 2 2
atp8 5 4 4 6
cob 7 0 9 9
cox1 42 27 0 36
cox2 6 7 8 7
cox3 5 0 2 7
nad1 3 1 1 4
nad2 0 2 2 2
nad3 0 0 2 2
nad4 0 2 2 2
nad4L 0 2 1 2
nad5 0 1 1 2
nad6 0 2 0 2
all mt genes 78 0 56 61
bdnf 1 0 2 2
cxcr4 10 12 10 12
h3a 1 2 1 2
pomc 7 5 5 0
rag1 8 8 3 4
rag2 7 7 7 7
Rho 3 3 0 3
slc8a1 15 10 12 13
slc8a3 15 16 17 15
all nuc genes 32 33 14 18
The table shows the differences in AIC values among all 10 models.
For nuclear genes, most of the estimated independentω values in all of the nine alternative models were lowerthan those of the null model, showing evidence of stron-ger purifying selection, although genes did not display aconcordant pattern neither under particular models norwithin specific genes (Table 2). However, there were twoexceptions: (i) under the “all Neobatrachia” alternativemodel, relaxation of purifying selection on nuclear geneswas frequently recovered (in six out of nine genes, eventhough it was statistically significant only for the genesrag1, rho, slc8a1, and the combination of all nucleargenes; LRT p<0.05); (ii) under the model of an independ-ent ω for Amphicoela, for which relaxation of selectionwas also frequent (all nuclear genes except h3a, althoughthe differences were only statistically significant for thegenes pomc, slc8a1, slc8a3, and the combination of allnuclear genes) (Table 2). Using the concatenation of allnuclear genes, the comparison of the models assuming a
nch-specific changes in the selection coefficient (ω)lignments and the mt and nuclear nucleotide data sets
obleob” “All Pipoidea” “Pelob-stem” “AllPelob”
“ AllDiscogl”
“AllAmphic”
2 1 2 2 2 2
7 0 7 7 4 5
9 7 9 9 3 9
43 11 44 43 27 44
8 8 8 6 0 8
7 1 5 7 5 7
5 0 5 5 5 5
2 2 2 2 2 2
1 2 2 0 2 1
2 1 2 2 2 2
2 1 2 2 2 1
2 2 2 1 2 2
2 1 2 2 2 2
68 48 77 80 66 79
3 3 3 2 2 1
9 0 4 9 4 11
1 0 2 3 2 2
8 8 8 8 7 5
9 6 4 0 8 5
9 8 8 7 8 0
3 4 4 2 3 1
16 14 17 16 15 0
16 16 16 14 16 0
24 34 28 19 34 0
Irisarri et al. BMC Genomics 2012, 13:626 Page 14 of 19http://www.biomedcentral.com/1471-2164/13/626
second independent ω for (i) all Neobatrachia and(ii) Amphicoela favored the latter (ΔAIC=14; Table 3).Overall, our results evidence the relaxation of puri-
fying selection acting on mt DNA in Neobatrachia.Among all tested models, the assumption of relax-ation at the stem branch leading to Neobatrachia out-performed the rest, although the very similar resultsobtained under the model of a general relaxationalong the entire Neobatrachia indicates that this alter-native hypothesis cannot be confidently rejected. Inany case, these results suggest that overall relaxationin selection pressure could be, at least in part, re-sponsible for the general acceleration of mt substitu-tion rates at the origin of Neobatrachia, as found byRRTs and topological measures. Interpreting theresults from nuclear genes was more complex becauseinferred relaxed selection along all neobatrachianbranches could only explain the higher substitutionrates found by RRTs for the gene slc8a1. Moreover, itis important to note that results derived from thecomparison of different selection regimes should betaken with caution, because analyzed sequences arehighly divergent and silent substitutions might besaturated, thus compromising the correct estimationof ω values [79].Most identified amino acid synapomorphies corre-
sponded to Neobatrachia in mt proteins (102 versus49), whereas distribution of synapomorphies in nu-clear proteins was only slightly higher in neobatra-chians (24 versus 22). These differences were onlysignificant (binomial test’s p < 0.05) for genes cox1,nad5 and rag2 (see Additional file 3). This is inagreement with the results of the RRTs, whichrevealed overall higher substitution rates in neoba-trachians, and a more pronounced acceleration inmt genes. Most mt synapomorphies corresponded toleucine, serine, and alanine in both Neobatrachiaand Pelobatoidea (18, 13, and 11 for Neobatrachia;and 10, 10, and 7 for Pelobatoidea, respectively). Inthe nuclear genes, the most frequent synapo-morphies for Neobatrachia were serine (4), glutamicacid (3), and lysine (3), whereas for Pelobatoidea,they were leucine (6) and aspartic acid (3) (seeAdditional file 3). To further understand how pro-teins of neobatrachians could have accommoda-ted the corresponding mutations, we investigatedwhether synapomorphic amino acids showed anyparticular pattern of exposition to solvent, orwhether they were associated with specific domainsof trans-membrane proteins. However, distributionof neobatrachian synapomorphic changes were notrelated apparently to these functional traits, withmutations being distributed in a more or less uni-form manner along mt proteins.
Could substitution rates be associated with life historytraits, rates of diversification or mt gene rearrangementsin frogs?Our analyses recovered a fully resolved and robust phyl-ogeny of frogs after new data on key lineages of Neoba-trachia were added. These new lineages were essential tounderstand the origin of the observed higher substitu-tion rates in neobatrachians. RRTs and branch lengthmeasures demonstrate the presence of a significant ac-celeration in both mt and nuclear substitution rates inNeobatrachia, which is shared by both species-rich andspecies-poor neobatrachian lineages.The ultimate causes for among-lineage evolutionary
rate variation are, in general, rather elusive. Several linesof evidence suggest that particular life-history traits maybe responsible for rate variation [2], and at least, threemain hypotheses have been put forward. (i) Accordingto the generation time hypothesis, species with shortergeneration times are expected to have higher substitu-tion rates because their genomes are copied more oftenper time unit [109]. However, estimating generation timeis often difficult, and thus, the age at sexual maturityand the time to first reproduction are used as proxies[109,110]. In frogs, generation time is generally short,and small- to medium-sized frogs typically reach sexualmaturity in their first or second year of life [111]. Sexualmaturity one year after egg-laying is common in manyanuran species, including both neobatrachian and non-neobatrachian frogs (e.g., Bombina, Discoglossus, Hyme-nochirus or Xenopus). On the other hand, several neoba-trachians have longer generation times, such asHeleophryne (larval period of over 2 years; [40]), or Ana-xyrus canorus (Bufonidae), whose females reach sexualmaturity after 4–6 years [112]. Data on sexual maturityavailable from the AnAge database (build 12; [113]) doesnot support the existence of significant differences inage of sexual maturity between neobatrachian and non-neobatrachian frogs, either for males or females (Stu-dent’s t p = 0.530 and p = 0.754, respectively). However,these results should be taken with caution, as the avail-able number of age estimates of sexual maturity data inAnAge is still insufficient to draw robust conclusions (Nbetween 32–34 and 2–3 for neobatrachians and non-neobatrachian males and females, respectively).(ii) The longevity hypothesis proposes that long-lived
or late reproducing species will have lower rates of mo-lecular evolution [114], as they are expected to havemore effective DNA repairing mechanisms [115]. Inmost cases, maximum longevity data is derived fromcaptive specimens, which have higher life expectancythat in the wild [116]. Available data from the AnAgedatabase suggests that short- and long-lived speciesare present both among neobatrachian and non-neobatrachian frogs. The comparison of longevity
Irisarri et al. BMC Genomics 2012, 13:626 Page 15 of 19http://www.biomedcentral.com/1471-2164/13/626
between neobatrachians and non-neobatrachians did notrender significant differences (Student’s t p = 0.066; N =10 and 75 for neobatrachians and non-neobatrachians,respectively). Inferences derived from this incompletedata set have to be taken with caution, though.(iii) The metabolic rate hypothesis holds that rates of
evolution are correlated with the production of free radi-cals during respiration [117]. Metabolic rate is correlatedwith substitution rates in the frog family Dendrobatidae[4], but comparable data for other anuran groups is cur-rently unavailable. A suitable proxy for metabolic ratemight be genome size, which has often been shown tobe inversely proportional to metabolic rate [118-120].However, the comparison of genome sizes among anur-ans (data from the Animal genome size database; [121])did not provide indications for consistently larger gen-ome sizes in non-neobatrachians compared to neobatra-chian frogs (Student’s t p = 0.770): C-values (mean ±standard deviation, minimum-maximum in parentheses)were 5.10 ± 3.65 pg (1.29-11.38 pg; N=9) and. 5.43 ±2.59 pg (1.40-13.40 pg; N=27), respectively.Some studies found a correlation of high substitution
rates with more events of gene order rearrangements inthe mt genome of some metazoans [122,123]. However,frogs do not conform to this pattern, because the mtsubstitution rate became accelerated in the origin ofNeobatrachia, and this acceleration is not exclusive ofNatatanura, where most mt gene rearrangements arefound in frogs [90,124-127]. Furthermore, Kurabayashiet al. [90] found evidence for the absence of correlationbetween mt rates and number of gene rearrangementsin one intensively studied lineage of neobatrachians(mantellid frogs from Madagascar).Many other studies have found substitution rates to be
correlated with species diversification [5-7,128], andthree main hypotheses have been proposed to explainthis correlation [6]. (i) Speciation is often associated withprocesses that can potentially increase substitution rates,such as adaptation to new environments or transientreductions in population sizes that reduce the efficiencyof purifying natural selection [129,130]. (ii) Higher sub-stitution rates could produce higher net diversification,both by increasing speciation rate and/ or by reducingextinction rate [6]. (iii) A third hypothesis rejects acausal relationship between substitution and diversifica-tion rates, and holds that this correlation is due to otherfactors that influence both rates simultaneously [131].In frogs, it has been suggested that observed higher mt
substitution rates of neobatrachians could be the prod-uct of faster recent speciation events in this clade (in-cluding more bottleneck events) [25]. In addition,Dubois [132] hypothesized that direct-developing species(mostly within Neobatrachia) would tend to have highersubstitution rates, and this would in turn promote
speciation. Alternatively, it has also been suggested thathigher substitution rates of neobatrachians could be re-sponsible for higher diversification rates, due to shortergeneration times and/or higher metabolic rates [25].Both species-rich and species-poor lineages of neobatra-chians share higher mt substitution rates compared tonon-neobatrachian relatives, but species diversity ishighly unequally distributed among them, with most ofthe diversity corresponding to Ranoides and Nobleoba-trachia [38]. Moreover, neobatrachians do not fit the hy-pothesis of the different reproductive modes [132]because, most direct-developers belong to species-richclades, whereas species-poor neobatrachian lineages aremostly indirect-developers [34,132], but both groupsshare the presence of higher mt substitution rates.Therefore, the relationship between higher mt substitu-tion and diversification rates in frogs remains elusive,and unless a rampant extinction of neobatrachianlineages external to currently species-rich clades(Ranoides and Nobleobatrachia) could account for theobserved huge differences in diversity, it can be consid-ered that substitution and diversification rates aredecoupled in frogs. Unfortunately, the paucity of thecurrent fossil record may hinder the answer to this ques-tion [105,133,134].
ConclusionsUsing both complete mt genomes and partial sequencesof nine nuclear loci, we inferred a robust phylogeny offrogs. RRTs and branch length measures found compel-ling evidence of higher substitution rates in the mt gen-ome of neobatrachian frogs, and a subtle (butsignificant) trend in nuclear genes. Phylogenetic analysessuggest that the origin of this rate acceleration began atthe stem branch leading to Neobatrachia, in the Early-Middle Jurassic period. Because substitution rates aredetermined, to a great extent, by the balance between se-lection and genetic drift [8], we studied the changes inselective pressure in frogs, and found that purifying se-lection acting on most mt and some nuclear proteinsmight have been relaxed in Neobatrachia. Therefore, wesuggest that this relaxation of purifying selection couldexplain, at least in part, the general rate accelerationobserved in this group.We do not exclude the possibility that our results are
slightly affected by some sort of phylogenetic artifact[24], but the neobatrachian-specific higher mt substitu-tion rates are reinforced by compelling evidence ofrelaxed purifying selection on mt proteins. Furthermore,our results show that selection might have been relaxedalso in nuclear genes, and thus justify the higher substi-tution rates found in the genes rag2 and slc8a1 in neo-batrachians. Data from additional nuclear genes, whichare likely to be gathered soon in the context of genome

Irisarri et al. BMC Genomics 2012, 13:626 Page 16 of 19http://www.biomedcentral.com/1471-2164/13/626
sequencing initiatives, hold the key to confirm or rejecta putative general acceleration of evolutionary rates inneobatrachian frogs. Likewise, the clarification of thecauses that relaxed purifying selection would need fur-ther, in-depth studies that investigate intrinsic and ex-trinsic factors that might have modified the fitnesslandscape of gene function [135].With the exception of few particular linages (e.g., [4]),
available data on life history traits for frogs is generallyscarce and not representative for the main lineageswithin Anura. Available data suggests that no clear differ-ences exist between neobatrachian and non-neobatrachianfrogs with respect to generation time, longevity, or meta-bolic rate, but more data would be necessary to reliablytest if substitution rates could be correlated with particularlife history traits in frogs.
Additional files
Additional file 1: Taxa and GenBank accession numbers.
Additional file 2 Supplementary information.
Additional file 3: Additional results from RRTs, changes inselection, and molecular synapomorphies.
Competing interestsThe authors declare that they have no competing interests.
Authors’ contributionsII carried out molecular lab work. II, DSM, and FA analyzed the data. II, DSM,FA, AO, MV, and RZ wrote the paper. All authors read and approved the finalmanuscript.
AcknowledgementsWe are indebted to Renaud Boistel, Marius Burger, Alan Channing, Bill Love,and Stephen Richards for tissue samples or help in the field. We thank DavidBuckley and Silvia Perea for support with the BEAST software, and to MarioGarcía-París for access to computational resources. We are grateful, to DavidBuckley, Mario García-París, Patrick S. Fitze, F. Borja Sanchíz, Luis M. San-Jose,Enrico Negrisolo, and four anonymous reviewers for insightful commentsthat improved earlier versions of the manuscript. This work was supportedby the Spanish Ministry of Science and Innovation (CGL2010-18216 to RZand RYC-2011-09321 to DSM), and the Consejo Superior de InvestigacionesCientíficas of Spain (CSIC) and the European Social Fund (ESF) (JAE-pre PhDfellowhip to II). We acknowledge support of the publication fee by the CSICOpen Access Publication Support Initiative through its Unit of InformationResources for Research (URICI).
Author details1Department of Biodiversity and Evolutionary Biology, Museo Nacional deCiencias Naturales, CSIC, José Gutiérrez Abascal 2, 28006 Madrid, Spain.2Department of Animal Biology, University of Barcelona, Av. Diagonal 643,08028 Barcelona, Spain. 3Structural Computational Biology Group, SpanishNational Cancer Research Center (CNIO), Melchor Fernández Almagro 3,28029 Madrid, Spain. 4UMR 72205 OSEB, Département de Systématique etEvolution, Muséum National d’Histoire Naturelle, 25 rue Cuvier, CP 30, 75005Paris, France. 5Division of Evolutionary Biology, Zoological Institute, TechnicalUniversity of Braunschweig, Mendelssohnstrasse 8, 38106 Braunschweig,Germany.
Received: 25 July 2012 Accepted: 4 November 2012Published: 15 November 2012
References1. Simpson GG: Tempo and mode in evolution. New York: Columbia University
Press; 1944.2. Bromham L: Why do species vary in their rate of molecular evolution?
Biol Lett 2009, 5:401–404.3. Smith SA, Donoghue MJ: Rates of molecular evolution are linked to life
history in flowering plants. Science 2008, 322:86–89.4. Santos JC: Fast molecular evolution associated with high active
metabolic rates in poison frogs. Mol Biol Evol 2012, 29:2011–2018.5. Eo SH, DeWoody JA: Evolutionary rates of mitochondrial genomes
correspond to diversification rates and to contemporary species richnessin birds and reptiles. Proc R Soc B 2010, 277:3587–3592.
6. Lanfear R, Ho SYW, Love D, Bromham L: Mutation rate is linked todiversification in birds. Proc Natl Acad Sci USA 2010, 107:20423–20428.
7. Barraclough TG, Savolainen V: Evolutionary rates and species diversity inflowering plants. Evolution 2001, 55:677–683.
8. Bromham L: Putting the 'bio' into bioinformatics. Biol Lett 2009, 5:391–393.9. Mueller RL: Evolutionary rates, divergence dates, and the performance of
mitochondrial genes in Bayesian phylogenetic analysis. Syst Biol 2006,55:289–300.
10. Moritz C, Dowling TE, Brown WM: Evolution of animal mitochondrial DNA:relevance for population biology and systematics. Ann Rev Ecol Syst 1987,18:269–292.
11. Cummings MP, Meyer A: Magic bullets and golden rules: data samplingin molecular phylogenetics. Zoology 2005, 108:329–336.
12. Meyer A: Evolution of mitochondrial DNA in fishes. In Biochem Mol BiolFishes Volume 2. Edited by Hochachka PW, Mommsen TP. Elsevier SciencePublishers B. V.; 1993:1–38.
13. Brown WM, George MJ, Wilson AC: Rapid evolution of animalmitochondrial DNA. Proc Natl Acad Sci USA 1979, 76:1967–1971.
14. Castellana S, Vicario S, Saccone C: Evolutionary patterns of themitochondrial genome in Metazoa: exploring the role of mutation andselection in mitochondrial protein coding genes. Genome Biol Evol 2011,3:1067–1079.
15. Bogenhagen DF: Repair of mtDNA in vertebrates. Am J Hum Genet 1999,64:1276–1281.
16. Reyes A, Gissi C, Pesole G, Saccone C: Asymmetrical directional mutationpressure in the mitochondrial genome of mammals. Mol Biol Evol 1998,15:957–966.
17. Richter C, Park JW, Ames BN: Normal oxidative damage to mitochondrialand nuclear DNA is extensive. Proc Natl Acad Sci USA 1988, 85:6465–6467.
18. Lynch M: The origins of genome architecture. Sunderland, Massachusetts:Sinauer Associates, Inc.; 2007.
19. Brown WM: Evolution of animal mitochondrial DNA. In Evolution of genesand proteins. Edited by Nei M, Koehn RK. Sunderland, Massachusetss:Sinauer Associates; 1983:62–88.
20. Tsaousis AD, Martin DP, Ladoukakis ED, Posada D, Zouros E: Widespreadrecombination in published animal mtDNA sequences. Mol Biol Evol 2005,22:925–933.
21. Philippe H, Germot A: Phylogeny of eukaryotes based on ribosomal RNA:long-branch attraction and models of sequence evolution. Mol Biol Evol2000, 17:830–834.
22. Rodríguez-Ezpeleta N, Brinkmann H, Roure B, Lartillot N, Lang FB, Philippe H:Detecting and overcoming systematic errors in genome-scalephylogenies. Syst Biol 2007, 56:389–399.
23. Felsenstein J: Cases in which parsimony or compatibility methods will bepositively misleading. Syst Zool 1978, 27:401–410.
24. Fuellen G, Wägele J-W, Giegerich R: Minimum conflict: a divide-and-conquerapproach to phylogeny estimation. Bioinformatics 2001, 17:1168–1178.
25. Hoegg S, Vences M, Brinkmann H, Meyer A: Phylogeny and comparativesubstitution rates of frogs inferred from sequences of three nucleargenes. Mol Biol Evol 2004, 21:1188–1200.
26. Irisarri I, San Mauro D, Green DM, Zardoya R: The complete mitochondrialgenome of the relict frog Leiopelma archeyi: Insights into the root of thefrog Tree of Life. Mitochondrial DNA 2010, 21:173–182.
27. Gissi C, San Mauro D, Pesole G, Zardoya R: Mitochondrial phylogeny of Anura(Amphibia): a case study of congruent phylogenetic reconstruction usingamino acid and nucleotide characters. Gene 2006, 366:228–237.
28. San Mauro D, García-París M, Zardoya R: Phylogenetic relationships ofdiscoglossid frogs (Amphibia: Anura: Discoglossidae) based on completemitochondrial genomes and nuclear genes. Gene 2004, 343:357–366.

Irisarri et al. BMC Genomics 2012, 13:626 Page 17 of 19http://www.biomedcentral.com/1471-2164/13/626
29. Hay JM, Ruvinsky I, Hedges SB, Maxson LR: Phylogenetic relationships ofamphibian families inferred from DNA sequences of mitochondrial 12Sand 16S ribosomal RNA genes. Mol Biol Evol 1995, 12:928–937.
30. Zardoya R, Meyer A: On the origin of and phylogenetic relationshipsamong living amphibians. Proc Natl Acad Sci USA 2001, 98:7380–7383.
31. Hedges SB, Maxson LR: A molecular perspective on lissamphibianphylogeny. Herpetol Monogr 1993, 7:27–42.
32. Dutta SK, Vasudevan K, Chaitra MS, Shanker K, Aggrwal RK: Jurassic frogsand the evoution of amphibian endemism in the Western Ghats. Curr Sci2004, 86:211–216.
33. Igawa T, Kurabayashi A, Usuki C, Fujii T, Sumida M: Complete mitochondrialgenomes of three neobatrachian anurans: a case study of divergencetime estimation using different data and calibration settings. Gene 2008,407:116–129.
34. Duellman WE, Trueb L: Biology of amphibians. New York: MacGraw-Hill; 1986.35. Ford LS, Cannatella DC: The major clades of frogs. Herpetol Monogr 1993,
7:93–117.36. Roelants K, Bossuyt F: Archaeobatrachian paraphyly and Pangaean
diversification of crown-group frogs. Syst Biol 2005, 54:111–126.37. Irisarri I, Vences M, San Mauro D, Glaw F, Zardoya R: Reversal to air-driven
sound production revealed by a molecular phylogeny of tonguelessfrogs, family Pipidae. BMC Evol Biol 2011, 11:114.
38. Frost DR: Amphibian species of the world. New York, USA: American Museumof Natural History; 2011. [http://research.amnh.org/vz/herpetology/amphibia/ ]
39. Pyron AR, Wiens JJ: A large-scale phylogeny of Amphibia including over2800 species, and a revised classification of extant frogs, salamanders,and caecilians. Mol Phylogenet Evol 2011, 61:543–583.
40. Amphibiaweb: Information on amphibian biology and conservation. Berkeley,California: 2012. [http://amphibiaweb.org/]
41. Frost DR, Grant T, Faivovich J, Bain RH, Haas A, Haddad CFB, de Sá RO,Channing A, Wilkinson M, Donnellan SC, Raxworthy CJ, Campbell JA, BlottoBL, Moler P, Drewes RC, Nussbaum R, Lynch JD, Green DM, Wheeler WC:The amphibian tree of life. Bull Amer Mus Nat Hist 2006,297:1–370.
42. Crottini A, Madsen O, Poux C, Strauß A, Vieites DR, Vences M: Vertebrate time-tree elucidates the biogeographic pattern of a major biotic change aroundthe K-T boundary in Madagascar. Proc Natl Acad Sci USA 2012, 109:5358–5363.
43. San Mauro D: A multilocus timescale for the origin of extant amphibians.Mol Phylogenet Evol 2010, 56:554–561.
44. Burleigh JG, Mathews S: Assessing among-locus variation in the inferenceof seed plant phylogeny. Int J Plant Sci 2007, 168:111–124.
45. Sambrook J, Fritsch EF, Maniatis T: Molecular cloning: a laboratory manual.Cold Spring Harbor, New York: Cold Spring Harbor Laboratory Press; 1989.
46. San Mauro D, Gower DJ, Oommen OV, Wilkinson M, Zardoya R: Phylogeny ofcaecilian amphibians (Gymnophiona) based on complete mitochondrialgenomes and nuclear RAG1. Mol Phylogenet Evol 2004, 33:413–427.
47. Boore JL: Animal mitochondrial genomes. Nuc Acids Res 1999, 27:1767–1780.48. Kurabayashi A, Sumida M: PCR Primers for the neobatrachian
mitochondrial genome. Curr Herpetol 2009, 28:1–11.49. Venkatesh B, Erdmann MV, Brenner S: Molecular synapomorphies resolve
evolutionary relationships of extant jawed vertebrates. Proc Natl Acad SciUSA 2001, 98:11382–11387.
50. Vieites DR, Min M-S, Wake DB: Rapid diversification and dispersal duringperiods of global warming by plethodontid salamanders. Proc Natl AcadSci USA 2007, 104:19903–19907.
51. Colgan DJ, Ponder WF, Eggler PE: Gastropod evolutionary rates andphylogenetic relationships assessed using partial 28S rDNA and histoneH3 sequences. Zool Scr 2000, 29:29–63.
52. Wyman SK, Jansen RK, Boore JL: Automatic annotation of organellargenomes with DOGMA. Bioinformatics 2004, 20:3252–3255.
53. Lupi R, de Meo PDO, Picardi E, D'Antonio M, Paoletti D, Castrignanò T, Pesole G,Gissi C: MitoZoa: a curated mitochondrial genome database of metazoansfor comparative genomics studies. Mitochondrion 2010, 10:192–199.
54. Abascal F, Zardoya R, Telford MJ: TranslatorX: multiple alignment of nucleotidesequences guided by amino acid translations. Nuc Acids Res 2010, 38:W7–W13.
55. Katoh K, Misawa K, Kuma KI, Miyata T: MAFFT: A novel method for rapidmultiple sequence alignment based on fast Fourier transform. Nuc AcidsRes 2002, 30:3059–3066.
56. Castresana J: Selection of conserved blocks from multiple alignments fortheir use in phylogenetic analysis. Mol Biol Evol 2000, 17:540–552.
57. Felsenstein J: Evolutionary trees from DNA sequences: a maximumlikelihood approach. J Mol Evol 1981, 17:368–376.
58. Stamatakis A: RAxML-VI-HPC: maximum likelihood-based phylogeneticanalyses with thousands of taxa and mixed models. Bioinformatics 2006,22:2688–2690.
59. Huelsenbeck JP, Ronquist F, Nielsen R, Boldback JP: Bayesian inference ofphylogeny and its impact on evolutionary biology. Science 2001,294:2310–2314.
60. Huelsenbeck JP, Ronquist F: MRBAYES: Bayesian inference of phylogenetictrees. Bioinformatics 2001, 17:754–755.
61. Ronquist F, Huelsenbeck JP: MrBayes 3: Bayesian phylogenetic inferenceunder mixed models. Bioinformatics 2003, 19:1572–1574.
62. Stamatakis A, Blagojevic F, Nikolopoulos D, Antonopoulos C: Exploring newsearch algorithms and hardware for phylogenetics: RAxML meets theIBM cell. J VLSI Signal Proc 2007, 48:271–286.
63. Rambaut A, Drummond AJ: Tracer v. 1.5. 2009. [http://tree.bio.ed.ac.uk/software/tracer/]
64. Nylander JAA, Wilgenbusch JC, Warren DL, Swofford DL: AWTY (are wethere yet?): a system for graphical exploration of MCMC convergence inBayesian phylogenetics. Bioinformatics 2008, 24:581–583.
65. Felsenstein J: Confidence limits on phylogenies: an approach using thebootstrap. Evolution 1985, 39:783–791.
66. Roelants K, Gower DJ, Wilkinson M, Loader S, Biju SD, Guillaume K, Moriau L,Bossuyt F: Global patterns of diversification in the history of modernamphibians. Proc Natl Acad Sci USA 2007, 104:887–892.
67. San Mauro D, Vences M, Alcobendas M, Zardoya R, Meyer A: Initialdiversification of living amphibians predated the breakup of Pangaea.Am Nat 2005, 165:590–599.
68. Akaike H: Information theory and an extension of the maximumlikelihood principle. In Second international symposium of informationtheory. Edited by Petrov BN, Csaki F. Budapest: Akademiai Kiado; 1973.
69. Lanfear R, Calcott B, Ho SYW, Guindon S: PartitionFinder: combinedselection of partitioning schemes and substitution models forphylogenetic analyses. Mol Biol Evol 2012, 29:1695–1701.
70. Drummond AJ, Rambaut A: BEAST: Bayesian evolutionary analysis bysampling trees. BMC Evol Biol 2007, 7:214–721.
71. Drummond AJ, Ho SYW, Phillips MJ, Rambaut A: Relaxed phylogeneticsand dating with confidence. PLoS Biol 2006, 4:e88.
72. Yule GU: A mathematical theory of evolution, based on the conclusionsof Dr. J. C. Willis, F.R.S. Phil Trans R Soc B 1924, 213:21–87.
73. Martín C, Sanchíz B: Lisanfos KMS. Version 1.2. Madrid, Spain: Museo Nacionalde Ciencias Naturales, CSIC; 2010. Online reference [http://www.lisanfos.mncn.csic.es/]
74. Sarich VM, Wilson AC: Generation time and genomic evolution inprimates. Science 1973, 179:1144–1147.
75. Robinson-Rechavi M, Huchon D: RRTree: relative-rate tests between groupsof sequences on a phylogenetic tree. Bioinformatics 2000, 16:296–297.
76. Li P, Bousquet J: Relative rate test for nucleotide substitutions betweentwo lineages. Mol Biol Evol 1992, 9:1185–1189.
77. Robinson M, Gouy M, Gautier C, Mouchiroud D: Sensitivity of the relative-rate test to taxonomic sampling. Mol Biol Evol 1998, 15:1091–1098.
78. Kimura M: A simple method for estimating evolutionary rates of basesubstitutions through comparative studies of nucleotide sequences.J Mol Evol 1980, 16:111–120.
79. Yang Z: Computational molecular evolution. New York: Oxford UniversityPress; 2006.
80. Buschiazzo E, Ritland C, Bohlmann J, Ritland K: Slow but not low: genomiccomparisons reveal slower evolutionary rate and higher dN/dS inconifers compared to angiosperms. BMC Evol Biol 2012, 12:8.
81. Yang Z: PAML: a program package for phylogenetic analysis bymaximum likelihood. Comput Appl Biosci 1997, 13:555–556.
82. Anisimova M, Bielawski JP, Yang Z: Accuracy and power of the likelihoodratio test in detecting adaptive molecular evolution. Mol Biol Evol 2001,18:1585–1592.
83. Hooft RWW, Sander C, Scharf M, Vriend G: The PDBFINDER database: asummary of PDB, DSSP and HSSP information with added value.Comput Appl Biosci 1996, 12:525–529.
84. Krogh A, Larsson B, von Heijne G, Sonnhammer ELL: Predictingtransmembrane protein topology with a hidden Markov model:application to complete genomes. J Mol Biol 2011, 305:567–580.

Irisarri et al. BMC Genomics 2012, 13:626 Page 18 of 19http://www.biomedcentral.com/1471-2164/13/626
85. Sumida M, Kanamori Y, Kaneda H, Kato Y, Nishioka M, Hasegawa M,Yonekawa H: Complete nucleotide sequence and gene rearrangement ofthe mitochondrial genome of the Japanese pond frog Rananigromaculata. Genes Genet Syst 2001, 76:311–325.
86. Mindell DP, Sorenson MD, Dimcheff DE: Multiple independent origins ofmitochondrial gene order in birds. Proc Natl Acad Sci USA 1998,95:10693–10697.
87. San Mauro D, Gower DJ, Zardoya R, Wilkinson M: A hotspot of gene orderrearrangement by tandem duplication and random loss in thevertebrate mitochondrial genome. Mol Biol Evol 2006, 23:227–234.
88. Moritz C, Brown WM: Tandem duplications of D-loop and ribosomal RNAsequences in lizard mitochondrial DNA. Science 1986, 233:1425–1427.
89. Boore JL: The duplication/random loss model for gene rearrangementexemplified by mitochondrial genomes of deuterostome animals. InComparative genomics. Edited by Sankoff D, Nadeau JH. Kluwer AcademicPublisher; 2000:133–147.
90. Kurabayashi A, Sumida M, Yonekawa H, Glaw F, Vences M, Hasegawa M:Phylogeny, recombination, and mechanisms of stepwise mitochondrialgenome reorganization in Mantellid frogs from Madagascar. Mol Biol Evol2008, 25:874–891.
91. Kurabayashi A, Usuki C, Mikami N, Fujii T, Yonekawa H, Sumida M, HasegawaM: Complete nucleotide sequence of the mitochondrial genome of aMalagasy poison frog Mantella madagascariensis: evolutionaryimplications on mitochondrial genomes of higher anuran groups.Mol Phylogenet Evol 2006, 39:223–236.
92. Mabuchi K, Miya M, Satoh TP, Westneat MW, Nishida M: Gene rearrangementsand evolution of tRNA pseudogenes in the mitochondrial genome of theParrotfish (Teleostei: Perciformes: Scaridae). J Mol Evol 2004, 59:287–297.
93. Miya M, Takeshima H, Endo H, Ishiguro NB, Inoue JG, Mukai T, Satoh TP,Yamaguchi M, Akira K: Major patterns of higher teleostean phylogenies: anew perspective based on 100 complete mitochondrial DNA sequences.Mol Phylogenet Evol 2003, 26:121–138.
94. Miya M, Kawaguchi A, Nishida M: Mitogenomic exploration of higherteleostean phylogenies: a case study for moderate-scale evolutionarygenomics with 38 newly determined complete mitochondrial DNAsequences. Mol Biol Evol 2001, 18:1993–2009.
95. García-París M, Buchholz DR, Parra-Olea G: Phylogenetic relationships ofPelobatoidea re-examined using mtDNA. Mol Phylogenet Evol 2003,28:12–23.
96. Duellman WE: On the classification of frogs. Occ Pap Mus Nat Hist UnivKansas 1975, 42:1–14.
97. Reig OA: Proposiciones para una nueva macrosistemática de los anuros(nota preliminar). Physis 1958, 21:109–118.
98. Savage JM: The geographic distribution of frogs: Patterns andpredictions. In Evolutionary biology of the anurans: Contemporary researchon major problems. Edited by Vial JL. Columbia: Columbia University Press;1973:351–445.
99. Roelants K, Haas A, Bossuyt F: Anuran radiations and the evolution oftadpole morphospace. Proc Natl Acad Sci USA 2011, 108:8731–8736.
100. Zhang P, Zhou H, Chen Y-Q, Liu Y-F, Qu L-H: Mitogenomic perspectives onthe origin and phylogeny of living amphibians. Syst Biol 2005, 54:391–400.
101. Vences M, Vieites DR, Glaw F, Brinkmann H, Kosuch J, Veith M, Meyer A:Multiple overseas dispersal in amphibians. Proc R Soc B 2003,270:2435–2442.
102. Thorne JL, Kishino H: Divergence time and evolutionary rate estimationwith multilocus data. Syst Biol 2002, 51:689–702.
103. Thorne JL, Kishino H, Painter IS: Estimating the rate of evolution of therate of molecular evolution. Mol Biol Evol 1998, 15:1647–1657.
104. San Mauro D, Agorreta A: Molecular systematics: a synthesis of thecommon methods and the state of knowledge. Cell Mol Biol Lett 2010,15:311–341.
105. Báez AM, Moura GJB, Gómez RO: Anurans from the lower cretaceouscrato formation of northeastern Brazil: implications for the earlydivergence of neobatrachians. Cretaceous Res 2009, 30:829–846.
106. Rodríguez-Trelles F, Tarrío R, Ayala FJ: A methodological bias towardoverestimation of molecular evolutionary time scales. Proc Natl Acad SciUSA 2002, 99:8112–8115.
107. Comeron JM, Williford A, Kliman RM: The Hill-Robertson effect:evolutionary consequences of weak selection and linkage. Heredity 2008,100:19–31.
108. Arbiza L, Dopazo J, Dopazo H: Positive selection, relaxation, andacceleration in the evolution of the human and chimp genome.PLoS Comput Biol 2006, 2:e38.
109. Bromham L: The genome as a life-history character: why rate ofmolecular evolution varies between mammal species. Phil Trans R Soc B2011, 366:2503–2513.
110. Thomas JA, Welch JJ, Lanfear R, Bromham L: A generation time effect onthe rate of molecular evolution in invertebrates. Mol Biol Evol 2010,27:1173–1180.
111. Wells KD: The Ecology and Behavior of Amphibians. Chicago: The Universityof Chicago Press; 2007.
112. Lannoo M (Ed): Amphibian declines. The conservation status of United Statesspecies. Berkeley: University of California Press; 2005.
113. De Magalhães JP, Costa J: A database of vertebrate longevity records andtheir relation to other life-history traits. J Evol Biol 2009, 22:1770–1774.
114. Nabholz B, Glémin S, Galtier N: Strong variations of mitochondrialmutation rate across mammals—the longevity hypothesis. Mol Biol Evol2008, 25:120–130.
115. Galtier N, Jobson RW, Nabholz B, Glémin S, Blier PU: Mitochondrial whims:metabolic rate, longevity and the rate of molecular evolution. Biol Lett2009, 5:413–416.
116. Bronikowski AM, Promislow DEL: Testing evolutionary theories of aging inwild populations. Trends Ecol Evol 2005, 20:271–273.
117. Martin AP, Palumbi SR: Body size, metabolic rate, generation time, andthe molecular clock. Proc Natl Acad Sci USA 1993, 90:4087–4091.
118. Vinogradov AE: Nucleotypic effect in homeotherms: body-mass-correctedbasal metabolic rate of mammals is related to genome size. Evolution1995, 49:1249–1259.
119. Gregory TR: A bird's-eye view of the c-value enigma: genome size, cellsize, and metabolic rate in the class Aves. Evolution 2002, 56:121–130.
120. Licht LE, Lowcock LA: Genome size and metabolic rate in salamanders.Comp Biochem Phys B 1991, 100:83–92.
121. Gregory TR: Animal Genome Size Database; 2012. [http://www.genomesize.com]
122. Shao R, Dowton M, Murrell A, Barker SC: Rates of gene rearrangement andnucleotide substitution are correlated in the mitochondrial genomes ofinsects. Mol Biol Evol 2003, 20:1612–1619.
123. Xu W, Jameson D, Tang B, Higgs P: The relationship between the rate ofmolecular evolution and the rate of genome rearrangement in animalmitochondrial genomes. J Mol Evol 2006, 63:375–392.
124. Kurabayashi A, Yoshikawa N, Sato N, Hayashi Y, Oumi S, Fujii T, Sumida M:Complete mitochondrial DNA sequence of the endangered frogOdorrana ishikawae (family Ranidae) and unexpected diversityof mt gene arrangements in ranids. Mol Phylogenet Evol 2010,56:543–553.
125. Ren F, Tanaka H, Yang Z: A likelihood look at the supermatrix-supertreecontroversy. Gene 2009, 441:119–125.
126. Sano N, Kurabayashi A, Fujii T, Yonekawa H, Sumida M: Completenucleotide sequence of the mitochondrial genome of Schlegel's treefrog Rhacophorus schlegelii (family Rhacophoridae): duplicated controlregions and gene rearrangements. Genes Genet Syst 2005,80:213–224.
127. Liu Z-Q, Wang Y-Q, Su B: The mitochondrial genome organization of therice frog, Fejervarya limnocharis (Amphibia: Anura): a new gene order inthe vertebrate mtDNA. Gene 2005, 346:145–151.
128. Webster AJ, Payne RJH, Pagel M: Molecular phylogenies link rates ofevolution and speciation. Science 2003, 301:478.
129. Venditti C, Pagel M: Speciation as an active force in promoting geneticevolution. Trends Ecol Evol 2009, 25:14–20.
130. Pagel M, Venditti C, Meade A: Large punctuational contribution ofspeciation to evolutionary divergence at the molecular level. Science2006, 314:119–121.
131. Davies TJ, Savolainen V, Chase MW, Moat J, Barraclough TG: Environmentalenergy and evolutionary rates in flowering plants. Proc R Soc B 2004,271:2195–2200.
132. Dubois A: Developmental pathway, speciation and supraspecifictaxonomy in amphibians. 1. Why are there so many frog species in SriLanka? Alytes 2004, 22:19–37.
133. Roček Z: Mesozoic anurans. In Amphibibian Biology. Edited by Heatwole H,Carroll RL. Chipping Norton, Australia: Surrey Beatty; 2000:1295–1331.

Irisarri et al. BMC Genomics 2012, 13:626 Page 19 of 19http://www.biomedcentral.com/1471-2164/13/626
134. Roček Z, Rage JC: Tertiary anura of Europe, Asia, Africa, Asia, NorthAmerica and Australia. In Amphibian Biology. Edited by Heatwole H, CarrollRL. Chipping Norton, Australia: Surrey Beatty; 2000:1332–1387.
135. Lahti DC, Johnson NA, Ajie BC, Otto SP, Hendry AP, Blumstein DT, Coss RG,Donohue K, Foster SA: Relaxed selection in the wild. Trends Ecol Evol 2009,24:487–496.
doi:10.1186/1471-2164-13-626Cite this article as: Irisarri et al.: The origin of modern frogs(Neobatrachia) was accompanied by acceleration in mitochondrial andnuclear substitution rates. BMC Genomics 2012 13:626.
Submit your next manuscript to BioMed Centraland take full advantage of:
• Convenient online submission
• Thorough peer review
• No space constraints or color figure charges
• Immediate publication on acceptance
• Inclusion in PubMed, CAS, Scopus and Google Scholar
• Research which is freely available for redistribution
Submit your manuscript at www.biomedcentral.com/submit