the organization of r&d within –rms: measures ... · pdf filethe organization of...
TRANSCRIPT

The organization of R&D within �rms: Measures,characteristics and consequences�
Ashish Aroray Sharon Belenzonz Luis A. Riosx
October 17, 2010
Abstract
We explore the relationship between �rms�R&D organization and performance.Both the information-processing view and the incentives-based view of �rm orga-nization imply that centralized R&D will be more scienti�c, broader in scope, andhave more technical impact, while being more likely in �rms that operate with anarrower range of businesses or in complex technologies, and are more reliant uponacquisitions. Empirically, we develop a novel dataset on the organizational struc-ture of 1,290 American publicly-listed corporations, 2,615 of their a¢ liate �rms, aswell as characteristics of 594,903 patents that they hold. By using intra-�rm patentassignments to a¢ liates as a proxy, we measure the level of �rm-level R&D decen-tralization, and generally �nd support for our propositions. Additionally, we �ndstrong results for impact on outcomes that are not clearly predicted by current the-ories: �rms that decentralize R&D invest less in R&D and produce fewer patents,while exhibiting greater sales growth and higher market value. We discuss possibleexplanations for these �ndings.
Keywords: decentralization, patent assignment, market value, R&D
JEL Classi�cation: D23 D83 L22
�Acknowledgement: We thank seminar participants at the 2010 NBER Summer institute for helpfulcomments. We thank Hadar Gafni and Anubhav Mehrota for excellent research assistance. All remainingerrors are our own.
yDuke University, Fuqua School of Business ([email protected]), and NBERzDuke University, Fuqua School of Business ([email protected])xDuke University, Fuqua School of Business ([email protected])
1

1 Introduction
Our understanding of how organizations function has advanced substantially in the decades
since Coase, Simon andWilliamson began to investigate the determinants of organizational
arrangements. And yet due to the di¢ culty of looking inside the black box of the �rm,
many debates pertaining to the internal organization of �rms (including why �rms cen-
tralize or decentralize, which is our present subject) remain unresolved. In this paper we
advance this exploration by analyzing new data on the assignment of patent rights within
large American �rms, using the decision to assign patents either to headquarters or to
a¢ liates as a proxy for the level of de facto decentralization of R&D in a �rm. We shall
discuss the strengths and weaknesses of our measure in section 2. We recognize that it
is plausible, and even likely, that our measure captures centralization or decentralization
of other types of authority in the �rm as well (such as management of intellectual prop-
erty, and licensing), not merely that of R&D. Nonetheless, we shall largely speak of R&D,
mostly for sharpness in exposition.
There are a variety of theoretical perspectives, and a wealth of historical experience,
on the determinants and implications of centralizing R&D activities. As we discuss be-
low, neither theory nor historical experience suggests that one organizational form would
dominate the other, and this is not the focus of paper either. Instead, our objective is
to provide a systematic empirical examination of the phenomenon, both useful in itself,
and to inform further theory development. In this paper, we document (a) the charac-
teristics of the research under di¤erent organizational forms, and (b) the implications of
the di¤erent forms for outcomes such as R&D investment, patenting, growth and market
value.
Our paper combines data from several sources: (i) patent level information from the
United States Patent and Trademark O¢ ce (USPTO), (ii) ownership structure data from
Icarus and Amadeus by Bureau Van Dyke, (iii) Merger and acquisition data from Thomson
Reuters SDC Platinum and Zephyr by Bureau Van Dyke, and (iv) accounting information
from U.S. Compustat. Our sample includes 594,903 patents that are matched to 1,290
American publicly-listed corporations, a total of 30,834 of their private and public a¢ liates,
of which 2,615 were assigned at least one patent. We matched a total of 594,903 patents
to our �rm sample, where 107,654 of these patents (18.1%) are assigned to a¢ liates.
2

Though a vast literature deals with the decentralization of tasks and authority in or-
ganizations, the majority of this work tents to be theoretical (see Mookherjee 2004 for
a review of the economics literature), and empirical studies remain scarce. Most of the
empirical studies focus on the impact of changes in communication costs or the adoption
of information technology. For example, using US data, Rajan and Wulf (2005) provide
empirical evidence that �rms tend to select �atter organizational structures in more recent
years relative to the past. Bresnahan, Brynjolfsson and Hitt (2002) and Caroli and Van
Reenen (2001) �nd that with greater investment in information technology, �rms tend
to adopt more decentralized organizational structures. Acemoglu, Aghion, Lelarge, Van
Reenan and Zilibotti (2007) show that for Britsh and French manufacturing �rms in the
1990s, those closer to the technological frontier, operating in more heterogeneous envi-
ronments, or younger, are more likely to decentralize. Colombo and Delmastro (2004)
�nd that local information increases decentralization to plant managers in Italian �rms,
as does superior communication technology, but centralization increases with the need for
coordination. Bloom, Sadun, and Van Reenen (2008) study decentralization to local plant
managers in a large sample and �nd that trust and social norms increase decentralization
as does product market competition (which proxies for importance of local information).
Hubbard (2003) shows that the use of on-board computers in trucking improved coordi-
nation between dispatchers and drivers, and increased productivity.
This empirical research is motivated by a variety of theoretical perspectives, which can
be broadly classi�ed into two major ones: information processing, and incentive based.
A standard approach to decentralization posits the existence of di¤erences in information
between levels of the �rm (e.g., Radner and Jacob Marschak 1972). In our context, an
a¢ liate (which we use loosely to include divisions and business units) may have more
information than headquarters about which research projects are worth pursuing, which
inventions are worth patenting, which patents are worth maintaining and enforcing, and
which licensing deals are worthwhile. Superior information implies that the a¢ liate can
make better decisions. However, though better informed about its own needs, the a¢ liate
may be ill-informed about those other parts of the �rm. Thus, leaving the a¢ liate with
the authority over these decisions has to be balanced against other considerations. In the
information processing view, the principal one is the cost and time involved in communi-
cating the relevant information up the hierarchy, needed for coordinating the actions of
3
the various a¢ liates. If communicating this information to headquarters in full detail is
costly or otherwise not possible, this literature (e.g., Radner and Jacob Marschak, 1972)
has argued that splitting tasks by means of a hierarchy can be useful to minimize delay
(Radner 1993; Van Zandt, 1999), facilitate specialization (Bolton and Dewatripont, 1994),
or both (Patacconi, 2009).
The incentives based perspective, in which we include both transaction costs (e.g.,
Williamson, 1975) and the principal-agent theory, has identi�ed a second set of tradeo¤s.
Delegating authority to the a¢ liate raises the possibility that the a¢ liate, though having
superior information, may still take ine¢ cient decisions because its interests are not fully
aligned with those of the �rm as a whole. Managers in the a¢ liate may fear being "held-
up" by top management, and thus under-invest. Decentralization is a means of credibly
assuring them against such expropriation. For instance, Riordan (1990) provides a model
in which a principal delegates authority to provide incentives for cost reduction. Aghion
and Tirole (1997) provide a model in which a principal delegates authority as a credible
way of leaving information rents with the agent, so as to provide incentives for suitable
choice of projects. Credible delegation of authority can be optimal because it promotes
high-powered incentives to managers in the form of contracting on observable outcomes,
or by managing strategic communication of information, which may be costless but pos-
sibly biased (Dessein 2002; Alonso, Dessein and Matoushek, 2008). Similarly, Belenzon,
Berkovitz and Bolton (2009) argue that a¢ liates in business groups have superior incen-
tives to invest in more basic innovation because they enjoy greater legal protection against
the "parent" �rm expropriating their rents from innovation. Of course, as clear in Baker
and Hubbard (2003), and Dessein, Garicano, and Gertner, (2009), incentive alignment
and coordination problems also interact. Indeed, there is a vast literature in economics on
this topic, and the reader is referred to Mookherjee (2004) for a review.
Scholars have emphasized other incentive-related channels through which decentral-
ization may a¤ect behavior. Most notably decentralization is arguably associated with
higher �exibility (Child, 1984, Mintzberg, 1979), independence (Kanter, 1985), initiative
(Chandler, 1977), or merely through the motivation arising from the perception of freedom
(Gupta and Govindarajan, 2000) or pride of ownership (Estrin et al. 1987), which may
stem from being associated with the generation of inventions. This is especially interest-
ing as a counterpoint to the well documented "not invented here" (NIH) syndrome , e.g.
4

(Rotemberg and Saloner, 1994, Szulanski 2009; Teece 1996) that has plagued many �rms
post-merger, where divisions are reluctant to embrace ideas coming from other parts of
the organization.
The speci�c focus of this paper� on the decentralization of innovation activities�
builds upon Argyris and Silverman (2006), and Kastl, Martimort and Piccolo (2009).
Kastl et al. (2009) frame their study in terms of whether decentralization �delegation
of authority regarding R&D as well as �nancial, administrative and business decisions to
divisions and a¢ liates �provides superior incentives for investment in R&D. They �nd
that decentralization is associated with greater investments in R&D in Italian manufac-
turing �rms. They also explore the determinants of decentralization and �nd, contrary to
Acemoglu et al. (2007), that age, distance to the technology frontier, and heterogeneity of
the environment are not associated with decentralization. Argyris and Silverman (2006)
study the organization of R&D in a sample of 71 large US corporations. Unlike Kastl et
al. (2007), they focus speci�cally on the organization of R&D, rather than the organiza-
tion of the �rm more broadly. Building on both the information processing perspective
and the incentive perspective, they hypothesize and �nd that decentralized R&D results
in lower impact research outcomes, and with research that is narrower in technical and
organizational scope.
We contribute to this research in a number of ways. First, unlike Kastl et al. (2009) and
Arygris and Silverman (2006), we do not use survey based measures of decentralization.
Instead, we use observed behavior (i.e., whether patents are assigned to the parent entity
or decentralized to divisions) as a measure of the extent of decentralization. Patent data
are widely available and our study opens the possibility for further research using patent
assignments in this manner. Unlike Kastl et al. (2009), whose sample is mostly small
Italian manufacturing �rms, our sample consists of nearly 1500 large, publicly traded, US
�rms. Our sample, though similar to Argyris and Silverman (2006) is considerably larger,
and we can also explore the determinants of decentralization, as well as it consequences.
Thus, we study not only the nature of R&D, as Argyris and Silverman (2006) do, and the
amount of R&D, as in Kastl et al. (2009) do, we also study how decentralization is related
to patenting behavior itself (i.e., we estimate a patent production function). Moreover,
we also study how the extent of decentralization is related to other outcomes such as sales
growth and the market value of the intellectual assets of the �rm.
5

We �nd that decentralization is more likely for �rms that operate in discrete technology
industries, have a greater focus on incremental R&D, rely more heavily on acquisitions, and
that manage a diverse range of technologies. We also �nd that centralization is associated
with greater emphasis on science. Further, decentralized �rms tend to invest less in R&D,
generate fewer patents from their R&D, but also grow faster. Intriguingly, we also �nd
that decentralization explains a substantial portion of the variation in the market value
of the �rms in our sample.
The rest of the paper is organized as follows: In Section 2 we discusses the various
issues associated with using patent assignments to measure the extent of decentralization
of R&D. Section 3 discusses the contrasting implications of centralizing versus decentral-
ized R&D in multidivisional �rms. Section 4 describes the data and our measures, and
discusses some strengths and weaknesses. Section 5 presents our empirical �ndings on
how decentralization is related to the nature of the �rm�s environment, and the nature of
its research. Section 6 explores the relationship between decentralization and outcomes.
Section 7 concludes by summarizing our �ndings and discussing the implications for theory
and practice.
2 Patent assignment and decentralization
2.1 Patent assignment as a measure of R&D decentralization
Our principal measure of the extent of decentralization is the share of patents that are
assigned to wholly-owned American a¢ liates. This measure has the advantage that it is
based on observed behavior, can be used for large samples, and it can be easily replicated
in other settings, because it is not based on ad hoc surveys. Its use as a measure of
decentralization of R&D raises several issues.
It is possible that a business or division inside a �rm have de-facto authority over its
R&D and innovation, but because it is not a distinct legal entity, does not have patents
assigned to it. In other words, roughly speaking, decentralization of patents is a su¢ cient,
but not necessary condition. Even so, the very fact that an a¢ liate is a distinct entity,
rather than merely a division of the parent, is signi�cant. Frequently, when a business is
acquired, the acquirer faces the choice of dissolving the acquired entity and integrating
it, or letting it remain distinct. The assignment of patents is a signal, therefore, that
6

the acquired business enjoys a signi�cant measure of autonomy, including the freedom to
direct its R&D. For example, Genentech, though wholly-owned by Ho¤man La Roche,
directly contracts on licensing the patents in its charge to outside �rms. This ability
to independently write contracts may have incentives implications not found where all
contracts are centrally underwritten. Assignment may also reinforce the identi�cation
and long-term ties between a manager and the patents she manages, so that opportunistic
behavior costly in terms of reputation (Gibbons, et al., 1999; Alonso and Matoushek,
2007). Some of these themes repeatedly occurred in our interviews with managers from
sample �rms.
A second issue is that patent assignments may re�ect decentralization of authority more
broadly, rather than merely R&D. In this sense, our measure could pick up not simply
R&D decentralization but also decentralization of other types of functional authority. We
readily acknowledge this. Note that by construction we only observe patent assigned
to a¢ liates if the a¢ liates are distinct legal entities, albeit wholly owned entities. This
implies that our measure of decentralization is likely an under-estimate of the true extent
of decentralization. Although this is not classical measurement error, it is likely that the
estimated coe¢ cients su¤er from attenuation bias. That is, we are likely underestimating
the association between decentralization and various other economic outcomes of interest.
Conversely, one might suspect that patent assignments re�ect much narrower decen-
tralization � instead of re�ecting decentralization of R&D, we are merely observing the
decentralization of IP management. Patent assignments can be driven by tax avoidance
strategies. This is particularly salient in international settings, which do not apply in
our context. However it is also featured in some of the cases in our sample, where all
patents are assigned to a wholly owned subsidiary that is located in states that do not
tax royalty incomes. We conservatively classify all such instances as if the patents were
assigned to the parent �rm. Patent assignment may also be driven by a desire to have
patents assigned in the name of the relevant business to make it easier to assert patents,
obtain injunctions, and receive adequate damages. However, this concern only arises if
the business in question is a distinct legal entity rather than a division of the parent �rm,
suggesting decentralization.
A di¤erent interpretation, which also supports the delegation of authority interpreta-
tion, is that a¢ liates which may be potentially divested in the future are also likely to
7

enjoy greater autonomy, including autonomy in managing their intellectual property. For
instance, when Motorola divested its semiconductors manufacturing business (now called
Freescale Semiconductors), there was considerable delay in sorting out which Motorola
patents were going to be assigned to the divested business. This example, which emerged
in one of our interviews, suggests that patent assignments are a plausible signal that the
a¢ liate has a certain "hands-o¤" relationship with the parent.
There are some other potential concerns, which, however, do not appear to be as
salient in our context. First, contrary to our assertion, it is possible that an a¢ liate may
receive patent assignments without enjoying the hypothesized autonomy. Our interviews
suggested the contrary. Second, patent assignments may simply re�ect corporate inertia,
with no implications for the allocation of decision making authority or autonomy. We can
rule this out. We systematically investigate patent reassignments. Reassignment of patents
signal intent ��rms have to incur cost and e¤ort to reassign patents. It is reassuring that
the vast bulk of reassignments are from headquarters to a¢ liates, indicating that at the
very least, our measure of decentralization re�ects intent rather than mere inertia.
On balance, we believe that patent assignment to a¢ liate are a signal, albeit perhaps
a noisy signal, that the a¢ liate enjoys autonomy regarding R&D decisions, as well as
perhaps other types of business decisions.
2.2 Organization of R&D within multidivisional �rms
The tension between centralization and decentralization of R&D in American corporations
has persisted for several decades. Hounshell and Smith�s classical study of R&D in Du
Pont highlights these tensions, which are re�ected in the shift between decentralization
and centralization. Du Pont�s pre-WWI diversi�cation e¤orts created a situation where
the centralized R&D was deemed as insu¢ ciently responsive to the needs of a diverse set
of businesses which included explosives, celluloid plastics and �lms, lacquers, paints and
varnishes, and dyestu¤s. Consequently, during the 1920s, the individual businesses were
given authority over their R&D activities, with each business creating a separate research
division to serve its needs. Under Charles Stine, centralized R&D gradually grew and
regained prominence by 1928. Centralization grew partly because the various businesses
were still connected by a common scienti�c base, so that a new type of nitrocellulose
based lacquer �nish, Duco, was invented by the cellulose division instead of the paints
8

and varnish division. Duco proved to be a major success, and highlighted the problems
with decentralized R&D�R&D often had spillovers, and thus, decentralized R&D required
extensive coordination. For instance, using Duco for furniture required additional technical
advances in resins, which were carried out by the Chemical Department, as Du Pont�s
central R&D organization was called. Interestingly, Du Pont patented these inventions
and forced other paint manufacturers to take licenses. Hounshell and Smith (1988: 146)
report that Duco royalties amounted to more than $10 million, compared to the $750,000
that Du Pont had invested in developing it.
Centralization of R&D was also helped by the need of successful businesses, such as
Rayon, for growth opportunities. However, researchers in the rayon division were con-
strained to work on cellulosic �bers (of which Rayon is an instance). The true opportu-
nities, however, were in synthetic �bers. The general manager of the Rayon division was
reluctant to authorize more broad ranging research. As one R&D manager noted in 1933
"In our some ten years rayon experience, we have in but two cases bent any part of our
research program in a direction other than one relating directly to the most immediate
manufacturing and selling problems . . . Unless we conclude that there will be no radical
departures in the synthetic �ber (or �lm) industry in the next ten years, then it must be
concluded that our technical program falls short in its more radical and forward looking
aspects". (Hounshell and Smith, 1988: 181-182). The point, as Argyris and Silverman
stress, is that decentralized R&D tends to be product focused. Central R&D organi-
zations are both better able and better motivated to invest in more basic, non-speci�c
R&D. Sometimes, this type of research yields huge payo¤s, as Charles Stine�s investment
in polymer R&D did, when it yielded both neoprene (a synthetic rubber) and nylon.
The scienti�c and commercial success of Nylon is well known. Less appreciated, per-
haps, is the impact on the organization of R&D. Simply put, it provided the justi�cation
for a major investment in basic research in Du Pont, almost exclusively conducted by the
Chemical Department under Charles Stine. Although this research yielded a number of
other major technical advances and contributed to the development of major new products
such as polyethylene and polyester, it also led to a focus on science and on basic research.
Indeed, the new laboratory for fundamental research was dubbed "Purity Hall" by Du
Pont chemists, signifying its distance from the grubbier concerns of the businesses. This
is another feature of centralized research. Along with a focus on non-speci�c research,
9

centralized R&D also tends to be more scienti�c in its orientation.
The same tension is also illustrated in a di¤erent case, half a century later, in a di¤erent
technology and company, IBM. IBM scientists made fundamental contributions to the de-
velopment of relational databases, which help store and retrieve electronic data e¢ ciently.
Yet, it was only when a startup, Software Development Laboratories headed by Larry
Ellison, that would later become Oracle Corporation commercially introduced a relational
database that the IBM database division took notice of the technology. This example,
which is far from the only one of its kind, illustrates the tension. Relational databases
depended on research which was carried out in a central R&D lab, with a strong basic
research orientation. It is unlikely that it would have been developed in a more product
oriented divisional R&D lab. Indeed, recent evidence suggests that Software Develop-
ment Laboratories relied upon the technical disclosures on relational databases by IBM
(Bhaskarabhatla, 2010).
These examples show both the power of centralization and the potential drawbacks.
The information processing perspective suggests that decentralized R&D will exploit local
information more e¤ectively, and that its results will be exploited more readily. The
incentive perspective suggests that decentralized R&D will be more responsive to the needs
of the division or a¢ liate that sponsors the research. In sum, decentralized research will
also be better aligned with the immediate needs of the a¢ liate. However, this research
is less likely to "spillover" to other divisions, both by its narrower scope and because
the a¢ liate would have limited incentives to invest in research that could spillover to
other parts of the �rm. Indeed, the competition for resources inside the �rm may create
incentives against such research, lest it allow other divisions to use the fruits of the research
and claim additional resources, as was apparently the case with Duco and the Cellulose
Division in Du Pont. In contrast, centralized R&D is more conducive to more pioneering
research, research that explores new markets, and more fundamental advances. As the
examples suggest, it is also more susceptible to "capture" by a scienti�c and technical
elite, whose interests may extend well beyond those of the �rm, and who may see their
mission as advancing the technical and scienti�c frontier as much as maximizing the pro�ts
of their �rm.
Furthermore, centralization of R&D also facilitates greater coordination across the
various a¢ liates. This coordination is more valuable when the a¢ liates share common
10

technologies (i.e., are more closely related) or if the products (of the various a¢ liates)
themselves must be mutually compatible or have other forms of inter-dependencies. Put
di¤erently, centralization of R&D is more likely to be observed when the �rm operates a
narrow ranges of businesses, or if the underlying technology is "complex", with marketable
products being composed of many di¤erent parts, often produced by distinct businesses
(see Cohen et al. ). Conversely, a diverse range of businesses and "discrete" technology
would favor decentralization.
A key source of variation across �rms in our data related to decentralization is mergers
and acquisitions. Firms di¤er both in the extent to which they acquire other businesses,
and how they deal with such acquisitions. Centralization is obviously easier to manage
if acquisitions are relatively rare, because each acquisition would then require integration
of new research teams and organizations. Conversely, decentralized �rms would naturally
�nd it easier to deal with acquisitions. Finally, mergers, acquisitions and divestitures are
a fact of life. Anticipating our empirical analysis, we control for acquisitions and its e¤ects
in a couple of ways that are detailed below.
Following conventional practice in the management and strategy literature, we restate
the above as hypotheses, although we hasten to add that the incentive perspective is rich
enough to allow one to develop scenarios that generate di¤erent implications. For instance,
Belenzon et al. (2009) provide a theoretical model in which broad decentralization of
authority to a¢ liates is a credible means of reassuring managers of the a¢ liate against
interference and expropriation by the parent, inducing them to invest in more basic and
long term research. In this model, decentralization would be associated with more rather
than less basic research.
Hypothesis 1. Centralized R&D will be more scienti�c in orientation, broader in scope,
and have more technical impact. Conversely, decentralized R&D will be less scienti�c,
narrower in scope, and incremental in technical terms.
Hypothesis 2. Centralized R&D is more likely to be observed in �rms operating in a narrow
range of businesses, in complex technologies. Centralized R&D is less likely in �rms that
actively acquire external businesses.
11

2.3 Organization of R&D and outcomes
Theoretical perspectives provide less pointed guidance on how the di¤erent organizational
forms are associated with outcomes. Consider for instance the implications for the extent
of investment in R&D. Here, the information processing perspective is largely agnostic;
local information may imply more or fewer opportunities for R&D. Further, although cen-
tralization might eliminate duplicative research (implying lower R&D), it may also identify
fruitful avenues for research (implying greater R&D). On the other hand, centralization
may allow a more e¢ cient internalization of spillovers, which would imply that centraliza-
tion should be associated with greater R&D. The incentive perspective broadly suggests
that an a¢ liate with greater autonomy would be able to appropriate more of the bene-
�ts from its R&D investment, implying that decentralization should be associated with
greater investments in R&D. Insofar as centralized R&D is associated with greater power
researchers in the �rm, these researchers may be able to capture more resources, re�ected
in bigger R&D budgets.
It is not merely the amount of R&D but also the e¤ectiveness of R&D which is impli-
cated in how innovation is organized. The information processing view would suggest that
decentralized R&D should be more useful for advancing existing businesses but less so in
creating new ones, the ability to internalize spillovers should make centralized R&D more
productive. The incentive approach would suggest that the ability to appropriate returns
would lead to the choice of more productive R&D projects, implying that decentralized
research should be more productive.. However, the researcher-capture view would indicate
that centralized R&D would be less productive.
Given the mixed nature of the �ndings, it seems prudent not to advance hypotheses;
instead, we treat this an empirical matter.
3 Data and measures
Our paper combines data from several sources: (i) patent level information from the
United States Patent and Trademark O¢ ce (USPTO), (ii) ownership structure data from
Icarus and Amadeus by Bureau Van Dyke (BVD), (iii) Merger and acquisition data from
Thomson Reuters SDC Platinum and Zephyr by Bureau Van Dyke, and (iv) accounting
information from U.S. Compustat. The Appendix details the procedures used to construct
12

the various datasets that comprise our platform.
Parent �rms and a¢ liates. Ownership data consists of two parts: cross-sectional
ownership information from Icarus and Amadeus for 2008, and M&A data from SDC
Platinum and Zephyr. The cross-sectional data informs us on existing active a¢ liates, and
the M&A data tell us whether acquired entities have remained independent, been dissolved,
or have been fully integrated into the parent company. Our �nal sample includes 1,290
American publicly-listed corporations. We distinguish active versus "dormant" a¢ liates -
wholly owned subsidiaries with no signi�cant economic activity that exist mainly for tax
purposes, as well as a¢ liates that are established solely as holding vehicles for the purpose
of IP management. This screening leaves us with a total of 30,834 a¢ liates, of which 2,615
are assigned at least one patent during our sample period.
Patents. Patent data are from the USPTO for the period 1975-2007. We match all
granted patents to our sample of �rms and a¢ liates. It is important to stress that we
allocate patents to parent companies only if the parent is the listed assignee. Thus we
distinguish between centrally assigned patents - patents that are directly assigned to the
parent company, and decentralized patents - patents that are assigned to a¢ liates. We
matched a total of 594,903 patents to our �nal sample of Compustat �rms. 107,654 of
these patents (18.1%) are assigned to a¢ liates. Patents assigned to non-active a¢ liates
are classi�ed as if assigned to the parent.
Figures 1 and 2 show how di¤erent the observed patent-assignment behavior of �rms
can be. Abbott Laboratories and Johnson & Johnson are similar in many ways. Both �rms
are heavy patentors, operate in similar industries (pharmaceuticals and medical devices)
and have historically engaged in numerous acquisitions. However, Abbott assigns 67%
of patents centrally, and we see very few patents assigned to Abbott a¢ liates. On the
other hand, Johnson & Johnson shows a scant 8% of centralized patents, and has several
a¢ liates with a higher share of patents than itself.
Insert Figures 1 and 2 here
Scienti�c Publications. Our second measure of innovation are publications in acad-
emic journals. We develop systematic data on �rm publications to proxy for science-based
13

inventive activity by �rms. 1 289 corporations in our sample publish at least one scien-
ti�c publication. Top publishing �rms include IBM (27,879 publications), Merck (14,585
publications), P�zer (7,595 publications), Eli Lilly (7,574 publications), HP (6,874 publi-
cations), and Lockheed Martin (5,482 publications).
Reassignments. We are interested in two reassignment types: (i) reassignments from
parent to a¢ liates, and (ii) from a¢ liate to parent. 2 Reassignment data is taken directly
from the USPTO website (using a specialized �spider�program), and then merged to our
�nal patent sample. To determine reassignment type we match old and new assignees
to our �rm name sample. Ultimately, 41,244 patents in our sample are reassigned. Close
to 90% of these reassignments are assigning a patent from parent to an a¢ liate (36,180
patents).
Accounting and �nancial data. Accounting data are from U.S. Compustat. We match
our �rms using a string name process similar to the one we utilize to match patents to our
ownership structure data. The book value of capital is the net stock of property, plant and
equipment; Employment is the number of employees. R&D is used to create R&D capital
stocks calculated using a perpetual inventory method with a 15% depreciation rate (Hall,
Ja¤e and Trajtenberg, 2005). So the R&D stock, GRD, in year t is GRDt = Rt + (1 ��)GRDt�1 where Rt is the R&D expenditure in year t and � = 0:15. Patents stock, GPatt,
is calculated in an analogous way. Patents stock in year t is GPatt = Pt+(1� �)GPatt�1where Pt is the citations-weights �ow of patents in year t. To control for patent quality we
weight each patent by the ratio between the number of citations it receives and one plus
the average number of citations received by all patents that were granted in the same year.
Firm value is the sum of the values of common stock, preferred stock and total debt net
of current assets. The book value of capital includes net plant, property and equipment,
inventories, investments in unconsolidated subsidiaries and intangibles other than R&D.
Tobin�s Q (market value over capital) was winsorized by setting it to 0.1 for values below
1We match all �rms in our sample to the Thomson�s ISI Web of Knowledge database, which includespublication records on thousands of international scienti�c journals. Belenzon and Patacconi (2010)provide detail on the matching procedure
2For example, we �nd evidence of the �rst type of reassignment in many patents held by BostonScienti�c, which were assigned to a¢ liates such as Advanced Bionics and Sci Med Life Systems years afterBoston Scienti�c bought them. As well, we see patents going from acquired a¢ liate to headquarters, forexample Matrix Semiconductor assigning 157 of its 421 patents to parent company Sandisk. A third typeof reassignment is inter-�rm. Because the current paper deals with intra-�rm allocation of IP rights, weexclude inter-�rm reassignment from our sample.
14

0.1 and at 20 for values above 20.
Tables 1 and 2 provide summary statistics on our �rm sample. Our sample�s average
�rm is valued at $1.4 billion, has $3.6 billion in sales, $488 million in R&D stock, and
holds a stock of 132 cites-weighted patents. Our main variable of interest is the share of
decentralized patents stock. That is, the share of patents that are assigned to a¢ liates,
and not headquarters. On average, the ratio of decentralized patents across �rms is 36%.
Using the patent as the unit of analysis, 18.1% of patents are assigned to a¢ liates (as
we shall see later, �rms that patent a lot are less likely to assign patents to a¢ liates,
which explains the di¤erence between patent and �rm-level assignment). The average
patent receives 8.9 (or 11.3 when restricting the sample to patents that receive at least
one citation).
Table 2 reports the raw correlations between our main variables of interest. Share
decentralized is strongly correlated with the �rm share of acquired patents of it total
patents. Share decentralized is positively correlated with Tobin�s Q (the ratio between
market value and assets) and sales, and is negatively correlated with patents and R&D
stocks and �ows. We next proceed to an econometric investigation of these relationships.
Insert Tables 1 and 2 here
4 Econometric results
4.1 The nature of decentralized research
We estimate the following speci�cation to explore the nature of decentralized research:
Pr(Affiliatei) = �(�1 lnCitesi + �2Basici + �t + �j + �k) (1)
Where Affiliatei is a dummy that receives the value of 1 for patents that are assigned
to a¢ liates (rather than headquarters). Cites is the total number of citations a patent
receives, Basic denotes patent characteristics that we associate with basic inventions (de-
scribed in more detail below), �t denote the patent grant year, �j denotes the patent main
technology area, and �k is the �rm. If decentralized patents are, on average, of lower
quality and more incremental (less basic), we expect b�1 < 0 and b�2 < 0:15
Table 3 reports the estimation results (marginal e¤ects of a Probit model). Here the
general pattern of results is consistent with our Hypothesis 2, which predicts that cen-
tralized R&D will be more likely to be observed in �rms operating in a narrow range of
business, in complex technologies. First, there is a strong positive relationship between
discrete technologies and decentralization. We classify our sample patents to 7 main tech-
nology areas based on their International Patent Classi�cation code3. Discrete technology
areas are pharmaceuticals, biotechnology, and chemicals, where complex technologies in-
clude telecommunications, electronics, semiconductors, and information technology. As
column 1 shows, there is a clear pattern of lower decentralization probability for complex
technologies. The base category is pharmaceuticals, and the sample average probability of
decentralization is 18.1%. Among the discrete technologies, there is not much di¤erence
in decentralization probability relative to pharmaceuticals. For example, the marginal
e¤ect of the biotechnology dummy is 0.017 (a standard error of 0.006), which indicates
the probability of decentralization in biotechnology is only higher by 1.7 percentage points
than the probability of decentralization in pharmaceuticals. However, striking di¤erences
emerge when examining the more complex technologies. The marginal e¤ect of telecom-
munications is -0.105 (a standard error of 0.004), which means that the probability of
decentralization in telecommunications is less than half the probability in pharmaceuti-
cals. For information technologies and semiconductors, the results actually indicate that,
on average, decentralization is completely muted. While the cross-industry results are
de�nitely interesting and consistent with the predictions of the information processing
and incentives theories, it is important to emphasize the low regression R2 (0.038). As we
would expect, a substantial fraction of the variation in our data is still left unexplained.
Second, our results suggest that patent quality and basicness is negatively related to
decentralization. Here the general pattern of results is consistent with our Hypothesis
1 which predicts that centralized R&D will be more scienti�c in orientation, broader in
scope, and have more technical impact.We measure patent quality using the number of
forward citations the patent receives over its life-cycle. Our Basic characteristics variables
include the number of citations the patent makes to non-patent (scienti�c) literature, gen-
erality and originality4. The number of citations the patent makes to scienti�c article is
3Patent that are not classi�ed to any of the main categories are classi�ed under Other.4We follow the widely accepted methodology developed by Trajtenberg, Henderson and Ja¤e (1997)
and de�ne patent generality as inversely proportional to the concentration of the citations it receives
16

potentially an indication of the extent the patent relies on scienti�c knowledge. General-
ity is measured as the breadth of the technology areas across which a patent�s citations
are dispersed, and Originality is the equivalent measure for the citations contained in the
patent. We �nd that, as predicted, centrally assigned patents tend to receive substantially
more citations than decentralized ones. Based on the estimates of column 1, a one stan-
dard deviation increase in the number of citations received lowers the probability that a
patent is assigned to an a¢ liate by 6.4 percentage points (15:9 � (�0:004)), or by 35%percent of the average a¢ liation probability. Patent that are assigned to a¢ liates make
fewer citations to non-patent literature than centrally-assigned patents. 106,617 patents
make at least one non-patent citations. 85% of these patents are centrally assigned. A one
standard deviation increase in the number non-patent citations lowers the decentralization
probability by 3.1 percentage point (3:9� (�0:008)), or by 17 percent of the average a¢ l-iation probability. For generality, moving from the 10th percentile to the 90th percentile
lowers decentralization probability by 2.5 percentage points (1 � (�0:025)), or by 13.8%of the average a¢ liation probability. For originality, the e¤ect is small. Moving from the
10th percentile to the 90th percentile lowers decentralization probability by about 4% of
the average a¢ liation probability. Column 2 con�rms these results continue to hold when
we exclude those patents that receive no citations from the estimation sample.
Third, column 3 shows a positive e¤ect of technical diversity on decentralization prob-
ability, also consistent with Hypothesis 2. Controlling for patents stock and sales, �rms
that patent in more diverse areas, as indicated by the value of their Unrelated Diversi�-
cation, have on average a higher decentralization probability (a marginal e¤ect of 0.024).
Moving from the 10th to the 90th percentile of Unrelated Diversi�cation, raises the prob-
ability of decentralization by about 41% of the mean (0:024�3:10:181
). Interestingly, controlling
for diversity, citations-received is no longer signi�cantly associated with decentralization
across technology areas. Patent i�s generality, Gi, is computed as:
Gi = 1�Xj
�CijCi
�2(2)
Where, j denotes citing three-digit U.S. class (419 classes), Cij is the number of citations received bypatent i from patents in technology �eld j and Ci is the total number of citations received by patent i.
Following Hall (2002) we correct Gi for the number of citations received, as cGi = � CiCi�1
�Gi:
In addition to patent generality, we also include patent originality, which is the equivalent measure forthe concentration across technology �elds of the citations made by the patent.
17

(a marginal e¤ect of -0.001 and a standard error of 0.001).
Column 4 reports OLS results of estimating a within-�rm speci�cation using a linear
probability model. Comparing column 4 with column 1, we see that controlling for patent
characteristics, �rm �xed e¤ects explain a very large fraction of the variation. Speci�cally,
including �rm �xed e¤ects raises the R2 from 0.04 in column 1 to 0.47 in column 4. This
is consistent with the idea that patent decentralization re�ects underlying organization
structure, or at the very least, �rms di¤er systematically in the extent to which they
assign patents to a¢ liates. Columns 5 and 6 distinguish between pre and post-MA patents.
Column 5 excludes patents by acquired a¢ liates that were granted before the acquisition
year (thus, focusing only on internally developed patents), and column 6 excludes patents
by acquired a¢ liates that were granted after the acquisition year (thus, focusing only on
acquired patents). The same pattern of results holds for the two subsamples.
Insert Table 3 here
4.2 Implications of decentralization for innovation
We focus on three types of innovative activities: total R&D, patents per R&D, and pub-
lications of scienti�c articles.
4.2.1 R&D equation
As discussed in section 2.2, the theories we consider in this paper do not have clear
implications for how R&D and patenting are related to decentralization. Cognizant of
this limitation, we proceed to estimate the relationship between decentralization and R&D
expenditures and the �rm propensity to patent. The R&D equation is speci�ed as:
lnR&Dit = 1 lnSalesit�1 + 2 ln(1 +GPatit�1) + 3ShareDecit�1 + �t + �j + �it (3)
The relationship between decentralization and R&D is captured by 3. According to
incentives theories, delegation of authority encourages innovation e¤orts, hence we expect
we expect b 3 > 0. The information based theories, on the other hand, emphasize the
importance of knowledge location and the costs that are associated with its transmission
within the organization. While the bene�ts of decentralization lie in reducing the need for
18

costly communication, the downside of decentralization is reduced coordination and lower
knowledge spillovers across di¤erent parts of the �rm. Insofar as the payo¤s from R&D
increase with knowledge spillovers, decentralization would be associated with lower R&D
investment. This means b 3 < 0. On the other hand, reduced coordination can also resultin duplicative R&D, implying b 3 > 0.Table 4 reports the estimation results. The general pattern suggests a negative relation-
ship between decentralization and R&D investment. As shows in column 1, the coe¢ cient
estimate on share decentralized is negative and is highly signi�cant -0.157 (a standard
error of 0.061). The R&D-decentralization relationship is particularly strong for �rms
with many patents (column 3). Results are robust for pre and post-acquisition patents
(columns 4-5), however, not for within-�rm estimation (column 6). Columns 7-9 report a
very similar pattern for speci�cations where the dependent variable is ln(R&D=Sales).
Based on the estimation results of column 1, a one standard deviation increase in the
share of decentralized patents lowers R&D investment by $7.6 million (�0:157�0:44�110),or by 7% of the sample average.
Insert Table 4 here
4.2.2 Patent and publication equations
We next investigate the patent equation - namely, the output of the R&D equation. The
patent �ow equation (at the �rm-year level) is speci�ed as5:
ln(1 + Pats)it = �1 lnSalesit�1 + �2 lnGRDit�1 + �3ShareDecit�1 + �t + �j + �it (4)
The relationship between patent propensity and decentralization is captured by �3:
We estimate an equivalent speci�cation for the �ow of scienti�c publications. If decen-
tralized �rms are less likely to engage in basic R&D, we expect a negative b�3 < 0:Columns 1-5 in Table 5 report the estimation results for patents. Column 1 shows a
negative and signi�cant relationship between decentralization and patent propensity. The
coe¢ cient on share decentralized is -0.0195 (a standard error of 0.058). This pattern is
robust to pre and post acquisition patents, outliers, and weighting patents by citations.
5All results are robust to alternative speci�cations, such as Negative Binomial for patents count.
19

Based on the estimate from column 1, a one standard deviation increase in share decen-
tralized is associated with 2.4 fewer patents per year, or 9% of the sample mean, given
R&D (�0:195� 0:44� 28).Columns 6-9 report the equivalent speci�cations for the yearly �ow of academic pub-
lications. The general pattern of results suggests a strong negative relationship between
decentralization and scienti�c publications. As shown in column, the coe¢ cient on share
decentralized is -0.171 (a standard error of 0.049). This e estimate drops substantially,
however it remains highly signi�cant, when controlling for patents stock (a coe¢ cient of
0.118 and a standard error of 0.047).
Insert Table 5 here
4.3 Implications of decentralization for market value and growth
4.3.1 Market value
Given the novelty of our measure of decentralization, we begin by establishing that it is
prima facie interesting. To this end, we estimate a simple version of the value function
approach proposed by Griliches (1981)6. The market value of �rm i at period t, Vit; takes
the following form:
lnV alueit = �1 lnAssetsit�1 + �2 lnGRDit�1 + �3 ln(1 +GPatit�1)
+ �4ShareDecit�1 + �t + �j + �it (5)
V alue denotes �rm market value, Assets, GRD and GPat denote physical, R&D, and
citations-weighted patent stocks, respectively. ShareDec is our main variable of interest,
and is constructed as the share of the �rm patents stock that is assigned to a¢ liates. �t
and �j and are complete sets of year and three-digit industry dummies, and �it is an iid
error term. The reported standard errors are always robust to arbitrary heteroskedastic-
ity and allow for serial correlation within �rms. �4 captures the decentralization-value
relationship.
Table 5 reports the estimation results for the market value equation. Column 1 in-
cludes separately the stocks of centralized and decentralized patents. The coe¢ cient on6See also Ja¤e (1986), Hall et al (2005) or Lanjouw and Schankerman (2004).
20

centralized patents stock is not signi�cantly di¤erent than zero (a coe¢ cient of 0.018 and
a standard error of 0.014), where the coe¢ cient on decentralized patents stock is large
and is highly signi�cant (a coe¢ cient of 0.091 and a standard error of 0.015). Column 2
controls for ownership structure by adding the total number of a¢ liates controlled by the
�rm, and for scale using �rm sales. The e¤ect of decentralized patents remains robust,
however drops in magnitude (a coe¢ cient of 0.071 and a standard error of 0.014). The
coe¢ cient on number of a¢ liates is positive and signi�cant (0.043 and a standard error of
0.017).
In column 3, instead of separately including the stocks of centralized and decentralized
patents, we include the overall stock of patents, and the share of patents that are decen-
tralized. The coe¢ cient on the share of decentralized patents is positive and signi�cant
(a coe¢ cient of 0.217 and a standard error of 0.052). The coe¢ cient on overall patents
stock is positive and signi�cant as well (0.057 and a standard error of 0.016). Column 4
adds number of a¢ liates and sales. The coe¢ cient on the share of decentralized patents
drops, but remains large and highly signi�cant (0.159 and a standard error of 0.048).7
Column 6 controls for the �rm stock of scienti�c publications. Our �ndings indi-
cate that publishing �rms have, on average, a lower market value than comparable non-
publishing �rms. The coe¢ cient on publications stock is -0.054 (a standard error of 0.018).
The e¤ect of share decentralized remains robust (a coe¢ cient 0.157 and a standard error
of 0.044).
Columns 6-9 examine the robustness of the results. Column 3 includes a dummy for
decentralization. This dummy receives the value of one for �rms for which at least 50%
of their patents are assigned to a¢ liates, and zero for all other �rms. Consistent with
our previous �ndings, the coe¢ cient on this dummy is positive and highly signi�cant
(0.157 and a standard error of 0.044). Columns 7-9 check the robustness of the results
7In unreported speci�cations, we include a set of three separate indicator variables that capture thenon-linear e¤ect of decentralization. For each �rm we assign a value of 1 to only one of these dummyvariables based on which pattern best describes the �rm�s patents: all patents are centrally assigned(share decentralized is zero); share decentralized is between zero and 0.2; share decentralized is between0.2 and 0.8; share decentralized is above 0.8. Using the zero-share decentralization subset as our basecategory, we �nd that the value-decentralization relationship is driven mostly by �rms where at least 20%of their patents are decentralized. The coe¢ cient on dummy for zero to 0.2 decentralization share is notstatistically signi�cant (a coe¢ cient of 0.110 and a standard error 0.068). The coe¢ cient on dummy fordecentralization share higher than 0.8 is 0.173 (a standard error of 0.063), while the coe¢ cient estimatefor 0.2-0.8 decentralization range is 0.256 (a standard error of 0.068).
21
for di¤erent subsamples. Columns 7 excludes very large patenting �rms8, and columns 8
and 9 distinguish between pre and post-acquisition patents. The results are robust for the
di¤erent samples.
Based on the estimated coe¢ cient reported in column 3, a one standard deviation
increase in share decentralized is associated with an increase in �rm value by $137 mil-
lion (0:217 � 0:44 � 1431), or 9.6% of the average �rm value. Note well that no causal
inference is asserted here. We are not claiming here that a centralized �rm would do well
to decentralize, nor of course the converse. Instead, we are content to observe for now
that our measure of decentralization is systematically related to market value of the �rm,
controlling for size, tangible assets,R&D stock, and industry, and that this relationship
survives a variety of robustness checks described above. Simply put, there is a prima facie
case for further exploring the determinants and correlates of decentralization.
In addition to estimating the linear market value speci�cation, we experiment with
estimating linear and non-linear Tobin�s Q speci�cations. For brevity, we do not discuss
these estimations in detail. The same pattern of results hold for linear and non-linear
Tobin�s Q speci�cations9. For example, in the linear speci�cation the coe¢ cient on the
share of decentralized patents is 0.224 (a standard error of 0.049). A nonlinear estimation
yields a higher estimate (a coe¢ cient of 0.308 and a standard error of 0.050).
Insert Table 6 here
4.3.2 Sales growth
We proceed to explore the impact of decentralization of R&D on �rm sales growth. We
estimate the following sales growth equation:
� lnSalesit = �1 lnSalesit�1 + �2 lnAssetst�1 + �3 lnGRDit�1 + �4 ln(1 +GPatit�1)(6)
+ �5ShareDecit�1 + �t + �j + �it
8These companies are IBM, General Electric, Motorola, Hewlett-Packard, and Eastman Kodak.9In columns 1-7 we approximate ln(1 + �2(GRD=Assets)it�1 + �3(GPat=Assetsit�1)) to
(�2(GRD=Assetsit�1) + �3(GPat=Assetsit�1)): In columns 8-10 we do not make such approximationand estimate the non-linear term using Non-Linear Least Squares.
22

Where � lnSalesit is lnSalesit � lnSalesit�1. �5 captures the relationship betweendecentralization and sales.
Table 7 reports the estimation results. Column 1 examines the decentralization-growth
relationship. Consistent with our �ndings for market value, the coe¢ cient on share decen-
tralized is positive and is highly signi�cant (0.037 and a standard error of 0.010). Column 3
includes publications stock. The coe¢ cient on publications stock is e¤ectively zero (0.001
and a standard error of 0.003). Column 3 excludes very large patentors with no change in
the results. Columns 4 and 5 distinguish between post and pre-acquisition patents. The
same pattern of results holds for both subsamples, however, the e¤ect of decentralization
appears to be higher in the latter subsample (a coe¢ cient of 0.040 and a standard error
of 0.010, versus a coe¢ cient of 0.021 and a standard error of 0.011, for pre and post-
acquisition patents, respectively). As shown in columns 6-8, the results are not sensitive
to including �rms with many or few patents, or when considering a two-year sales growth.
These �ndings are consistent with our Hypothesis 1, insofar as it predicts decentralized
R&D will be less scienti�c, given that it would thus be more likely to be commercializable.
Insert Table 7 here
4.3.3 Diversity
Our Hypothesis 1 predicts a positive relationship between decentralization and broader
scope of research jointly condition market value of the �rm. According to information
processing, the bene�ts from decentralization are more prominent as patenting diversity
increases. This is because the bene�ts from specialization increases with complexity . and
because the communication of information becomes more costly in more diverse organiza-
tions. Moreover, the cost of decentralization is lower when divisions focus on very di¤erent
tasks as the scope for spillovers and rent cannibalization is reduced. On the other hand,
under the incentives view, the decentralization-value relationship should not systemati-
cally vary with diversity, since incentives can be very important also in highly specialized
organizations. We Follow Palepu (1985) and construct �rm technological diversity as the
Entropy measures, which include Total Diversi�cation (TD), Related Diversi�cation (RD),
and Unrelated Diversi�cation (UD). These measures are constructed as follows. Suppose a
�rm operates in N segments which belong toM main technology areas. We use three-digit
23
and two-digit U.S. class to de�ne segments and technology areas, respectively. We denote
by P ji the share of the ith segment patents of total �rm patents in technology area j.
Related diversi�cation measures the extent the �rm operates in several business segments
within an industry, and is de�ned as:
RDj =Xi2jP ji ln
�1
P ji
�If a �rm operates in several technology areas, its aggregated related diversi�cation is
the weighted sum of RDj; where the weight, Pj; is the share of technology area j patents
of the �rm�s total patents.
RD =Xj2M
RDjPj (7)
Unrelated diversi�cation measures the �rm patents spread across di¤erent (two-digit)
technology areas, and is de�ned as:
UD =Xj2M
Pj ln
�1
P j
�(8)
Total Diversi�cation (TD) is a weighted average of the �rm�s diversi�cation within and
between sectors and is computed as the sum of RD and UD.
We estimate the following speci�cation:
lnV alueit = �1ShareDecit�1+�2ShareDecit�1�Diversityi+Z 0it�1�5+ �t+ �j + �it (9)
Diversityi is one of the above diversi�cation measures, and Z is a vectors of additional
�rm-level controls. Our main interest is the coe¢ cients �2 and �3: Consistent with in-
formation processing, we expect b�2 > 0. That is, the marginal value of decentralizationintensi�es as the corporation becomes more diverse. On the other hand, consistent with
the incentives theory, there is no clear reason to suspect the marginal value of decentral-
ization to rise with diversity (b�2 = 0).The estimation results are reported in table 8. Columns 1 and two estimates the base-
line market value equation separately for specialized and diversi�ed �rms. We classify �rms
as specialized if their value of Unrelated Diversi�cation falls in the lowest sample quartile,
24

and as diversi�ed if their respective diversi�cation value falls at the highest diversi�cation
quartile. The coe¢ cient on share decentralized is large and signi�cant for the diversi�ed
sub-sample (0.359 and a standard error of 0.086), and is small and insigni�cant for the
specialized �rms sub-sample (0.047 and a standard error of 0.112). Column 3 adds to the
baseline speci�cation the interaction between Total Diversi�cation and share decentral-
ized. Consistent with the information processing view, the coe¢ cient on this interaction
(b�2) is positive and signi�cant (0.011 and a standard error of 0.004). The coe¢ cient onshare decentralized remains positive and signi�cant (0.117 with a standard error of 0.057).
Next we decompose diversi�cation to within and between technology areas. Column 4
includes the interaction between share decentralized and Unrelated Diversi�cation. The
relationship is very strong. The interaction coe¢ cient is 0.140 (a standard error of 0.096),
where the level e¤ect of share decentralized is no longer signi�cant (a coe¢ cient of -0.096
and a standard error of 0.108). Columns 5 includes the interaction between Related Diver-
si�cation and share decentralized, which yields much smaller estimates of how the e¤ect
of decentralization of market value varies with �rm diversity (a coe¢ cient of 0.011 and a
standard error of 0.005).10
Based on the estimates of column 4, evaluated at the sample average, a one standard
deviation increase in share decentralized is associated with a $95 million increase in market
value (0:44� (�0:096 + 1:76� 0:140)� 1431): This �gure is substantially lower than the$137 million �gure than is based on the estimates from table 5 where we did not control
for diversi�cation. A one standard deviation increase in diversity almost doubles the e¤ect
of decentralization to $182 million (0:44� (�0:096 + (1:76 + 1)� 0:140)� 1431):Columns 6 includes an alternative measure of diversity - Her�ndahl-Hirschman Index
(HHI) of patent concentration across three-digit U.S. technology class. The same pattern
of results continue to hold.10An important concern is that the interaction between decentralization and diversity is driven by
patenting scale. By construction, �rms with fewer patents are likely to be less diverse than �rms withmany patents. If decentralization is more important for market value for �rms with few patents than�rms with many, b�2 would be upward biased. To mitigate this concern we check the robustness of theestimates reported in column 4 to adding an interaction between ShareDec and ln(1 + GPatit�1): Thecoe¢ cient on the interaction term between ShareDec and Unrelated Diversi�cation falls to 0.093 (from0.140), but it remains signi�cant (a standard error of 0.044). To further check the variation in our datadoes not stem solely from comparing �rms with few patents to �rms with many patents, we restrict thesample to include �rms with above median patents stock. The coe¢ cient on the interaction term betweenShareDec and Unrelated Diversi�cation is 0.126 (a standard error of 0.041).
25

Lastly, column 7 investigates the extent to which the marginal value of decentralization
varies with geographical diversity. Similar to the above theoretical arguments, if communi-
cation costs increase when the corporation�s R&D labs are more geographically dispersed,
we would expect the marginal value of decentralization to rise with geographical diversity.
We measure geographical diversity in the following way. For each corporation, we generate
a list of all inventors and their location as indicated on the patent document. We then
construct the Her�ndahl-Hirschman Index (HHI) of patent concentration across Ameri-
can cities (excluding foreign inventors). The results are once again consistent with the
information processing story: the coe¢ cient on the interaction term between geographical
diversity and decentralization is negative and is highly signi�cant (-0.598 and a standard
error of 0.191).
Insert Table 8 here
4.4 Reassignment
We determine whether a patent is assigned to an a¢ liates or headquarters by examining
the assignee name that appears on the patent document when it was granted. However,
assignees can change over the patent life-cycle. Reasons for reassigning a patent include a
merger or an acquisition, or a managerial decision within-�rms of how to allocate IP assets
across the organization units. Using data on reassignments, as coded by the USPTO, we
test the robustness of our key results. 41,244 patents in our sample are reassigned. Close
to 90% of these reassignments are assigning a patent from headquarters to an a¢ liate
(36,180 patents). There is no big di¤erence in the share of reassigned patents between
M&A and internal patents. For M&A patents, 8% are reassigned (8,410 patents), where
for internal patents, 7% are reassigned (32,834 patents). For M&A-related reassignments,
23% are reassignments from a¢ liates to headquarters, where for internal patents, about
91% of reassignments are from headquarters to a¢ liates.11
11In terms of citations, reassigned patents receive substantially fewer citations than patents that arenever reassigned. The average reassigned patent receives 4.3 citations, where the average non-reassignmentpatent receives 9.9 citations. This pattern robust for period e¤ects. For example, for patents granted post2000, reassigned patents receive, on average 4 citations, relative to 9.5 citations for patents with noreassignment that are granted in the same period. The pattern holds for patents granted before 2000, andfor alternative time cohorts.
26

We repeat our estimations by accounting for changes in reassignments. For brevity we
do not report the full set of results. Our �ndings are robust to reassignment. For example,
for market value, the coe¢ cient on share decentralized is 0.181 (a standard error of 0.048),
as compared to a coe¢ cient estimate of 0.159 in the equivalent speci�cation that does not
accounts for reassignments (Table 4, column 4).
5 Conclusions
This paper develops a new way, using patent data of measuring the organization of R&D
in a �rm, in order to explore the impact of �rm organization on performance variety of
outcomes, including the extent and nature of research activity, as well as sales growth and
market value.
We use data 1,290 American publicly-listed corporations, with 2,615 Patent-receiving
a¢ liates, as well as characteristics of 594,903 patents that belong to these corporations.
Our key measure is whether a patent is assigned to the parent corporation or to an a¢ li-
ate. The assignment of intellectual property to a wholly owned a¢ liate cannot have legal
signi�cance. However, it likely re�ects a de facto delegation of authority to the a¢ liate in
how the R&D is managed, a suggestion which is supported by our interviews with man-
agers. . Indeed, consistent with the notion that patent assignments to a¢ liates re�ects an
underlying decentralization of R&D to the a¢ liate, we �nd that decentralized patents are
less likely to cite scienti�c papers, less general in scope, and receive fewer citations. Firms
that extensively decentralize patents are also less likely to produce scienti�c publications,
and more likely to rely upon mergers and acquisitions to acquire patents.
We next turn to the relationship between decentralization and outcomes. We �nd that
�rms that decentralize R&D invest less in R&D, and given their R&D investment, produce
fewer patents. The may re�ect the e¢ cacy of decentralized R&D, or the more incremental
nature of decentralized R&D, or merely di¤erence in incentives to patent. We also �nd
that decentralization of R&D is associated with greater sales growth, and higher market
value, suggesting that whereas centralized research may be technically and scienti�cally
superior, the private economic bene�ts are less clear cut.
Given that the nature of research and the choice of organizational forms are jointly
determined, and related to unobserved factors such as technological opportunities, one
27

cannot infer causal impacts of organizational form on performance. Neither can we con-
clusively discriminate between di¤erent theoretical perspectives. Our results support the
view that decentralization economizes on communication between a¢ liates and �rms, at
the possible cost of reduced coordination. Over and above these �ndings, this project
contributes by revealing a new way of using patent data to proxy for di¤erences in orga-
nizational structure.
28

References
[1] Acemoglu, D., P. Aghion, C. Lelarge, J. Van Reenen, and F. Zilibotti. 2007. �Tech-
nology, Information and the Decentralization of the Firm.�Quarterly Journal of Eco-
nomics 122, 1759-1800.
[2] Aghion, P. and J. Tirole. 1997. �Formal and real authority in organizations.�Journal
of Political Economy 105, 1-29.
[3] Alonso, R., W. Dessein, and N. Matouschek. 2008. �When Does Coordination Require
Centralization?.�The American Economic Review 98, 145�179.
[4] Alonso, R., W. Dessein, and N. Matouschek. 2008. �Centralization versus Decentral-
ization: An Application to Price Setting by a Multi-market Firm.� Journal of the
European Economic Association 6, 457-467.
[5] Arrow, K. 1962. �Economic Welfare and the Allocation of Resources of Inventions.�
In The Rate and Direction of Inventive Activity, Princeton, NJ: Princeton University
Press.
[6] Baker, G. and T. Hubbard. 2003. �Make Versus Buy in Trucking:Asset Ownership,
Job Design, and Information.�American Economic Review 93, 551-572.
[7] Baker, G. and T. Hubbard. 2004. �Contractibility And Asset Ownership: On-Board
Computers and Governance In U. S. Trucking.�Quarterly Journal of Economics 119,
1443-1479.
[8] Baker, G., R. Gibbons, and K. Murphy. 2002. �Relational Contracts and the Theory
of the Firm.�Quarterly Journal of Economics 117, 39-84.
[9] Belenzon, S., T. Berkovitz, and P. Bolton. 2010. �Intracompany Governance and
Innovation.�Working Paper.
[10] Belenzon, S. and A. Patacconi. 2010. �Firm Size and Innovation: Evidence from
European Panel Data.�Working Paper.
[11] Bloom, N., R. Sadun, and J. Van Reenen. 2008. �Measuring and explaining decen-
tralization across �rms and countries.�Working Paper.
29

[12] Bolton, P. and M. Dewatripont. 1994. �The Firm as a Communication Network.�The
Quarterly Journal of Economics 109, 809�839.
[13] Bresnahan, T., E. Brynjolfsson, and L. Hitt. 2002. �Information Technology, Work-
place Organization, and the Demand for Skilled Labor: Firm-Level Evidence.�Quar-
terly Journal of Economics 117, 339-376.
[14] Caroli, E. and J. Van Reenen. 2001. �Skill-Biased Organizational Change? Evidence
from a Panel of British and French Establishments.�Quarterly Journal of Economics
116, 1449-1492.
[15] Chandler, A. 1977. The Visible Hand: the Managerial Revolution in American Busi-
ness, Harvard University Press, 1977.
[16] Colombo, M. and M. Delmastro. 2004. �Delegation of Authority In Business Organi-
zations: An Empirical Test.�Journal of Industrial Economics 52, 2004, 53-80.
[17] Dessein, W. 2002. �Authority and communication in organizations.�Review of Eco-
nomic Studies 69, 811-838.
[18] Estrin, S., D. Jones, and J. Svejnar. 1987. �The Productivity E¤ects of Worker Par-
ticipation: Producer Cooperatives in Western Economies.� Journal of Comparative
Economics 11, 40-61.
[19] Griliches, Z. 1990. �Patent Statistics as Economic Indicators: A Survey.�Journal of
Economic Literature 28, 1661-1707.
[20] Gupta A. and V. Govindarajan. 2000. �Knowledge �ows within multinational corpo-
rations.�Strategic Management Journal 496, 473-496.
[21] Hall, B., A. Ja¤e, and M. Trajtenberg. 2005. �Market Value and Patent Citations.�
The RAND Journal of Economics 36, 16-38.
[22] Hall, B. and R. Ziedonis. 2001. �The Determinants of Patenting in the U.S. Semicon-
ductor Industry, 1980-1994.�Rand Journal of Economics 32, 101-128.
[23] Hart, O. and J. Moore. 1990. �Property Rights and the Nature of the Firm.�Journal
of Political Economy 98, 1119- 1158.
30

[24] Ja¤e, A. 1986. �Technological Opportunity and Spillovers of R & D: Evidence from
Firms�Patents, Pro�ts, and Market Value.� The American Economic Review 76,
984-1001.
[25] Kanter. R. 1985. �Supporting innovation and venture development in established
companies.�Journal of Business Venturing 1, 47�60.
[26] Kastl, J. D. Martimort, and S. Piccolo. 2009. �Delegation and R&D Spending: Evi-
dence from Italy.�Working Paper.
[27] Matouschek, N. and P. Ramezzana. 2007. �The Role of Exclusive Contracts in Facil-
itating Market Transactions.�The Journal of Industrial Economics 55, 347-371.
[28] Mookherjee, D. and M. Tsumagari. 2004. �The organization of supplier networks:
e¤ects of delegation and intermediation.�Econometrica 72, 1179-1219.
[29] Patacconi, A. 2009. �Coordination and delay in hierarchies.�The RAND Journal of
Economics 40, 190-208.
[30] Radner, R. 1993. �The organization of decentralized information processing.�Econo-
metrica 61, 1109-1146.
[31] Radner, R. and J. Marschack. 1972. Economic Theory of Teams, New Haven: Yale
University Press.
[32] Riordan, M. 2008. �Competitive e¤ects of vertical integration.�Handbook of Antitrust
Economics, 145�82.
[33] Rotemberg, J. and G. Saloner. 1994. �Bene�ts of Narrow Business Strategies.�The
American Economic Review 84, 1330-1349.
[34] Szulanski, G. 2009. �Exploring Internal Stickiness: Impediments to the Transfer of
Best Practice Within the Firm.�Strategic Management Journal 17, pp. 27-43.
[35] Teece, D. 1996. �Firm organization, industrial structure, and technological innova-
tion.�Journal of Economic Behavior & Organization 31, 193-224.
31

A AppendixThis section details the construction of the data platform used in this project. The centraldatasets consist of a patent-level panel and a �rm-level panel, which are linked via theunique patent id numbers. Each of these panels is built up iteratively, by incorporatingdata from the following sources: (i) patent level information from the United States Patentand Trademark O¢ ce (USPTO), (ii) ownership structure data from Icarus and Amadeusby Bureau Van Dyke (BVD), (iii) Merger and acquisition data from Thomson ReutersSDC Platinum and Zephyr by Bureau Van Dyke, (iv) accounting information from U.S.Compustat, and (v) extensive manual searches of on-line resources, such as corporate andgovernments websites, and search engines.
A.1 Ownership StructureAssignee information is available from the USPTO, but many of the patent assignmentsare made to a¢ liate �rms. Furthermore, �rms vary in their choice to utilize a¢ liates fortheir assignments, resulting in noisy (at best) or biased (likely) patent and citation countsat the �rm level. As Hall, et al. (2001) put it:�There is a further reason for this to be a lower bound: the assignee code is not
�consolidated�, that is, the same �rm may appear in di¤erent patent documents undervarious, slightly di¤erent names, one assignee may be a subsidiary of the other, etc. Thus,if for example we were to compute the percentage of self-citations using the CompustatCUSIPs (after the match) rather than the assignee codes, we would surely �nd higher�gures.�Thus, our goal is to trace the chain of ownership for every relevant patent precisely
back to the Compustat CUSIP identi�cation number. Below, we detail the steps taken.
A.1.1 Control chain generator.
The linchpin of this project is the identi�cation of an ultimate owner (�UO�) for a largeportion of the companies reported as patent assignees by the USPTO. Here we follow themethodology employed by Belenzon and Berkowitz (2010). We obtain ownership structuredata from the Icarus and Amadeus databases by Bureau Van Dyke (BVD). The Amadeusownership database includes detailed information of the percentage of ownership betweenshareholders and their subsidiaries. We develop an ownership algorithm that constructsthe internal structure parent and a¢ liate groupings based on their inter-company owner-ship links.The algorithm follows three steps: (i) completes missing ownership links, (ii) generates
lists of all subsidiaries and parents for each company, and (iii) constructs the ownershipchains bottom-up. To illustrate our methodology, it would be useful to consider thefollowing example. Suppose Figure A.1 correctly describes the ownership structure of aconglomerate. The ultimate owner �rm at the apex of the group controls 7 public andprivate �rms. Amadeus provides detailed data on direct ownership links. Thus, our rawdata include the links A! D, B ! F , C ! G, and D ! E. Note that the percentage ofownership for the link C ! G has to be larger than 20 (because �rmG is public), where forthe percentage of ownership for all other links has to be larger than 50 (because the other
32
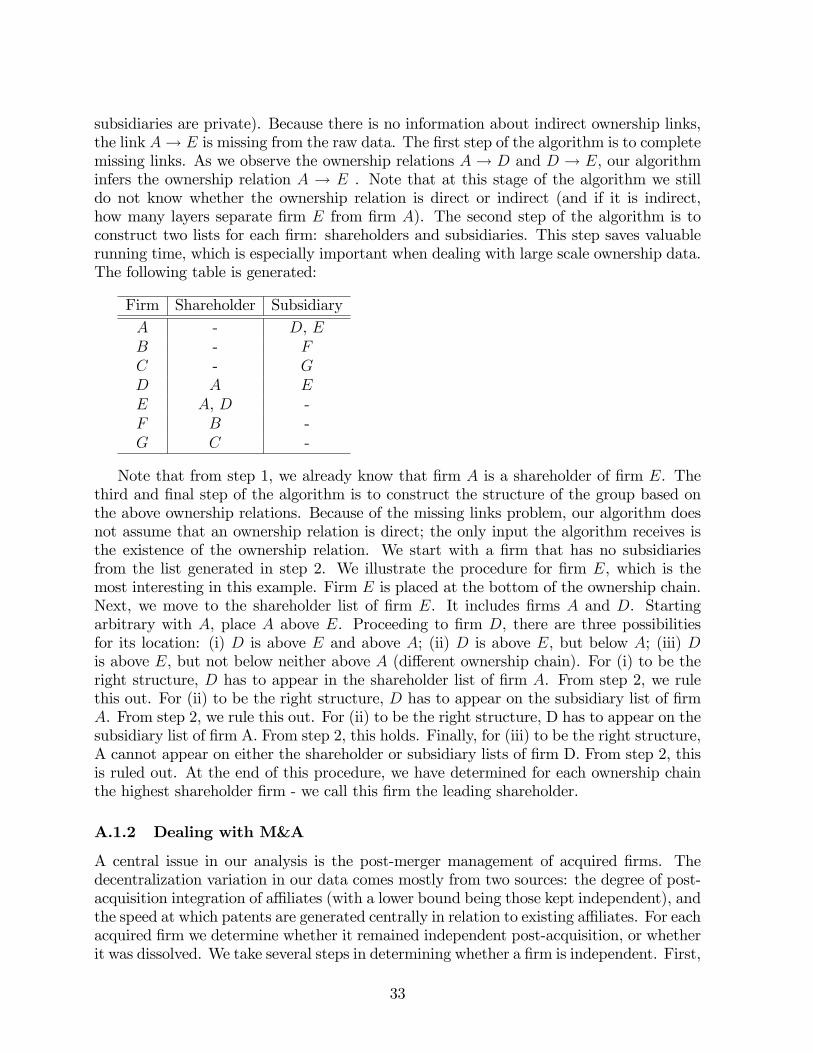
subsidiaries are private). Because there is no information about indirect ownership links,the link A! E is missing from the raw data. The �rst step of the algorithm is to completemissing links. As we observe the ownership relations A ! D and D ! E, our algorithminfers the ownership relation A ! E . Note that at this stage of the algorithm we stilldo not know whether the ownership relation is direct or indirect (and if it is indirect,how many layers separate �rm E from �rm A). The second step of the algorithm is toconstruct two lists for each �rm: shareholders and subsidiaries. This step saves valuablerunning time, which is especially important when dealing with large scale ownership data.The following table is generated:
Firm Shareholder SubsidiaryA - D, EB - FC - GD A EE A, D -F B -G C -
Note that from step 1, we already know that �rm A is a shareholder of �rm E. Thethird and �nal step of the algorithm is to construct the structure of the group based onthe above ownership relations. Because of the missing links problem, our algorithm doesnot assume that an ownership relation is direct; the only input the algorithm receives isthe existence of the ownership relation. We start with a �rm that has no subsidiariesfrom the list generated in step 2. We illustrate the procedure for �rm E, which is themost interesting in this example. Firm E is placed at the bottom of the ownership chain.Next, we move to the shareholder list of �rm E. It includes �rms A and D. Startingarbitrary with A, place A above E. Proceeding to �rm D, there are three possibilitiesfor its location: (i) D is above E and above A; (ii) D is above E, but below A; (iii) Dis above E, but not below neither above A (di¤erent ownership chain). For (i) to be theright structure, D has to appear in the shareholder list of �rm A. From step 2, we rulethis out. For (ii) to be the right structure, D has to appear on the subsidiary list of �rmA. From step 2, we rule this out. For (ii) to be the right structure, D has to appear on thesubsidiary list of �rm A. From step 2, this holds. Finally, for (iii) to be the right structure,A cannot appear on either the shareholder or subsidiary lists of �rm D. From step 2, thisis ruled out. At the end of this procedure, we have determined for each ownership chainthe highest shareholder �rm - we call this �rm the leading shareholder.
A.1.2 Dealing with M&A
A central issue in our analysis is the post-merger management of acquired �rms. Thedecentralization variation in our data comes mostly from two sources: the degree of post-acquisition integration of a¢ liates (with a lower bound being those kept independent), andthe speed at which patents are generated centrally in relation to existing a¢ liates. For eachacquired �rm we determine whether it remained independent post-acquisition, or whetherit was dissolved. We take several steps in determining whether a �rm is independent. First,
33

we check whether the �rm appears in Amadeus or Icarus as an independent company.Second, we manually check each company listed in the �rst step whether it continues tooperate independently from the parent company. We check their corporate websites tocon�rm that their legal disclaimers and investor relations information references a parentcompany.Dissolved acquisitions are much more problematic. Because we match patents to �rms
based on the 2008 ownership structure, we lose historical acquisitions that were fullyintegrated in the parent company and ceased to exist as separate legal entities. Thoughwe do capture post-acquisition patents as those are likely to be assigned to headquarters,we may nonetheless over measure decentralization (because all historical patents that wedo not match are centralized). To mitigate this problem we take two steps. We match all�rms in SDC Platinum where the acquiring �rm appears in our sample. We then add toour data all patents that belong to acquired �rms that no longer appear in the 2008 data.SDC platinum is likely to miss smaller acquisitions, so we also did an extensive searchof public sources (such as Lexis-Nexis,EDGAR and general web searches) to generate alist of all acquisitions for the top 500 patenting corporations in our sample. As this is aniterative process, the resolution of M&A issues was not completed until the �nal stagesof all our patent and �rm matching (i.e. this last step would have been taken after thecompletion of A.2.1 below). For acquisitions that do not appear in SDC we classify itspatents as follows: if the �rm is active in 2008 (thus, it is matched to one of the �rms inour �rm universe) then we classify it as an a¢ liate of the acquiring corporation. However,in case there is no match between this �rm and our �rm universe, we classify all of itspatents to the acquiring �rm headquarters.Overall, we matched 50,931 patents to SDC and Zephyr. An underlying assumption
of this matching is that an a¢ liate exists in 2008. If the a¢ liate was historically dissolvedit will not appear in our �rm universe, hence, its patents will not be included in oursample. In order to overcome this problem, we take two steps. First, for the largest 500patenting corporations in our sample we manually collect data, from public sources, ontheir historical acquisitions. This list allows us to identify those �rms that were acquiredand fully dissolved. Second, we generate a list of the top 1,000 American assignees (asindicated by the address of the assignee) that were not matched to our data. The remainingunmatched �rms have less than 40 patents over their lifetime, so it is reasonable to assumethat they are not patent-intensive �rms. For each unmatched �rm remaining in our sample,we manually investigate whether it was acquired by any of our sample parent corporations,or by any �rms that themselves were acquired by our parent corporations. These two stepslead us to identify 53,761 patents, which we proceed to classify as centrally assigned. Intotal, we identify 104,692 as being acquired through a merger or an acquisition. Of thesepatents, 55,702 (53%) are assigned to a¢ liates, and the remaining patents are assigned toheadquarters.For each acquired �rm we determine whether it remained operational post-acquisition.
We take several steps in determining whether a �rm is independent. First, we checkwhether the �rm appears in Amadeus or Icarus as an independent company. Second,we manually check each company listed in the �rst step whether it continues to operateindependently from the parent company. We check their corporate websites to con�rmthat their legal disclaimers and investor relations information references a parent company.
34

Dissolved acquisitions are much more problematic. Because we match patents to �rmsbased on the 2008 ownership structure, we lose historical acquisitions that were fullyintegrated in the parent company and ceased to exist as separate legal entities. Thoughwe do capture post-acquisition patents as those are likely to be assigned to headquarters,we may nonetheless over measure decentralization (because all historical patents that wedo not match are centralized). To mitigate this problem we performed an exhaustivemanual search to identify a signi�cant majority of these absorbed �rms and match themto their patents. Appendix A.1.3 for a description of this process.
A.2 Matching patent dataWe standardize a name cleaning algorithm that is run both on the UO dataset and the 2007NBER Patent and Citations Dataset in order to match observations by company name.We utilize the assignee codes contained in NBPATS only as quality checks, or for guidancein manual searches, however we concentrate on matches using the a¢ liate company namesand our ultimate owner company names from UO. The algorithm utilizes both automatedrules and manual inputs to reduce most �rm names to a one or two word string variable.Extensive testing was performed to yield the highest rates of matching, while minimizingmultiplicity errors (which occur when two distinct names are rendered equal by deletingdistinguishing words). Like previous work in name matching, we capitalize all letters, andremove extraneous characters and strings such as �&,��THE,��ASSOCIATES,�etc. Wecompile a list of 175 most common such �junk� words (i.e. non-essential for uniquelyidentifying companies). Our list is more targeted to American �rms (our focus) thanthose lists developed by the NBER Patent Data Project. Furthermore, one re�nementover previous such name matching projects is our use of a process whereby junk wordsare truncated in a right-to-left fashion. This increases the match yield signi�cantly, aswe are able to remove, for example, the word �INTERNATIONAL�from �PIONEER HI-BRED INTERNATIONAL, INC,�(because it occurs on the right side) while allowing it toremain in �INTERNATIONAL BUSINESS MACHINES CORPORATION.�To illustrate,the truncation would proceed as follows:1. Pioneer Hi-Bred International, Inc.2. PIONEER HI-BRED INTERNATIONAL, INC. (capitalize)3. PIONEER HI BRED INTERNATIONAL INC (remove punctuation)4. PIONEER HI BRED INTERNATIONAL (remove last word if �junk�)5. PIONEER HI BRED (remove last word if �junk.�Stop)Here, the algorithm stops when it reaches a �non-junk�word. For �INTERNATIONAL
BUSINESS MACHINES CORPORATION,� it would have stopped after truncating theword �CORPORATION.�We can further see the power of this �right-to-left�approach by looking at the way
that the sub string �HI�above is treated under a di¤erent set of conditions. Consider thename �VERIZON INC/HI�(it is common in Compustat to include state identi�ers):1. Verizon Inc./HI2. VERIZON INC./HI (capitalize)3. VERIZON INC HI (remove punctuation)4. VERIZON INC (remove last word if �junk.�)
35

5. VERIZON (remove last word if �junk.�Stop)Here, the sub string �HI�is properly removed, whereas removing it from Pioneer Hi-
Bred would have resulted in a corruption of the identi�er.One of the tradeo¤s in matching is always between high yield and multiplicity errors.
For example, one can see how too aggressive an algorithm can render �American Express,��American Airlines,�and �American Standard� into �AMERICAN.�Our choice was toerr on the side of higher multiplicity, but to rely on manual checks to correct any mis-coded companies. By always keeping track of the original, uncleaned names, we addedextra steps to check any duplicates (i.e. cases where the same cleaned name correspondedto more than one original name). At this stage, extensive manual e¤ort was expendedto resolve ambiguities by performing actual checks of patent images and web searches.Ultimately, we match over 846,000 patents to our UO �le.
A.2.1 Matching to Compustat
Having matched patents to �rms to ultimate owners, we proceed to match as many ulti-mate owners as possible to a CUSIP (in order to tap into Compustat accounting informa-tion). Because only publicly traded companies are listed by Compustat, this e¤ectivelyserves as a �lter to eliminate government and institutional entities that may have mis-takenly made it into our sample by this point. We utilize the standardized matchingalgorithm used in A.2.1, with some modi�cations to account for idiosyncratic Compustat�junk words.�
A.3 ReassignmentsOur measures of assignment structure depend on the assignee name that appears on thepatent document when it was granted, but patent assignment can change over time. To testthe robustness of our results to changes in assignment, we develop comprehensive data onpatent reassignment by using data collected from the USPTO website. Reassignment datais collected using a specialized automated �spider�web-crawler program. This data is thensearched for content, processed and merged to our �nal patent sample. We are interested intwo reassignment types: (i) assigning a patent that was originally assigned to headquartersto an a¢ liates, and (ii) reassigning to headquarters a patent that was originally assignedto an a¢ liate. To determine reassignment type we match old and new assignees to our�rm name sample. This matching is very challenging because many patents undergomultiple reassignments over their lifetime for reasons that are not germane to our study.For example, patents are very often reassigned to correct errors in the initial document,or for purposes of collateralization for lenders. This last case usually entails multipletransactions, such as when the collateral reverts to borrower, or when loans are assignedwithin �nancial institutions. Thus, we need to track the patent�s path (including suchdiversions) over time. Ultimately, 41,244 patents in our sample are reassigned. Close to90% of these reassignments are assigning a patent from headquarters to an a¢ liate (36,180patents). Finding that reassignments from a¢ liates to headquarters are rare supports ourview of assignments as being associated with a long-term e¤ective
36
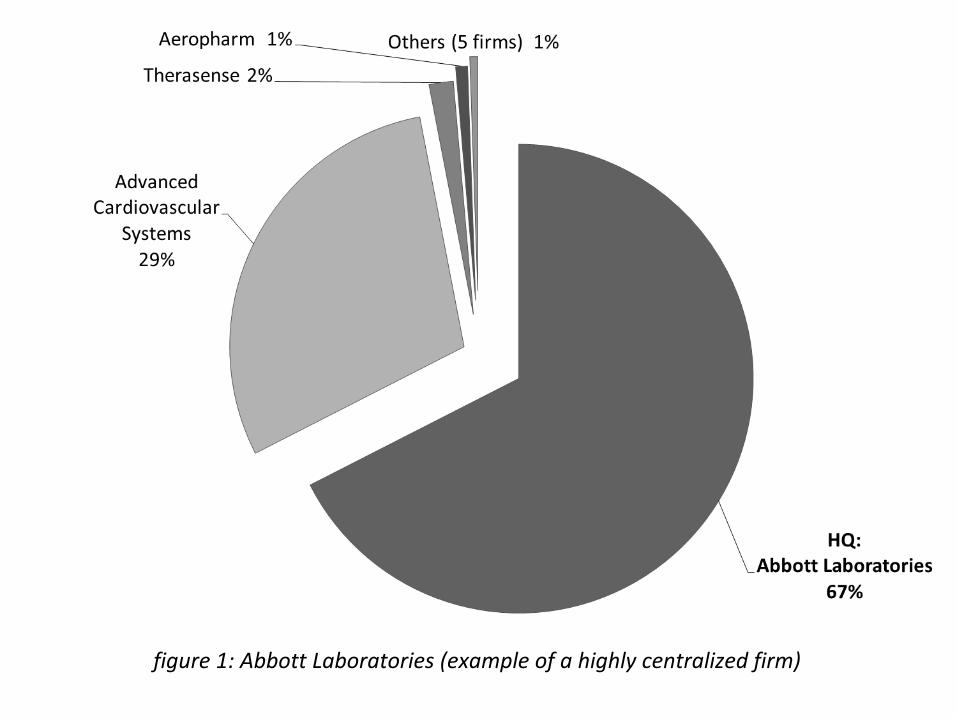
figure 1: Abbott Laboratories (example of a highly centralized firm)

figure 2: Johnson & Johnson (example of a highly decentralized firm)

Variable # Obs. Mean Std. Dev. 10th 50th 90th
Share Decentralized t-1 15,821 0.36 0.44 0 0.03 1
Market Value ($mm) 15,821 1,431 7,113 4 128 2,949
Tobin's Q 15,727 1.13 2.08 0.13 0.58 2.25
Sales Growth 15,748 0.104 0.363 -0.118 0.084 0.357
Sales t-1 ($mm) 14,330 3,633 12,034 34 598 8,256
Assets t-1 ($mm) 14,257 2,085 7,281 11 201 4,619
R&D Expenditures ($mm) 15,821 110 470 0 5.4 185
R&D Stock t-1 ($mm) 14,335 488 1,953 0 27 866
Patents Stock t-1 15,821 132 575 0.1 10 209
Publications Stock t-1 15,821 132 575 0.1 10 209
Patents flow 15,821 27 104 0 2 54
Publications flow 15,821 8.5 52 0 0 5
Dummy for Decentralized 594,903 0.18 0.39 0 0 1
Generality 403,800 0.57 0.32 0 0.66 1
Originality 433,449 0.27 0.28 0 0.22 0.67
Citations per Patent 594,903 8.9 15.9 0 4 22
Citations to Non-Patent Lit. 594,903 0.8 3.9 0 0 2
Citations to Non-Patent Lit. (>0) 106,617 4.3 8.3 1 2 9
Table 1. Summary Statistics for Main VariablesDistribution
Panel A: Firms (Firm-Year)
Panel B: Patents
Notes : This table provides summary statistics for key variables used in the econometric analysis. Market Value includes common stock, preferred stock and debt, net of current assets. Tobin’s Q is the ratio between Market Value and Assets . R&D Stock is computed using the perpetual inventory method with a depreciation rate of 15%. Patents Stock is citations-weighted and is computed using the perpetual inventory method with a depreciation rate of 15%. Share Decentralized divides a firm's total number of affiliate-assigned patents by its total number of patents. In constructing publications stock we match our sample firms to the complete ISI database for the period 1970-2007. Publications stock is computed using the perpetual inventory method. Generality is the HHI measure of concentration of the citations a patent receives across three-digit U.S. class. Originality is the HHI measure of concentration of the citations a patent makes across three-digit U.S. class. Citations to Non-Patent Lit. is the number of citations a patent makes to non-patent literature.

Share Decentralized Share M&A Tobin's Q Sales Patents Stock R&D Stock Patents Flow R&D Stock
Share Decentralized 1.00
Share M&A 0.41 1.00
Tobin's Q 0.10 0.07 1.00
Sales 0.05 0.14 -0.05 1.00
Patents Stock -0.14 0.09 -0.13 0.36 1.00
R&D Stock -0.14 0.07 -0.13 0.39 0.64 1.00
Patents Flow -0.11 0.08 -0.10 0.43 0.86 0.66 1.00
R&D Flow -0.04 0.12 -0.02 0.76 0.61 0.95 0.67 1.00
Notes: This table reports the correlation matrix between our key variables. Share Decentralized divides a firm's total number of affiliate-assigned patents by its total number ofpatents. Share M&A is the share of patents that are acquired through a merger or an acquisition. Tobin's Q is market value over assests.
Table 2. Correlations
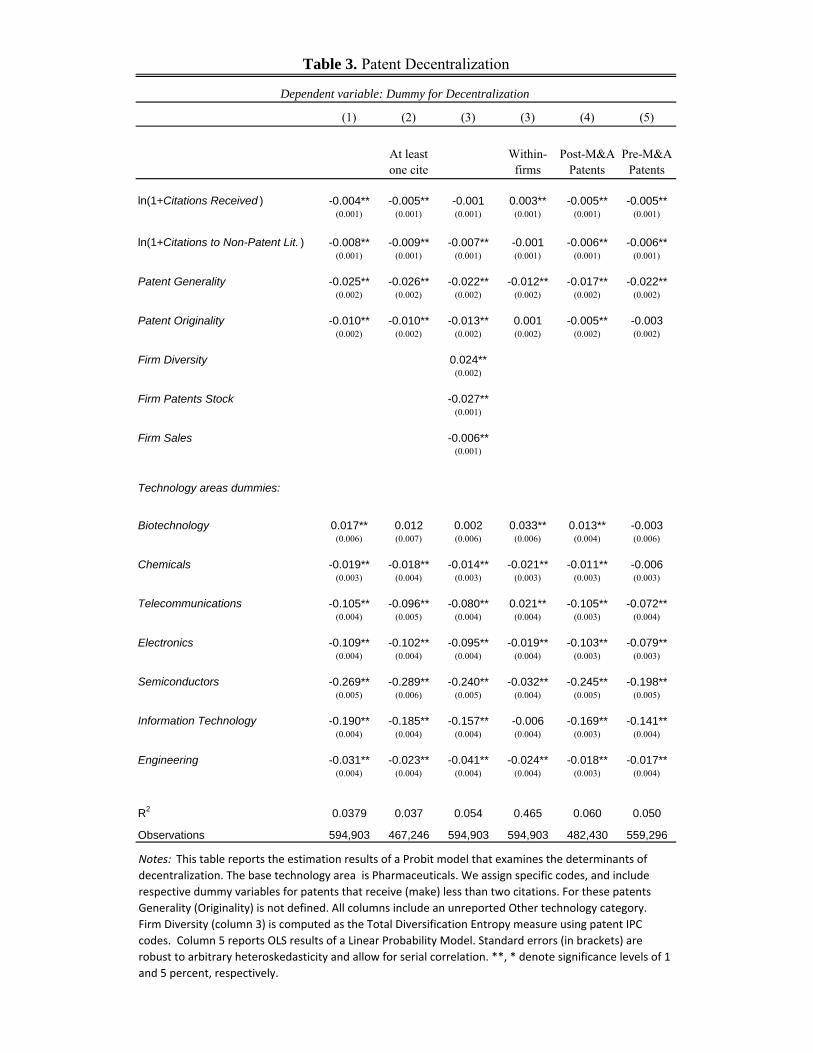
(1) (2) (3) (3) (4) (5)
At least one cite
Within-firms
Post-M&A Patents
Pre-M&A Patents
ln(1+Citations Received ) -0.004** -0.005** -0.001 0.003** -0.005** -0.005**(0.001) (0.001) (0.001) (0.001) (0.001) (0.001)
ln(1+Citations to Non-Patent Lit. ) -0.008** -0.009** -0.007** -0.001 -0.006** -0.006**(0.001) (0.001) (0.001) (0.001) (0.001) (0.001)
Patent Generality -0.025** -0.026** -0.022** -0.012** -0.017** -0.022**(0.002) (0.002) (0.002) (0.002) (0.002) (0.002)
Patent Originality -0.010** -0.010** -0.013** 0.001 -0.005** -0.003(0.002) (0.002) (0.002) (0.002) (0.002) (0.002)
Firm Diversity 0.024**(0.002)
Firm Patents Stock -0.027**(0.001)
Firm Sales -0.006**(0.001)
Technology areas dummies:
Biotechnology 0.017** 0.012 0.002 0.033** 0.013** -0.003(0.006) (0.007) (0.006) (0.006) (0.004) (0.006)
Chemicals -0.019** -0.018** -0.014** -0.021** -0.011** -0.006(0.003) (0.004) (0.003) (0.003) (0.003) (0.003)
Telecommunications -0.105** -0.096** -0.080** 0.021** -0.105** -0.072**(0.004) (0.005) (0.004) (0.004) (0.003) (0.004)
Electronics -0.109** -0.102** -0.095** -0.019** -0.103** -0.079**(0.004) (0.004) (0.004) (0.004) (0.003) (0.003)
Semiconductors -0.269** -0.289** -0.240** -0.032** -0.245** -0.198**(0.005) (0.006) (0.005) (0.004) (0.005) (0.005)
Information Technology -0.190** -0.185** -0.157** -0.006 -0.169** -0.141**(0.004) (0.004) (0.004) (0.004) (0.003) (0.004)
Engineering -0.031** -0.023** -0.041** -0.024** -0.018** -0.017**(0.004) (0.004) (0.004) (0.004) (0.003) (0.004)
R2 0.0379 0.037 0.054 0.465 0.060 0.050
Observations 594,903 467,246 594,903 594,903 482,430 559,296
Table 3. Patent Decentralization
Dependent variable: Dummy for Decentralization
Notes: This table reports the estimation results of a Probit model that examines the determinants of
decentralization. The base technology area is Pharmaceuticals. We assign specific codes, and include
respective dummy variables for patents that receive (make) less than two citations. For these patents
Generality (Originality) is not defined. All columns include an unreported Other technology category.
Firm Diversity (column 3) is computed as the Total Diversification Entropy measure using patent IPC
codes. Column 5 reports OLS results of a Linear Probability Model. Standard errors (in brackets) are
robust to arbitrary heteroskedasticity and allow for serial correlation. **, * denote significance levels of 1
and 5 percent, respectively.
(1) (2) (3) (4) (5) (7) (8) (9)
Dependent variable:
Patents ≤ median
Patents > median
Post-M&A
PatentsPre-M&A
PatentsWithin-Firms
Post-M&A
Patents
Pre-M&A
Patents
Share Decentralized t-1 -0.157** -0.098 -0.180** -0.142* -0.174** 0.009 -0.181** -0.160** -0.205**(0.061) (0.102) (0.066) (0.070) (0.066) (0.055) (0.060) (0.068) (0.064)
ln(1 + No. Affiliates ) 0.015 0.088* -0.013 0.002 0.013 -0.009 -0.021 -0.009(0.021) (0.040) (0.023) (0.021) (0.021) (0.020) (0.021) (0.020)
ln(Patents stock )t-1 0.245** 0.184** 0.245** 0.240** 0.242** 0.047** 0.222** 0.218** 0.218**(0.018) (0.050) (0.024) (0.019) (0.018) (0.016) (0.017) (0.019) (0.018)
ln(Sales )t-1 0.673** 0.634** 0.679** 0.691** 0.680** 0.602** -0.271** -0.257** -0.265**(0.024) (0.035) (0.029) (0.026) (0.026) (0.038) (0.023) (0.025) (0.024)
Firm Fixed-effects No No No No No No No No
Four-digit SIC dummies Yes Yes Yes Yes Yes Yes Yes Yes
Year dummies Yes Yes Yes Yes Yes Yes Yes Yes
R2 0.835 0.745 0.860 0.843 0.840 0.680 0.688 0.685
Observations 10,954 4,110 6,844 9,606 10,153 10,954 9,604 10,151
Yes
0.954
10,885
-
Yes
Table 4. Research and Development
ln(R&D /Sales )
(6)
ln(R&D )
Notes: This table reports the estimation results of the relation between R&D expenditure and decentralization. Standard errors (in brackets) are robust to arbitrary heteroskedasticity and allow for serial correlation through clustering by firms. **, * denote significance levels of 1 and 5 percent, respectively.

(1) (2) (3) (4) (5) (6) (7) (8) (9)
Dependent variable:
Post-M&A
Patents
Pre-M&A
PatentsExc.
OutliersCites
Weighed
Post-M&A
Patents
Pre-M&A
Patents
Share Decentralized t-1 -0.195** -0.236** -0.187** -0.182** -0.224** -0.172** -0.118** -0.069 -0.141**(0.058) (0.068) (0.064) (0.059) (0.056) (0.049) (0.047) (0.054) (0.052)
ln(1 + No. Affiliates ) 0.090** 0.075** 0.085** 0.090** 0.096** 0.029 0.010 0.013 0.007(0.025) (0.026) (0.027) (0.026) (0.024) (0.027) (0.026) (0.029) (0.029)
ln(R&D Stock )t-1 0.327** 0.325** 0.337** 0.272** 0.274** 0.167** 0.106** 0.107** 0.105**(0.024) (0.026) (0.026) (0.018) (0.022) (0.022) (0.020) (0.021) (0.022)
ln(Sales )t-1 0.181** 0.213** 0.195** 0.203** 0.157** 0.140** 0.105** 0.109** 0.113**(0.020) (0.023) (0.022) (0.020) (0.020) (0.019) (0.017) (0.019) (0.019)
ln(1+Patents stock )t-1 0.173** 0.189** 0.176**(0.021) (0.023) (0.022)
Four-digit SIC dummies Yes Yes Yes Yes Yes Yes Yes Yes Yes
Year dummies Yes Yes Yes Yes Yes Yes Yes Yes Yes
R2 0.627 0.652 0.643 0.607 0.587 0.468 0.499 0.522 0.509
Observations 15,764 13,578 14,387 15,203 15,764 15,764 15,764 13,578 14,387
ln(1+Patents)
Table 5. Patenting and Publishing
ln(1+Publications)
Notes: This table reports the estimation results of the relation between patenting and publishing activity, and decentralization. Standard errors (in brackets) are robust to arbitrary heteroskedasticity and allow for serial correlation through clustering by firms. **, * denote significance levels of 1 and 5 percent, respectively.

(1) (2) (3) (4) (5) (6) (7) (8) (9)
Exc. Outliers
Post-M&A
PatentsPre-M&A
Patents
ln(Dec. Patents stock )t-1 0.091** 0.071**(0.015) (0.014)
ln(Cen. Patents stock )t-1 0.018 0.015(0.014) (0.013)
Share Decentralized t-1 0.217** 0.159** 0.155** 0.158** 0.141** 0.178**(0.052) (0.048) (0.049) (0.049) (0.055) (0.052)
Dummy for Decentralized 0.157**(0.044)
ln(1 + No. Affiliates ) 0.043** 0.043** 0.040* 0.031 0.040* 0.043** 0.035*(0.017) (0.017) (0.017) (0.018) (0.017) (0.019) (0.018)
ln(1+Patents stock )t-1 0.057** 0.050** 0.058** 0.055** 0.060** 0.046** 0.053**(0.016) (0.014) (0.016) (0.016) (0.016) (0.016) (0.016)
ln(1+Publications stock )t-1 -0.054** -0.040* -0.050** -0.032* -0.039*(0.018) (0.018) (0.019) (0.018) (0.017)
ln(R&D stock )t-1 0.041* 0.026 0.039* 0.023 0.026 0.030 0.028 0.035* 0.033(0.018) (0.017) (0.018) (0.017) (0.018) (0.018) (0.018) (0.018) (0.018)
R&D stockt-1/Assetst-1
ln(Assets )t-1 0.827** 0.452** 0.825** 0.447** 0.420** 0.441** 0.420** 0.438** 0.451**(0.019) (0.031) (0.019) (0.031) (0.033) (0.032) (0.033) (0.032) (0.033)
ln(Sales )t-1 0.413** 0.415** 0.466** 0.432** 0.465** 0.434** 0.418**(0.032) (0.032) (0.037) (0.032) (0.037) (0.033) (0.035)
Four-digit SIC dummies Yes Yes Yes Yes Yes Yes Yes Yes Yes
Year dummies Yes Yes Yes Yes Yes Yes Yes Yes Yes
R2 0.814 0.827 0.814 0.826 0.832 0.830 0.830 0.828 0.830
Observations 15,821 15,764 15,821 15,764 14,298 14,448 15,203 13,578 14,387
Table 6. Decentralization and Market Value
Dependent variable: ln(Market Value)
Notes: This table reports OLS estimation results of the effect of patent decentralization on firm market value. The level of analysis is firm-year. Centralized and Decentralized patents refer to whether they were assigned to an affiliate or headquarters, respectively. Share Decentralized divides a firm's total number of affiliate-assigned patents by its total number of patents. Standard errors (in brackets) are robust to arbitrary heteroskedasticity and allow for serial correlation through clustering by firms. **, * denote significance levels of 1 and 5 percent, respectively.

(1) (2) (3) (4) (5) (6) (7) (8)
Exc. Outliers
Post-M&A
PatentsPre-M&A
PatentsPatents ≤ median
Patents > median
Two-Year
Growth
Share Decentralized t-1 0.037** 0.037** 0.037** 0.021* 0.040** 0.044** 0.029** 0.044**(0.010) (0.010) (0.010) (0.011) (0.010) (0.015) (0.012) (0.015)
ln(1 + No. Affiliates ) 0.021** 0.020** 0.021** 0.019** 0.019** 0.028** 0.019** 0.014**(0.003) (0.003) (0.003) (0.004) (0.004) (0.006) (0.004) (0.004)
ln(R&D Stock )t-1 0.010** 0.010** 0.010** 0.009* 0.009* 0.013** 0.016 -0.001(0.004) (0.004) (0.004) (0.004) (0.004) (0.005) (0.009) (0.007)
ln(1+Patents stock )t-1 0.007* 0.007* 0.007* 0.008* 0.009** -0.003 0.016** 0.018**(0.003) (0.003) (0.003) (0.004) (0.003) (0.009) (0.006) (0.005)
ln(1+Publications stock )t-1 0.001(0.003)
ln(Sales )t-1 -0.104** -0.104** -0.104** -0.104** -0.113** -0.135** -0.077* 0.093**(0.020) (0.020) (0.020) (0.021) (0.025) (0.026) (0.038) (0.019)
ln(Assets )t-1 0.056** 0.056** 0.057** 0.060** 0.066** 0.089** 0.017 -0.136**(0.018) (0.018) (0.018) (0.020) (0.022) (0.026) (0.027) (0.019)
Four-digit SIC dummies Yes Yes Yes Yes Yes Yes Yes Yes
Year dummies Yes Yes Yes Yes Yes Yes Yes Yes
R2 0.107 0.107 0.107 0.111 0.114 0.133 0.129 0.123
Observations 15,748 15,748 15,648 13,568 14,375 7,854 7,894 14,267
Dependent variable: Δln(Sales )t-1
Table 7. Sales Growth
Notes: This table reports the OLS estimation results of the relation between of patent decentralization and firm sales growth. Standard errors (in brackets) are robust to arbitrary heteroskedasticity and allow for serial correlation through clustering by firms. **, * denote significance levels of 1 and 5 percent, respectively.

Share Decentralized t-1 ×
Total Diversification(0.004)
Share Decentralized t-1 ×
Unrelated Diversification(0.047)
Share Decentralized t-1 × Related Diversification
(0.005)
Share Decentralized t-1 ×
Technical Concentration Index(0.102)
Share Decentralized t-1 ×
Geography Concentration Index(0.191)
Share Decentralized t-1 0.047 -0.096(0.112) (0.086) (0.057) (0.108) (0.053) (0.069) (0.057)
Total Diversification(0.001)
Unrelated Diversification(0.043)
Related Diversification(0.001)
Technology Concentration Index 0.213(0.001) (0.140)
Geography Concentration Index 0.204(0.001) (0.129)
R2
Observations
0.011**
-0.245**
-0.598**
-0.003**
-0.003**
-0.003**
0.359** 0.117** 0.139**
-0.003**
0.011**
0.140**
-0.081*
0.251** 0.277**
0.828
15,76415,764
0.828
15,764
0.828
15,764
TABLE 8. Diversity
Dependent variable: ln(Market Value ), OLS
(1) (2) (3) (4) (5) (7)(6)
0.869
3933
0.828
15,764
0.8280.806
3957
Specia-lized
Diver-sified
Notes: This table examines how the effect of decentralization on firm value varies with firms' technological diversity. Total, Unrelated, and Related Diversification are computed as the Entropy measure using patent IPC codes. Firms are classified as specialized (column 1) or diversified (column 2) based on the 1st and 4th quartile of Total Diversification , respectively. All regressions include the following additional controls: ln(R&D Stock ), ln(Assets ), ln(Sales ), ln(1+ No. Affiliates ), and complete sets of three-digit US SIC code and year dummies. Standard errors (in brackets) are robust to arbitrary heteroskedasticity and allow for serial correlation through clustering by firms. **, * denote significance levels of 1 and 5 percent, respectively.