the oregon benchmarks changing systems by …
TRANSCRIPT

0
THE OREGON BENCHMARKS
CHANGING SYSTEMS BY STEALTH: A SUCCESS STORY IN THE MAKING
Center for Community Enterprise October 2000 Mike Lewis Sandy Lockhart Dave de Montreuil

1
TABLE OF CONTENTS
Background 1 Genesis of Research & Key Objectives 1 Methodology 2 A Comment on Terminology 3 Understanding the Oregon Benchmarks System 6 Oregon Benchmark Basics 6 Emerging from the Crisis - Oregon Shines the Strategic Vision 6 Caretaker of the Strategic Vision : The Oregon Progress Board 11 The Vision Revisited – Oregon Shines II 13 More Specific Ruminations on the Impact of Benchmarks on Oregon Governance 18 The Senior Levels of State Government 18 Impacts on Government Operations 19 Oregon Business 26 Local Level Impacts 27 Preliminary Conclusions 30 The British Columbia Context : A Brief Review of Key Initiatives 31 Bringing Oregon Home? Issues, Challenges and Recommendations 42 A Note on the Challenge of Transporting Concepts 42 Analysis and Commentary related to Key Ministry Questions 43 Analysis and Recommendations : Ministry Legislation and Policy Framework 46 Some Concluding Comments 49 Appendix One Case Study Tillamook County, Oregon : Setting the Benchmarks for Performance and Partnerships 50 Appendix Two Bibliography 61 Appendix Three Field Research Contacts 66

2
THE OREGON BENCHMARKS
CHANGING SYSTEMS BY STEALTH: A SUCCESS STORY IN THE MAKING
BACKGROUND Genesis of Research and Key Objectives The Center for Community Enterprise (CCE) and its predecessor organizations have been involved in community economic development for almost 25 years. In the last decade, the field of CED across Canada has made tremendous strides. In many settings, urban and rural, communities were demonstrating that organized capacity at the local level has demonstrable impacts of local poverty reduction, community vitality and the strengthening of civic values and participation of citizens. CCE, as a research and technical assistance organization has had the privilege of working with many of these efforts over a long period of time. Based on our learning from the efforts of so many, and based on systematic research undertaken in the first years of the 90s, we began to define what constituted best practice. Out of this emerged the next logical question : How do we replicate or scale up what works? One of the obvious targets for any organization concerned with scaling up or replication is to influence the larger systems that have the mandates and resources required to move the local success into larger order impacts. As it turns out, this is easier thought about and talked about than achieved. We have consistently come up against what we have come to term as the “systems problem”. Fragmented mandates, stovepipe delivery systems, turf protection – these are some of the descriptors that have become part of CCE’s everyday lexicon as we have struggled, somewhat unsuccessfully, to thread the “scaling up” needle. In 1998 we came across what for us was a landmark book entitled “Common Purpose : Strengthening Families and Neighborhoods to Rebuild America” by Lisbeth Schorr (available from the bookstore on cedworks.com). This book inspired and informed us to undertake new, more energetic efforts to come to terms with what has for us become the “systems change agenda”. Among the references we picked up was a fascinating, state wide change process going on in Oregon referred to by Schorr as the Oregon Benchmarks. In 1999, Mike Lewis, one of this reports authors, then met people from

3
Tillamook County at a conference he way speaking at. The local linkage to creating what they called performance partnerships was exciting and, so it turns out, was inspired in part by the Oregon Benchmarks. Early in the year 2000, CCE decided to commit resources to start learning more about what was really involved in the Oregon Benchmark system? What were the major elements? How was the public involved in setting them? What was the evidence of impacts at different levels of Oregonian society? What lessons have been learned? What is the institutional ecology that has enabled the Oregon Benchmarks to have such a broad relevance, at least as viewed by Schorr? These were some of the questions we had when we started. Our interest rapidly grew as we started looking at the source documents. We felt it important that we find a sponsor to take the research the next step. The Ministry of Community Development, Cooperatives and Volunteers took up the next stage of funding which enabled a much more in depth analysis to be initiated, including primary research in Oregon. In the course of negotiating the terms of reference, they expanded the inquiry to include examination of several B.C. based initiatives undertaken over the last 8 years. By looking at such things as the B.C. sustainability reports, regional health legislation and the recently adopted provincial health goals, the objective was to see where the parallels were and what the Oregon experience might teach us with respect to more effectively positioning B.C. initiatives relevant to building a more sustainable economic framework. The result of this synthesis of interests is this report. We have no doubt that what has been revealed, both through the research and the comparative analysis, will have ongoing relevance to the work of CCE and the networks it is part of. We also believe that there are results of direct relevance to both the Ministry and the B.C. government as a whole. For that matter, we think the findings are of relevance to jurisdictions across Canada, a conclusion that is leading CCE to consider how within its priorities it can continue to both learn and transfer the knowledge we have gained. Ultimately, scaling up innovations that work and the challenge of forging a more sustainable society requires change at several levels, including communities and public governance and bureaucratic systems. The Oregon Benchmarks is an important contribution to our learning as to how to go about creating the necessary components to make it happen. Methodology Two primary methodologies were employed in pursuing the terms of reference that provided the focus of this report. The project began, and continued, to review relevant documents (including those available on institutional web sites) in both the Oregon and BC contexts. After digesting the principal original Oregon source documents, prearranged, face-to-face interviews were held in Portland, Salem and Tillamook County, during a one week visit from August 27 through September 1, 2000. The interview

4
technique combined a short set of directive questions with a longer open ended discussion, ranging from one to two hours duration, during which the respondents were probed to give an account, from their own institutional perspective, on the “official” documentation as well as any other relevant involvement in any of the manifold aspects of what has become known as the Oregon Bench Mark (OBM) experience. In many cases, the respondents were able to provide us with additional, or more up to date, documents. Phone interviews were also held with key respondents in three BC communities in order to gather insights into local awareness of relevant BC initiatives1. Although these methods achieved a goodly amount of detailed information in both the Oregon and BC contexts, in the short time available to us, the goal was to develop an overview perspective on the OBM experience in its own context and some sense of how it might translate if it were to be applied in the BC context. As a consequence, our use of detailed information in this report is strictly illustrative and should not be read as an attempt at rigorous verification of the analytical discussion . As with most key respondent and literature review investigations, the primary “validity” check rests on the degree to which there is significant agreement on general interpretations and outcomes among informants and between those interviewed the more formal documentation. It is in this latter sense of having tapped into a remarkably strong consensus among informants from notably divergent interest perspectives that we feel our report captures the essential characteristics of a experiment that has unquestionably had an impact both within and beyond its own jurisdictional boundaries. A Comment on Terminology As has been noted many times before, jargon, legalese, bureaucratese and other forms of technical language inflation are scourges to be avoided. While the use of the commonly shared vocabulary is an unquestionable aid to good communication, it does not always well serve situations were language needs to have very precise meaning. Unfortunately, much of our every day usage vocabulary is anything but precise. Words mean different things in different contexts, which is fine if the different contexts are also well understood. However, whenever a relatively new field of interest develops, in which it is the context itself that needs to be explained, ordinary language may fail to achieve this purpose if the available vocabulary contains too much ambiguity. In reviewing this salient example of a relatively new field of interest, we have at times been dismayed by the ambiguity that results from the use of different words to denote the same thing and the same words being used to describe different things. For example there is considerable confusion, even within the seminal literature, regarding
1 A listing of all relevant documents and of the organizations represented in the interviews will be attached to the final report draft.

5
the use of “bench mark” Vs. “indicator” or “performance-based” Vs. “results-based” measurements. In an attempt not to contribute to this confusion we have adopted the definitions, found in Mark Friedman’s insightful discussion paper, “A Guide to Developing and Using Performance Measures in Results-based Budgeting”. The brief discussion of the key terms and concepts that appears below is taken from Mark Friedman’s paper. Friedman’s complete article is particularly relevant to the wider societal transformations that lie behind the content of this report t and is available on the web sight, www.financeproject.org/measures.h The Change Agent Service Delivery Context
“Cheshire Cat,” Alice began, “Would you tell me please, which way I ought to go from here?” “that depends a good deal on where want to go,” said the Cat.
(Lewis Carroll) “Much of the tradition of performance measurement comes from … the industrial part of the private sector… dating from the time and motion studies of the late 19th and early 20th centuries…. This model does not translate very well into public or private sector enterprises that provide services…. It does not make much sense to think of clients, workers and office equipment as inputs to the service sausage machine…. Instead, we need to begin thinking about services in terms of the change-agent model. The agency provides services (inputs) that act upon the environment to produce demonstrable change in the well-being of clients, families or communities (outputs).” (Friedman , p. 2) Given this understanding of purpose, it makes little sense to measure the success of change-agency services in terms of the well established program delivery input dimensions (e.g., number of FTE person days assigned, program $ distributed, client’s enrolled, etc., etc.) as opposed to output measures that capture the extent and rate of progress, or lack thereof, toward change targets. The industrial model term, “performance measure”, is thus rather inappropriately applied in change agent model application as it connotes input rather than the relevant output measurement. “Performance measures are absolutely essential for running programs well. But they are very different from results and indicators… [that] have to do with our service response to social problems…. It is possible, even common, for individual programs to be successful, while overall conditions get worse.” (Friedman, p. 2) Thus what we are looking for in the change agent model is “results” or “outcomes” based measures. Rather obviously, any measurement of change requires one or more measurable “objects” that characterize the often more complex and subjective change process. These specifically measurable objects are usually called “indicators”. In Friedman’s terms, “An indicator is a measure, for which we have data, that helps answer the question” ‘How would we know a result if we achieved it?’” But if indicators are to capture the extent and/or rate of change, some common, comparable

6
beginning point, or “benchmark” needs to be established as the effective point of departure. But as Friedman notes, there is [in U.S. usage] a “difference in the way in which the word “benchmark” is used in public and private sector application. The public sector often uses the term ‘benchmark’ to mean an indicator or performance measure [in and of itself]. The private sector uses the term to mean a particular level of (desired or achieved) performance. (Friedman, p2; emphasis added) The emphasis was added to the above quotation specifically for the Canadian reader who may find it confusing, as we did ourselves, in initially sorting out the key terminology used by the published Oregon sources. In particular, the Oregon material tends to apply the “benchmark” term to both the big picture, policy-driven, outcomes defined, macro change categories themselves, as well as to the typically multiple “indicator” databases through which progress is to be measured, in actually achieving these primary outcome targets. In this report’s usage, we have endeavored to use the term “indictor” whenever making reference to a measurement category. We would like to have substituted another more clearly distinctive term, such as “outcome target” for the outcome categories themselves. However, this was not entirely possible, given that the more inclusive usage has become something akin to a trademark in the “Oregon benchmark” context. Some attention to the context in which we use this term “benchmark” in this Report, as elsewhere, is thus recommended.

7
UNDERSTANDING THE OREGON BENCHMARKS SYSTEM
Oregon Benchmarks Basics The Oregon Benchmarks is not one thing. Rather, it is a series of steps and related components, which together create a systemic framework for guiding change efforts in Oregonian society. The first step, and a foundational component, is the creation of a unified vision. Oregon did this in 1989 with the publishing of a strategic vision referred to as “Oregon Shines”. A vision without meaningful targets and measures that focus action and guide resource allocation will neither inspire nor contribute to real change. The Oregon Benchmarks are a combination of targets and measures (indicators) that inform and track progress towards realizing the strategic vision. Both of these components have been well advanced in the last decade’s systematic implementation of the Oregon Benchmarks system. But the system continues to evolve further. The “Benchmarks” themselves are becoming the foundation for change efforts and common strategies at several levels of Oregonian society. The clarity of the outcomes and measures are stimulating and facilitating defining strategies and building effective partnerships. Evidence of this is found in in several parts of this report. Evaluation based on action is the final step/component and is reflected in the narrative That follows, for example, the revised vision statement, Oregon Shines II, and the resulting evolution of state-wide agency performance management measures. Of course none of this could have achieved the remarkable results realized in Oregon without the creation of a dedicated implementation institution. The Oregon Progress Board is a 4 person operation with a legislative mandate to define “benchmark” outcomes and track the progress toward their attainment. It is, in itself, and in how it is linked to key policy and decision making features of the Oregon State government apparatus, a core component of the Oregon Benchmark system. Emerging from the Crisis - “Oregon Shines” : The Strategic Vision Partisan philosophies aside, it seems fair to say that in general the strategic planning function within government tends toward incremental change on existing themes. At least this seems to be the case so long as the social and economic environment within a society remains reasonably compatible with the established order. However, when external impacts begin to wreak havoc with that order, the stage is set for more visionary interventions.

8
Back in the late 1980s Oregon state found itself rather abruptly cut adrift from its long-established economic mainstays. Like BC, Oregon’s economy was heavily dependent upon the primary sector. Forest products and the fishing industry were the dominant players. Shifts in market forces, resource depletion and degradation, and wider changes in public environmental sensitivities (notably for Oregon, the spotted owl extinction issue), all combined to virtually shut down a once thriving, but also rather complacent, economic engine. Confronted by a severe recession, the major component of which was structural, and hence not amenable to cyclical recovery, the State government of the day had no option but to embark upon a quest for an alternative vision. In 1989, Governor Neil Goldschmidt exercised his energetic leadership by creating a demanding agenda for challenging times. He gave his officials six months to put in place a state wide strategy that would counter the inexorable decline in the economy. He also, with strong support from the Oregon Business Council, put in place a broadly representative task force to help drive the strategic analysis and visioning. Over 200 carefully selected individuals become involved in the quest to develop a comprehensive, statewide revitalization plan. The strategic vision is set out in the 1989 landmark document, “Oregon Shines”. It projected three statewide goals:
1. “To invest in Oregonians to build a work force that is measurably the best in America by the year 2000, and equal to any in the world by 2010.”
2. “To maintain Oregon’s natural environment and un-congested quality of life to
attract the people and firms that will drive an advanced economy.”
3. “Create an international orientation in Oregon’s business and cultural life that distinguishes Oregonians as unusually adept in global commerce.”
The question, just how innovative this “alternative” vision was, needs to be asked. On the surface, the vision statements do not seem particularly compelling. However, if the goals and the prescribed means of achieving them are put in context, it appears that both ends and means do significantly diverge from past Oregon approaches. As well, as will be seen, the overall “Oregon Shines” strategy markedly differs from those of other regional economies experiencing similar challenges, including British Columbia. With regard to the three goal statements, there can be little doubt that “Oregon Shines” represents a major departure from the State’s established ways of pursuing its historic economic interests. Like most resource-based economies, the work force, while often skilled in a “learn on the job” sense, had never before viewed their notably lower than average U.S. education levels as a problem. Thus the focus on education, training and work force development was, in Oregonian term, a fresh priority. Similarly, the State’s economic planning establishment had not before considered quality of life issues as relevant to their mandate. A relatively low population density in combination with

9
economic dependence on resource exploitation had kept environmental and social issues safely outside the realm of economic development. However, by the late 1980’s the State’s capacity to ignore bad environmental management, both natural and social, had reached its limit as both urban and rural quality of life issues came into increasingly open conflict with the traditional approach of accommodating dominant economic interest groups. Thus the linkage of quality of life enhancement to work force adjustment became seen, not just as a way of ameliorating the growing internal conflicts, but just as important, a central strategies for “attracting the new outside [high tech] industries” envisioned as the means by which the “globalization challenge” that Oregon now had no option but to meet. But as radical a departure as these strategic planning statements may have been from Oregon’s historic pattern, they were hardly original in the wider context of a Nation that was, by the late 1980’s, already leading the charge into those still uncharted waters of a global economy driven by high tech innovation. Indeed, from the U.S. national economic perspective, the essential feature of this transformation was a shift away, not just from the resource sector, but from mass industrial production to the new tertiary sector communication, knowledge and management systems technologies. Thus, from this broader change perspective, the “Oregon Shines” vision did not differ in any significant way from similar vision statements to be found elsewhere in the United States and Canada—including that of B.C. However, Oregon Shines also set out three critically important means of supporting the achievement of these implementation goals:
1. “Form institutional partnerships among groups that have traditionally operated independently or even antagonistically toward one another.”
2. “Invest in public facilities that directly affect business operations and costs and in
services that enhance the quality of human environment, including schools, public safety and parks.”
3. “Contain costs of doing business through [State cost cutting provisions in such
areas as] workers’ compensation rates, unemployment insurance and energy rates.”
By any comparative standards of the day, these were extraordinary steps for any State government to take. Indeed, they represented not only a departure from Oregon’s own past practices, but from the then almost universally accepted U.S. supply side economic theory which was chasing government out of many spheres of economic intervention and social program supports. Thus the “Oregon Shines” call for significant new government interventions was a direct affront to the then conventional economic developmental wisdom. So understood, in the context of the times, both the strategic goals and the tactical prescriptions of the Oregon Shines initiative did have an innovative edge. However,

10
neither of these features represents what was most conspicuously original in Oregon Shines. What has given the Oregon experiment its wider currency was the way in which progress toward realizing these prescribed outcomes was to be monitored, measured and evaluated on an ongoing basis. Each of the goal and implementation recommendations were to be translated into practical, results oriented targets and measures. Once established, and regularly compiled, these “Oregon Bench Marks” indicator measures would provide all concerned with a regular report card on achievement of the Oregon strategic vision. Herein, both in concept, but more important in practice, is where the promise and impact of Oregon Shines became realized. Caretaker of the Strategic Vision : The Oregon Progress Board Unlike most high level externally seconded task forces assembled for the sole purpose of informing the government of the day how best to fix a problem, but then subsequently dismantled, leaving their recommendations institutionally orphaned, the Oregon Shines task force provided for a “long term caretaker of [its] strategic vision” This “caretaker” was to take the form of the “Oregon Progress Board” (OPB). Established by the State Legislature in 1989, directly following the release of Oregon Shines, the ten member board, made up of a diverse group of business and community leaders, under the chairmanship of the Governor, and with the explicit aim of ensuring a bi-partisan tone to its work, immediately embarked on an energetic process of constructing the combination of targets and indicators which have become known as the “Oregon Benchmarks” (OBM). One thing that needs note, which we as researchers found curious, was that the legislation putting in place the Oregon Progress Board as the caretaker of the strategic vision, had a de facto 5 year sunset provision written into it. If future legislatures did not approve its funding, the caretaker of the long term vision would be terminated. Building the Benchmarks Duncan Wyse was the OPB’s first Executive Director. He, along with an office manager and one policy/research analyst, (in 2000 there are a total of only 4 staff and an overall core operating budget of $700,000 US) immediately set themselves the task of establishing the first draft of the benchmarks. Many of these OBMs were derived from examining a wide range of existing data sets that could be made relevant to tracking

11
progress in relation to the three main Oregon Shine goals. They were organized under seven major headings.2 Economic Performance Public Safety Education Social Support Community Development Civic Engagement Environment The first draft of the Benchmarks (some 279 of them) was taken to a broad cross-section of community, business and institutional leaders. Meetings were held with every legislative committee to review the benchmarks. Based on all this input significant revisions were made that became the basis for the 1991 Progress Report. Being widely distributed, it also became the basis for ongoing input from a wide variety of quarters. The executive director also undertook extensive public presentations across the State. Over the four plus years of his tenure he personally reached some 23,000 people. Inspired in part by the Benchmarks process, the Oregon Business Council undertook in 1992 an expensive ($250,000 US), scientifically sophisticated and comprehensive study of the Values and Beliefs of Oregonians. The results became an important reference point in subsequent revisions and refining of the Benchmarks3. The Values and Beliefs Study and the then current draft of the Benchmarks were then packaged into a framework for use in 29 town hall meetings around the State. Over 2000 citizens participated in electronic voting aimed at establishing what were the most important benchmarks. By the end of this stage, the benchmarks were pared back to ? (need to check – 100 or so) including additions, deletions and lots of further refinement. And, before the process was complete, every committee of the legislature was again engaged in a review of the draft Early Applications of the Benchmarks Three important things occurred in 1991 that deepened the potential early significance of the Oregon Benchmarks. First, and obviously important, the first Benchmarks report was published and widely distributed. Second, there was an election of a new governor, Barbara Roberts, who was an enthusiastic and articulate booster of the Benchmarks framework as a tool for improving the performance of government. Third, the citizens of
2 All of the original OBMs that came out of the initial process described here, and the “report card” data displays over the period 1980 through 1996, from which many of the original benchmarks were derived, are reproduced in the Appendix of the 1997, Oregon Shines Two document. While a number of individual “benchmark” indicators have been revised to reflect the new target priorities, the seven category headings under which individual benchmarks were originally organized have remained the same to the present). 3 Another major impact was on the thinking of the Oregon Shines II Task Force appointed in 1996 where the reported values and beliefs of Oregonians had an important influence on the re-formulation of the major goals of the State strategic vision.

12
the state approved Measure 5 which was the Oregon manifestation of the US penchant for tax revolt. These three events converged in a way that dramatically elevated the profile and importance of the Benchmarks process. In 1992, Governor Roberts was forced to cut the state budget by 20%. With the freshly minted first report of the OPB, Roberts told state agencies that they could win back budget appropriations by linking their priorities to the Oregon Benchmarks. In one fell swoop, the organs of government became attentive to the theory and emerging practices of benchmarks. While this direct linkage between Benchmarks and budgeting did not thrive beyond the Roberts administration, there has been a recent executive order from the Governor requiring all agencies that receive government resources to establish performance measures and link them to the Oregon Benchmarks. During this early period of applying the Benchmarks the small but committed staff worked tirelessly to promote and extend the understanding and use of the Benchmarks in a wide variety of settings, both within and outside of government. Duncan Wyse, the first Executive Director, made speeches to over 23,000 people in the first four years between 1991 (the first Benchmark report) and his departure in 1995. This level of activism in promoting the Benchmark Framework is no doubt partially responsible for remarkable place OB and the OPB have come to occupy in Oregon society, some examples of which will be briefly illustrated later in this narrative.
The Oregon Option – The Federal Promise The focus on outcomes, so central to the OBM system, was already in the early years of implementation proving to be, in the words of the Governor of the early years, Barbara Roberts, “a magnet for collaboration” in a wide range of non-government organizations as well as between state agencies. An unexpected reinforcement for this conclusion came from the distant Washington D.C. By 1993, Washington D.C. began moving in a direction similar to those reflected in Oregon’s efforts. Both Democrats and Republicans were interested in more efficient bureaucracy. Constructing a “new federalism” became a catch phrase to describe one facet of the answer to more effective and efficient government, namely, placing greater emphasis on states and localities solving their own problems and re-inventing the Federal government to support a more decentralized Federal system. To this end Clinton established, in 1993 the National Performance Review and appointed Al Gore to head it up. In early 1994, at a major conference on re-designing government, the Oregon officials presented their Benchmarking process. The Federal government was impressed and between May and December, the Oregon Option was invented. The Memorandum of Understanding between the Federal and Oregon State governments “called for the partners to identify desired results and work together to achieve them, making an effort to eliminate barriers and create a new service delivery system with an emphasis on

13
simplicity, coordination, and prevention.” It seems Roberts “magnet for collaboration” had drawn in a large partner. While several of the people interviewed, especially people who are working at the OPB, expressed disappointment with the results that have been achieved by this landmark agreement, there is clear evidence of some impacts. There are Federal programs that have loosened the strings attached to Federal money and Federal regulatory agencies reducing, and sometimes waiving altogether, regulations where performance measures are in place. [Christina Macy, report on the Oregon Option to the Annie E. Casey Foundation]. In contrast to OPB officials, local and county level people interviewed believe that the Oregon Option, as defined in 1994, continues to be a key tool for local activists and county officials to leverage collaboration and coordination between Federal and State agencies in relation to local governments and citizen led initiatives. One respondent went further, intimating that the Oregon Option has provided a means by which local people could persuade reluctant bureaucrats that they have the security necessary to act in new ways. “They want meaning in their lives too” was the crowning statement. Summary of Themes : The First Five Years & Making it into the Next The first few years, 1990-95, were dominated by three streams of activity; building the base of interest and support for the idea of Benchmarks (outreach); defining the benchmarks (technical and consultative) and getting the baseline data in place for each of the benchmarks. The overall process can be understood as iterative and characterized by continuous learning which led to regular and systematic refinement of the Benchmarks. By 1995 the number of Benchmarks had been honed to less than 100, a level the OPB does not want to go above [the current number is 92]. As noted earlier, the original Oregon Progress Board legislation had a sunset of five years. The implication was that, unless the State legislature re-authorized the OPB, it would have only an additional two years of funding. The new executive director, Jeff Tryens, came into the Executive Director position five months before the end of the fifth year. With a good deal of effort, ensuring the OPB activated OBM supporters and developed legislative champions, Jeff succeeded in having the statute renewed. The Oregon Progress Board is now a statutory agency of the State government. It is seen and acts like an independent state planning and oversight agency that is “the steward of the state’s 20 year strategic plan. Some Lessons Worth Noting : Keeping the OPB on Track and Out of Trouble Part of the OPBs legislated mandate is to help guide resolution of problems, which are identified as a result of the adoption of performance measurement and benchmark application. However, this function has been assiduously avoided. The OPB leadership has come to believe that while it can play a key role in pointing to best practices, it should not advise legislators or agencies on how to resolve problems. Why? Because the debate over how to resolve any particular problem feeds into widely varying, most often partisan perspectives. For example, the Republican dominated legislature generally
14
wants a reduced role for government while the Democratic governor’s office sees an ongoing and significant role for government. If the OPB were to involve itself in advising how to solve a particular issue, the concern is that it would become trapped in the wrangling associated with clashing political philosophies. This would destroy a critical feature of its operation and effectiveness, that is, its ability to keep Oregon Benchmarks focused on helping all Oregonians better understand how they are doing as a society in terms of meeting the goals all Oregonians say are important. A second point worth noting relates to the small number of staff and the modest budget of the OPB. From the beginning, the OPB has been very conscious of how it is perceived by Legislators and the public. As a matter of operational strategy, it has been determined that staffing and the cost of operation should be kept to absolute essential core people and costs. Contracting of services and networking with universities, the Oregon Business Council etc is done to achieve priorities beyond the ability of the in house staff. It has been acknowledged that the computer age and Internet have made a lot of what the OPB does achievable through higher productivity. Valuable, meaningful representation for the resources invested is acknowledged as being very important for the long-term well being for the OPB. Third, there are three major priorities that the current executive director believes are critical to the ongoing effectiveness of the OPB and the overall benchmark system.
1. Keeping the Flag Raised – With a small staff and with the potential decline in interest bred by familiarity, it is seen as crucial to constantly find ways of ensuring the profile of the OPB and the Benchmarks are maintained. This despite the fact that the OPB Executive Director now enjoys a permanent seat at the cabinet table and is in the Governors inner policy circle. Obviously this level of direct influence on government would be considered a challenge in our own British Parliamentary System governing mode.
2. Keeping the Benchmarks from becoming partisan.
3. Constantly working to maintain and strengthen trust in the reliability and
credibility of the Benchmarks and the OPB The Vision Revisited – Oregon Shines II In April 1996, Governor John Kitzhaber created a second Oregon Shines Task Force. Its mandate was to work with the Oregon Progress Board (OPB) to assess the extent to which the Oregon Shines strategic vision had succeeded in attaining its targets and to recommend changes in planning goals as required. The Task Force embarked upon a extraordinarily thorough public consultation process in which six year accumulation of OBM time series bench mark data was widely distributed as a basis for a variety of public input mechanisms. The time had come for reflecting on the progress and the deficits in a

15
way that engaged leaders and citizens from across the state in formulating the major goals that would shape the next 20 years. 4 So what did the OBM data set record have to say to the Task Force members and the Oregon citizens with respect to the successes and failures of the original “Oregon Shines” plan and what direction did the OPB analysis point to with respect to any need to establishing new priorities? Given the human track record in forecasting the future, it is not surprising that there was both good and bad news to be found in OBM data. The good news was unequivocal. The primary OS-I goal of achieving, by the year 2000, a transformation from an almost exclusively resource-based economy to one driven by the new high technology, globally competitive industries, had succeeded beyond any reasonable expectation. Of course, this transformation, and the resulting turn around in the State’s macro economy could not be completely credited to the State’s own bootstrapping efforts. This was the same decade in which the U.S. national economy began to ride the crest of an extraordinarily strong and prolonged, high tech. driven recovery wave. But, in comparison to other resource sector based regional economies, the Oregon recovery was not only outstanding, but led the Nation with respect to the extent of the transformation. However, the bad new was hardly less blatant. Those benchmarks that had been established to measure progress toward preparing all Oregonians for participation in the social and economic benefits of the new economy, showed little or no progress. Indeed, in some critical quality of life and social infrastructure areas, the OBM indicators registered negative progress. The Benchmark Results : Confronting the Reality To date, there have been five bi-annual , OPB’s “Benchmark Performance Report” to the Oregon legislature starting in 1991. One can review the data for a particular period, or as a time sequenced series. Indeed, there is data for some benchmarks that go back as far as 1980 (due to the utilization of preexisting indicator data sets) . The report of 1999, although three years following the initiation of the Oregon Shines II review, provides a reasonable indication of the kind of data that the Governors Task force based their thinking and strategy formulation on. We use it here for ease of presentation. The introduction of letter grades, although seen as problematic by some Oregonians we interviewed, provides a short-hand way of providing a snap shot of what is improving (A) & (B), what is essentially unchanged (C), to what is going backwards (D and F). Based on what has already been intimated, an “A” letter grade was given to the benchmark indicator – “Attracting New Companies”. This was closely followed by a “B+” in attracting those independent “Professional Services” that were essential part of the high tech. Business environment. However, none of the other bench marks within the 4 This revisiting process and the recommendations that flowed from it are fully documented in, “Oregon Shines II: Updating Oregon’s Strategic Plan”

16
“Economic Performance” cluster achieved more than a marginal improvement “C” letter grade and, one key bench mark, that of “Employment Dispersion”, was given an “F” grade. It was now obvious in (OBM recorded) hindsight that while the new high tech. Industries had brought conspicuous affluence within the limited confines of the State’s I-5 corridor, where the new industries had clustered, the benefits had not migrated to any other part of the State. Indeed, as the OBM income data revealed, many of the Counties showed significant declines in family incomes over the same period. This is not to say that some of the OS-1 quality of life enhancing measures, aimed primarily at those being so aggressively courted, did not benefit all Oregonians. For example, in a Nation still committed to private health care, the OS-1 targets aimed at ensuring a much wider ability to participate in private Medicare insurance was given a high mark. Similarly, some, but by no means all, the environmental protection and improvement bench marks showed marked improvement. But the bad news was most significantly and tellingly located within the data related to the social health of Oregonian society. Such indications of deep poverty as: homelessness (D+), general crime statistics, (F), juvenile arrests, (F), use of illicit drugs (F), incidence of child abuse (F), families for whom child care is affordable (F), incidence of elder abuse (F), urban congestion (F), availability of low income housing (D) – all revealed worsening, rather than the anticipated improvement over the decade of macroeconomic “progress”. Thanks to the OBM reports, it was now clear that the anticipated spin offs and trickle downs from attracting high tech industries into wider community and family benefits had utterly failed. While external investment in the new economy had been beyond expectation, internal venture capital investment in local community enterprise had all but dried up. There were few local sources of amelioration for the deep pockets of poverty and associated pathology to be found not only in small rural community contexts, but also the large urban centers. These features of a “dual economy”, of growing poverty along side increasing affluence, was particularly apparent in the cities. These dichotomies come as no surprise to those who have studied the actual, as opposed to the theoretically projected, consequences of global economic transformation. While the conventional macroeconomic indicators post positive gains, these gains tend to be geographically, demographically and sectorally concentrated. The same holds true of the counter effects; socio-economic displacement and marginality also becomes concentrated. The result has been, and continues to be, an attenuation of the middle segment social-economic opportunity structure. The popular cliché about the “rich getting richer and the poor getting poorer” in the shift to the global economy has been widely born out. As already noted in the review of the original Oregon Shines, while the goals were in many respects conventional, the means of achieving these goals, the adoption of the benchmarks system for measuring progress, or lack thereof, was highly innovative. As well, and critically important to the reformulation of the goals that took place through the Oregon II strategic planning process, was the fact that a broad range of social,
17
environmental and economic benchmarks were included from the beginning, partly due to the way in which the original goals were formulated. Thus, a more comprehensive set of “progress” goals could be tracked and evaluated in a holistic analytical framework, so as to achieve a better balance between social and economic costs and benefits. This is clearly what happened as a consequence of the Benchmark analysis that fed the thinking of the Oregon Shines II Task Force. Having revealed just how well the initial economic restructuring goals had been achieved, against which the worsening indicators related to social and quality of life were starkly contrasted, there could be little doubt as to where the priority emphasis needed to be shifted. As a consequence “Oregon Shines-II” laid out three new goals. The Oregon Progress Board is now focused on outcomes that support the priorities these overall goals represent.
1. Quality jobs for all Oregonians 2. Safe, caring and engaged communities 3. Healthy, sustainable surroundings
This strategy employed in pursuing these goals introduced a whole new strategic planning agenda in which community-based developmental principles and practices have clear priority. In so doing, the OS II Task Force Report also made recommendations for OBM revisions, removing a few of the original bench marks that did not produce useful insights and adding some that capture the performance of new priority targets. Based on our interviews, and examination of the post 1997 reports, this ongoing process of revision and refining as proceeding apace. Indeed, a major process of examination has just been concluded to revise the environmental benchmarks. Involving scientists and a range of citizens, and sponsored by the Oregon Progress Board, the resulting revisions will be integrated into the 2001 Progress Report In summary, the whole process by which Oregon continues to engage in a “rolling evaluation” of its strategic vision and plan has created what appears to be a significantly self-correcting mechanism in Oregonian society that serves it well. It has several features that seem important to us.
1. It is a “work in perpetual progress” that is based upon a combination of expert application of critical analysis, including the OBM performance measuring;
2. It fosters transparency which enables and empowers social learning, participation
and enhanced public input, and the creation of incentives leading to a wider cultural acceptance and participation in performance evaluation;
3. Coupled with other measures that will be discussed in sections following, the
benchmark system creates the backdrop against which cooperation and coordination between diverse segments of Oregonian society is being encouraged and reinforced;

18
4. The benchmark system is a mechanism that directly contributes to strengthening the capacity of government and other sectors of society to manage the ongoing challenges of becoming a more sustainable society.
While the distinctly innovative new institutions that promote and manage this process are a creation of government, they are also significantly arms length from partisan politics. Three successive administrations, including those with divided executive and legislative party allegiances, have supported and benefited from these arrangements. At the same time, citizen involvement in the process has been extraordinarily devoid of the usual “blame government” and “nothing makes a difference anyway” attitudes that so characterize contemporary Western political institutions generally. The civil service has notably, if not universally, accepted their new roles as cooperative “partners in problem solving” rather than administrators of fragmented programs delivered in ways that too often only confound their intended purpose. Perhaps most notable of all (based on our recent observations) is the sense that the OBM methodology and the new institutions it has spawned, have become an accepted part of the Oregon political culture. Such widely differing institutions as schools and the police have instituted their own bench marks, articulated as subsets to the Oregon bench marks. Private and voluntary sector organizations are similarly framing their strategies and measuring their progress. Although difficult to verify, our extensive interviews left us with the very clear impression that there is a new and quite different set of criteria by which institutional leadership is being recruited and promoted. It is, of course, too soon to make presumptions as to how pervasive such a system might become. However, it has been closely emulated in Tasmania, the Japanese have sent several high level delegations over to study it, and in the U.S. itself, the “Oregon Option” has achieved widespread interest.

19
MORE SPECIFIC FINDINGS AND RUMINATIONS ON THE IMPACT OF BENCHMARKS ON OREGON
GOVERNANCE The preceding section of this report provides the broad overview of the evolution, components and themes of the Oregon Benchmark system. Here, we want to explore some of the more specific evidence relevant to specific aspects of governance, planning and resource allocation, within government institutions and processes and in non-government settings.
The earlier reported comment by Governor Roberts, that the benchmarks are a “magnet for collaboration” is an important theme throughout what follows. In part what we report here is the extent to which this impact manifested itself in various segments of Oregon society. The Senior Levels of State Government The Governors Office The fact that the Governor is the chair of the Progress Board is, without a doubt, a critical linkage. Despite the relatively weak constitutional authority of the Governors office in Oregon, its profile, and its capacity to provide pro-active leadership, ensures that the OPB and the benchmarks are kept in game. Both the past and present executive director of the OCB emphasized that it is absolutely key to ensure that there is a constituency, in the government system, that values and uses the benchmarks. The Governors office plays a key role in this regard. Over time, the benchmarks have become drivers of policy, at least at the strategic level. The fact that the Governor was able to use the results emanating from the Benchmarks to engage Oregonians in reformulating State priority goals (Oregon Shines II), is in and of itself a poignant example of the impact of Benchmarks. It is also interesting to note that the executive director of the OPB is included on the 2nd tier of the Governor’s policy team, positioning that provides regular opportunities for interaction with, and access to the Governor, thus ensuring the Benchmark results are being considered at this level of decision making. The Cabinet and the Legislature

20
Interestingly, the executive director of the OCB has a seat at the cabinet table, albeit as a junior member. Nevertheless, the opportunity to interact and influence is there, and the use of benchmarks in policy planning and budgeting can be encouraged. With respect to the legislature, its elected members have always been considered a high priority for the time and energy of the executive directors. There is a constant need to maintain and re-build (as new people are elected) the constituency for the Benchmarks. With such a strong involvement of the OCB at all the senior levels of the State government, one would expect that the outcomes focus, so central to the benchmarks system, would be driving policy decisions and strong influencing the State legislative agenda. However, intense review of benchmark data by cabinet and legislative leadership as a key determinant in their decision-making is not yet the norm. However, progress is being made. For example, Senator Tims, Republican chair of the Ways and Means Committee and the Audit committee, as well as a long time skeptic with respect to the role and function of the OPB, publicly commended the OPB for the quality of their work with the Family and Children Services and a related Senate Bill aimed at securing more cooperative and coordinated planning and implementation measures to serve families and children. Impacts on Government Operations
Budgeting and Planning The Executive Director has had to be very creative to get the Benchmarks into the budgeting system. For example, despite the fact that the OPB has published what is known as the Blue Book, a listing of all the agencies associated with every Benchmark, neither legislators, planners nor budget officers have yet seemed to notice that there are seven separate agencies working on teen pregnancy, a fact that might lead one to think, especially with Republican majority, that someone might ask why. However, it appears that the linkage between Benchmarks and the planning and budgeting process is on the verge of becoming closely intertwined. The Governor has just released a directive that all agencies requiring State budgetary resources must define specific performance measures and indicate their linkage to the Oregon Benchmarks. Interestingly, Jeff Tryens believes that even two years ago, such a linkage would have not been workable. Even now it is going to be a huge challenge, one that the OPB will be assisting state agencies to meet. For example, in the fall of 2000, several trainings are scheduled to introduce a range of people across state agencies to Strategic Planning logic models that will move them away from planning and budgeting based on tracking inputs and activities to planning and budgeting based on defining outcomes and tracking results.

21
Linking Benchmarks and Performance Management Measures : The Example of the Oregon Department of Economic and Community Development
The OPB currently views a major component of its work to be assisting state agencies to design and implement performance planning and management systems that are linked to the overall Benchmark system. The two examples that have received such technical assistance thus far are the Department of Transport and the Department of Economic and Community Development. We report here on the latter effort. The Department, beginning in 1997, began re-examining its mandate, goals and practices. Spurred by legislative direction in 1997 and again in 1999, the department has gone from a primary focus on business recruitment from outside the state, a strategy Oregon was largely successful in over the last decade, to one of business retention and expansion, rural development and development within distressed communities. The new approaches are requiring a much larger reliance on partnerships, between the agency and counties and communities, between the agency and the private sector and with other agencies. The 1999 Legislature further directed in 1999 that the Oregon Economic and Community Development Commission evaluate methods of performance management and reporting of results to the legislature. Clearly, this would require thinking through the work of the agency and its partners even more deeply. The Commission appointed a broad group of community, business, staff and legislative leaders, supported by a technical team (including the Oregon Progress Board Executive Director) to build the system in 6 months. Ultimately 27 performance measures were adopted to track the full range of department and partner responsibilities were designed and recommendations were formulated as to the format, approach and frequency of reporting. The performance goals are integrated into the overall mission and work plan of the department. Four broad categories create the linkage points out of which specific performance goals and measures are defined; creating economic opportunity, building quality communities, managing for results and, special focus areas (the latter being linked to areas specifically targeted by policy makers and/or statute – assistance to rural and distressed communities, assistance to small business etc.) The 27 performance measures were designed (with major assistance from the OPB) to link with the OB in one of two ways. In some cases, the performance measure was designed as a piece of one of the Benchmarks, a sub-set if you will. The second method was to locate the performance measure as part of a logic link, a measure of something that moves towards the realization of a benchmark. For example, one of the Benchmarks is related to children’s readiness to learn as they approach their entry into school. An agency performance measure that moves towards the realization of such a benchmark would be an increase in the completion rate of children funded to be in pre-kindergarten programs.

22
This Department’s work to link agency performance measures to the Oregon Benchmarks is likely the most advanced of any in Oregon. With the recent decision of the legislature requiring all departments and agencies in receipt of State resources to design performance measures, and to indicate their linkage to the OBs, the work of the Oregon Economic and Community Development Commission represents an important model that will no doubt be emulated widely. The OPB is definitely positioning itself to provide the training and technical assistance that is necessary for development of agency performance standards that will be consistent with the overall Benchmarks framework Inter-Agency Cooperation : The Case of Community Solutions
What are the Community Solutions Teams?
The current Governor is very strong on pushing for inter-agency coordination and collaboration. The major manifestation of this is his current direction to get key infrastructure related agencies to work together in order to serve communities better and to shift agency focus from running programs to solving problems.
The five agencies are: the Department of Economic and Community Development, Department of Transport, Department of Environmental Quality, Department of Land Conservation and Development and the Department of Housing and Community Services.
Their mandate was legislated in 1998. Under the heading of Community Solutions Teams, the aim is to change the way state government works by partnering with local government :
• to improve the quality of life in Oregon’s towns and cities; • to craft locally appropriate solutions to complex community development
problems; and, • to use limited state resources efficiently and wisely.
As indicated in the graphic below, the setting of local priorities by municipal or county authorities is a central driver for mobilizing Community Solutions Teams.

23
Since 1998, nine regional community solutions teams have worked with local community leaders on more than 70 projects statewide. These include:
• Revitalizing the Coos Bay Waterfront • Bringing 450 high tech jobs to Milton-Freewater • Building 12 units of elderly housing in downtown Pendleton • Developing Interim Street Standards for the city of Redmond
This level of activity within two years indicates there is a constituency for this type of state-local partnership focused on addressing community priorities. However, the work of the Regional Community Solutions teams would appear to be the hub of a larger vision, referred to, in the development parlance of Oregon, as Regional Partnerships.
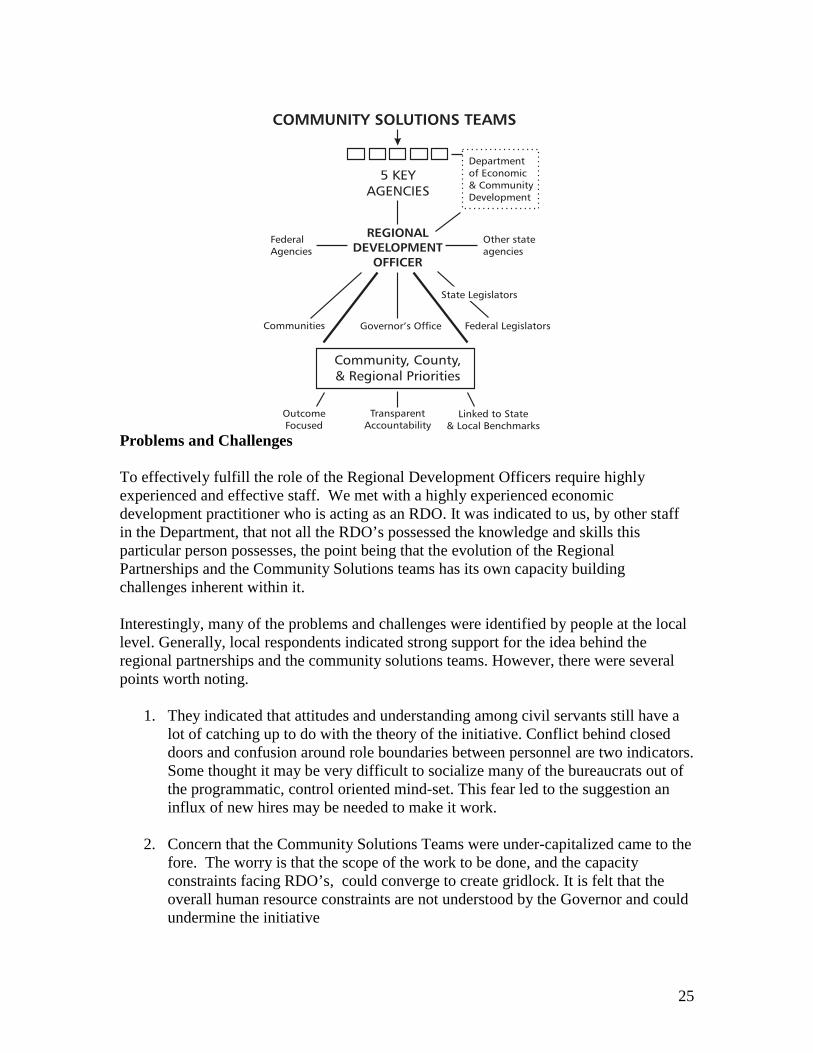
What are the Regional Partnerships? The Regional Partnerships are envisioned to bring a broader array of partners to the table. They are being organized, planned and established through the convening function located in the office of the Regional Development Officers ( housed in the Department of Economic and Community Development) of which there are 12 working in 5 regions of the state. Each region has within it several county jurisdictions (there are 35 counties). The five agencies, working at the regional level are, as indicated above, known as Regional Community Solutions Teams. Their role, in addition to specific community problem solving projects, is to support the establishment of regional partnerships to better integrate local, state, federal and private sector activities, set regional priorities and resolve community and regional issues. The aim is to give each region an opportunity to develop a pilot partnership model that they believe will be the most effective way for the region to address its problems and key issues.

24
The rationale for this significant partnership development effort is rooted in a belief that, through collaboration and coordination, the five core agencies of the Regional and Community Solutions Teams will be able to move away from a categorical approach to making regulatory decisions and funding projects to an integrated approach of problem solving and decision making. The other major feature of the overall approach that needs to be made explicit is that the philosophy that the vision, goals and priorities of regions and communities should drive the planning and investment process of state agencies. A basic principle of the approach is that local priorities and state or federal interests should be respected in the investment of state, local and federal funds. Although still not well developed in practice, the principles set to guide what will be a challenging evolution seem sound:
• Flexibility of state structures and processes to meet local needs • Use of partnerships in decision making • Demonstrated accountability • Efficiency of public investment and assistance for local priorities
What other Features of these Approaches are Important?
There are several components that have been historically in place, or, have been put in place by the Department of Economic and Community Development, that support the overall thrust of these initiatives. They are briefly identified to ensure the basic parameters of the operational supports are understood.
1. Once/year, there is a Needs and Issues Inventory of each county undertaken. It involves the State, County and Federal governments. The Regional Development officers play a key role in convening and coordinating this effort.
2. The Department of Economic and Community Development maintains a line item in its annual budget for community leadership development. They contract with a non-profit group call Rural Development Initiatives to undertake a range of training and technical assistance activities throughout the State.
3. The Regional Development Officer position is of central importance. It is not only a convening point for agencies and others involved in Community Solutions teams or regional partnerships. RDO’s have a role which is highly fluid, complex and multi-faceted. They move from the community and county level problem solving, to the challenge of facilitating the evolution of the Regional Partnership in their respective areas, to identifying and brokering resources needed to meet identified priorities, to high level liaison with the Governor’s office, State legislators and Federal Senators and agencies. In short, they are helping shape the “problem solving” machine as well as greasing its component parts. They are key to leveraging resources and managing process. They turn the intent of the legislation – being responsive to local priorities within a framework of mutual accountability for results - into concrete results. The graphic on the next page provides an effective way of depicting this very important function.
25
Problems and Challenges To effectively fulfill the role of the Regional Development Officers require highly experienced and effective staff. We met with a highly experienced economic development practitioner who is acting as an RDO. It was indicated to us, by other staff in the Department, that not all the RDO’s possessed the knowledge and skills this particular person possesses, the point being that the evolution of the Regional Partnerships and the Community Solutions teams has its own capacity building challenges inherent within it. Interestingly, many of the problems and challenges were identified by people at the local level. Generally, local respondents indicated strong support for the idea behind the regional partnerships and the community solutions teams. However, there were several points worth noting.
1. They indicated that attitudes and understanding among civil servants still have a lot of catching up to do with the theory of the initiative. Conflict behind closed doors and confusion around role boundaries between personnel are two indicators. Some thought it may be very difficult to socialize many of the bureaucrats out of the programmatic, control oriented mind-set. This fear led to the suggestion an influx of new hires may be needed to make it work.
2. Concern that the Community Solutions Teams were under-capitalized came to the
fore. The worry is that the scope of the work to be done, and the capacity constraints facing RDO’s, could converge to create gridlock. It is felt that the overall human resource constraints are not understood by the Governor and could undermine the initiative

26
3. There is concern that regulatory functions are proving difficult to relax and budgetary and decision making flexibility to channel resources to support community priorities appear not to have caught up with the intent of the Community Solutions Teams. There was advocacy of the need to do a very careful study of mandates, blocks to cooperation, including waiving of regulatory constraints in favor of outcome-based accountability.5
4. The regions of Oregon, made up of two or more counties, and the geographic
basis from which the Regional Partnerships are being evolved, are in some cases experiencing problems with inter-county collaboration. Egos and competitive attitudes towards life do not dissolve by fiat or design, or so it would seem.
5. A wrinkle derived from the legislation is that there are communities that have
pressing priorities but which lack the designation of being distressed, a necessary criterion for accessing community solutions team resources. In some instances, this is reportedly a source of conflict and resentment.
6. More generally, the Community Solutions teams are also coming up against the
lack of capacity and leadership in some communities. It is perceived that this will in turn create demands on the State for capacity building investments and expenditures of time, which if unfulfilled, will erode performance.
What Role have the Oregon Benchmarks Played in these Initiatives?
The Oregon Benchmarks have provided a backdrop and a beginning point for the participating agencies and the counties and communities they are serving. They provide an important base from which the role of the Regional Partnerships and communities can define and/or link their priorities. Equally important, the Benchmarks are already proving themselves as a real key to securing the cooperation of diverse interests and agencies. Some respondents noted that it would be hard for them to imagine how such an undertaking could be successful in the long term without the common reference point to outcomes being of utmost importance. The Benchmarks are the most cogent expression of the outcomes orientation. And while the stovepipes have not all been broken down in the life of Oregon’s public agencies, there is a palpable difference in the awareness, perspective and sophistication of understanding of the problems and the importance of outcomes as a driver towards evolving solutions than we (staff and associates of the Center for Community Enterprise) have experienced in our work within Canada. There is one speculative implication that occurs to us with respect to the role the Oregon Benchmarks framework may have played in the genesis of the Community Solutions Teams. As the reader will recall, Oregon Shines II, prompted by the dramatic data emanating from the Benchmarks, reformulated its top three goals. As suggested earlier, these goals, adopted in 1997, require a community based approach to development. Could it be that the real role of Benchmarks in this initiative was to create the
5 Some commentators suggested this challenge was destined to be an ongoing one, but, they asserted, progress will be made so long as achieving outcomes are the major priority.
27
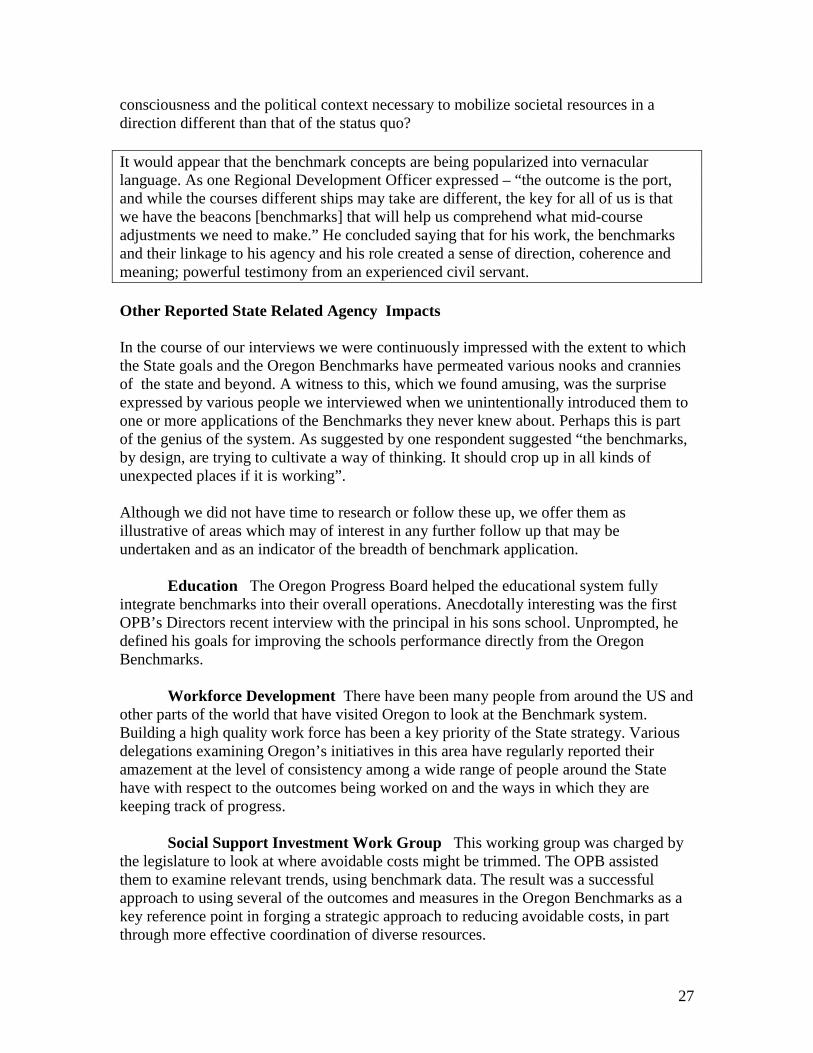
consciousness and the political context necessary to mobilize societal resources in a direction different than that of the status quo? It would appear that the benchmark concepts are being popularized into vernacular language. As one Regional Development Officer expressed – “the outcome is the port, and while the courses different ships may take are different, the key for all of us is that we have the beacons [benchmarks] that will help us comprehend what mid-course adjustments we need to make.” He concluded saying that for his work, the benchmarks and their linkage to his agency and his role created a sense of direction, coherence and meaning; powerful testimony from an experienced civil servant. Other Reported State Related Agency Impacts In the course of our interviews we were continuously impressed with the extent to which the State goals and the Oregon Benchmarks have permeated various nooks and crannies of the state and beyond. A witness to this, which we found amusing, was the surprise expressed by various people we interviewed when we unintentionally introduced them to one or more applications of the Benchmarks they never knew about. Perhaps this is part of the genius of the system. As suggested by one respondent suggested “the benchmarks, by design, are trying to cultivate a way of thinking. It should crop up in all kinds of unexpected places if it is working”. Although we did not have time to research or follow these up, we offer them as illustrative of areas which may of interest in any further follow up that may be undertaken and as an indicator of the breadth of benchmark application.
Education The Oregon Progress Board helped the educational system fully integrate benchmarks into their overall operations. Anecdotally interesting was the first OPB’s Directors recent interview with the principal in his sons school. Unprompted, he defined his goals for improving the schools performance directly from the Oregon Benchmarks. Workforce Development There have been many people from around the US and other parts of the world that have visited Oregon to look at the Benchmark system. Building a high quality work force has been a key priority of the State strategy. Various delegations examining Oregon’s initiatives in this area have regularly reported their amazement at the level of consistency among a wide range of people around the State have with respect to the outcomes being worked on and the ways in which they are keeping track of progress. Social Support Investment Work Group This working group was charged by the legislature to look at where avoidable costs might be trimmed. The OPB assisted them to examine relevant trends, using benchmark data. The result was a successful approach to using several of the outcomes and measures in the Oregon Benchmarks as a key reference point in forging a strategic approach to reducing avoidable costs, in part through more effective coordination of diverse resources.

28
The Department of Human Services and the State Police have both integrated Oregon benchmarks into their overall operations. Human Services have operationalized it at the sub-agency level. The Department of Forestry has just adopted sustainable development indicators, several of which are linked to the Oregon Benchmarks. The Department of Fisheries have been working very hard to apply Benchmarks as a framework for forging more effective inter-agency cooperation. Oregon Business The Oregon Business community has been actively engaged in the Benchmarks process since the first steps were taken to build the Oregon Shines strategic vision. Indeed, even before the vision was complete, business was a powerful voice in the Governors office pressing for the legislature to put in place a means of tracking progress. The Values and Beliefs Study completed in 1993 by the Oregon Business Council and the active participation of business in the Oregon Shines II Task Force reflects an extraordinary level of positive corporate citizenship. Today this leadership in the business community continues. The Oregon Business Council, under the banner of what it calls the Oregon Agenda (1998), has taken the three strategic goals in Oregon Shines II as the foundation for its public policy agenda. Working with other business associations and public policy leaders, it designed recommendations in the four major areas they felt could contribute the most to improving Oregon’s quality of life and economy – K-12 education; higher education, transportation and watershed health and salmon restoration. For each priority a Vision is set out and the specific benchmarks defined. Most, if not all of the Benchmarks are directly derived from or linked to specific benchmarks in the Oregon Progress Board bi-annual progress reports. 6 A rationale of why it is important is then provided followed by and what it will take to move this priority of the Oregon Agenda forward. Lastly, and very helpfully, they pose a series of contextually defined questions aimed at State Legislators to consider in the 2001 sitting of the State Congress. All in all, a powerful witness to the impact of the Oregon Benchmarks system. Local Level Impacts
Portland-Multnomah Progress Board
6 We have included the copies of the public material promoting the 4 priorities of the Oregon Agenda in Appendix #? (print copies only). It is a quite remarkable example of the penetration the Oregon Benchmarks have made into public discourse.

29
Inspired by the vision and emerging practice of the Oregon Progress Board, The Portland Multnomah Progress Board was formed in 1993. Mentored by the OPB, it is not surprising that there is a high degree of consistency what it does. It identifies, monitors, and reports on the Benchmarks the have linked to important community-wide goals. It identifies major trends in the community and acts as a catalyst for government, business, and community groups to improve their progress towards agreed upon goals and outcomes. The board has adopted roughly 50% of the Oregon Progress Board (OPB) existing Benchmarks and has developed the rest themselves through various types of public input, surveys, (including a very well received survey of children related to improving educational success) and data from Federal sources such as the Census Bureau. The board has worked very closely with the OPB in tracking and developing its system. Since inception, the Board has developed its benchmark system to 76 benchmarks. These are in the areas of Families, Education, Urban Vitality, Health, Environment, Governance, Economy, Safety, Participation and Special Needs. These community issues are monitored through the PMPB benchmarks and reported on a biennial basis. Detailed studies are also done in the areas of high priority, like families, education, health and the environment. These studies culminate in reports, which feed information back to relevant agencies to develop better benchmarks and goals. Children’s Readiness to Learn, Educational Success for Youth and Salmon Restoration in an Urban Watershed are all reports, which have helped to promote outcomes in their related areas. The board works closely with City Bureaus to adopt performance and outcomes policy/management goals. The annual Auditor’s Report graphically depicts “City Government Performance” in the context of established benchmarks and goals. The stated intentions are to improve the public accountability of City Government, assist council, management, and citizens make better decisions and help improve the delivery of public services. What has it taken to make this work? First, top-level leadership is critical. Second, the system has to be understood as being valuable and meaningful to the community and officials. Third, have a source of technical assistance and support from the OPB has been very useful.
United Way of Columbia-Willamette The United Way of Columbia-Willamette (UWCW) has come to the benchmarking performance measurement system via two influences. First, the national United Way has been re-assessing policies and priorities, in part motivated by an increasing number of inquiries from financial supporters wanting to know the results of their investment in the United Way. The national organization has led a strategic planning shift towards accountability based on results. Second, because Oregon is in the middle of a hugely significant process of experimenting with how systems change can be encouraged

30
through a Benchmarking approach, the Portland office was in an optimal position to structure a pilot program based on achieving measurable outcomes. The result is a pilot focused on children, named “Success by Six”; the overall goal is to co-ordinate partnerships, strategies and resources towards optimal results. This pilot is directly linked to the benchmarks related to school readiness; “percent of children entering kindergarten who are judged to be ready to learn”. The desired outcomes, developed by the committees in this program, all relate to the well being of children and support of families. Collaborative partnerships with approximately 15 agencies, including four counties have been formed. The established committees coordinate the resources available, develop plans and manage operations. In the three years since Success by Six hit the drawing board, progress towards achieving several specific outcomes is reported as evident. The United Way (UWCW) has adopted roughly 50% of its benchmarks straight from the Oregon Progress Board and has developed the rest with support from the OPB. Adoption of the Oregon benchmarks is seen as having helped improved communication and facilitate partnership formation. Equally important, the benchmark approach has enabled verifiable results to be clearly defined and linked directly to key goals. Lastly, benchmarks foster better comparative analysis of the widely varying programs and operational sites the United Way partners with. Over the next four years, the UWCW is radically shifting the way it funds. The traditional core funding approach will be reduced from 100% to 50% of its funding stream. The balance will go into what is being called Focused Funding. Core Funding has traditionally had criteria of efficiency, effectiveness and community needs. Future Core Funding will have the same criteria, but will have to align with the UWCW Vision Council defined Benchmarks. The Focused Funding is results oriented and aims to “create focused, coordinated action, increase fiscal resources, and facilitate innovative, responsive solutions to improve community conditions.” This funding will originate from assessment of community conditions and trends and through the Vision Councils. There are four Vision Councils - Self Sufficiency, School success, Civic Engagement, and Health and Safety. There is one more priority area known as Neighbourhood Venture Capital but it does not have its own Vision Council. Focus Funding will be managed to encourage cooperation between agencies by partnering up on proposed activities. The UWCW is still in the development and implementation stage of its re-organization but reflects cautious confidence of success will be forthcoming.
Tillamook County Tillamook County is the subject of more detailed description and analysis in Appendix One. It is a multi-faceted example of how the Benchmarks framework has become a way

31
of thinking about, and planning, mobilizing and managing, a wide range of issues and resources in a small, rural, economically distressed coastal region. The case, with its Performance Partnership, Community Futures Council and its activist Economic Development Council represents a state of the art planning and partnership framework at the county level and is a fine example of how the various pieces – visioning, goal setting, strategy formulation and definition of performance measures – all of which are linked to the state benchmarks, might be handled in other parts of the State. A Final Comment on Leadership Impacts As we moved from interview to interview we were somewhat stunned by the quality of the leadership we encountered – clarity, commitment, far-sightedness, analytical capacity – the list of qualities go on. Later in our process we began to structure questions designed to assist our exploration of this phenomena, which is perhaps a misnomer give the small sample of people interviewed. We found a completely consistent view in those we queried, one that corresponded with our budding hypothesis – the system, that is, the way of thinking, the priorities, the measuring of progress against outcomes etc etc. – is creating avenues that are encouraging progressive, entrepreneurial, community conscious leadership to come forward. In short, the “cream is rising to the top”. Moreover, the broadening and deepening of shared understanding, a critical ingredient in informing and influencing public policy choices and actions, is fostering new leadership. One local leader asserted that the benchmarks approach is conditioning the way people think. “Time is important” she said. “Internalizing a different way of thinking and doing things can only be accomplished over time”. What was exciting, in this persons view, was that a new basis for hope was emerging that people could act collectively and cooperatively. Hope is a pre-requisite for trans-formative leadership. More generally, there is abundant evidence of increased understanding of what strategies work in what conditions. We would suggest that the benchmarks create a focused framework for ongoing learning that is public, transparent and relevant to a wide range of actors at different levels of the society. Preliminary Conclusions The combination of Oregon Shines and the Oregon Benchmarks has created a framework, which appears to have successfully inculcated a widely accepted orientation to outcomes being central to governance and effective stewardship of limited resources. It is fair to say that it has become a framework for learning and capacity building, not only for state institutions, but also for an increasing broad and diverse array of local government (county and municipal) and non-government organizations across the state. Based on our interviews, we surmise that most observers and participants in the process

32
would say that while real progress has been made in the first decade, the second decade is where the benefits to the society as a whole has the most potential for being realized. Moving from program-focused activity in state agencies to issue and locality based problem solving is in the early stages of development. The Regional Partnerships and Community Solutions Teams are too early in their development to judge their ultimate effectiveness. However, there is already some evidence that there is shift in the mentality of some of the agency participants: there is movement from presenting to communities what programs the agencies have and what communities have to do the secure resources to an attitude which begins with asking what can be done to help address priority problems and issue, what resources are needed, and how government might convene the people and resources necessary to get on with the job. Can the ideas, institutions, practices and lessons outlined thus far in this report be, in some way, be appropriated or adapted into the B.C. context? We begin to examine this challenge in what follows.

33
THE BRITISH COLUMBIA CONTEXT : A BRIEF REVIEW OF KEY INITIATIVES
This section presents a summary of several major documents related to initiatives that are, in one way or another, concerned with the social, economic and ecological health of B.C. and its citizens. Following each summary we then provide a somewhat cryptic, but hopefully useful reflection that contrasts the particular initiative with what we have learned about the Oregon experience. The objective is to provide a partial snapshot of the B.C. institutional landscape, especially as it relates to the public policy concern around sustainability issues, and more specifically, the concern with how to translate public intent, reflected in policy, into concrete results that actually improve the quality of life in British Columbia. The initiatives reviewed are:
1. The 1996 B.C. Growth Strategy Legislation 2. The Fraser Basin Board Report Card 3. The Georgia Basin Project 4. The 1994 Sustainability Report 5. The 1997 Report on B.C.’s Progress Towards Sustainability 6. The 1998 Provincial Health Goals, Targets and Measures 7. The July 2000 Discussion Paper : “Toward Revitalized, Resilient and Sustainable
Communities Across British Columbia”
(1) B.C. Growth Strategy Legislation The 1996 Growth Strategy Amendment Act, followed by the Part 25 of the Municipal Act, provide a legislative framework for the encouragement of collaborative population growth planning at the regional level. The primary actors are identified as municipalities and regional districts, in a coequal authority jurisdictional relationship, "with participation from provincial and federal agencies, first nations, and the public to address regional issues related to population growth". Three regional districts (Greater Vancouver, Nanaimo and Thompson/Nicola) have strategic growth plans in place.
Observations from an Oregon experience perspective The Oregon model's emphasis on inter-agency partnering, in particular that found in the Community Solutions legislation, is clearly replicated in the BC legislation which sets out a mandate that facilitates partnering between local and regional development authorities. In Oregon, the emphasis is on State-local collaboration while in B.C. the emphasis is on regional district-municipal cooperation. However, the B.C. legislation does encourage participation from the more senior governmental agencies. A major difference is that the Oregon case is set in a the larger strategic planning framework and implementation strategy represented in Oregon Shines and the related
34
benchmarks. People interviewed in Oregon consistently stated that the broader benchmark framework was very important as were the more holistic system change goals that had evolved from them. In the Oregon context, specific problem solving strategies such as regional population growth planning, would be articulated in this larger context. It is likely that local and county level governments would have more facile access to senior levels of government given the intention of the Community Solutions teams and the broad access to government decision makers the Regional Development officers enjoy. Systematic legislative evolution is important to clearing out the accumulation of often overlapping and contradictory regulatory and program delivery impediments that so persistently characterize “stove pipe” bureaucratic practices. However, the Oregon experience also reveals that legislation alone is insufficient to catalyze the institutional transformations required to inspire sustained inter-agency cooperation to achieve outcomes and measure performance. Without the Oregon Progress Board position as the “caretaker” of the strategic vision it is doubtful it could succeed.
(2) Fraser Basin Board Report Card The "report card" seeks to evaluate the current ecological state of the Fraser Basin. The authors do not attempt to find or develop relevant indicators. "The process of assigning grades was clearly a subjective exercise. A more rigorous and sophisticated process can only be employed once sustainability indicators and benchmarks are developed and data is being collected in a systematic way." (P. 3) The report card utilizes school-type letter grades, A to F, to indicate the state of ecological health in a number of categories such as: forest and wetlands preservation, suburban sprawl, ribbon development, waste management, etc., etc. After each item there is a "Next Step" summary in which almost all the recommendations begin with identifying the agency the authors believe should be addressing that category's ecological deficits. The following are oft-repeated examples: "Provincial government to implement ...., The GVRD and member municipalities to adopt..., The Fraser Basin Management Program's Steering Committee to review..." The Report concludes by claiming, "A great deal of progress has been achieved in setting up processes that will bring us closer to sustainability." Further "progress" is promised through the Board's sponsoring of more "regional workshops and a State of the Basin Conference... to keep attention focused on the elusive goal of sustainability."
Observations from an Oregon experience perspective The report identifies the need for Bench Marks and Indicators, but does not recommend ways and means of establishing them. It does not identify concrete action targets or performance measures. It assigns remedial responsibility to individual agencies rather

35
than developing inter-agency partnering strategies. Lastly, there is no identification of the need for a more holistic strategic approach.
(3) The Georgia Basin Project (Note: There is no Report as such. The review is based on the documentation available on web site, www.pyr.ec.gc.ca/GeorgiaBasin/gbi_eIndex.htm) This is a joint Environment Canada - BC Ministry of the Environment initiative dedicated to achieving specifically identified results over a five year sunrise, sunset period. These specified targets are in the areas of air and water quality, climate change adaptations, habitat conservation and community based environmental initiatives that are couched specifically in "sustainable community" terms. They are to be achieved through promoting interdisciplinary and inter-agency "action plans" which may include specific community partnerships.
Observations from an Oregon experience perspective Overall, this short term, experimental project's conceptual framework reflects many of the Oregon model's principles. However, it has not focused on outcome-oriented benchmarks as a way of achieving them, nor any progress evaluation measures. While the documentation, especially in the "Sustainable Communities" area, makes much of "partnering" and "cooperation" concepts being essential to the overall sustainability goal, there are few suggestions on how these goals might be institutionalized. As a consequence, the Project appears to be much less concerned with developing holistic, change oriented planning and implementation tools, than providing some incentive for others to engage in more narrowly defined, incremental projects, by distributing soft grant money to organizations that have an interest in environmental sustainability.
(4) B.C. State of Sustainability Report - 1994 Produced by the BC Round Table on the Environment and the Economy.
This 142-page document focuses on "Urban sustainability and containment". The Report articulates the following "Approach and Methodology" employed in developing their prescriptions and recommendations:
• identifying indicators that can be used to assess urban sustainability
• selecting five sample cities to report on urban conditions (Cranbrook, Greater Vancouver, Greater Victoria, Kelowna & Prince George)
• collecting and reporting verifiable information [based] on the indicators
• analyzing the sustainability implications of the indicators
• discussing specific urban sustainability issues
36
• presenting recommendations or action by government and citizens.
A "report card" is used to encapsulate the state of the BC urban environments in which a three point evaluation scale (good, fair, poor) is employed to compare both the quality of the indicator data used, and the condition of the particular subject area under review. A positive or negative trend statement then follows as an indication of recent improvement or declines in sustainability with respect to each indicator. Fourteen sustainability topics are listed under 5 "theme" headings:
1. Settlement & Population Patterns • Population Growth • Urban Sprawl • Mobility
2. Urban Environment • Natural Habitats • Resource Use
3. Urban Economy • Vibrancy • Equity • Diversity • Cost of growth
4. Social Well-being • Health & Safety • Education
5. Governance & Citizenship • Process • Participation & Citizenship
Although each topic evaluation is based upon existing data source indicators, it is not made clear how these data were arrayed and combined into "bench marks" in order to achieve the composite three point scale "grades". However each of these indicators is discussed in the extensive descriptive sections that make up the main body of the Report. The concluding section identifies the following areas as critical focal points for ongoing monitoring and remedial action:
• Coping with population growth while maintaining environmental quality • Planning for "densification" if the high cost of "retro-fitting" is to be
avoided • City's economic, social and environmental conditions should be improved
by addressing the key topics in this report: housing, mobility, protection of natural features, creation of distinct neighborhoods, dealing with root

37
causes of crime and other social ills, and examining all the impacts and costs of development options.
• Decision making processes need to be open to the public • The inclusion of under-represented groups in the planning process
Observations from an Oregon experience perspective Beyond the appropriation of established indicators, which are then linked to essentially already well defined and widely recognized urban problems, there are no specifically targeted outcome "benchmarks". This seems to leave the Reports advocacy of an ongoing performance measurement system of ecological, social, and political "monitoring" somewhat sterile when contrasted with Oregon. The only action recommendation is summed up in the summary's somewhat rhetorical concluding sentence: "These goals can only be achieved through a concerted effort by every level of government and all British Columbians." Obviously, any counterpart to the Oregon Progress Board role and function was not even contemplated, or if it was, it never made it to the printed page.
(5) Report on British Columbia's Progress Toward Sustainability:1997
This 201 page commissioned report prepared by consultants Tony Hodge and Robert Prescott-Allen, takes a very different approach to that of the 1994 Round Table Report. First, it approaches the sustainability issue in a much more comprehensive way. The Report also reviews a full range of ways and means of assessing and reporting progress on sustainability issues, including "human well-being". Indicator sources are identified in the areas of:
Health Income and earnings Poverty and debt Paid work Crime and security Education and skills
The Report also provides detailed consideration of a variety ways and means of assessing:
Community strength and resiliency Diversity and strength in businesses and organizations Effectiveness of government
Comprehensive ways of measuring "Ecosystem well-being" are also suggested for:
Land Air Water Biodiversity Community Resource Use
The Report includes two additional sections, somewhat enigmatically from our current interest perspective, as appendices. These are entitled, "A template for assessing progress
38
toward sustainability" and "Recombining indicators to give a picture of the whole system."
Observations from an Oregon experience perspective As an outline of the problems, issues, data sources and measurement theory and practice, the Report is a laudably comprehensive guide. However, as the positioning in appendices of the holistic assessment template, and what amounts to a benchmark approach to developing indicators, the Report does not anticipate, nor does it offer, much in the way of an action prescription. It might be surmised that the reason is expressed in the concluding paragraph of the Report's Executive Summary. Here se find a short but cogent assessment of the Province's current capacity to engage in Oregon style system level sustainability monitoring: "Individual aspects of the condition of people and the ecosystem in BC are monitored and reported on separately and incompletely. This sharply sectoralized approach results in omissions and duplication. It makes it extremely difficult to view the whole system, assess accountability in terms of results, or promote human well-being and ecosystem well being together. It prevents both government and the public from seeing where we are going." (p. xi) None of the other B.C. reports even hinted at this crucial gap. Oregon had a strategic vision and plan. B.C. does not. Put another way, if we have no vision of where we are going or what we want achieve, spending a lot of time measuring progress seems like an oxymoron.
(6) Provincial Health Goals, Targets and Measures The Provincial Health Office(r) was created in 1994, with the mandate to develop public health goals, through public consultation, and then design a system of targets and performance measures through which these goals could be successfully pursued. Six public health goals were distilled from various sources of public input. 1. Positive and supportive living and working conditions in all our communities. 2. Opportunities for all individuals to develop and maintain the capacities and skills needed to thrive and meet life's challenges and to make choices that enhance health. 3. A diverse and sustainable physical environment with clean, healthy and safe air, water and land. 4. An effective and efficient health service system that provides equitable access to appropriate services. 5. Improved health for Aboriginal peoples.

39
6. Reduction of preventable illness, injuries, disabilities and premature deaths. The PHO has sought to influence the various diverse elements within BC's now decentralized Health System, as well as other public and private sector agencies, to integrate these goals into their own organizational
• objectives and planning • as a guide to funding decisions • to measure and report on progress • use the annual report's "tables" as a working guide
The annual Report's "tables" use the following medical standard health data statistics as "indicators" relevant to the stated goals:
• Life expectancy at birth • Disability-free life expectancy • Low birth weight rate • Infant mortality rate • Age standardized mortality rate • Potential years of life lost rate • Self-related health status • Canada's world ranking in the Human Development index (composite health,
education and income) A "working guide" is also provided which tabulates additional non-medical statistical sources as examples of "sub-indictors" to the above cores standard health indicators. These include standard quality of life data sets such as income, education, demographic, etc. All of this is advanced as potentially useful in measuring progress toward the six general goals.
Observations from an Oregon experience perspective PHO's emphasis on linking strategic planning targets and progress measures to six health goals is consistent with the Oregon Bench Marks linking specified targets and performance measure indicators to broader planning goals. However, at best, these goals relate to a more limited systemic universe, that of the health system. Even so, the goal statements appear to be somewhat rhetorical in that they border on universal motherhood statements rather than aiming at some clearly identified change in direction or process within that system. It is also somewhat difficult to understand how the standard health statistical data, that is to provide the indicator base for measuring progress, is to be utilized in determining if the health system is to achieve these goals. In other words there is little in the way of strategic targeting and implementation measuring potential to be found within either the goal identification or the "work guide"template.

40
This weakness is clearly apparent in the work guide template itself. In addition to providing a table which cross references the health goal "objective" with a range of possibly relevant "indicators", this table also includes two additional columns headed, "targets" and "strategy". However, both of these are left blank. Thus a potential user is provided with a very generalized set of lofty but otherwise not easily approached objectives, a range of not very clearly linked possible indicators, and no hint as to the system change (if any) targets or any approved strategy for achieving them. Nor is there any discussion about how the inter-agency partnering that is recommended might be achieved within a system that requires a very high degree of authorization before deviating from established norms.
(7) Toward Revitalized, Resilient and Sustainable Communities Across British Columbia
This is a MCDCV discussion paper on the development of a policy and legislative framework for regional and community development. The discussion paper argues strongly that "Real community empowerment will mean a sustainable change in the way communities and governments conduct their respective business and how they relate to each other". Partnering is seen as a key to enabling this system-level change. Rural and costal communities in crises due to the major disinvestment in their predominantly single industry economies are identified as a prime target for remedial action. However, the intervention framework also recognizes the importance of being "pro-active in preparing for economic change" in communities that may become vulnerable to negative economic impacts in the future. And rare, but most welcome (from a CED practitioner perspective), is the recognition that there is a significant variation between communities with respect to their resilience "capacity to stimulate and manage change" and hence the need for a diversity of remedial action support options in developing a legislative framework with the following Objectives:
• support already resilient communities in managing and directing long term social and economic change
• create a fair, transparent, equitable and consistent mechanism for government to
engage in community redevelopment partnerships
• move decision-making power in the areas of quality of life closer to local perceptions of need
• encourage the transfer to local responsibility the managing of natural resource
tenures for sustainable benefits, as and when communities are ready.
• complement the Municipal Act and Municipal Act Reform initiative by providing opportunities and tools for economic, environmental and social planning at the local level

41
• complement and enhance current federal community development support initiatives such as the Community Futures Development Corporations and
• Strengthen the ability of a range of BC governmental ministries to work as a team
in responding to community needs A number of currently operational CED models are identified as are well-established CED support tools such as Community Adjustment and Development Agreements, Community Development Corporations and a range of Community Investment Instruments.
Observations from an Oregon experience perspective As with all "discussion papers", the purpose is to stimulate thinking and measure the degree of support from various stakeholder constituencies for proposals being contemplated. When such papers originate from a government ministry, it is important to neither raise expectations beyond that ministries existing mandate, nor to advocate for the kinds of systemic changes that would require political sponsorship. Given these restraints, it would be both unfair and unrealistic to compare this document to either of the "Oregon Shines I or II documents as a major system level change catalyst. This notwithstanding, the document does incorporate many of the Oregon experiment's conceptual premises as well as some of its practical approaches. However, its inferential listing of such long-standing and typically fragmented or fractured mechanisms as "adjustment agreements" and the current range of "investment instruments", does little to stimulate interest in more holistic solution strategies. By the same token, few of the suggested means or examples highlight the importance of outcomes as a defining vehicle for partnership development or benchmarks as a means of measuring progress. As noted, to have done so, may have tread beyond the Ministries internal initiative limitations that characterize the established governmental system model. Nevertheless, the broader perspective and experience of the Oregon experiment, which is now firmly institutionalized, may still serve the Ministry in framing those initiatives it has the authority to recommend. It also may be possible that the Ministry can play an important role in encouraging a wider understanding of the need for more a more integrated and holistic planning and implementation model at the provincial level, as well as within regions and individual communities. Preliminary Report on Impacts of B.C. Initiatives at the Local Level The terms of reference called for a preliminary test to determine the awareness of these various initiatives in three communities, Revelstoke, Nanaimo and Smithers. We added one additional community, Hazelton based on a referral from the Smithers informant. To the extent there was awareness, we then probed to determine if there were any discernible impacts in the view of the respondents. This was certainly not a scientific survey. Rather, it should be viewed as no more than a rough indicator of penetration. Nevertheless, given

42
the key positions occupied by informants, neither should the preliminary nature of these results be discounted. Revelstoke The primary respondent was Doug Weir. Mr. Weir has been involved with economic development in Revelstoke for 15 years. He is presently the Economic Development Commissioner. He has been instrumental in establishing several initiatives related to economic and social development in the area, for example, the Community Futures Development corporation, the Revelstoke CED strategy and the Revelstoke Forest Corporation. In this latter capacity, as well as more generally, he has taken a keen interest in issues related to sustainable development. He has also been extensively involved with the Columbia Basin Trust. Mr. Weir was directly aware of the sustainability reports (94 and 97) and generally aware of the other documents. However, none of them have been, to his knowledge, in any way applied, used or generally referred to in the Revelstoke area. The exception is the Ministry’s discussion paper, which several people made submissions to during a public forum and which he, on behalf of the Commission, made a written submission. Smithers The primary respondent was Mr. Ivan Thompson. Ivan has been the Director of the Smithers campus of NW Community College. He continues to associate with the college as development consultant in emerging areas important to the regional economy. This includes a special interest in sustainable development which he carries into his involvement on the boards of the Nadina CDFC and the NW Institute for Bioregional Research. Mr. Thompson has also consulted in CED and taken on a variety of facilitating roles throughout the region. He was also the moderator for the first Premiers Summit on the Economy in Prince George. Mr. Thompson has heard of the seven initiatives listed. However, despite his status as a professional and an active volunteer with interests in economic and environmental issues throughout the NW region, he has not experienced nor observed any direct guidance or impacts flowing from any of the initiatives. Hazelton
Doug Donaldson, Upper Skeena Development Center Mr. Doug Donaldson works with a cross-section of community representatives through the Upper Skeena Development Center. An important component of their work at present is a pilot project called “Learning Communities” an initiative co-sponsored by the MCDCV and HRDC. Mr. Donaldson spoke of the value of the relationship established between MCDCV and the community. He finds the ministry’s efforts to address community needs in meaningful ways (from a local perspective) very fresh. Mr.

43
Donaldson characterized the situation as one where the MCDCV is championing his community because of the consistency between community goals and the Ministry mandate. This Learning Communities project has benefited from a previous assessment and planning exercise sponsored by FRBC. It was a multi-stakeholder planning process involving the Federal Government, the Province, the village of Hazelton and the Gitxsan First Nations People. Mr. Donaldson believes this process and the final report produced have been valuable and productive. When the seven BC initiatives were listed, only the MCDCV discussion paper was acknowledged as having any real relevance to the community. Nanaimo Contacts in Nanaimo included the Economic Development Officer for the city, the city manager, the city clerk, the director of the strategic planning department and the Regional District manager. Most of these contacts merely referred us to another person. The substantive conversations involved the economic development officer and the regional manager. The economic development office was not familiar with any of the reports. A review of the Nanaimo economic development strategy, which Tanya sent us, reveals no linkages to any of the reports. In contrast, the Regional District manager, Mr. Kelly Daniels, was aware of the Fraser Basin and Georgia Basin initiatives and very aware of the regional growth legislation. No impacts were identified with respect to the Fraser initiative. The Georgia Basin benefit identified was the potential project dollars available for storm water management planning, suggesting that the broader features of this initiative may not be seen as having much local impact. However, the regional growth legislation appears to have had more significant impacts. First, it has resulted in every community plan being modified to comply with it. Second, it has encouraged greater cooperation between various levels of government, partly through the process of creating the plan (which started before the legislation was enacted) and the fact that it has become the "highest level document used most consistently for planning purposes". While it is still felt that co-operation could be better, it has improved, and the legislation is given credit for promoting it. Interestingly, the regional district is just beginning to look at benchmarks through a monitoring committee made up of representatives from all governments and each community within the regional district.

44
BRINGING OREGON HOME? ISSUES, CHALLENGES AND RECOMMENDATIONS
Need introduction A Note on the Challenge of Transporting Concepts Any realistic attempt to import system concepts across cultural borders is likely to fail unless account is taken of the differences in institutional ecology that exist between the two venues. Although the United States and Canada share many basic institutional arrangements, their political cultures are unquestionably different. Canada's inherited British parliamentary model, with its winner-take-all concentration of power in the Prime Ministry has its advantages and its disadvantages. It perhaps better avoid the "gridlock" dangers of the American "checks and balances" divided executive/legislative system. However, it also seems to assure a relatively high level of partisan polarization throughout the post-election legislative term. However, while "gridlock" standoffs do occasionally occur in the American system, their costs, political and otherwise, are sufficiently high to create a much greater pressure on political decision makers to broker bipartisan compromises. In the American system this cross-party deal making is an important feature of the process by which the passage of important legislation is achieved, whereas in the parliamentary system, outside of minority governments, cabinet government and party discipline assure passage (and to hell with the loyal opposition). The American system, while highly partisan in the election cycle, is less so when the real business of governing is going on, with the consequence that subsequent electoral change may lead to less dramatic reversals in established policies than we find in some Canadian jurisdictions. The Oregon bench mark initiative began as a very political initiative of a Governor facing tremendous challenges within a deep recession. In Oregon, as is common in most other western States, the office of the Governor does not have jurisdiction over all public agencies. There are many agencies that do not report to the Governor at all; rather, they are governed through independent oversight. Therefore, having a means to exercise influence rather than authority has always been an important issue from the vantage point of the Governors office. This is especially the case if the other party holds a majority in the legislature, as has been the case in Oregon since 1989. As a consequence, the Democratic Governor has had to ensure the building of a wide base of support, not only among some Republican house members, but also with several NGOs, and notably the Oregon Business Council. Thus, once in motion, the initiative, which began as the brainchild of a partisan politician, was able to continue to evolve over the next three administrations, all of which had Governors from the party that was in a minority in the legislature. It is extremely doubtful if this kind of ongoing pragmatic bipartisan support could be achieved for any such partisan political initiative in the British Columbia. This suggests

45
that the initiative should come from other than narrowly political players. Nor is that an unlikely possibility. Certainly many of the concepts that have informed the now operational realities of Oregon Benchmarks are in widespread currency here in B.C. There is also some evidence to support the hope that the small "p" political culture in B.C. is beginning to soften its long tradition of hard line, no compromise position taking in favor of a more co-operative approach in seeking to solve otherwise intractable problems. Analysis and Commentary related to Key Ministry Questions
1. How does the legislation in Oregon and the role of the Oregon Progress
Board compare to the legislation being contemplated by MCDCV? The Legislation creating the Oregon Progress Board mandate and functions is very different in scope and focus than that contemplated by the Ministry of Community Development, Cooperatives and Volunteers. There are few areas of meaningful convergence, except perhaps at the philosophical level.
Mandate and Scope Oregon The Oregon Benchmarks and the Progress Board flow from a mandate that is state wide and focused on tracking progress to realizing the goals of a comprehensive vision and strategy. The Oregon Progress Board is the steward of a 20-year vision and strategic plan that has been created for the state as a whole. Its mission is to develop “a strategy that addresses the economic, social, cultural, environmental and other needs and aspirations of the people of Oregon.” Its major role is to track progress towards achieving the goals set out in the periodically revised strategy known as Oregon Shines. A major means by which it undertakes to achieve this mandate is through measuring results by means of 92 benchmarks (indicators) directly linked to the strategy. It also assists state agencies and other organizations to link their planning, budgeting and performance measures to the Oregon Benchmarks. B.C. The proposed legislative and policy framework being contemplated by the Ministry is focused on creating a supporting structure upon which a solid platform for integrated programs and services. The goal is to “help communities across the province to diversify their economies, stimulate community and environmental investment, create new jobs and support social change.” To do this the Ministry has advanced the idea of a ‘single window’ within communities to access the full range of government programs and services relating to community development. This is evidence of a desire to overcome the fragmented and isolated criteria of government mandates and programs. A more holistic and integrated approach is being sought. However, in contrast to the Oregon Progress Board and the Benchmarks, the B.C. framework is not flowing from an overall strategy.

46
Source of Leadership and Positioning Oregon Shines and the legislation creating the Progress Board flowed from a high level of pro-active political leadership by the Governor.. In BC the Legislation and Policy Framework is lodged in a new Ministry necessarily focused on building its agenda as well as putting in place its systems to deliver the initial array of programs. Legislative agendas coming from the Ministry will need to be sold to the Cabinet as a priority for the legislative agenda. This difference in positioning is of major importance. Given the analysis of the benefits and the challenges of implementing the Oregon Benchmarks, it is clear that how any such initiative is politically positioned at the outset will influence how well it succeeds. The strategy most likely to succeed in BC, then, would include developing the bi-partisan support required to set the foundation deep enough to endure. A high level of leadership in a variety of constituencies will need to be aligned behind the Benchmark initiative if it is to succeed. As noted, there are aspects of the Parliamentary system that may be disadvantageous, making it all the more necessary to gain high level support from a variety of political and apolitical interest groups.
2. What are the advantages and disadvantages of possibly integrating the intent of benchmarks into Ministry sponsored legislation?
Advantages Disadvantages The Ministry is primed to push a legislative agenda that is at least interested in and sensitive to kind of thinking reflected in the Oregon Benchmark System The general areas of concern – social, economic, environment and cultural – coupled with the conscious interest in an applied approach and the fact it is not very powerful in the provincial system, may position it to be a key broker, promoter and activist in elevating the interest in Benchmarks at the Cabinet Level by including the intent in it’s legislative agenda aimed at cabinet in October. The local use of benchmarks may be able to be encouraged by the legislation, which could increase the quality of planning at the local and sub-regional level.
B.C. does not have a long term vision or strategy, a fundamental building block that drove the legislation in Oregon and the subsequent institutionalization of the Benchmark system to it’s current point of development The Ministry may not be that well positioned to be the sponsor of legislation that is, in this case, seems much broader than its mandate The legislative timetable of the Ministry (assuming introduction in February) is probably too quick to be calibrated with the required developmental work, particularly the building of a non-partisan, diverse sponsorship base for the legislative initiative.

47
3. How does the Oregon legislation, the role of the Progress Board, the
reporting formats and audiences, the use of benchmarks as a tool for governance at the legislative and administrative levels, including planning, budgeting and interagency cooperation, compare to the various tools and approaches being currently used in B.C.
The Oregon Benchmark system flows from a statewide vision and strategy. Coupled with the positioning of the Benchmarks in the overall government apparatus (Governors office, Cabinet, Legislature and increasingly agencies) and the upcoming effort to integrate performance measures in all state agencies with a strong encouragement that they be linked to the Oregon Benchmarks, the components of the Oregon Benchmark system, while still vulnerable in some areas, is well on its way to being institutionalized. In B.C. none of the reviewed approach and tools currently being used are linked to a vision of where we are going in B.C. or strategies as to how we are going to get there. This is a key weakness. As a result, by and large, except in the case of the regional growth legislation, the initiatives are unattached to planning and decision making processes. In addition, their profile in the larger community is minimal. In short, they do not have the strategic integration and thus the position within B.C. society or governance to influence significant public or private decisions.
4. What are the options and possible strategies that could be undertaking in B.C. to build the strengths of the Oregon Benchmarks into B.C. given our political, institutional and governance context?
As indicated earlier, it is our judgment that to successfully introduce the Oregon Benchmarks system into B.C. must be premised on a broad range of interests and political perspectives being prepared to advocate it. The steps below are the first steps in a strategy for building support for similar legislation in the B.C. context.
• Prepare the ground The steps anticipated as Phase 2 and 3 of this action
research initiative should be taken. A series of workshops designed and organized to engage a broad range of leaders representing a range of perspectives and different constituencies needs to be undertaken. Second, key leaders need to be recruited to participate in a well-designed work-study tour. Key criteria for selection would be their capacity (ability and willingness) to take the messages from the tour actively back into their constituencies.
• Build a Wave of Interest Tour participants would be asked to take back the
main themes to their memberships/ constituencies. In addition, a politically and functionally diverse group would be asked to present findings to the caucuses of every political party provincially, Federal MPs and Cabinet Ministers from B.C., and Federal Cabinet Ministers. Opportunities would also be sought to present to senior level civil servants in the B.C. Government.

48
• Design and Publish a Print Resource for Wide Distribution This would be a tool for all aspects of the follow up strategy. It would be published in draft form for purposes related to phase 2 and 3 of the action research initiative. On completion of the work-study tour, it would be revised to integrate pictures, quotations etc relevant to the overall aims associated with building a wave of informed interest.
• Design and Organize a Conference with the Objective of Raising the Profile,
Broadening the Support, and Elevating Political Interest
• Organize a Public Call for Adopting the Benchmark Approach Based on the results of the foregoing, organize a highly respected group of people to publicly call on the political leadership of B.C. to embrace the overall Oregon Benchmarks as a strategic approach to improving the governance of B.C.
In the course of thinking about how to effectively facilitate the adoption of the Oregon Benchmarks, we have had to consider timing issues. As one former cabinet minister told us, “ to everything there is a season”. We think that the current polarity in B.C., set as it is within a political context dominated by considerations relevant to an imminent election, is not the right timing for trying to bring a call for the Benchmark approach to a head. We do think, however, that it is highly desirable to get the work outlined in the strategy underway as soon as feasible. We would suggest that whichever party makes up the next government, they and the other political leadership in the house, should become the target of a public call for adopting the benchmark approach very, very early in the life of the new legislature. Analysis and Recommendations : Ministry Legislation and Policy Framework We believe that the Ministry has an opportunity to consider, and possibly integrate features of the Community Solutions Teams and Regional Partnerships into the new legislation. With respect to benchmarks, we believe the primary role the Ministry can play, other than supporting the strategy recommended in the previous section, would be to integrate a planning framework requirement, on the Ministry and on the communities and regions the Ministry works with, that will integrate an outcome, performance based approach to partnership development and resource provision. We set out our analysis and recommendations with respect to each of these theme in what follows. 1. Community Solutions Legislative Mandate for Inter-Agency Cooperation Oregon : Key Point At the heart of Community Solutions Teams is the legislative and policy base that compels five key agencies of State Government to collaborate and

49
cooperate in a manner that creates a stronger, more effective means of partnering with local governments around local priorities. B.C. Link The proposed B.C. framework conceives of the Ministry becoming the “one window” or “single entry point” through which the Ministry would “establish and maintain lasting, proactive and interactive connection with communities.” Problems and Challenges There is nothing in the B.C. proposals that will compel cooperation of other agencies. In the absence of legislation that compels other key Ministries into joint cooperation within a common mandate to serve communities more effectively, the Ministry will be poorly positioned. It will only be able to offer its own services and its persuasive capacity to secure other Ministries cooperation. This weakness is even more profound in the B.C. context because there is neither an overall strategic vision and goals for B.C. as a whole nor a system of targets/benchmarks to create the backdrop for cooperative action. Recommendation 1 Expand the scope of the legislation to include the requiring of key agencies (yet to be determined) to cooperate, in partnership with local governments, and other designated organizations (perhaps the CDCs), to address and solve problems which are deemed to be priorities at the local and sub-regional levels. Recommendation 2 Require in the legislation that the inter-agency partnership report to all key legislative committees relevant to the mandate and participating agencies. 2. Critical Staff Role : Positioning to Achieve Results Oregon : Key Point The Regional Development Officers, located in the Department of Economic and Community Development, play a centrally important function in leveraging resources and managing process. They are positioned, by the legislative and policy framework they are operating within, and the mandate of the community solutions teams and regional partnerships they help convene, to cut across departments and levels of government in order to get things done. B.C. Link The proposed B.C. framework sets out that the MCDCV assemble various kinds of teams from across government to coordinate government involvement and support for community development. There is no reference to projected key management positions to support this network. Nor is there any reference to whether the Ministry will work on a community by community basis or whether key staff will be deployed on a regional basis. Problems and Challenges Without this capacity, it is doubtful results will be achieved. This report clearly noted that, even with the legislative framework that empowered the cooperation between agencies, there are capacity challenges in Oregon. If the Ministry positions itself to take on a role to bring government agencies to the table without the authority, the time and the resources necessary to secure cooperative action, the

50
difficulties will be even greater. Thus, our view is, without a clear commitment to sufficient staff resources, the Ministry will be setting itself up for failure. Recommendation 3 Ensure that the legislation identifies and defines the requisite capacity required to convene, organize and manage the process of cooperation and collaboration aimed at achieving more effective provincial capacity to address local and regional priorities. Recommendation 4 Seriously consider how the requisite staff capacity is deployed, whether on a regional basis or some other functional criteria. If it is decided to follow the Oregon model of legislating the mandate for a core team of agencies, their various ways of defining regions should be taken into account to maximize consistency. Planning, Benchmarks and Problem Solving Oregon : Key Points The Community Solutions Teams are focused on problem solving, in partnership with local government, and around community determined priorities. The Regional Partnerships are focused on building broader cooperative partnerships to address regional priorities as formulated in an outcome defined plan. The presence of the Oregon Benchmarks is a key planning tool for the agencies and the range of other partners with whom they are engaged. Also supportive of the county level planning in Oregon is the annual Needs and Issues Inventory in which State, County and Federal governments participate. Lastly, there is a clear understanding that leadership is key to development. In Oregon, leadership training and technical assistance aimed at capacity building, especially in rural areas but also in poor urban neighborhoods, is financed through the Department of Economic and Community Development’s annual budget. B.C. Link The B.C discussion paper contemplates several things. In relation to the various tools and vehicles it defines the Ministry working with to support communities - community adjustment agreements, community development agreements and community development corporations – it suggests a role for the government teams in community transition and development planning and provision of a range of resources relevant to the defined priorities. Problems and Challenges The B.C. approach to various kinds of agreements for communities in different circumstances is more complicated that the Oregon approach. First, in the Community Solutions Teams focus is local government. In the B.C. legislation requires a multi-stakeholder organization. Second, in Oregon the Benchmark approach is a foundation from which to make plans and forge partnerships. In B.C. there is not a common framework for encouraging outcome based planning or partnership formation. Recommendation 5 Set criteria into the policy and program framework of the Ministry the requirement that community economic development and community development planning it finances must define verifiable outcomes as feature of the plan.

51
Recommendation 6 Set criteria into the legislation requiring the MCDCV and other partner agencies (if recommendation 1 is accepted) to develop strategic plans which have defined, verifiable outcomes and performance measures. Recommendation 7 Set a requirement in the legislation for a Ministry of the B.C. government, at this point the MCDCV, to facilitate an annual Needs and Issues Inventory that involves the three levels of government in each regional district of B.C. Recommendation 8 Build a reference in the legislation that supports leadership development and capacity building throughout the province, with a priority on distressed rural and urban areas. This will provide a reference point for the Ministry related to acquiring necessary resources. Some Concluding Comments There has been tremendous learning in the course of this project, learning that gives rise to some hopefulness with respect to the potential positive impacts adapting the Benchmarks System approach into the B.C. context. The Center for Community Enterprise is anxious to move forward with the process of putting the core of this documents analysis in front of a wide range of constituencies across the province. We hope that the Ministry will have an ongoing interest in supporting this effort. CCE is currently seeking to conduct interviews with the Premiers office in Tasmania to get a better handle on just how they are implementing the Oregon Benchmarks system. This is of particular interest to us, and we presume people in various Canadian jurisdictions, since Tasmania is an inheritor of the British Parliamentary system of government. It may be that a closer look at this experience may be worth considering as we prepare to move towards the next phase. In closing, CCE thanks the Ministry for its support of this research initiative. We look forward to the potential for ongoing collaboration and sharing of learning.
52
Appendix One
TILLAMOOK COUNTY, OREGON SETTING THE BENCHMARKS FOR PERFORMANCE
AND PARTNERSHIPS Background Located on the Pacific coast of NW Oregon, Tillamook County is a land akin to the west coast of British Columbia. Dominated by natural features including coniferous forests, farmland, rivers, bays and shoreline, its population 24,000 is scattered along the north-south corridor established by the coast highway 101, never far from the open Pacific. Incorporated communities range from 260 in Nehalem to the county seat, Tillimook City with its 4400 citizens. This relatively small population occupying some 1125 square miles lives a rural life style within an economy that is based in large part on natural resources-driven industries. However, this is beginning to change. The quality of life coupled with the relative proximity of Portland is leading to a demographic shift due to the in-migration of high income 2nd homeowners and retirees. Known as the “land of cheese, trees and ocean breeze”, the economic base since the mid-1800s has been forestry, fishing, dairy agriculture and, more recently, recreational tourism. The development of the county industrial base experienced its first big jump when a railroad from Portland was built in 1911. Fish and trees and dairy cows became dominant. In the 1930’s and 40’s major forest fires, referred to locally as the “Tillamook Burn”, created a long-term impact on the county’s economic and environmental health which can be traced to the present day. Following the depressing impacts of this local disaster came the war and with it a mini-boom, prompted in part with the fact that airships were housed and maintained in the county, the legacy of which, the massive wooden hangers, are now a major air museum. Tillamook County has an economic history not much different from much of coastal B.C. Dramatic landscapes rich in natural resources nurtured a citizenry with deep roots, that have taken pride in their communities, fostering a cultural heritage grounded in a strong sense of place. However, like much of coastal B.C., Tillamook County also is not without its problems. Development pressures, declining natural resources, a shift to a lower wage service economy based on high income in-migrants and general economic uncertainty and instability have converged to present citizens of the county with challenging decisions. Driving these decisions, as will become evident over the course of this narrative, is a palpable desire among local residents to maintain and enhance Tillamook County’s unique social, economic, and environmental character.

53
It is how this desire has been enlivened, supported and impacted by the State wide Oregon Benchmarks since 1989 that is the subject of this case study. Issues and Challenges : Tillamook County Over the Last Two Decades Cumulative impacts flowing from several issues have been making themselves felt ever more keenly over the last 20 years throughout the communities of Tillamook County.
• The forest industry has had to face significant challenges over several decades. The ‘Tillamook Burn” consumed 13 billion board feet of lumber and contributed to significant amounts of erosion into streams, rivers, and Tillamook bay. The famous Spotted Owl controversy in the 80’s represented another major impact on local harvesting. Representing the deepening societal concern for the health of the forest eco-system, the spotted owl has significantly modified the practices of the industry. No longer is there a social license that allows business interest to ignore eco-system impacts.
• There have been, and continue to be, major difficulties in the fishing industry.
First, the salmon segment of the industry has been damaged by environmental degradation and habitat destruction (Tillamook burn, forestry practices and agriculture) and over harvest. Stocks are in trouble throughout the state. Second, the movement from local fisheries to off-shore factory ships has continued, further alienating the coastal communities from the resource base. Third, warmer ocean temperatures appear to be negatively impacting salmon populations.
• The dairy industry has historically been an economic and cultural mainstay of the
County. However, worsening flooding has negatively impacted the production of forage crops and grazing land as well as significant property damage. (The average elevation of the county is 7 meters above sea level). In addition, some agricultural practices have contributed to pollution and degradation of streams and wetlands.
• Water quality has deteriorated due to the aforementioned activities as well as the
more urban manifestations of pollution such as sewage effluent, storm water run off and human encroachment on habitat.
This overall degradation of the resource base and the accompanying economic consequences were for years unattended to. Responses by government were short-term and piecemeal. While there was a lot of research and planning, there was no co-ordinated or meaningful long-term development plan. The State government shift in the 90’s to a focus on high-tech industrial recruitment and development, while benefiting the Interstate highway 5 corridor, passed by Tillamook County.

54
A major feature of the decline, especially in the 80’s, was the steady increase in social problems that accompanied the inexorable lay-offs caused by the curtailment of natural resource harvesting and related plant and mill closures. Poverty increased as did the attendant pressures on families revealed in accelerated rates of divorce, single parent families, teen pregnancy and juvenile arrest. Also reported by those who lived through this period was a decreasing sense of community, increased concern for citizen safety, and a loss of much sense of control or influence. Civic participation was in decline. Trust in government was significantly eroded. An area the economic decline reveals itself today is the very difficult pressures on local levels of government trying to address maintenance of, as well as legislated upgrades to, existing infrastructure. They are proving very difficult to achieve. With the decline in the traditional economy, there was an accompanying erosion of the local tax base, which in turn led to delays in much needed re-investment in infrastructure. Thus, somewhat ironically, the recent and accelerating influx of retirees and second homeowners to the area, while bolstering local service and retail trade, a plus in the view of many locals, is exacerbating the already significant pressure on already inadequate infrastructure. The 1990s - A Decade of Innovation : Tillamook County making the Transition Tillamook County was in a predicament by the end of the 80’s not a whole lot different than that of many Oregon counties overly dependent on the forest industry. The crisis, exacerbated by the cut in harvest levels across the state due to the white owl controversy, had the State economy reeling. A deep recession had settled across the state. The Democratic Governor of the time was forced to find a way of articulating a new, strategic vision for the State. Thus was born Oregon Shines (1989), the formation of the Oregon Progress Board and ultimately, the establishment of the Oregon Benchmarks and the subsequent bi-annual reports beginning in 1991. The National Estuary Program By the early 1990’s, Tillamook County citizens realized that the environmental problems facing Tillamook Bay – accumulating sediment, shellfish closures, ground-fish closures, declining salmon runs – were threatening the future well-being of the people who called Tillamook county home. And it was not just the Bay. Decreasing water quality meant violations of Federal clean water standards and the accumulating sediment in the streams and rivers flowing into the Bay were increasing in magnitude, as were the frequency of floods. For these reasons the citizens of the County, with the help of the Governor, nominated Tillamook Bay to the National Estuary Program. The nomination was approved by the Federal Environmental Protection Agency in 1994. This created the Federally sponsored Tillamook Bay National Estuary Project (TBNEP).
55
The TBNEP developed a planning partnership involving local, State and Federal Agencies, as well as citizens, educators and industry to create the Tillamook Comprehensive Conservation and Management Plan (CCMP). Focused on addressing the a century of accumulated environmental problems, the tremendous dedication and perseverance by all parties to reach agreement around 62 specific actions to solve priority problems of the watershed is a tremendous achievement. It took four years to complete. In 1999 it was approved by the Management committee, the Federal Environmental Protection Agency and the Governor of Oregon. It is important to note that at the same time the Federal Environment agency was announcing the award of the National Estuary project, the Oregon Benchmarks was well on its way to preparing its 3rd bi-annual report to the people of Oregon Benchmarks. Eventually, these statewide benchmarks would inspire, leverage and help define work that would mark Tillamook as an county of innovation and progress. Also important in 1994 was Governor Roberts energetic negotiation with Vice-President Gore of the Oregon Option, a Federal-State agreement, aimed at radically lessening Federal bureaucracy and increasing regulatory and fiscal flexibility in exchange for outcome defined accountability agreements. None of this was lost on the committed leadership working away in the trenches of Tillamook County. The Tillamook Performance Partnership Having the estuary plan in place, aimed at “restoring the balance” within damaged watersheds, is not the same as getting the work underway and even more important, making some real progress. In 1998, the Financial Strategies Action Committee of the Estuary Project, drawing on the Oregon Benchmarks and the spirit of the Oregon Option, forged the Tillamook Bay Performance Partnership. A Performance Partnership is defined in the US-Oregon context as “an agreement among all levels of government to streamline inputs (capital, labor etc.) into mutually agreed-upon projects to achieve mutually agreed upon outcomes.” Derived in part from Gore’s campaign to reinvent government (known as the National Performance Review), state and local authorities lead project implementation while federal agencies provide much of the funding. Tillamook County made sure all the pieces come together in the Tillamook Performance Partnership.
1. Federal funding and services are tied to outcomes defined by the three levels of government
2. Outcomes were defined by integrating action goals to the Oregon Benchmarks, thus assuring wide agreement and concrete means to measure progress
Graphically depicted on the following page is the situation the Tillamook Partnership is seeking to transform. While many agencies and organizations maintain a common objective to improve watershed/ecosystem health, each maintains separate processes and

56
funding sources. Collaborative processes that have developed in Oregon (watershed councils, for example) are forced to spend considerable time and energy seeking the wide variety of funding sources and adhering to all of the independent processes, procedures, and requirements. A hypothetical project may be charted as this one is, with each agency pursuing its own funding for similar projects. Despite similar project goals, the objectives, processes, and accountability all vary from agency to agency.
In the model above, little coordination exist s among resource agencies despite similar missions of resource conservation and enhancement. The Tillamook County Performance Partnership model on the next page is based upon the premise of mutually agreed upon goals and outcomes. Agencies and other partners agree on what the goals and outcomes of a project should be and then funding and implementation agents tailor their resources accordingly.

57
Once agencies at all levels of government agree on these goals and outcomes (through a Memorandum of Understanding, for example), a Performance Partnership provides for longer term project funding and much enhanced flexibility for front line managers. The evolution of technology to a point where on line, GIS based reporting is possible is another feature of the Performance Partnership 7 that has significant potential to cut costs and more effectively focus efforts. Accountability becomes transparent to all interested parties and the wasted effort of multiple agency reporting is reduced. It is hard to see how a partnership involving over 120 members (community leaders and organizations, state and federal agencies, industries and local governments and private citizens) could be launched or sustained over time without either the estuary plan with its 62 specific action areas or the benchmarks.
7 This system is at the early stages of development. Its potential is far from being fully realized as of September 2000.
58
The challenge ahead is considerable. Financing from the EPA continues, but represents a smaller amount and makes up only about 16% of the funding requirements. State agencies with mandates directly relevant to specific actions make up 34%. Local funding makes up only 2%, leaving a huge unidentified gap in implementation funding. Here again, the plan and the benchmarks provide the framework for leveraging resources from multiple sources. Early experience, garnered from local respondents, suggests the role of Oregon Benchmarks and the Oregon Option will be of ongoing importance.
1. The Oregon Option, even though not now formally a priority of the Federal government, is being used by local spark plugs and activists to provide tentative bureaucrats with the security and blessing they need to take action.
2. Leveraging the benefits of the Oregon Benchmarks and Oregon Options does not
happen automatically. The fact that each of these tools is a sanctioned means to bring people into relationship with each other is the first critical step. The second is to translate these relationships into new patterns of behavior and a broader array of resources. Local respondents clearly indicated that this is beginning to happen. Third, the commitment to outcomes and the commitment to transparent accountability, helps keep a complex implementation process on track.
3. It takes time and focus to build leadership. The focus of the plan and the learning
that takes place through tracking benchmarks over time, are building new leadership. It is also attracting some excellent leaders who, in the absence of a meaningful framework for participation, were uninvolved in public means to address collective issues and challenges. Benchmarks has helped the “cream rise to the top”.
Tillamook County Futures : Building A County Level Strategic Vision and Benchmarks
During 1997, in the latter stages of the tremendous effort to create a plan for restoration of the estuary and related watersheds, the Tillamook County Commissioners, with assistance from the Tillamook Economic Development Council, decided to initiate a county wide strategic visioning process. The county government appointed a 12 member “Futures Council” and asked them to develop and implement a county wide visioning process. With assistance secured from the Oregon Community Planning Workshop, a university based technical assistance organization, a six month strategic visioning process was initiated in January 1998. A summary of the key components of this very competently undertaken planning process are outlined in the points which follow.
1. Focus Groups provided an opportunity to identify the special insights and concerns of community members with specialized skills and expertise. The Futures Council identified 17 groups who they felt would provide a representative

59
cross section of Tillamook County’s public and private sector activities. Each group was asked to identify aspects of the County they liked and wanted to maintain in the future. Each group was also asked to identify aspects of the County that should be changed to improve the quality of life in the year 2020.
2. Survey Research was used to provide an equal opportunity for all residents and
property owners to voice their opinion about the strengths and weaknesses of the County. The focus group participants provided suggestions for features of the County to maintain and those to change. These features were presented in a survey as statements, with which residents could agree or disagree. Surveys were randomly distributed by mail to 4,000 households in the County. The household survey was also distributed to 200 High school students. Comparative survey results for adults and high school respondents were prepared and distributed.
3. Newsletters were used to describe the visioning process and share the results
from each of the stages. The first described to 2020 visioning process. The second presented the results of the household surveys and invited residents to public meetings where strategies would be developed to guide the long-range visions and goals of the county. The third newsletter was a draft of the vision, goals and strategies. Residents were encouraged to review the Draft and make recommendations for improvements, although no changes were made without supporting evidence from the focus group and survey results. The fourth newsletter was the final version of the Futures Council Visions, Goals and Strategies.
4. Making Appropriate Plans and Strategies (MAPS), an interactive group
strategy development process, was the focus of the first series of public meetings. Using survey results, participants in each of the five meetings held around the county were asked to consider a set of questions that emerged from the focus group and survey process. More than 500 possible strategies emerged.
5. Electronic Polling was used at a second round of public meetings where
participants were asked to indicate their level of agreement with Goals and Strategies that appeared in the Draft Visioning Newsletter. Over 100 people attending five public sessions where, using hand held voting key pads, they registered their level of support and prioritization for the draft goals and strategies.
The results of all of this work, which involved more that 1200 individuals, was the definition of 19 goals and 52 strategies for guiding development of the county over the next 20 years. The goals are expressed as desired, long-term outcomes for the Country. Although inter-related and inter-connected, the goals are divided into four distinct categories: Growth and Development; Natural Environment; Economy and Society and Culture. Within each

60
of these major themes and their related goals and strategies, specific benchmarks are established. The County Futures Council, not long after the publishing of its strategic vision and the initiation of action on immediate priorities by County Commissioners, undertook a follow up effort to assess the condition of Tillamook County by quantitatively evaluating the Vision’s goals and related benchmarks. Premised on the assumption that as Tillamook County works towards its 2020 Vision, it is important to have a baseline assessment of the County’s current condition, the Futures Council published its first Benchmark report in July 2000. The benchmarks contained in the Strategic Vision follow the Oregon Progress Board model. Like the Progress Board, the Futures Council uses benchmarks as a means of monitoring the success of achieving its Vision. Consequently, the Futures Council attempts to use the Oregon Progress Board’s benchmarks wherever they are appropriate and local data is available. Indeed, one of the criteria for Benchmark selection is the availability of data that is readily available. Because they want to be able to show trends over time, this is very important. Second, benchmarks had to reflect the goals contained in the Vision. Since the Strategic Vision is based on extensive public input, indicators must assess those interests vital to the citizens of the County. There are already several examples of impacts of the overall approach of this work. An education consortium has come together to address the youth at risk strategies and benchmarks Projects include curriculum related revision and the establishment of a youth choir that is engaged in a range of watershed restoration projects. A private forest land holder has initiated a process of making more effective use of riparian land near an urban area. In cooperation with local officials they linked trail development and reclamation of a slough to downtown and waterfront revitalization. In fact, the waterfront was given away to the town to use for which a tax benefit was secured. A government agency (Health and Human Resources) undertook to partner with local groups to create community gardens as a poverty reduction method. The local leadership involved in the Benchmarking work are very careful to recognize certain limitations of benchmarks. They note that because some goals are easily assigned a benchmark for which data is readily available, the potential exists for policy makers to displace the importance of goals and strategies which may not be easily measured. This is a mistake for which there is no simple solution other than awareness and diligence. For those goals that cannot be measured, focusing on implementation of the strategies on the ground will act as one corrective, and overtime, the Futures Council will continue to seek out and test appropriate benchmarks. Meanwhile, implementation of initiatives is being facilitated by the specificity of the outcomes. Partnerships are forming and resources are being mobilized from within and leveraged from outside. However, this is not all happening through county government or outside agencies, or the Community Futures Council for that matter. An important

61
ingredient in the development mix over the last several years is a remarkable, very small organization known as the Tillamook Economic Development Council. Tillamook Economic Development Council One person described this local activist development organization as the “mirror behind the candle”. One might use other metaphors to describe the background role played by the EDC – yeast, leaven, sparkplug, to name a few. The Council is elected and until about four years ago, only had a budget of $15,000. Through talented leadership and dedication, the Council has increased its budget to $105,000, still very modest. However, they have been a key thinker, planner, organizer and developer behind the scenes. Constantly weaving between a wide range of local actors and agencies and state and federal agencies, the EDC council and director play a key role in leveraging additional resources into local capacity building and leadership development, one example being the Futures Council initiative. For this and other priorities, they brought $700,000 into the county last year. In addition to leadership development and capacity building, the EDC has two other major goals : eco-system industry development and commercial re-development focused on using of resources to their highest and best use. They have evolved a loan fund to support ecologically viable business development, provide broadly available information and networking services to the sector and some basic technical assistance. With respect to commercial re-development the organizing, facilitating and resource brokerage support are important to the local officials working in the various towns. Tillamook City, the largest town in the county (4000) is a major focus in this work. What is important to note here is that this growing capacity represented by the EDC is an absolutely critical piece of the Tillamook transition story. The strategic thinking and integrating it has been able to provide and facilitate in the county is fundamental to succeeding. As the director pointed out, without some means by which capacity building can be maintained as a priority focus, something that is missing from most governmental agencies, strategic visioning and benchmarks will not carry the day. Ultimately, people organized together to achieve common goals are the critical ingredient in making change happen. It takes capacity to set the strategic vision and define the benchmarks. It takes even more capacity to ensure the action is sustained over time. “Too often” the EDC director noted “government forgets this most important fact”. Some Parting Reflections The case of Tillamook County is not a story of some linear string of impacts occurring as a result of the Oregon Benchmarks being introduced at the state level. Rather, the Benchmarks seem to have been, at least in the early years of the 90’s, more like some

62
cleverly designed wallpaper which over time infiltrates the consciousness of more and more citizens. However, over the last five years, the convergence of the estuary planning program, a deteriorating social and natural environment and the putting in place of some focused local leadership (the EDC), the Benchmarks have become a consciously wielded, very creative tool for not only shaping local planning efforts, but also for leveraging local and external resources and forging cooperation between diverse stakeholders. The Oregon Progress Board has inspired, informed and, in some instances, provide guidance to Tillamook efforts. Their ongoing work of refining benchmarks at the state level and their ongoing technical assistance to state agencies to move in the direction of outcome based performance systems, tied to the Oregon Benchmarks, is creating a culture of collaboration with local and county level governments. As indicated elsewhere in the body of this report, the recent moves by the Governors office give leadership to cooperation through establishing Community Solutions Teams and Regional Partnerships seems poised to reinforce this cooperative approach to governance and community problem solving. One small indication of this was that when we walked into a meeting with the Regional Development Officer responsible for Tillamook county, one of the first things he put in front of us was the July 2000 Benchmark report of the County Futures Council. In closing, at least four people we interviewed that, following an array of analytical and technically motivated questions, said there were two important impacts flowing from the overall emphasis on strategic visioning and benchmarks – hope and meaning. In a cynical, rapidly changing world, the kindling of hope that shaping change is possible coupled with the meaning derived from feeling part of a collective effort, are outcomes that are perhaps hard to measure but which are, nevertheless, of fundamental importance to mobilizing the human effort necessary to address the tremendous challenges we collectively face in our societies and in our world.

63
Appendix Two
Bibliography Oregon Benchmark Report
Schorr, Lisbeth B., 1997. Common Purpose, Strengthening Families and Neighborhoods to Rebuild America. Anchor Books, Doubleday. ISBN 0-385-47532-2 Oregon Online, Worldwide Web, http://www.state.or.us/agencies.htm Oregon Economic Development Dept., May 1989. Oregon Shines, An Economic Strategy for the Pacific Century. 65th Oregon Legislative Assembly-1989 Regular Session, June 16, 1989. Senate Bill 170 Oregon Progress Board, January 1991. Oregon Benchmarks, Setting Measurable Standards for Progress, Report to the 1991 Oregon Legislature. Oregon Progress Board, Worldwide Web Homepage, http://www.econ.state.or.us/opb/ Oregon Progress Board, Citizen Opinion Survey Oregon Progress Board, January 1996. Data Directory, Oregon Benchmarks Oregon Progress Board, January 1997. Oregon Shines 2: Updating Oregon’s Strategic Plan, A Report to the People. http://www.econ.state.or.us/opb/orsh2.htm Oregon Progress Board, 1998.Oregon Population Survey, http://www.econ.state.or.us/opb/opsinex.htm Oregon Progress Board, 1999.Benchmark Blue Book, http://www.econ.state.or.us/opb/bbb/index.htm Oregon Progress Board, March 1999. Achieving the Oregon Shines Vision: The 1999 Benchmark Performance Report Highlights. Oregon Progress board, November 1999. Oregon Benchmarks, County Data Book. Tryens, Jeff, July 2000. Benchmark Update, Oregon Progress Board. Hatry, Harry P. and Kirlin, John J., June 1994, An Assessment of the Oregon Benchmarks: A Report to the Oregon Progress Board, National Academy of Public Administration, Project Manager: Luke, Jeff S., University of Oregon

64
Oregon Dept. of Administrative Services, 1994.Performance Measures Reference Guide. Office of the Governor, State of Oregon, 1995.Executive Order No. EO–95-05, Oregon Progress Board. Office of the Governor, State of Oregon, 1995.Executive Order No. EO–95-09, Oregon Progress Board. Office of the Governor, State of Oregon, 1996.Executive Order No. EO–96-37, Oregon Progress Board. 69th Oregon Legislative Assembly-1997 Regular Session, February 19, 1997. Senate Bill 285 Hitchcock, Darcy, Willard, Marsha and Warnock, Ed, 1993. Catalytic Leadership Handbook, Partners for Investment, Portland State University. Macy, Christina H., The Oregon Option, A Federal-State-Local Partnership for Better Results, a report to the Annie E. Casey Foundation. Johnson, Pamela, June 2000. Hammer Award Ceremony, Vice President Gore’s National Partnership for Reinventing Government. http://www.npr.gov/library/speeches/21sthammr.html Oregon Business Council, Worldwide Web Homepage, http://www.orbusinesscouncil.org/index.html Oregon Business Council, May 1993. Oregon Values and Beliefs Survey. Oregon Business Council, 1999 The Oregon Agenda, Key Policy Questions for Oregon Business and Public Policy Leaders.
Oregon Economic Development Department, 1997. Two-Year and Six-Year Strategies.
Oregon Economic Development Department, 1997. Serving All Oregonians. Oregon Economic Development Department, 1998. A New Mission. Oregon Economic Development Department, 1998. “Solving Problems, Not Running Programs”. Oregon Economic Development Department, 1999. Oregon Economic Development Department-sponsored Legislative Bills.

65
Oregon Economic Development Department, 1999. 1999-2001 Governor’s Recommended Budget. Oregon Economic Development Department, 1999. Oregon Economic Development Department Regional Service Teams. Oregon Economic Development Department, A Performance Measurement System For the Small Business Coalition, the Community Assistance Coalition, and the Oregon Economic Development Department. Oregon Economic Development Department, Implement New Directions, Oregon Economic Development Commission Recommendations. Oregon Economic Development Commission, 1999.19997-1999 Biennial Report, On the Road to the 21st Century. Oregon Department of Transportation, June 2000. ODOT’s Strategic Direction. Oregon Economic and Community Development Department, July 2000. Developments, Volume 8, Issue 3. Oregon Economic and Community Development Department, Worldwide Web http://www.econ.state.or.us/ Office of the Governor, State of Oregon, November 1999. The Oregon Livability Initiative, Meeting the Challenges to Oregon’s Livability in the 21st Century, A Summary of New State Approaches to Community development and of Key Legislation Passed by the 1999 Legislature. Governor’s Community Development Office, November 1999. Community Solutions Team Roles and Responsibilities. Governor’s Community Development Office, Community Solutions, Partnering for Livability. Governor’s Community Development Office, Community Solutions Team Guidelines for the Community Development Agenda Governor’s Community Development Office, Community Solutions. Tillamook County, Worldwide Web, http://www.co.tillamook.or.us/ Luke, Jeff, PhD, Neville, Kathryn, 1996. Teenage Pregnancy Prevention: A Case Study of the Tillamook County Experience, Summary of Key Findings, Provided by Tillamook County Board of Commissioners.

66
Tillamook County, How do we measure up? Infant Mortality, Per Capita Income, Teen Pregnancy, Prenatal Care, Tobacco Use. Economic Development Council of Tillamook County, Intergovernmental Agreement. Trenholm, Mark, July 1998. Summary of the Tillamook County Performance Partnership, Prepared for Tillamook County Performance Partnership. Tillamook County Performance Partnership, Worldwide Web, http://www.co.tillamook.or.us/countygovernment/Estuary/TCPP/performance.html Tillamook County Futures, Worldwide Web, http://tcf.tillamook.k12.or.us/ United Way of Columbia-Willamette, Worldwide Web, http://www.unitedway.org/local.cfm?ID=39180&zip=00000 United Way of America, 1998.Community Impact: A New Paradigm Emerging, A White Paper on Change in the United Way Movement. United Way of Columbia-Willamette, August 2000. Community Impact, A New Approach for the United Way of the Columbia-Willamette United Way of Columbia-Willamette, Questions and Answers About the Community Impact Model and Allocation Process Redesign of United Way of the Columbia-Willamette Wev, Pamela H., Results Management in Social Services, Presentation Materials to the Board of Directors of the United Way of the Columbia-Willamette. Billitteri, Thomas J., March 2000. United Ways Seek a New Identity, The Chronicle of Philanthropy: Fundraising. http://philanthropy.com/free/articles/v12/i10/10000101.htm Portland Multnomah Progress Board, Worldwide Web, http://www.p-m-benchmarks.org/ Portland Multnomah Progress Board, 1999.Are We Making Progress? Nichols, Kathryn, September 1998. Children’s Readiness to Learn; Strategies for Improvement, Portland Multnomah Progress Board and the Multnomah Commission on Children and Families. Nichols, Kathryn, Rennie-Hill, Leslie, PhD, May 2000. Educational Success for Youth: Aligning School, Family, And Community, Portland Multnomah Progress Board and the Multnomah Commission on Children and Families.

67
Meross, Sharon, April 2000. Salmon Restoration in an Urban Watershed: Johnson Creek, Oregon, Portland Multnomah Progress Board. Blackmer, Gary, March 2000. City of Portland Service Efforts and Accomplishments: 1998-99, Ninth Annual Report on City Government Performance, Office of the City Auditor. Office of the Governor, State of Oregon, May 2000. Executive Order No.EO-00-07, Development of a Strategy Promoting Sustainability in Internal State Government Operations. http://www.governor.state.or.us/governor/sustainability/index.html Oregon State of the Environment Report, Prospectus of the Oregon State of the Environment Report. Shinn, Craig, August 2000. Draft-Version 3, Oregon’s State of the Environment Report, Oregon Progress Board. A Word From Oregon’s Governors, July 2000. Oregon State of the Environment Report, Statewide Summary. Fraser Basin Management Program, 1995. Board Report Card, Assessing Progress Towards Sustainability in the Fraser Basin. British Columbia Round Table on the Environment and the Economy, June 1994. State of Sustainability: Urban Sustainability and Containment. Hodge, Tony, PhD, and Prescott-Allen, Robert, July 1997. Report on British Columbia’s Progress Toward Sustainability. Ministry of Community Development, Cooperatives and Volunteers, June 2000. Toward Revitalized, Resilient and Sustainable Communities Across British Columbia. A discussion Paper on the Development of a Policy and Legislative Framework for Regional and Community Development. The 1996 B.C. Growth Strategy Legislation. The Growth Strategies Amendment Act passed in the provincial legislature in 1995 and now Part 25 of the Municipal Act. Fully outlined on the BC Government web sight, www.marh.gov.bc.ca/GROWTH/office.html The Georgia Basin Project. Documentation available on, www.pyr.ec.gc.ca.GeorgiaBasin/gbieIndex.htm. The 1998 Provincial Health Goals, Targets and Measures. Documentation available on, http://www.hlth.gov.bc.ca/pho/hlthgoal/index.html.

68
Appendix Three
Field Research Contacts August 28
• 9:00AM, Bill Campbell (503) 580-0054, OEDD, #300-1 World Trade Center, 121 SW Salmon, [email protected] , Samuel Saenz, Laila F. Cully
• 2:30PM, Duncan Wyse, Portland Office of Oregon Business Council, 1100 SW Sixth Avenue, Suite 1608 Portland, OR 97204 (503) 220-0691 [email protected]
August 29
• 10:00AM, Val Folkema (503) 842-2236, Commissioner, Tillamook County [email protected] , [email protected]
• 11:00AM,Shirley Kalkoven, Future Council & Rich Felley, Performance Partnerships, Garibaldi [email protected]
• 1:00PM, Sue Cameron (503) 842-3403, Commissioner, Courthouse, 201 Laurel Ave. Tillamook [email protected]
August 30
• 7:30-11:00AM, Jeff Tryens, OPB (503) 986-0039 [email protected] • 2:00PM, Michael Schultz, Portland United Way, 619 SW 11th Avenue, Suite 300
Portland, Oregon 97205-2646 (503) 226-9358 [email protected] • 3-3:30PM, Craig Shinn, (503) 725-8220 [email protected] (home) 263-6874,
Hatfield School of Government, PSU, Betty Lewis 725-3920 August 31
• 8:00AM,Gary Blackmer (503) 823-4808, P/M Progress Board, Portland City Hall, [email protected]
• 11:00AM, Community Solutions Teams, Salem, Governor’s Community Development Office, Christin Smith (503) 378-6892 ext. 25 OHCSD [email protected] , Ed Gallagher, Office of the Govern. [email protected] , Yvonne L. Addington, OECDD [email protected] ,
• 3:00PM, Howard Leichter, (503) 434-2477 Linfield College, [email protected]