the ohio state university department of chemical ... · a shell and tube heat exchanger runs a cold...
TRANSCRIPT

TheOhioStateUniversity
DepartmentofChemical&BiomolecularEngineering
ExperimentNo.2
SHELLANDTUBEHEATEXCHANGER
Authors:
GroupLeader–ConorHughes
OperationsEngineer–KyleHofacre
DesignEngineer–DrewShort
DevelopmentEngineer–ScottReinhart
QualityEngineer–HusseinAlkhatib
DateDue: DateSubmitted:
February16,2015 February16,2015
SubmittedTo:
Dr.JohnClay–Instructor
MichaelDenney–TeachingAssistant
Abstract
The objective of the shell and tube heat exchanger experiment and research is to
determinetheeffectofflowrateandflowconfigurationontheperformancecharacteristicsofa
forced convection shell and tube heat exchanger. Three analytical approaches are taken to
analyze the data. These approaches include the effectiveness/NTU method, heat and
momentumtransfercorrelations,andtheWilsonplotandmodifiedWilsonplotmethods.
Theeffectiveness/NTUmethoddeterminestheeffectivenessandefficiencyoftheshell
andtubeheatexchangeratvaryingflowrates.Thecounter-currentflowconfiguration(themost
effective)hasamaximumeffectivenessof0.47withashellsideflowrateof9.46gpmandtube
sideflowrateof2.97gpm.
TheheatandmomentummethodusesrelationshipsbetweenRe,Pr,andNutocalculate
convectiveheattransfercoefficients,whichareinturnusedtocalculatetheaverageoverallheat
transfercoefficient. Theaverageoverallheat transfercoefficient forco-currentandcounter-
currentfloware1268.47and836.76W/m2Krespectively.
TheWilsonandmodifiedWilsonPlotmethodcorrelatestheoverallthermalresistance
andReinordertocalculatetheaverageoverallheattransfercoefficient.ThroughtheWilsonplot
method,overallheattransfercoefficientsforco-currentandcounter-currentarecalculatedto
be 1386.26 and 1085.37W/m2K respectively. The overall heat transfer coefficient using the
modifiedWilsonmethod is 1387.89 and 1317.97W/m2K for co-current and counter-current
respectively.
The shell and tube heat exchanger data and analysismethods are used in the design
extension todeterminewhich combinationof tubebundle,diameter, and lengthof theheat
exchangerwillmeetthespecifications.Theapproachistoiterativelysolveforthecombination
ofdimensionspecificationsthatwillhaveapressuredropoflessthan200Pa,andminimizesteam
flowrateandsurfaceareaoftheheatexchanger.Theresultsconcludethatthemostoptimal
heatexchangerforthisdesignhas400tubes,adiameterof0.3inches,andalengthof0.75m.
Theflowconfiguration iscounter-currentwithasurfaceareaof7.182m2,steamflowrateof
0.321kg/sandoverallheattransfercoefficientof3.417kW/m2K.

TableofContents
Purpose..........................................................................................................................................1
Introduction...................................................................................................................................2
ExperimentDescription..................................................................................................................5
ResultsandDiscussion...................................................................................................................9
TemperatureProfiles................................................................................................................10
Effectiveness-NTUMethod.......................................................................................................14
HeatandMomentumTransferCorrelation..............................................................................18
WilsonPlotMethod..................................................................................................................20
ModifiedWilsonPlotMethod..................................................................................................24
ErrorAnalysis...............................................................................................................................29
Conclusion....................................................................................................................................31
Recommendations.......................................................................................................................33
DesignExtension..........................................................................................................................34
Notation.......................................................................................................................................41
LiteratureCited............................................................................................................................43
AppendixA-PreliminaryPreperationAssignment.....................................................................44
AppendixB–ExperimentalSummaryReport..............................................................................48
AppendixC–ReportFormulas.....................................................................................................55
Effectiveness-NTUMethod.......................................................................................................55
HeatandMomentumTransferCorrelation..............................................................................55
Wilson/ModifiedWilsonPlotMethod......................................................................................55
ExperimentDesignExtension...................................................................................................56
ErrorAnalysis............................................................................................................................56

AppendixD–SampleCalculations...............................................................................................57
Effectiveness-NTUMethod.......................................................................................................57
HeatandMomentumTransferCorrelation..............................................................................57
Wilson/ModifiedWilsonPlotMethod......................................................................................58
ExperimentDesignExtension...................................................................................................60
ErrorAnalysis............................................................................................................................61
AppendixE–MATLABCode.........................................................................................................62
Co-CurrentOperation(WilsonPlot).........................................................................................62
Counter-CurrentOperation(WilsonPlot)................................................................................64
NTU3DScatterPlot..................................................................................................................66
Co/Counter-CurrentOverallHeatTransferCoefficientvs.FlowRates....................................68
AppendixF–CalibrationCurves..................................................................................................71
AppendixG–AdditionalData......................................................................................................72
Co-CurrentandCounter-CurrentOperationTemperatureProfiles.........................................72
TableofParametersandConstants..........................................................................................78
ExperimentTimeLog................................................................................................................79

ListofFiguresFigure1.Experiment2SystemFlowchart..............................................................................................5
Figure2.Co-CurrentOperationTemperatureProfile(Run10).........................................................11
Figure3.Counter-CurrentOperationTemperatureProfile(Run8).................................................12
Figure4.Co-CurrentNon-SteadyStateTemperatureProfile............................................................13
Figure5.Counter-CurrentNon-SteadyStateTemperatureProfile..................................................13
Figure6.Effectivenessvs.NTUforCo/Counter-CurrentOperation.................................................14
Figure7.EffectivenessofCo-CurrentOperation(3DScatter)...........................................................17
Figure8.EffectivenessofCounter-CurrentOperation(3DScatter).................................................17
Figure9.Co/Counter-CurrentFlowRatesvs.OverallHeatTransferCoefficient............................20
Figure10.OriginalWilsonPlotMethodAppliedtoCo-Current........................................................23
Figure11.OriginalWilsonPlotMethodAppliedtoCounter-Current..............................................23
Figure12.DifferenceinmValuesvs.GuessedmValuesforCounter-Current...............................25
Figure13.DifferenceinmValuesvs.GuessedmValuesforCo-Current........................................26
Figure14.ModifiedWilsonPlotforCounter-CurrentOperations....................................................26
Figure15.ModifiedWilsonPlotforCo-CurrentOperations.............................................................27
Figure16.ShellSideFlowrateCalibrationCurve.................................................................................71
Figure17.TubeSideFlowrateCalibrationCurve................................................................................71

ListofTables
Table1.Co-CurrentOperationDesignSpace........................................................................................6
Table2.Counter-CurrentOperationDesignSpace...............................................................................7
Table3.Co-CurrentExperimentalData..................................................................................................9
Table4.Counter-CurrentExperimentalData......................................................................................10
Table5.CalculatedDataforNTUAnalysisMethod............................................................................16
Table6.CalculatedCorrelationData–Co-CurrentOperation..........................................................19
Table7.CalculatedCorrelationData–Counter-CurrentOperation................................................19
Table8.Counter-CurrentvaluesforRovand1/RemforWilsonPlot.................................................22
Table9.Co-CurrentvaluesforRovand1/RemforWilsonPlot...........................................................22
Table10.OriginalWilsonPlotLocalandOverallHeatTransferCoefficients..................................24
Table11.LocalandOverallHeatTransferCoefficientsforModifiedWilsonMethod...................27
Table12.ConfidenceIntervalCalculations..........................................................................................30
Table13.DesignExtensionIterationsandConclusions.....................................................................38
Table14.CalculationConstantsandProperties..................................................................................78
Table15.DesignExtensionConstants..................................................................................................78
Table16.OperationTimeLog................................................................................................................79

1
Purpose
ExperimentNo.2usesashellandtubeheatexchangertoanalyzetheeffectofflowrate
and flow configuration changes on the performance of the apparatus. This is evaluated by
calculating several variables related to performance. The heat exchanger is run in both co-
currentandcounter-currentconfigurationsinordertocompareandcontrasttheperformance
results.Inordertodothis,theeffectiveness,overallheattransfercoefficients,andtheinnerand
outer convective heat transfer coefficients are calculated. After these calculations are
performed,thedataisanalyzedusingthefivedifferentmethodslistedonpage2oftheShelland
Tube Heat Exchanger Operating Procedure (Denney, 2015). These methods have different
assumptionsandprocedures,whichmayormaynotleadtosimilarresults.Theresultsculminate
intoconclusionsanderroranalysis,whichpavethewayforthedesignextension. Thedesign
extensionrequiresuseofcalculationmethodslearnedinthelabinordertodeterminespecifics
foranewheatexchangertobepurchasedbyBuckeyeFoodsInc.Theyalsowouldliketoknow
thepressuredropthroughthetubesideoftheheatexchanger, theflowrateofsuperheated
steamneeded,andtheoverallheattransfercoefficient.

2
Introduction
Theimportanceofthisreportistoperformcalculations,makeconclusions,andevaluate
sourcesoferrorwithregardtotheshellandtubeheatexchanger.Thisinformationalongwith
the methods of analysis are applied to the design extension in order to solve the supplied
problem.
The experiment being performed involves a forced convection shell and tube heat
exchanger.Thisheatexchangercanbeoperatedindifferentflowconfigurationsandatdifferent
flowratestoachievecertainoutputtemperatures.Ashellandtubeheatexchangerrunsacold
fluid through the tubes of the apparatus and a hotter liquid through the shell side of the
apparatus.TheheatexchangerbeingusedinthisexperimentisaHampdenModelH-6850-40
ShellandTubeHeatExchangerwhichcontains112coppertubesalongwith3equallyspaced
baffles intheshell. Inthisexperiment,thetwofluidsbeingusedarewater. Thehotterfluid
comes intocontactwiththetubepipesas it flowsandheattransferoccursbetweenthetwo
fluids.Thecolderfluidgainsheatandthehotterfluidlosesheat.
Operationcanoccurinco-currentorcounter-currentflowpatterns.Inco-currentflow,
thetubeandshellliquidsflowinthesamedirection,howeverincounter-currentflow,thetube
and shell liquids flow in opposite directions. These configurations lead to different output
temperaturesandthereforedifferentexperimentalresults.Allofthefluidtemperaturesinthe
systemaremeasuredbytenthermocouplesplacedatvariouspointsthroughouttheapparatus.
Theflowratesalsovarythroughouttheexperimentreachingamaximumof10gpmand6.6gpm
for the shell and tube sides respectively. These parameters change over the course of the
experiment in order to evaluate the shell and tube heat exchanger performance. The heat
exchangerisallowedtoreachsteadystateforaboutsevenminutesaftereachchangeinflow
rates. Beforesevenminutes isallowedtoelapse,thesystemisconsideredtobe inunsteady
state.Inunsteadystate,thetemperaturesofboththeshellandtubefluidsarefluctuating.A
designspaceisusedtofindrandomcombinationsofshellandtubeflowratesinordertoproduce
themostrepresentativeresultspossible.About11datapointsforeachco-currentandcounter
currentflowarecollectedalongwithonetrialforeachconfigurationatunsteadystate.

3
Theexperimentalvariablesincludetheshellandtubesideflowrates,allthermocouple
readingsastemperatures,andthetubeandshellsidepressurereadings. Thesevariablesare
studiedbecausetheyareusedincalculationsinordertoevaluatetheperformanceoftheheat
exchanger.Theeffectiveness,overallheattransfercoefficient,andinnerandouterconvective
heattransfercoefficientsarecalculatedforbothco-currentandcounter-currentconfigurations.
Enoughdataiscollectedinordertoaccuratelyevaluatetheperformanceindicatorsmentioned
above.Thedataisthenanalyzedusingfivedifferentmethods.ThesemethodsincludeWilson
plot method, modified Wilson plot method, heat and momentum transfer correlations,
effectiveness-NTUmethod,andproducingtemperatureprofileplots.Eachmethodhasdifferent
theories, assumptions, and analytical procedures that are examined and used effectively by
referring to the referenced literature. TheWilsonplotmethod isused to find relationships
betweenthetemperaturedifferenceandheatfluxoneithertheshellortubesideoftheheat
exchanger.Thismethodusesmeasurementsofthetemperaturedifferencebetweenthefluids
andheat-transferrates.ConstantsarefoundusingtheWilsonplotmethodandtheseconstants
areusedtocalculateheattransfercoefficients.Factorsthataffecttheaccuracyofthismethod
include,accuracyofdata,amountofdatapoints,aswellasthescopeofthedata(Rose,2004).
ThemodifiedWilsonplotmethodbuildsoffoftheWilsonplotmethodbyutilizingtheoretically
“better”valuestofindnewconstantsandthenfinallynewandmoreaccuratevaluesforheat
transfercoefficients(Fernandez-Seara,2005). TheNTUmethodofanalysiscanbeusedifthe
inletandoutlettemperaturesareknown.ItusescollecteddatatocalculateNTUor“Numberof
TransferUnits”fromefficiency.NTUcanthenbeusedtocalculatetheeffectivenessoftheshell
andtubeheatexchanger,givingaquantitativemeasureofperformance(Incropera,2007).This
methodoperates under the assumptions that the process is steady state, the properties are
constant,andtherearenegligiblelossestothesurroundings.Theseassumptionscanbeanalyzed
todeterminetheaccuracyandvalidityofthismethod.Thenextmethodisheatandmomentum
transfercorrelations. ThisusesrelationshipsbetweenReynoldsnumber(Re),Prandtlnumber
(Pr),andtheNusseltnumber(Nu)tocalculatetheheattransfercoefficientsalongwiththeheat
flux. Thismethodusesdifferent equations and correlationsbaseduponwhether the flow is
laminar or turbulent as determinedby the valueof theReynolds number. Newton’s Lawof

4
Coolingisusedinthismethodsosomeassumptionsaremade. Theno-slipconditionisused,
whichstatesthatthevelocityofthefluidatthewallsofthetubesequalszero.Dragforceand
frictioneffectsarealsoignoredintheuseofthismethod.Finally,itisassumedthattheflowis
eitherlaminarorturbulent,notsomewhereinbetween.Thelastmethodforanalyzingthedata
istheplottingoftemperatureprofilesalongtheheatexchanger.Thismethodisrathersimple
andonlyrequiresplottingtemperaturevs.distancealongthetubes.Theoretically,thesegraphs
shouldmatch their corresponding graphs that appear in Figure1of the Shell andTubeHeat
ExchangerOperatingProcedure(Denney,2015).Thetemperaturechangesasthefluidmoves
downthetubesareconveyedbythegraph.Amoreindepthlookatthegraphscanshowtrends
incomparisonwitheachotheraswellaswiththereferencegraphs.Althoughthisisasimple
methodforanalyzingthedata,therearestillacoupleassumptionsthataremade.Itisassumed
that the thermocouples are reading and reporting accurate temperatures. In addition, it is
assumedthatthethermocouplesarenottouchingthewallsofthetubesinanyway.Thiswould
causethemtoreportthetubewalltemperatureinsteadofthetemperatureofthefluid.
Manyreferences,manuals,anddatasheetsareusedinthisexperiment.TheShelland
TubeHeatExchangerOperatingProcedure(Denney,2015)isreferencedfrequently.Aprepared
data sheet is used for calculation, graphing, and creating table of data used in this report.
FundamentalsofHeatandMassTransfer(Incropera,2007)isusedfrequentlyinmanyportions
ofthereport.AgeneralReviewoftheWilsonPlotMethodandIt’sModificationstoDetermine
ConvectionCoefficientsinHeatExchangeDevices(Fernandez-Seara,2006)isusedforWilsonand
Modified Wilson Plot analyses. Finally, the NIST Chemistry Webbook is used in the design
extensionportioninordertoobtainthermophysicalpropertiesofsaturatedsteam.

5
ExperimentDescription
Theexperimentwasdesignedtoobservetheeffectsofflowratesandflowconfigurations
ontheperformanceoftheforcedconvectionshellandtubeheatexchanger.Therewerelittle
materials needed for this experiment. The Hampden Model H-6850-40 shell and tube heat
exchangerwas comprised of 112 copper tubeswith an inner tube diameter of .21 inches, a
thicknessof.02inchesandatubelengthof14inches.Acitywaterlinewasconnectedtothe
systemprovidingamediumthroughwhichheattransfertookplace.Waterwasallowedtorun
foraboutsevenminutestoensurethesystemfilledwithwater.Ascrewdriverwasneededto
openandclosetheneedlevalvetoallowanexcessairinthesystemtoescape.Thermalgloves
wereusedtoturnvalvesasasafetyprecautionfromthehotpipes.Seenbelowisaflowchart
schematicoftheheatexchangersystemtakenfromtheShellandTubeHeatExchangerOperating
Procedure(Denney,2015).
Figure1.Experiment2SystemFlowchart

6
As shown in Figure 1, tube and shell side water was supplied from the city water
lineslocatedinthe"CITY"portion.Wateronthetubesideflowedthroughvalve10and1,the
rotometer, and then theheatexchanger. Finally tube sidewater flowed throughvalve7and
thendrained.Tubesideoperationswerecompletedinanopenloopsystem.Theshellsidewas
firstpurgedofairthroughtheuseofvalves12,13,and14.Valve11wasthenclosed,placingthe
shellsideinaclosedloopedsystem.Waterflowedfromthesurgetankthroughthepumpand
into the rotometer. During co-current operations, water flowed through valve 4, the heat
exchanger, and then back through valve 6. During counter-current operations,water flowed
through valve 5, the heat exchanger, and then out valve 2. Afterward shell sidewaterwent
throughtheheaterandthenbackintothepumptocontinuetocyclethrough.
Startingtheheatexchangerrequiredatwo-stepprocess.First,thetubesideoftheheat
exchangerwasfilledandthenshellside.Thepurposeofthetwoseparatefillingstepswasto
removeairfromthesystem.Aftertheheatexchangerwasfilled,thesystemwasallowedtorun
foraminimumofsevenminutestocheckthateverythingwasworkingproperly.Afterstartup
wascompleted,trialswereconductedtotestdifferentvariables.Therewereseveralvariables
that were manipulated to provide data for analysis. Operation of the heat exchanger was
observed inboththeco-currentandcounter-currentconfigurations.Also,tubeandshell flow
rateswerevariedrandomlywithinoperationallimits.Therandomselectionofflowratesinsured
unpredictabledatasothatcorrelationscouldbeconcludedonlyafteranalysis.Theselectionwas
createdusingthedesignspacesobservedbelow.
Table1.Co-CurrentOperationDesignSpace

7
Table2.Counter-CurrentOperationDesignSpace
Variablesrangedfrom1gpmto10gpmintheshellsideandfrom2.5gpmto6.5gpminthetube
side.However,thedesignspacewasconstructedforsteadystateoperationsothelowerlimitof
thedesignspacewasadjustedtoaminimumof2gpmfortheshellsideand2.5gpmforthetube
side.11trialswereconductedforboththeco-currentandcounter-currentconfigurations.Each
trialhadvariedflowratesthatwererandomlyselectedwithinthedesignspace.Flowrateswould
beadjustedusingvalves3and7.Onceflowrateswereadjusted,thesystemwouldcontinuously
run for at least sevenminutes to ensure steady state was achieved. The same process was
repeatedforeachtrial.
Non-steady state operation was also observed for co-current and counter-current.
Predeterminedflowrateswereselectedfortheshellandtubesothattherewouldbenon-steady
stateheatexchange.Onlyonetrialforbothconfigurationswasconductedfornon-steadystate
operationbyrecordingtheexitingtemperaturesoftheflowsfromtheshellandtubeevery20
secondsfor400seconds.
Data collected from the shell and tube heat exchanger was analyzed using several
methods.Theeffectivenessandefficiencyoftheheatexchangerwasdeterminedbyusingthe
NTU-Effectiveness plot. The overall heat transfer coefficient was calculated using Wilson,
Modified Wilson, and heat and momentum transfer correlation methods. Non-steady state
operationwasobservedbycreatingatemperatureprofile.
Safety was the biggest priority during the experiment. Everyone participating in the
experiment wore hard hats and safety glasses. Pressure gauges and thermocouples were

8
constantlymonitoredthroughouttheexperimentsothatoverpressurizationwouldnotoccur.
However,theshellandtubeheatexchangerwasneglectedonceforaperiodoftimeresultingin
theheateroverheatingandshuttingdown.Thermalgloveswereusedtoturnvalvesconnected
totheshellsidebecauseofthehotfluidflowingthroughthecopperpipesmadethepipeshot.
Allparticipantsinthelabstudiedtheemergencyshutdownandevacuationprocedurespriorto
the experiment in case of an emergency so shutdown and startup ran smoothly. No safety
incidentsoccurredduringthelab.

9
ResultsandDiscussion
During the shell and tube heat exchanger experiment, a sufficient amount of data is
gatheredandorganizedinordertoanalyzeexperimentalresults.Differentanalyzingtechniques
areusedincludingtemperatureprofileplots,effectiveness-NTUmethod,WilsonandModified
Wilson plot method, and heat and momentum transfer methods. Approximately five hours
allowsforthoroughoperationoftheheatexchangerincludingstartupandshutdown.Execution
oftheexperimentbeginsat8:00ambeginningwithfillingthesystemwithwaterfromacityline
whilekeepingsurethesystemisfreeofairbuildup.Trialsbeginanhourlateroperatingacross
theentiredesignspaceoftwodifferentflowconfigurations,co-currentandcounter-current.A
timelogiskeptinadataspreadsheetrecordingthetimeinwhichanewtrialbeganoperation.In
addition,thespreadsheetcontainsflowrate,pressure,andtemperaturereadingsforeachtrial
listed. Temperature data is read using LabVIEW software displaying the readings from ten
thermocouples,fiveshellsideandfivetubeside,positionedatvariousdistancesalongtheheat
exchanger.Table3,shownbelow,listsalldatarecordedduringco-currentoperationincluding
seventrialsofsupplementaldata.
Table3.Co-CurrentExperimentalData
10
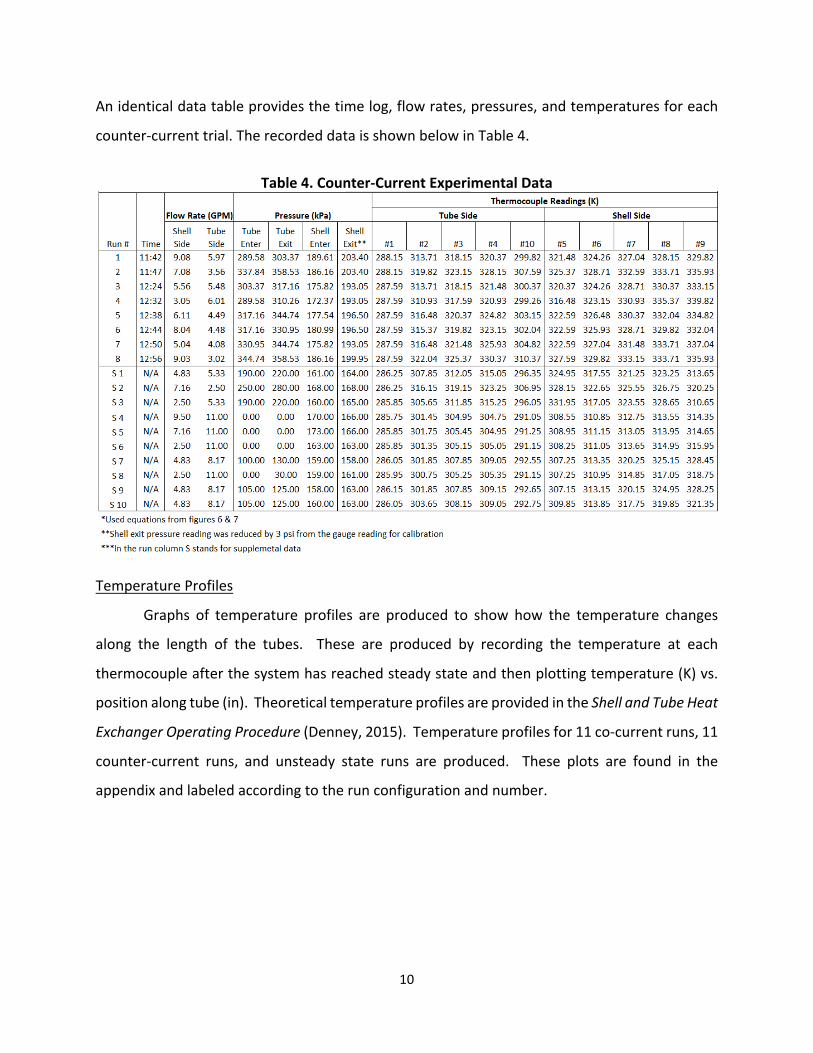
Anidenticaldatatableprovidesthetimelog,flowrates,pressures,andtemperaturesforeach
counter-currenttrial.TherecordeddataisshownbelowinTable4.
Table4.Counter-CurrentExperimentalData
TemperatureProfiles
Graphs of temperature profiles are produced to show how the temperature changes
along the length of the tubes. These are produced by recording the temperature at each
thermocoupleafterthesystemhasreachedsteadystateandthenplottingtemperature(K)vs.
positionalongtube(in).TheoreticaltemperatureprofilesareprovidedintheShellandTubeHeat
ExchangerOperatingProcedure(Denney,2015).Temperatureprofilesfor11co-currentruns,11
counter-current runs, and unsteady state runs are produced. These plots are found in the
appendixandlabeledaccordingtotherunconfigurationandnumber.

11
Figure2.Co-CurrentOperationTemperatureProfile(Run10)
WhencomparedtoFigure1intheShellandTubeHeatExchangerOperatingProcedure
(Denney,2015),Figure2fortheco-currentflowoperationresemblesthereferencegraphforthe
shellside.Theshellsidecurvesweepsslightlydownwardwithanegativeslopeastheposition
alongthetubeincreases.Although,thiscurveinFigure2doesn’thaveasmuchofanegative
slopeasthereferencegraphdoes.Thismeansthatoverallthetemperaturedidnotdecreaseon
theshellsideasmuchasispredictedbythereferencegraph.Ontheotherhand,theshapeof
the tubesidecurveshowssomediscrepancy. Insteadofasmooth increase, theslopeof the
Figure2tubesidecurveissemi-parabolic.Thisparabolicshapeshowsatemperaturedecrease
ataboutthehalfwaypointalongthetubes.Thiscausesadepressioninthesemi-parabolicshape.
Accordingtothereferencefigure,thetubesidecurveshouldshowapositiveslopealongthe
entirelengthofthetube,levelingouttowardstheendofthetube.Figure2showsapositive
slopeuntilabout5inches,anegativeslopeuntil7inches,anotherpositiveslopeuntilabout10
inches,andthenfinallyanegativeslopeuntiltheendofthetubeisreached.Thisdiscrepancy
couldbecausedbythermocoupleerror. Ifanyofthethermocouplesthatreadthetubeside
temperaturesaretouchingthewallofthetubeinsteadofplacedinthecenterofthetubethen
theywouldreadahighertemperature.Thisisbecausethecoppertubesaresurroundedbythe
shellsidehotwatercomingfromthewaterheater.Inaddition,thermocouple10isplacedatthe
tubeoutletandisnotcontainedwithintheinsulationoftheheatexchanger;thecopperpiping

12
isexposedtothelaboratorytemperatureair.Thiscausestheoutlettemperatureofthewaterto
dropabout20Kas indicatedbyFigure2. However, theshelland tubeheatexchangerdoes
increasetheoveralltemperatureofthetubesidewaterbyabout20Koverthecourseoftherun.
Figure3.Counter-CurrentOperationTemperatureProfile(Run8)
Figure3showsthetemperatureprofileforcounter-currentrunnumber8.Thisrunhad
similarflowrateswhencomparedtoFigure2co-currentrunnumber10.Theseflowrateswere
about9gpmand3gpmfortheshellandtubesidesrespectively.Figure3isverysimilartoFigure
2withrespecttothetubesidecurve.Theshellsidecurvehasapositiveslope,whichisexpected
becausetheenteringhotwaterflowisnowenteringatthe14in.positionalongthetube,sothe
waterwilldecreaseintemperatureasthepositionalongthetubedecreasesfrom14in.to0in.
Thetubesidecurveendswithanegativeslopejust like inFigure2forco-currentflow,this is
becauseofthesamethermocoupleerrormentionedinthediscussionofFigure2.Overall,the
tube sidewater increasesabout24Kas indicatedbyFigure3. Whencompared to the20K
increaseinFigure2,graphicallyitcanbeconcludedthatcounter-currentflowproducesslightly
higheroutputwatertemperaturesthanco-currentflowconfiguration.

13
Figure4.Co-CurrentNon-SteadyStateTemperatureProfile
Figure5.Counter-CurrentNon-SteadyStateTemperatureProfile
Figure4and5shownabovearetemperatureprofilecurvesforco-currentandcounter-
currentconfigurationsinunsteadystate.Theseareproducedbysettingtheflowratesequalto
values outside of the steady state regime as shown in Figure 4 in the Shell and Tube Heat
ExchangerOperatingProcedure(Denney,2015)andrecordingtemperaturesevery20seconds
for400seconds.ThetemperatureinKelvinisthengraphedvs.theelapsedtimeinseconds.Both
graphshaveverysimilarcurveshapes.Theybothhaveapositiveslopefrom0secondstoabout
220seconds,decreasesharplyto280seconds,increaseagainto375seconds,andthenfinally
decreaseto400seconds.Thecounter-currentcurveshowsasharpertemperaturedropfrom
220secondsto280secondsthantheco-currentcurve.Thecounter-currentcurveisatanoverall
highertemperaturerange.Thiscouldbebecausethecounter-currentgraphisrecordedatshell
side thermocouple9andtheco-currentgraph is recordedatshell side thermocouple5. The
unsteadystatecurvesshowhowthetemperaturefluctuateswhentheflowratesareeitherout
ofthesteadystateregimeorinthetimebeforethesystemisallowedtoequilibrate,asaresult,
thetemperaturesinthethermocouplesarefluctuating.Overall, inthecounter-currentcurve,
the temperature fluctuates about 12 K in the elapsed time period whereas the co-current
temperatureonlyfluctuatesabout3.5Kovertheelapsedtimeperiod.Therefore,therewould
be larger error associatedwith recording unsteady state temperature in the counter-current
configuration.

14
Effectiveness-NTUMethod
TheNTU-Effectivenessplotisagoodwaytoanalyzeheatexchangerperformancewhen
littlevariablesareknown.Theeffectivenessoftheheatexchangercanbecalculatedtodetermine
howwellheatisbeingtransferthroughoutthesystem.Tocalculateeffectivenessfortheshell
andtubeheatexchanger,thefollowingequationisused.
! = #$∗('$,)*'$,+)#-+.∗('/,+*'$,+)
(C-1.1)
Thisequationcanbesimplifiedbecausebothofthefluidsintheshellandtubearewater
soheatcapacitiesanddensitiescanceloutandbecomearatioofflowrates.Effectivenessranges
fromzerotoonewithonebeingthemosteffective.
Figure6.Effectivenessvs.NTUforCo/Counter-CurrentOperation
Figure6showsaplotofNTUverseeffectiveness.Theplotshowscountercurrentflowachieves
thehighesteffectivenesswithin theheatexchanger.Theeffectivenessof theheatexchanger
reachesamaximumof0.47whenrunningincounter-currentwithashellsideflowrateof9.46
gpmand tube side flow rateof 2.97 gpm.However, there are several other factors that can
diminishtheeffectivenessoftheheatexchanger.Foulingofthetubeswithinthebundlecanadd

15
thermal resistance and decrease heat exchange. Laminar flowwith in the shell or tube also
decreases effectiveness because layers are formed within the flowing fluid reducing heat
exchange.
Theplotalsoshowsthataseffectivenessincreases,sodoesthenumberoftransferunits
(NTU).NTUisafunctionofefficienciesandtheratioofheatcapacityrates.NTUisamaximumof
0.71atthegreatesteffectiveness.Itiscalculatedbythefollowingequation:
012 = − 1 + 678 *9:;< =*>=?>
(C-1.2)
Theefficiencyof theheat exchanger canbe also calculated in theNTUmethod. Efficiency is
governedbytheratiooftheminimumandmaximumheatcapacityratesandeffectiveness.The
efficiency of the heat exchanger determines how well energy is transferred throughout the
system.Table5,shownonthefollowingpage,providestheefficiencies forboththecounter-
currentandco-currenttrials.Thefollowingequationisusedtocalculateefficiency.
@ =A:*(>?#B)
(>?#B:)9/: (C-1.3)

16
Table5.CalculatedDataforNTUAnalysisMethod
OverallheattransferforasingletubeiscalculatedbymultiplyingNTUwithCminandthendividing
bytheoutsidesurfaceareaofthetube.Thisvaluetellstheoverallheattransferredofeachtube
inthetubebundle.Table5providesthevaluesofUtubeforallthetrailsintheexperiment.The
equationbelowshowsthatasNTUincreases,sodoestheoverallheattransfer.
2DEFG =#-+.∗H'IJKLMN
(C-1.4)
TheoverallheattransferfortheentirebundleiscalculatedbymultiplyingUtubebythenumberof
tubesinthebundle.
Optimal operation of the heat exchanger is determined at the greatest effectiveness
becausethatiswherethemostheattransferistakingplace.Co-currentoperationoftheheat
exchangerisoptimalwhentubesideflowratesarehighandshellsideflowratesarelow.

17
Figure7illustratesthevariousflowratesforthedifferenttrialsandshowstheeffectivenessof
eachtrial.Amaxeffectivenessisreachedwhen2.71gpmisflowingthroughtheshellsideand
10.11gpmthroughthetubeside.
Figure7.EffectivenessofCo-CurrentOperation(3DScatter)
Counter-currenthasoptimaloperationwhenthereisalargedifferencebetweentheshelland
tubeflowrates.Figure8providesavisualoftheeffectivenessforcounter-currentoperationfor
eachtrialpreformedintheexperiment.
Figure8.EffectivenessofCounter-CurrentOperation(3DScatter)

18
HeatandMomentumTransferCorrelation
TheheatandmomentumcorrelationmethodusesrelationshipsbetweenRe,Pr,andNuto
calculateconvectiveheattransfercoefficients.TheReynoldsandPrandtlnumberswere
calculatedusingthefollowingformulas:
OP = QRS+T
(C-2.1)
U7 = #V,WT
X (C-2.2)
Forlaminarflowregimes(i.e.Re<2300),theNusseltnumberismodeledbytheequation
below:
0Y = 1.953 OPU7 S+^
>/_ (C-2.3)
Eachtrialwasassumedtobelaminarinthisaspect,andthususedequation(C-2.3).Usingthe
definitionoftheNusseltnumberinequation(C-2.4),theinnerconvectiveheattransfer
coefficient(hi)canbecalculated.
0Y = b+S+X (C-2.4)
Oncetheinnerconvectiveheattransfercorrelationiscalculated,theouterconvectiveheat
transfercoefficientiscalculatedusingequation(C-2.6)below.Roviscalculatedusingrelations
describedintheWilsonplotmethodsection.
OcR =>
b)J)+ >
b+J+ (C-2.6)
Afterdeterminingtheinnerandouterconvectiveheattransfercoefficients,theoverallheat
transfercoefficient(U)canbefoundusingthefollowingequation:
2d' =>
9/)e)
? 9/+e+
(C-2.8)
SampleintermediatecalculationsareprovidedinAppendixD.Below,inTable6andTable7are
theintermediateparametervaluesforeachoperationaltrial,co-currentandcounter-current
flow.

19
Table6.CalculatedCorrelationData–Co-CurrentOperation
Table7.CalculatedCorrelationData–Counter-CurrentOperation
Whencompletingthecalculationsinthetables,thermocouple10isignoredduetosignificant
temperaturedropasaresultofpoorinsulation.Thus,thermocouple4isusedfortemperature

20
outputonthetubeside.Someofthetubeoutputtemperaturesreadhigherthantheshell
outputtemperatureswhichresultedintheerrorsseeninthetables.Theaverageoverallheat
transfercoefficientsforco-currentandcounter-currentfloware1268.47and836.76W/m2K
respectively.Avisualrepresentationoftheeffectsofvaryingtubesideandshellsideflowrates
ontheoverallheattransfercoefficientisshowninFigure9below.
Figure9.Co/Counter-CurrentFlowRatesvs.OverallHeatTransferCoefficient
AsseeninFigure9,theco-currenttrialsresultedinahigheroverallheattransfercoefficient
thanthecounter-currenttrials.Thisiscontrarytoresearchtheorythatcounter-current
operationistheoptimalconfigurationforaheatexchanger.Thisresultcouldhavebeen
producedbypoorthermocoupleplacementandreadingsaswellassignificantlylowflow.
Furtherexplanationsofthisphenomenoncanbefoundintherecommendationssection.
WilsonPlotMethod
InformationregardingWilsonplotmethodcanbefoundinreference[2].Thismethodof
analysiscreatesalinearcorrelationbetweenthermalresistance(Rov)andamodificationofthe
Reynoldsnumber(Re).Therelationshipusedisthefollowing:
OcR = 6> + 68>
fG- (C-3.1)
The final form of theWilson relationship, shown above, is after the following assumptions:

21
turbulent flow, the tube wall thermal resistance is constant, the outer and inner fouling
resistanceisconstant,andthermalresistanceduetooutsidetubesconvectionisconstant.Using
theoriginalWilsonplotmethodm= 0.8, Rov can alsobe calculatedusing the followingheat
transferrelations:
OcR =∆'hij
(C-2.6)
Where,
∆1̂ k = '/,+*'$,+ *('/,+*'$,+)mn[
p/,+qp$,+p/,+qp$,)
] (C-2.5)
s = tu6vu(1c − 1w) (C-4.5)
Reiscalculatedusingthefollowingequation:
OP = QRS+T
(C-2.1)
Thesevaluesarethencalculatedfromtemperatureprofiledataforshellandtubesideatvarying
flowrates.Alinearregressionisthenappliedtothefirstequation.TheresultingvaluesforC1
andC2areusedtocalculatetheconvectiveheattransfercoefficientforinsideandoutsidevia
thefollowingequation:
ℎw =fG-
#:J+ (C-3.3)
ℎc =>
#9* fy,)?fK?fy,+ J)
AssumingthatOz,c + OD + Oz,w = 0:
ℎc =>
#9∗J) (C-3.2)
Thefollowingequationcanbeusedtoobtaintheoverallheattransfercoefficient(U)fortheheat
exchangeroncehforbothouterandinnerheattransferareobtained:
2d' =>
9/+e+
? 9/)e)
(C-3.4)
UisthevaluedesiredtobeobtainedfromapplyingtheWilsonplotmethod.Itprovidesanoverall
heattransfercoefficientthatcanbeappliedtotheheatexchangerandfurtherusedtodetermine
theeffectivenessthereof.
BoththeReandRovwerecalculatedforallcounter-currentandco-currentexperimental

22
trials.InAppendixDisanexamplecalculationofbothReandRovfromrun#1counter-current
experiment.Belowistheresultingtableafterapplyingtheabovecalculationstoalltrials:
Table8.Counter-CurrentvaluesforRovand1/RemforWilsonPlot
Table9.Co-CurrentvaluesforRovand1/RemforWilsonPlot
Note that thereareseveralvalueswithin the table that readerror.That isbecause in
thesetrialsthetubetemperatureishotterthantheshellside,disallowing∆1̂ kcalculation.The
error can be from poor thermocouple placement and/or readings. The assumption that
thermocouple10ismisreadingtemperatureisappliedtothissectionaspreviouslymentionedin
theheatandmomentumtransfercorrelationsectionoftheresultsanddiscussion.Bothdatasets
shown in Table 8 and 9 were plotted and linearly regressed. The results are shown on the
followingpage:
1 0.00056 0.00322 0.00068 0.00483 0.00063 0.00344 0.00068 0.00325 0.00065 0.00406 0.00064 0.00407 0.00071 0.00438 0.00067 0.0054S1 error errorS2 error errorS3 error errorS4 0.00046 0.0020S5 0.00050 0.0020S6 0.00056 0.0020S7 0.00055 0.0025S8 0.00057 0.0020S9 0.00054 0.0025S10 0.00057 0.0025
Run# Rov
(K/W)
1/Rem
(m=0.8)
Counter-Current
1 0.00038 0.00302 0.00042 0.00323 0.00041 0.00344 0.00050 0.00325 0.00041 0.00486 0.00050 0.00347 0.00047 0.00408 0.00043 0.00399 0.00039 0.004310 error error11 error errorS1 0.00041 0.0020S2 0.00050 0.0025S3 0.00049 0.0025S4 0.00054 0.0020S5 0.00054 0.0020S6 0.00048 0.0025S7 0.00048 0.0020
Run#Rov
(K/W)
1/Rem
(m=0.8)
Co-Current

23
Figure10.OriginalWilsonPlotMethodAppliedtoCo-Current
Figure11.OriginalWilsonPlotMethodAppliedtoCounter-Current
Forco-currentoperationsa68valueof-0.0329K/Wanda6>valueof0.0006K/Ware
achieved.Forcounter-currentoperationsa68valueof0.0545K/Wanda6>valueof0.0004K/W
areachieved.Notethat68forco-currentoperationsachievesanegativenumber.Thismaybe
duetothelackofturbulentflowwithinthetrial.Alsoco-currentflowislessoptimalofaheat
transferconfigurationandthusWilson’smethodcannotbeasreadilyapplied.Theresultsofthe

24
regressionareusedtocalculateconvectiveheattransfercoefficientsviaequations(C-3.2)and
(C-3.3). Samples calculations can be found in Appendix D. The overall heat transfer (U) is
calculated using both convective heat transfer coefficients. Below is the results of these
calculationforbothco-currentandcounter-currentoperations:
Table10.OriginalWilsonPlotLocalandOverallHeatTransferCoefficients
ℎw iscalculatedtobe8170.52W/m2Kforcounter-currentand-11811.44W/m2Kforco-current.
ℎciscalculatedtobe3146.56W/m2Kforcounter-currentand2497.27W/m2Kforco-current.2
iscalculatedtobe1085.37W/m2Kforcounter-currentand1386.26W/m2Kforco-current.The
valueofℎw forco-currentoperationsisanegativevalue,thisisbecauseofthenegativevaluefor
68.Theoverallheattransfercoefficientforco-current isstillsimilartotheaveragecalculated
value obtained using heat and momentum correlations (1199.98 W/m2K). The overall heat
transfercoefficientforcounter-currentoperationsisalsosimilartothosecalculatedbyheatand
momentumcorrelations(921.97W/m2K).Showingconfidenceinthevalidityoftheresultsvia
the Wilson method. 2is similar for both configurations which contradicts what would be
expected:counter-current tohaveasignificantly larger 2 thanco-current.Thismaybe from
factors such as thermocouple placement, and ignoringOz,c, OD, andOz,w in some calculations.
During the experiment rust is seen in the drain for both shell and tube side. Making tube
resistanceaswellasfoulingresistanceapotentialfactor.
ModifiedWilsonPlotMethod
ThismethodreliesheavilyontheWilsonplotmethodbutinvolvesasimplevariation.An
adaptedversionoftheoriginalWilsonequationisfirstmanipulatedusinglogarithmstoobtain
thefollowing:
ln >f)Ä*#9
= ln >#:
+ t ∗ ;<(OP) (C-3.5)
Counter-Current 8170.52 3146.56 1085.37Co-Current -11811.44 2497.27 1386.26
ho(W/m^2K)
Uo(W/m^2K)
hi(W/m^2K)
25
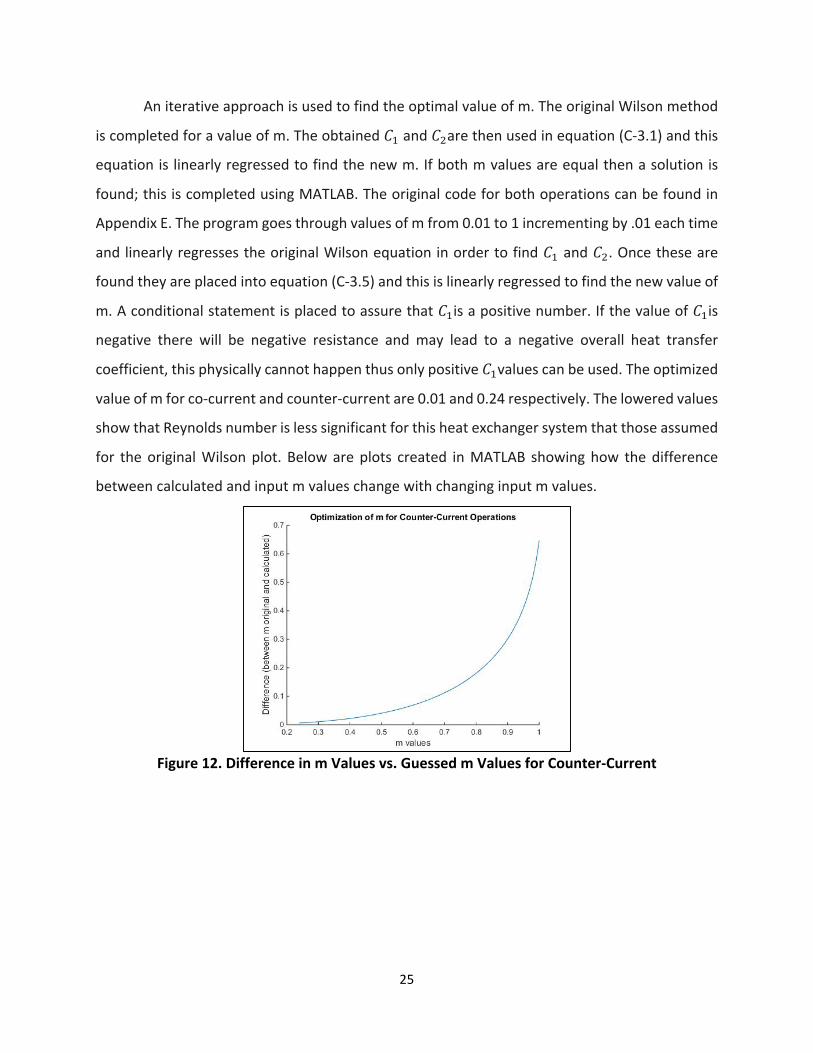
Aniterativeapproachisusedtofindtheoptimalvalueofm.TheoriginalWilsonmethod
iscompletedforavalueofm.Theobtained6>and68arethenusedinequation(C-3.1)andthis
equationis linearlyregressedtofindthenewm.Ifbothmvaluesareequalthenasolutionis
found;thisiscompletedusingMATLAB.Theoriginalcodeforbothoperationscanbefoundin
AppendixE.Theprogramgoesthroughvaluesofmfrom0.01to1incrementingby.01eachtime
andlinearlyregressestheoriginalWilsonequationinordertofind6>and68.Oncetheseare
foundtheyareplacedintoequation(C-3.5)andthisislinearlyregressedtofindthenewvalueof
m.Aconditionalstatementisplacedtoassurethat6>isapositivenumber.Ifthevalueof6>is
negative there will be negative resistance and may lead to a negative overall heat transfer
coefficient,thisphysicallycannothappenthusonlypositive6>valuescanbeused.Theoptimized
valueofmforco-currentandcounter-currentare0.01and0.24respectively.Theloweredvalues
showthatReynoldsnumberislesssignificantforthisheatexchangersystemthatthoseassumed
for theoriginalWilsonplot. Belowareplots created inMATLAB showinghow thedifference
betweencalculatedandinputmvalueschangewithchanginginputmvalues.
Figure12.DifferenceinmValuesvs.GuessedmValuesforCounter-Current

26
Figure13.DifferenceinmValuesvs.GuessedmValuesforCo-Current
Thefollowingmodifiedplotswereformedusingtheseoptimizedvalues:
Figure14.ModifiedWilsonPlotforCounter-CurrentOperations

27
Figure15.ModifiedWilsonPlotforCo-CurrentOperations
Usingequations(C-3.2),(C-3.3),and(C-3.4)valuesforℎw,ℎc,and2arecalculatedusingthe
modifiedmvalues:
Table11.LocalandOverallHeatTransferCoefficientsforModifiedWilsonMethod
ℎw iscalculatedtobe2464.64W/m2Kforcounter-currentand-159.18W/m2Kforco-current.ℎcis
calculatedtobe179803.68W/m2Kforcounter-currentand178.38W/m2Kforco-current.2is
calculatedtobe1317.97W/m2Kforcounter-currentand1387.89W/m2Kforco-current.Likethe
originalWilsonplotmethod,theslopeoftheco-currentlineofbestfitisnegative,thusleading
toanegativeinnerlocalheattransfercoefficient.InFundamentalsofHeatandMassTransfer,
typicalvaluesofforcedconvectionheattransfercoefficientsforliquidsrangefrom100to20,000
W/m2K(Incropera,2007).Thismatchesthevaluesforhointheco-currentandhiinthecounter-
current.AfterapplyingthemodifiedWilsonplotmethodthevalueof2forbothconfigurations
approachedamoresimilarvalue,howeverbothgrewfartherawayfromthe2calculatedthrough
heatandmomentumtransfer relations.2is similar forbothconfigurationswhichcontradicts
Counter-Current 2464.64 179803.68 1317.97Co-Current -159.18 178.38 1387.89
ho(W/m^2K)
Uo(W/m^2K)
hi(W/m^2K)

28
whatwouldbeexpected:counter-currenttohaveasignificantlylarger2thanco-current.This
maybe fromfactorssuchas thermocoupleplacement,and ignoringOz,c, OD, andOz,w insome
calculations.Duringtheexperimentrustisseeninthedrainforbothshellandtubeside,making
tuberesistanceaswellasfoulingresistanceapotentialfactor.

29
ErrorAnalysis
Theshellandtubeheatexchangerexperimentpresentsvariouspossiblesourcesoferror.
Thefirstglaringsourceoferrorcanbeseenintheanalysisofthetemperatureprofilecurves.
This error is discussed briefly in the discussion of the temperature profile curve results. A
thermocoupleworksbyproducingavoltagebetweentwounlikemetalswhentheyareheated
orcooled.Thisvoltageisthencorrelatedtoatemperatureandthistemperatureisoutput.There
isn’t any information available as to the last calibration of the thermocouples. If any of the
thermocouplesarenotcalibratedorhavenotbeencalibratedforanextendedperiodoftime,
theymayreadincorrecttemperatures.Theserecordedtemperaturesareusedineverymethod
ofdataanalysis.Iftheyareincorrectlydisplayedandrecorded,thisaffectsallofthecalculations
performed.Inaddition,thethermocouplesmaybemisplaced.Ifatubesidethermocoupleis
touchingthewallofoneofthetubes,itwillreadahighertemperaturebecauseofthehotliquid
intheshellsurroundingthecoppertubes.Ifathermocoupleoutsideoftheshellistouchinga
copperwall,itwillreadalowertemperature.Thisisbecausethecopperpipingoutsideofthe
shell is exposed to the laboratory air and not contained within the insulation of the heat
exchanger.Theassumptionthatthermocouple10ismisreadingtemperatureisappliedtothis
sectionaspreviouslymentionedintheheatandmomentumtransfercorrelationsectionofthe
resultsanddiscussion.
Foulingisanothersourceoferrorcertainlyinvolvedintheoperationoftheshellandtube
heatexchanger.Foulingistheaccumulationanddepositofunwantedmaterialsonsolidsurfaces,
whichinthiscasearethewallsofthecoppertubing.Thisdepositioncausesaddedresistanceto
thetransferofheat,whichreducestheheatexchangereffectivenessandefficiency(Bott,2006).
Foulingcalculationscanbeperformedusingratesofdepositionandremovalalongwithfouling
factorsandresistances.However,thesefoulingcalculationsarenotperformedorusedinany
methodof analysis. Therefore, the calculated values forheat transfer coefficients are larger
becauseofthedisregardedfoulingfactors.
Confidenceintervalcalculationsareperformedontheaverageheatfluxandoverallheat
transfercoefficientdataforbothco-currentandcounter-currentconfigurations.

30
Table12.ConfidenceIntervalCalculations
Aconfidencecoefficientischosenas1.96fortheproduced95%confidenceintervals.Itisfound
thatfortheco-currentdata,theoverallheattransfercoefficientisbetween1187.25and1349.69
W/m2Kwith95%confidenceandtheaverageheatflux isbetween28307.77and32415.28W
with95%confidence. It is found that for the counter-currentdata, theoverall heat transfer
coefficientisbetween793.89W/m2Kand879.62W/m2Kwith95%confidenceandtheaverage
heat flux is between 18508.42 and 30897.21Wwith 95% confidence. It is noticed that the
counter-current overall heat transfer coefficient has a smallermargin of error while the co-
currentaverageheatfluxhasasmallermarginoferror.Itisalsointerestingthattheaverageof
theoverallheattransfercoefficientis largerfortheco-currentconfiguration. This iscounter-
intuitivebecauseaccordingtotheory,thecounter-currentflowconfigurationshouldhavelarger
valuesfortheoverallheattransfercoefficient.Thisdiscrepancycouldbearesultofanyofthe
sourcesoferrordescribedlikethethermocoupleerror.

31
Conclusion
The purpose of the experiment is to determine the effect of flow rates and flow
configurationson theperformancecharacteristicsofa forcedconvection shell and tubeheat
exchanger.Thereareseveral limitingfactorsthathindertheabilitytoeffectivelyanalyzeheat
exchanger performance characteristics. The undersized pump and low city water pressure
prevents high flow rates to flow through the shell and tube heat exchanger. The inability to
achieveturbulentflowwithintheheatexchangerlimitseffectiveheattransferbetweentheshell
andtubebundle.WilsonandmodifiedWilsonplotassumeturbulentflowintheircalculations.
Generatingturbulentflowwouldallowformoreaccurateresultssuchaspositiveslopesforco-
currentoperations.Thermocouplereadingswouldbenefitfromturbulentmixingreducingthe
axialthermalgradient.Thermocouple10showstemperaturescoolerthanexpectedduetolack
of insulation. This effects calculations that depend on the results of the thermocouple. The
effectiveness/NTUmethoddeterminestheeffectivenessandefficiencyoftheshellandtubeheat
exchanger at varying flow rates. The counter-current flow configuration has a maximum
effectivenessof0.47withashellsideflowrateof9.46gpmandtubesideflowrateof2.97gpm.
Similarly,co-currentconfigurationhasthegreatesteffectivenesswhenthereisalargedifference
between the shell and tube flow rates. Co-current configuration reaches a maximum
effectivenessof0.43whentheshellsideflowrateis2.71gpmandtubesideflowrateis10.11
gpm. Counter-current shows a higher effectiveness than co-current and should be used for
optimaloperation.
TheheatandmomentummethodusesrelationshipsbetweenRe,Pr,andNutocalculate
convectiveheattransfercoefficients,whichareinturnusedtocalculatetheaverageoverallheat
transfercoefficient.Theaverageoverallheattransfercoefficientsforco-currentandcounter-
currentfloware1268.47and836.76W/m2Krespectively.Accordingtotheseaverages,theco-
currentconfigurationproducesahigherheattransfercoefficientthancounter-current.This is
contrarytoheatexchangertheory.
TheWilsonandmodifiedWilsonplotmethodcorrelatestheoverallthermalresistance
andReinordertocalculatetheaverageoverallheattransfercoefficient.ThroughtheWilsonplot
method,anoverallheattransfercoefficientforco-currentandcounter-currentarecalculatedto

32
be 1386.26 and 1085.37W/m2K respectively. The overall heat transfer coefficient using the
modifiedWilsonmethod is 1387.89 and 1317.97W/m2K for co-current and counter-current
respectively. Similar to the heat and momentum correlation theory results, theWilson and
modifiedWilsonmethodshowedhigherheattransfercoefficientsforco-currentflow.Thisisalso
contrarytoheatexchangertheory.
Uponanalysisof theresults, it isconcludedthat theexperimentshouldbeperformed
againusingrecommendationsstatedabove.This includesreplacingthermocouples, insulating
theheatexchangerarea,turbulentflowwithinboththeshellandtubeside,carefulmonitoring
of the water heater and increase number of experimental trails. This would allow formore
reliabledataandanalysis.

33
Recommendations
Theshellandtubeheatexchangerexperimentprovidedhandsonexperienceofacritical
industryprocess.Therewerenomajorincidentswhenperformingthelabbutthelabcouldhave
been completed more efficiently. A common problem experienced was the water heater
consistentlyoverheatingresultingittoautomaticallyshutoff.Coldwaterthenhadtobebled
intothewaterheatersothatitwouldcooldown.Thecoolwaterinthewaterheaterthenhadto
beheatedupagain.Thisprocessdelayedthelab25-30minuteseachtimeandpreventedsome
ofthelasttrailsincounter-currentoperationtobeconducted.However,theproblemcouldhave
beenavoidedifhigherflowratesintheshellandtubewereuseandconsistentmonitoringofthe
temperaturegaugeonthewaterheaterwasdone.
Another possible improvement could have been calibrating or replacing the
thermocouples prior to the preforming the experiment. It was discovered that some of the
temperaturereadingscollecteddidnotmakinglogicalsenseuponanalysis.Insomeofthetrials,
the temperature in the shell increasedafterpassing through the tubebundle.Thermocouple
errorcouldbeattributedtobeing incontactwiththecopperpipesor lackofaccuracytothe
thermocouple itself.Replacingandcorrectly installingnewthermocoupleswould improvethe
data collected from the heat exchanger. Insulation should be provided to surround the heat
exchangerareaaroundthermocouple10.Thiswouldeliminatethesignificanttemperaturedrop
andtheneedtoomititsvalueduringanalysis.
Also, one of the pressure gauges was not properly calibrated to zero resulting in an
estimationofpressuresandnotcertainvalues.Thepressuregaugeshouldbeproperlycalibrated
togivemoreaccuratedata.Infutureexperiments,datatablesandthedesignspaceshouldbe
constructedbeforepreformingthelab.Experimentequipmentshouldbecalibratedandworking
properlybeforethelabformoreaccurateresults.Theaboveimprovementsandplanswillmake
futureexperimentscompletedmoreefficientlyandwithmoreaccuratedata.

34
DesignExtension
The objectives of the design extension are to determine which shell and tube heat
exchangerBuckeyeFoodsInc.shouldselectforoptimumqualityaswellasminimizingcost.The
inputandoutputtemperaturesoftheheatexchangeraregiven:25°Cand85°Cforthecoldwater
input and output temperatures. The input temperature for the steam is 150°C for both co-
currentandcountercurrentflow.Theoutputtemperaturesforco-currentandcountercurrent
floware100°Cand40°Crespectively.Theinputsteampressureis125kPaandthemaximum
pressuredropinthetubesideis200Pawhilethepressuredropfortheshellsideisassumed
negligible.Themassflowrateofwateris12,000kg/hr.
Further objectives for the shell and tube heat exchanger are to determine which
combinationof tubebundles, tubediameter,and lengthofheatexchangerwillmaximizethe
overallheattransfercoefficientwhiletryingtominimizethesteamflowrateandareaoftheheat
exchanger. Thepossiblechoices fortubebundlesare400,450,and500tubes. Thepossible
diameters are 0.2, 0.3, 0.4, and 0.5 inches. Finally, the possibilities for length of the heat
exchangerare0.75,1.25,and1.75meters.
Theapproachofthisdesignextensionistoiterativelysolveforthetubebundle,diameter,
andlengthoftheheatexchanger.Inordertodothis,anexceldocumentisusedthatholdstwo
variablesconstantwhilevaryingthethirduntilallpossiblecombinationsaredocumented.Once
allofthecombinationsarelisted,thecrosssectionalsurfaceareaofeachpipeiscalculated.The
velocityisthendeterminedusingthemassflowratepertubeanddividingbythecrosssectional
areaofeachtube.Thevelocityofwaterina0.2inchdiametertubewithamassflowrateof
12,000kg/hrand400tubebundleis0.414m/s.
With a known velocity, theReynolds number is calculated from thedensity ofwater,
velocity,diameter,andviscosity.
Re = QRST
(C-2.1)
Thedensityandviscosityofwaterat25°Care993kg/m3and6.95E-04kg/m*srespectively(NIST,
2015).Thevelocitiesanddiameterswillvaryamongsttrials.Foradiameterof0.2inandvelocity
of0.414m/s,theReynoldsnumberis3010.

35
Thequalificationofapressuredropof lessthan200Pais importanttoselection. The
pressuredropisfoundusingtheMoodyfrictionfactor(É).Thisfrictionfactoriscalculatedfrom
theReynoldsnumberandthecorrespondingequationsforlaminar,intermediate,andturbulent
flows.AnassumptionoffullydevelopedflowisusedtoaccessthenecessaryMoodyequations
tocalculatefrictionfactor.
Fullydevelopedlaminarflow(Re<2100):É = ÑÖfG (C-4.1)
Fullydevelopedturbulentflow(2100<Re<20,000):É = 0.316Re*>/Ö (C-4.2)
For the previously calculated Reynolds number of 3010, the fully developed turbulent flow
equation is used and the Moody friction factor is 4.27E-02. This friction factor is used to
determinethechangeinpressureandinthiscasethepressuredropacrossthetubesideofthe
heatexchanger.
ΔP = − âvä:ä9
= É QR:
8S âãå:å9
= É QR:
8S(ã8 −ã>) (C-4.3)
Thepressuredropofthe0.2indiametertubewithalengthof0.75mandatubebundleof400
tubesis536.34Pa(Incropera,2007).
Thenextstepintheapproachistominimizethesurfaceareaoftheheatexchangerwhich
will inturndeterminetheoverallheattransfercoefficient. Thesurfaceareaistheinnertube
surfaceareamultipliedbythenumberoftubes.Foradiameterof0.2inches,alengthof0.75m
andatubebundleof400tubes,thesurfaceareaoftheheatexchangeris4.788m2.Thefluxof
theheatexchangerismodeledbytheequation,
q = UA < ΔT >^k (C-4.4)
Theareaisknown,thetemperaturesareknownsointurn<ΔT>LMcanbedetermined,but
theflux,q,isnotknownandisnecessarytodeterminetheoverallheattransfercoefficient,U.
Thefluxcanalsobemodeledbytheequation,
q = t6vu(1ì,î −1ï,w) (C-4.5)
wherethemassflowratetis12,000kg/hr,thespecificheatcapacityofwater,Cp,w,at25°Cis
4.184kJ/kg*Kandthetemperaturesofcoldoutputand inputare85°Cand25°Crespectively.
Thefluxisthencalculatedtobe836.8kW.

36
The <ΔT>LM can be calculated for co-current and counter current flows using the known
temperatureinputsandoutputs.
< ΔT >^k= ñ' ^ *ñ'(ó)
mn[òp hòp ô ]
(C-4.6)
Foraco-currentheatexchangerwithcoldinputandoutputtemperaturesof25°Cand85°C,along
withsteaminputandoutputtemperaturesof150°Cand100°C,the<ΔT>LMccis51.88K.Using
the<ΔT>LMalongwiththecalculatedareasandflux,theoverallheattransfercoefficientisable
tobecalculated.Fora<ΔT>LMof51.88K,anareaof4.788m2,andafluxof836.8kW,theoverall
heattransfercoefficientUccforco-currentflowis3.369kW/m2K.
The final requirement of choosing the appropriate heat exchanger is tominimize the
steamflowrate.
tö = 6vö(1b,w–1ïcúù) +ΔHRüä +6vu(1ïcúù–1b,c) (C-4.7)
Thespecificheatcapacityofsteam,Cps,at150°Cis2.0039kJ/kg*K.Theheatofvaporization,
ΔHvap, is 2257 kJ/kg. The specific heat capacity of water at 25°C is 4.184 kJ/kg*K. The
temperature that steamcondenses,Tcond, is99.6°C (NIST,2015).Thesteam inputandoutput
temperaturesareusedalongwiththeNISTreferencedvaluestodeterminetheamountofsteam
required.Forco-currentflow,usingthetemperaturesof150°Cand100°C,thesteamrequiredis
0.355kg/s.
Withallofthepressuredropscalculatedforeachcombinationoftubebundle,diameter,
andlength,theheatexchangersthatdonotmeetthespecifications,theoneswithapressure
dropofmorethan200Pa,areeliminated.Afterwards,thesurfaceareaoftheheatexchanger
andthesteamflowratesareanalyzed.Thesmalleststeamflowrateandsurfaceareaarethe
desiredobjectivesoftheheatexchangerandallothercombinationsarethendiscarded.
Thedesignextension isbasedon theexperimentGroup13performed that involvesa
forced convection shell and tube heat exchanger. This heat exchanger can be operated in
differentflowconfigurationsandwithdifferentdesignspecificationstoachievecertainoutput
temperatures. A shell and tube heat exchanger runs a cold fluid through the tubes of the
apparatus and a hotter liquid through the shell side of the apparatus. The particular heat
exchangerbeingusedinthisextensionvariesthenumberofcoppertubes.Inthisextension,the

37
twofluidsbeingusedarewaterandsteam.Thehotterfluidcomesintocontactwiththetube
pipesasitflowsandheattransferoccursbetweenthetwofluids.Thecolderfluidgainsheatand
thehotterfluidlosesheat.Operationcanoccurinco-currentorcounter-currentflowpatterns.
Inco-current flow, thetubeandshell liquids flow in thesamedirection,however incounter-
currentflow,thetubeandshellliquidsflowinoppositedirections.Theseconfigurationsleadto
differentoutputtemperaturesandthereforedifferentexperimentalresults.
ThesummaryoftheresultscanbeseeninTable13onthefollowingpage.Theseresults
include the surface areas, steam requirements, and pressure drops, as well as overall heat
transfer coefficients. The results cover all of the distinct possibilities for tube bundle size,
diameter,and lengthof theheatexchanger.Calculationconstants for theresult tablecanbe
foundinAppendixG.

38
Table13.DesignExtensionIterationsandConclusions

39
From the results in Table 13, it can be seen that due to themaximum pressure drop of an
allowable200Pa,noneoftheheatexchangerswithadiameterof0.2inchescanbeused.The
pressuredrops in the0.2 inchdiameterheatexchanger range from362.95Pa to1251.46Pa
whichisextremelyhighandoverthelimit.Consequently,alloftheheatexchangerswitha0.2
inchdiameterhaveaReynoldsnumberofover2100.Theyrangefrom2400to3010,meaning
thattheflowthroughthetubesisturbulent.Forthediametersof0.3,0.4,and0.5,thepressure
dropinthetuberangesfrom5.48Pato123.35Pa.Allofthesepressuredropsinthetubeare
acceptable, and the correspondingReynoldsnumber for thesediameters are less than2100.
Theyrangefrom962to2000,meaningthattheflowforthesediametersislaminar.Itcanbe
shownthatonlylaminarflowtubesareacceptableforthemaximumallowablepressuredrop.
Thenextthingthatisconsideredisthesurfacearea.Whileminimizingsurfacearea,it
canbeseenthattheheatexchangerwithadiameterof0.3inches,atubebundleof400tubes,
andlengthof0.75metershasthelowestsurfaceareaof7.182m2.Alongwiththelowestsurface
area,thesteamflowrateneedstobeminimized.WhenreferencingTable13,itisseenthatthe
steamflowrateonlychangeswiththedirectionofflow.Inthiscase,alowersteamflowrateis
observedforthecountercurrentheatexchangerwith0.321kg/sasopposedtoco-currentsteam
flowof0.351kg/s.Consequently,thecountercurrentheatexchangerfortheabovespecified
dimensions,hasthelargestoverallheattransfercoefficientwith3.417kW/m2K.
TherecommendationforBuckeyeFoodsInc.istopurchasetheheatexchangerwith400
tubesinthetubebundle,adiameterof0.3inches,andalengthof0.75metersusingcounter
current flow. This combination meets the specifications for the pressure drop, minimizing
surfacearea,andminimizingsteamflowrate.Theflowinthetubewillbelaminar.Thepressure
dropinthetubeis52.86Pa.Thesurfaceareais7.182m2andthesteamflowrateis0.321kg/s.
Italsohasthehighestoverallheattransfercoefficientof3.417kW/m2K.Theheatfluxdoesnot
changethroughoutheatexchangers,buttheoverallheattransfercoefficientdoes.Alongwith
having the lowest surfacearea, thecorrespondingheat transfer coefficient is the largestand
mosteffective.Thisspecificheatexchangermeetsallofthespecificationsandcompletesallof
theobjectives.

40
The importanceofthedesignextension istorelatetheshellandtubeheatexchanger
experiment to industry and to scale-up the operation. In this case, determining which
combinationofmaterialsisthedesiredinformation.Bycalculatingandminimizingthesurface
areaandsteamflowrate,thiswillreducetheamountofmaterialneeded,inthisinstancecopper
andsteam.LimitingtheamountsofthesematerialswillreducecostandthereforesaveBuckeye
Foods Inc.money. Alongwith these calculations the heat exchanger needs to be themost
effectiveinordertogettheoptimalresultsfortheamountofmoneyspent.Thiswillincrease
overallprofit.Inthiscase,thehighestoverallheattransfercoefficientisdesiredwhichiswhy
thecountercurrentheatexchangerischosen.
41
NotationEnglishSymbols:
A Surfaceareaoftubes m2
Acs Crosssectionalareaoftube m2
Ai Thewettedsurfaceareaontheinsideofacoppertube m2
Ao Thewettedsurfaceareaontheoutsideofthecoppertube m2
C1 Wilsonmethodconstant K/WC2 Wilsonmethodconstant K/WCp,s Specificheatcapacityofsteam kJ/kg*KCp,w Specificheatofwater J/kg*KCmin Minimumflowrate gal/minCr Flowrateratio(min/max) DimensionlessD Diameter mDi Innertubediameter mDo Outertubediameter mDe Didyoucatchthisy/n DimensionlessE Efficiencyofheatexchanger DimensionlessFi Tubeflowrate gal/minFo Shellflowrate gal/min4 Moodyfrictionfactor Dimensionless
ΔHvap Heatofvaporizationofwater kJ/kghi Convectiveheattransfercoefficientontheinnertubesurface W/m2*Kho Convectiveheattransfercoefficientontheoutertubesurface W/m2*Kk Thermalconductivityofwater W/m*KL Length mm Wilsonconstant Dimensionlessmi Tubemassflowrate kg/smo Shellmassflowrate kg/s<w Massflowrateofwater kg/hr<s,cc Massflowrateofsteaminco-current kg/s<s,xc Massflowrateofsteamincounter-current kg/s
n Samplesize DimensionlessNu Nusseltnumber Dimensionless
NTU NumberofTransferUnits DimensionlessΔP Pressuredropintube PaPr Prandtlnumber Dimensionlessq Heatflux kW/m2
qavg Averageheatflux kW/m2qshell Heatflux(outertubeside) kW/m2qtube Heatflux(innertubeside) kW/m2Rf,i Innerfoulingresistance K/WRf,o Outerfoulingresistance K/W

42
Rov Overallthermalresistance K*m2/kWRt Tuberesistance K/WRe Reynoldsnumber Dimensionless
Tcond Temperaturethatsteamcondenses KTc,i Temperatureofcoldwaterinput KTc,o Temperatureofcoldwateroutput KTh,i Temperatureofhotwaterinput K
Th,o,cc Temperatureofhotwateroutputforco-current KTh,o,xc Temperatureofhotwateroutputforcounter-current K
Ti Innertubetemperature KTo Outertubetemperature KTS,i Temperatureofwateratshellinput KTS,o Temperatureofwateratshelloutput KTT,i Temperatureofwaterattubeinput KTT,o Temperatureofwaterattubeoutput KΔTLM Logmeantemperaturedifference K
<ΔT>LM,cc Logmeantemperaturedifferenceforco-current K<ΔT>LM,xc Logmeantemperaturedifferenceforcounter-current K
U Overallheattransfercoefficient W/m2*KUcc Overallheattransfercoefficientforco-current kW/m2*KUxc Overallheattransfercoefficientforcounter-current kW/m2*Kv Fluidvelocityinasingletube m/sO Statisicalmean various
zα/2 Confidencecoefficient DimensionlessGreekSymbols:
ρ Densityofwater kg/m3
µ Viscosityofwater kg/m*sσ Standarddeviation variousϵ Effectivenessofheatexchanger Dimensionless

43
LiteratureCited
[1]Fernandez-Seara,Jose."AGeneralReviewoftheWilsonPlotMethodandItsModifications
toDetermineConvectionCoefficientsinHeatExchangeDevices."AppliedThermalEngineering
(2006).ScienceDirect.Web.<http://fafnir.rose-
hulman.edu/~richards/courses/me462/ME462_Spring_2007-2008/Wilson_plot_method.pdf>.
[2] Fernández-Seara,José,FranciscoJoséUhía,JaimeSieres,andAntonioCampo."Experimental
ApparatusforMeasuringHeatTransferCoefficientsbytheWilsonPlotMethod."European
JournalofPhysics(2005):N1-N11.Print.
[3]"CorrelationsforConvectiveHeatTransfer."ChemicalEngineering,TheChemicalEngineers'
ResourcePage,Distillation,HeatTransfer,Design,SpreadsheetSolutions,Departments,
Chemistry.Web.16June2010.<http://www.cheresources.com/convection.shtml>.
[4]Incropera,FrankP.FundamentalsofHeatandMassTransfer.Hoboken,NJ:JohnWiley,
2007.Print.
[5]E.W.Lemmon,M.O.McLindenandD.G.Friend,"ThermophysicalPropertiesofFluid
Systems"inNISTChemistryWebBook,NISTStandardReferenceDatabaseNumber69,Eds.P.J.
LinstromandW.G.Mallard,NationalInstituteofStandardsandTechnology,GaithersburgMD,
20899,http://webbook.nist.gov,(retrievedFebruary13,2015)
[6]Denney,Michael.ShellandTubeHeatExchangerOperatingProcedure.OhioStateU,2015.
Print.
[7]"ChBE521HeatExchangers."OSUCarmen.JohnClay.Web.1Feb.2015.
[8]Bott,Theodore."FoulingofHeatExchangers."EncyclopediaofChemicalProcessing.Vol.10.
Birmingham:Taylor&Francis,2006.1043-1052.Print.

44
AppendixA-PreliminaryPreperationAssignmentExperimentIntroduction
Theexperimentbeingperformedinvolvesaforcedconvectionshellandtubeheatexchanger.Thisheat
exchangercanbeoperatedindifferentflowconfigurationsandatdifferentflowratestoachievecertain
outputtemperatures.Operationcanoccurinco-currentorcounter-currentflowpatterns.These
configurationswillleadtodifferentoutputtemperaturesandthereforedifferentexperimentalresults.
Theflowrateswillalsobevariedthroughouttheexperimentreachingamaximumof10GPMand6.6
GPMfortheshellandtubesidesrespectively.Theseparameterswillbechangedoverthecourseofthe
experimentinordertoevaluatetheshellandtubeheatexchangerperformance.Resultsobtainedwill
includetheshellandtubesideflowrates,allthermocouplereadings,andtubeandshellsidepressure
readings.Inordertoevaluatethisperformance,theeffectiveness,overallheattransfercoefficient,and
innerandouterconvectiveheattransfercoefficientswillbecalculatedforbothco-currentandcounter-
currentconfigurations.Enoughdatamustbecollectedinordertoaccuratelyevaluatetheperformance
indicatorsmentionedabove.Itissuggestedthattentotwentydatapointsbeacquiredforeach
configuration.Thedatamaythenbeanalyzedusingfivedifferentmethods.Thesemethodsinclude
WilsonPlotMethod,ModifiedWilsonPlotMethod,HeatandMomentumTransferCorrelations,
Effectiveness-NTUMethod,andproducingplotsofthetemperatureprofiles.Eachmethodhasdifferent
theories,assumptions,andanalyticalproceduresthatneedtobeexaminedandusedeffectivelyby
referringtothereferencedliterature.
SafetyHazardsandPrecautions
1) Hotpipesandhotwaterleaks
- Donottouchapparatuswithoutthermalgloves
2) Fallingobjects
- Wearhardhatandclosedtoedshoes
3) Slipperyconditionsfromleaksinequipment
- Wearclosedtoedshoeswithgoodtraction
- Cleanupleaksimmediately
4) Pressurebuildupintubes
- Befamiliarwithproceduretoavoiderrorsinvalveopeningsandclosingsthatcouldcause
pressurebuildup

45
- Wearsafetyglasses,hardhat,closedtoedshoes,longpantsandshirttoavoidleaksorpipes
burstingtoduepressure
5) Overheatingtheheater
- Alarmwillsound
- Donotrunheaterforextendedperiodoftimewithoutrunningcoldwaterthroughcold
tubeside
InformativeFlowSheet
Seeattachedcarbonpapersheetforexperimentflowvisual.
ExperimentalPlan
I. SequenceofOperations
• ThedocumentE-2ShellandTubeHXOperatingProcedure2014willbefrequently
referenced.Itisrecommendedtobringacopyofthisdocumenttothelaboratory.
• Followthetubesideoperationprocedureinordertosuccessfullybeginwaterflowthrough
thetubesideoftheheatexchanger.
o Initiallysettheflowrateto2.0GPM
o Donotlettheflowrateexceed6.6GPM
• Followtheshellsideoperationprocedureinordertofilltheshellsideandremoveallair
withinthesystem.
o Assurethattherearenobubbleswithintheflowmeter
o Setshellsidepressureto25psibyslowlybleedingoffpressurewiththedrainor
purgevalve
• Followtheco-currentoperationproceduretosettheHXintheco-currentposition
o Adjustshellsideflowrateto7GPM
o Donotlettheflowrateexceed10GPM
• Completethefollowingsetofadjustmentstothetubesideflowrate
o Settheflowratetothefollowingsetofpoints.Waitforsteadystatetobeachieved
andcollectconsistentshellsideflowrates,tubesideflowrates,allthermocouple
readings,tubesidepressurereadings,andhellsidepressurereadings.
o 2.0,2.5,3.0,3.5,4.0,4.5,5.0,5.5,6.0,6.5(GPM)

46
• Toanalyzeunsteadystateflowchangeintheco-currentconfigurationthetubesideflow
rateto1GPMandtheshellsideflowrateto3.5GPM
• Followthecounter-currentoperationproceduretosettheHXinthecounter-current
position
o Adjustshellsideflowrateto7GPM
o Donotlettheflowrateexceed10GPM
o Keeptheflowrateabove2GPM
• Completethefollowingsetofadjustmentstothetubesideflowrate
o Settheflowratetothefollowingsetofpoints.Waitforsteadystatetobeachieved
andcollectconsistentshellsideflowrates,tubesideflowrates,allthermocouple
readings,tubesidepressurereadings,andhellsidepressurereadings.
o 2.0,2.5,3.0,3.5,4.0,4.5,5.0,5.5,6.0,6.5(GPM)
• Toanalyzeunsteadystateflowchangeinthecounter-currentconfigurationthetubeside
flowrateto1GPMandtheshellsideflowrateto3.5GPM
• Completethepropershut-downprocedurewithdrainingwaterintheshellside
II. ResponsibilityAssignments
GroupLeader:ConorHughesisresponsibleformanagingallaspectsoftheexperimentincluding
planning,preparation,execution,analysis,design(orotherextensionofthedata),andreport
preparationanddelivery.Heisresponsibleformitigatinganyinternalissues.
DesignEngineer:DrewShortisresponsibleforthedesignextensionportionofthelaboratory.
Hemustfamiliarizehimselfwiththeequipmentinordertocompletethistask.
OperationsEngineer:KyleHofacreisresponsibleforpreparingexcelspreadsheetsanda
laboratorynotebookpriortothelab.Heisalsoresponsibleforrecordingalldatatakenduring
theexperimentandcreatingthecorrespondinggraphs.
DevelopmentEngineer:ScottReinhartisresponsibleforcompletingdataanalysis.Thisincludes
statisticalcomparisonsandapplyingtheoreticalknowledgetothedataset.

47
QualityEngineer:HusseinAlkhatibisasupporttoConorHughes,thegroupleader.Heis
responsibleforhelpingwithanyassistanceneeded.Alsoheisresponsibleformanagingthe
transitiontoanewexperiment.
III. PreparedDataSheets
DataspreadsheetsarepreparedinanExcelformat.
IV. MaterialSupplyChecklist
• HampdenModelH-6850-40ShellandTubeHeatExchanger
o 112CopperTubes
§ InnerTubeDiameter=0.21in
§ TubeThickness=0.02in
§ TubeLength=14in
• Flatheadscrewdrivertoreleaseairthrough“bleedairout”valve
• Inletcitywaterforhotandcoldinlets
• Thermalgloves
V. PersonalProtectiveEquipment(PPE)
• Hardhat
• Safetygoggles/glasses
• Closed-toedshoes
• Longpantsandshirt
• Thermalgloveswhenoperatingvalves
ExperimentPermissionForm
Seeattachedform.

48
AppendixB–ExperimentalSummaryReport
ExperimentSummaryReportExperimentNo.2
SHELL&TUBEHEATEXCHANGER
TheOhioStateUniversityChemicalEngineeringUnitOperationsSpring2015
Group13 GroupLeader–ConorHughes X
OperationsEngineer–KyleHofacre X
DesignEngineer–DrewShort X
DevelopmentEngineer–ScottReinhart X
QualityEngineer–HusseinAlkhatib X
TA:MichaelDenney

49
ExperimentalObservationManyobservationsandconclusionscanbemadefromapreliminaryassessmentofthedata
acquiredintheshellandtubeheatexchangerlab.Thetemperatureprofilesweregraphedforco-
currentandcounter-currentoperationaswellasunsteadystateoperation.Itwasexpectedthat
thesegraphswouldlooklikeFigure1inthelabproceduredocument,howevertheydeviatedfrom
theexpectedshape.Bothgraphsfollowedexpectedtrendsfortheshellside,butdidnotforthe
tubeside.Itcanbehypothesizedthatthisisduetothelocationofthethermocouplesandthelack
ofinsulationoneithersideofthetubes.Thenon-steadystatetemperatureprofileappearedas
expectedwithtemperaturesfluctuatingwithtime.Theheatfluxeswerealsocalculatedforevery
trial.Forthemostparttheseappearedasexpectedwithhighervaluesofheatfluxforcounter-
currentflowascomparedtoco-currentflow.However,thelasttwotrialsforco-currentflowhad
heatfluxvaluesofzero.Thisisnotpossible,asthetubeexittemperatureofwaterwouldhaveto
behigherthantheshellenteringtemperatureofwater.Itwasconcludedthatthismusthavebeen
theresultoffaultythermocouplereadings.Thesepreliminaryobservationsmayormaynotbe
validatedbyfurtherexplorationintoerroranalysis.
ExperimentDifficultiesSeveraldifficultieswereexperiencedwhenpreformingtheshellandtubeheatexchangerlab.The
mostprominentproblemwasthewaterheateroverheating.Whenlowflowrateswerebeing
tested,thewaterheatertendedtoreachhighertemperaturescausingittooverheat.Therewere
alsoperiodsoftimewhenthegroupwasdistractedfromthelabandthewaterheaterwouldover
heat.Restartingthewaterheaterrequiredittocooldownandthenheatbackupagaintoperform
thenexttrail.Thisseriesofeventstookuptoahalfhourcausingthelabtogolongerthanneeded.
Also,valveswerenoticedleakingbutitwasdeterminedthattheleakswouldnothaveasignificant
impactonthelab.Anotherdifficultyinlabwasthepressuregaugeontheleftshellsideoftheheat
exchangerwasnotproperlycalibratedtozero.However,thegaugeworkedproperlyafter
subtractingapproximatelythreepsioffthepressurereading.Trailsforthelabwererandomly
selectedatvariousflowrates.Thetargetflowratesvariedonthemetersoanaveragewas
determinedandaplusorminusfactorweretakenintoaccountwhenrecording.

50
ExperimentalRawData
Co-CurrentFlow
Number'of'Tubes 112 tubes Intermediate'Data: 1000 kg/m^3 Gallon'>>'m^3 0Inner'Tube'Diameter 0.21 inches 0.65 W/m*K in'>>'m 0.03Thickness'of'Tube 0.02 inches 4.18 J/g*K min'>>'s 0.02Tube'Length 14 inches 0 kg/m*s
1
Material'Parameters: Water'DensityThermal'ConductivitySpecific'HeatViscosityμb/μw
Shell%Side Tube%SideTube%Left
Tube%Right
Shell%Left**
Shell%Right #1 #2 #3 #4 #10 #5 #6 #7 #8 #9
1 9:01 2.16 6.50 40 44 29 30 12.78 41.67 43.33 43.89 23.33 76.11 65.00 52.78 49.44 44.442 9:14 3.02 6.00 42 46 29 28 12.78 43.33 45.00 46.11 24.44 70.56 63.33 53.89 51.11 47.223 9:21 4.01 5.50 44 48 29 27 12.78 44.44 45.56 47.78 25.56 66.11 61.67 54.44 52.22 48.894 9:28 9.54 6.00 42 46 29 28 13.33 42.22 43.89 45.56 25.00 56.67 54.44 52.22 51.11 49.445 9:35 8.08 3.52 49.5 52 29 28.5 13.33 48.33 49.44 52.78 32.78 61.67 59.44 56.67 55.56 53.336 9:41 8.50 5.53 44 46 29 28 13.33 43.89 45.00 47.22 26.11 58.89 56.67 53.33 52.78 50.567 9:47 7.05 4.50 46.5 50 29 28 13.33 45.56 47.22 50.00 28.89 61.11 58.33 55.00 53.89 51.678 10:38 5.62 4.59 46 50 28 27.5 14.44 47.22 48.33 51.11 30.00 64.44 61.11 56.67 55.00 52.229 10:44 5.53 4.02 48 50 28 27.5 14.44 49.44 50.00 52.78 32.22 67.78 63.89 58.33 56.67 53.3310 10:50 9.47 3.00 50 52 30 29 15.00 53.33 53.33 57.22 37.78 64.44 62.78 60.00 59.44 57.2211 11:24 3.30 3.75 48 52 26.5 26.5 15.00 47.78 48.33 51.11 31.67 70.00 64.44 57.78 53.89 50.00
Time
Thermocouple+Readings+(°C)
Tube+Side Shell+SidePressure+(psi)Flow+Rate+(GPM)
Run%#

51
Counter-CurrentFlow
Re Pr ψ
Nu(Re)<)2030) h ΔTL ΔT0 ΔTLM
Shell)Side
Tube)Side
1408.57 3.22 4.08 9.11 1117.68 0.56 63.33 13.25 14.81 2.43 6.29 0.13311301.82 3.22 3.98 8.88 1088.70 1.11 57.78 14.34 15.61 3.31 5.81 0.12301195.07 3.22 3.86 8.63 1058.09 1.11 53.33 13.49 14.27 4.32 5.34 0.11291301.82 3.22 3.98 8.88 1088.70 3.89 43.33 16.36 17.81 9.99 5.81 0.1230772.34 3.22 3.34 7.46 914.80 0.56 48.33 10.70 9.79 8.49 3.45 0.07301201.48 3.22 3.87 8.64 1059.98 3.33 45.56 16.15 17.11 8.92 5.36 0.1135981.57 3.22 3.62 8.08 990.91 1.67 47.78 13.74 13.62 7.44 4.38 0.09271000.79 3.22 3.64 8.13 997.33 1.11 50.00 12.84 12.81 5.97 4.47 0.0946879.09 3.22 3.49 7.79 955.15 0.56 53.33 11.56 11.04 5.88 3.92 0.0831661.32 3.22 3.17 7.08 868.69 0.00 49.44 0.00 0.00 9.91 2.95 0.0625821.45 3.22 3.41 7.61 933.79 A1.11 55.00 0.00 0.00 3.59 3.67 0.0776
Tube)Velocity)(m/s)
Calibrated*Flow*Rate*
Heat)Flux)
(kW/m^3)
Shell%Side Tube%Side Tube%LeftTube%RightShell%Left Shell%Right #1 #2 #3 #4 #10 #5 #6 #7 #8 #9
1 11:42 9.08 5.97 42 44 29.5 27.5 15.00 40.56 45.00 47.22 26.67 48.33 51.11 53.89 55.00 56.672 11:47 7.08 3.56 49 52 29.5 27 15.00 46.67 50.00 55.00 34.44 52.22 55.56 59.44 60.56 62.783 12:24 5.56 5.48 44 46 28 25.5 14.44 40.56 45.00 48.33 27.22 47.22 51.11 55.56 57.22 60.004 12:32 3.05 6.01 42 45 28 25 14.44 37.78 44.44 47.78 26.11 43.33 50.00 57.78 62.22 66.675 12:38 6.11 4.49 46 50 28.5 25.75 14.44 43.33 47.22 51.67 30.00 49.44 53.33 57.22 58.89 61.676 12:44 8.04 4.48 46 48 28.5 26.25 14.44 42.22 46.67 50.00 28.89 49.44 52.78 55.56 56.67 58.897 12:50 5.04 4.08 48 50 28 25.5 14.44 43.33 48.33 52.78 31.67 49.44 53.89 58.33 60.56 63.898 12:56 9.03 3.02 50 52 29 27 14.44 48.89 52.22 57.22 37.22 54.44 56.67 60.00 60.56 62.78
Tube%Side Shell%Side
Run%# Time
Flow%Rate%(GPM) Pressure%(psi)
Thermocouple%Readings%(°C)

52
Non-SteadyState
Re Pr ψ
Nu(Re)<)2030) h ΔTL ΔT0 ΔTLM
Shell)Side
Tube)Side
1295.42 3.22 3.97 8.86 1086.91 9.44 33.33 18.94 20.59 9.52 5.78 0.1224780.88 3.22 3.35 7.49 918.16 7.78 37.22 18.81 17.27 7.47 3.49 0.07381190.80 3.22 3.86 8.62 1056.83 11.67 32.78 20.44 21.60 5.91 5.32 0.11251303.96 3.22 3.98 8.88 1089.30 18.89 28.89 23.54 25.64 3.34 5.82 0.1232979.44 3.22 3.62 8.07 990.19 10.00 35.00 19.96 19.76 6.47 4.37 0.0925977.30 3.22 3.61 8.07 989.47 8.89 35.00 19.05 18.85 8.45 4.36 0.0923891.90 3.22 3.51 7.82 959.76 11.11 35.00 20.82 19.98 5.38 3.98 0.0843665.59 3.22 3.18 7.10 870.55 5.56 40.00 17.45 15.19 9.46 2.97 0.0629
Calibrated*Flow*Rate*Tube)
Velocity
Heat)Flux)
(kW/m^3)
Time Tube Shell
0 121 13710 127 14020 130 14130 132 14340 133 14450 135 14660 138 14770 139 14980 140 15090 142 151
100 143 152110 144 153120 145 155

53
TemperatureProfiles
Figure1.Temperatureprofileforrun3ofco-currentoperation
Figure2.Temperatureprofileforrun3ofcountercurrentoperation

54
Figure3.Temperatureprofilenon-steadystateoperation

55
AppendixC–ReportFormulasEffectiveness-NTUMethod
! =#$∗('$,)*'$,+)
#-+.∗('/,+*'$,+) (C-1.1)
012 = − 1 + 678 *9:;<
=*>
=?> (C-1.2)
@ =A:*(>?#B)
(>?#B:)9/: (C-1.3)
2DEFG =#-+.∗H'I
JKLMN (C-1.4)
67 =#-+.
#-OP (C-1.5)
HeatandMomentumTransferCorrelation
QR =STU+V
(C-2.1)
W7 =#X,YV
Z (C-2.2)
0[ = 1.953 QRW7U+`
>/a (C-2.3)
0[ =b+U+Z (C-2.4)
∆1̀ d ='e,)*'e,+ *('f,)*'f,+)
ghfe,)ife,+(ff,)iff,+)
(C-2.5)
QjT =∆'klm
=>
b)J)+
>
b+J+ (C-2.6)
no =p q.a∗>ris S(')*'+)#X,Y
(>>8)(>rrr)tU+` (C-2.7)
2u' =>
9/)v)
?9
/+v+
(C-2.8)
Wilson/ModifiedWilsonPlotMethod
QjT = 6> + 68>
wG- (C-3.1)
ℎj =>
#9∗J) (C-3.2)

56
ℎo = (wGOz{)-
#:J+ (C-3.3)
2 =>
[9
/+v+?
9/)v)
]Jf (C-3.4)
ln>
w)z*#9= ln
>
#:+ Ä ∗ ;<(QR) (C-3.5)
ExperimentDesignExtension
Fullydevelopedlaminarflow(Re<2100):Å = qÇ
wG (C-4.1)
Fullydevelopedturbulentflow(2100<Re<20,000):Å = 0.316Re*>/Ç (C-4.2)
ΔP = − âäã:ã9
= ÅST:
8U âå
ç:ç9
= ÅST:
8U(å8 −å>) (C-4.3)
q = UA < ΔT >`d (C-4.4)
q = Ä6äî(1ï,ñ −1ó,o) (C-4.5)
< ΔT >`d= ò' ` *ò'(r)
gh[ôf kôf ö
] (C-4.6)
Äõ = 6äõ(1b,o–1ójùû) +ΔHT†ã +6äî(1ójùû–1b,j) (C-4.7)
ErrorAnalysis
å = ç
ù (C-5.1)
° = (ç*ç):
ù*> (C-5.2)
6¢ = å ± §•/8 ∗¶
ù (C-5.3)

57
AppendixD–SampleCalculations
Effectiveness-NTUMethod
CalculatingHeatCapacityRates
Ä = 10ß®©6ã = 4180
¨ß®≠
6ó = 10ß®©∗ 4180
¨ß®≠
= 41800Æ≠
Ä = 8ß®©6ã = 4180
¨ß®≠
6Øoù = 8ß®©∗ 4180
¨ß®≠
= 33440Æ≠
CalculatingEffectiveness:
1ó,j = 296.48≠1ó,o = 285.93≠1b,o = 349.29≠
! =41800
Æ≠ ∗ (296.48≠ − 285.93≠)
33440Æ≠ ∗ (349.29≠ − 285.93≠)
= .21
67 =33440
Æ≠
41800Æ≠
= .8
CalculatingEfficiency:
@ =
2. 21 − (1 + .21)
(1 +. 218)>/8= 8.14
CalculatingNumberofTransferUnits(NTU):
012 = − 1 +. 218 *>8;<
8.14 − 18.14 + 1
= .25
HeatandMomentumTransferCorrelation
CalculatedReynoldsnumber:
QR =
989.83ß®Äa ∗ .15
Ä© ∗ .21±< ∗
.0254ı<
. 00058ß®Ä ∗ ©
= 1327.71

58
CalculatedPrandtlnumber:
Pr =4066
¨ß® ∗ ≠ ∗ 0.00058
ß®Ä ∗ ©
0.63842Æ
Ä ∗ ≠
= 3.69([<±¥;R©©)
CalculatedNusseltnumber:
0[ = 1.953 ∗ (1327.71 ∗ 3.69 ∗ .21±<
14±<)>a = 8.18
Calculatedconvectiveheattransfercoefficient(inner):
ℎo =8.18 ∗ 0.63842
ÆÄ ∗ ≠
. 21±< ∗ .0254ı<
= 979.32Æ
Ä8≠
Calculatedconvectiveheattransfercoefficient(outer):
ℎj =>
r.rrrµq8∂∑*
ö.∏π-:
π∏π.∫:∑
-:∂∗ö.ª∏-:
= −1529.13º
Ø:Ω
Wilson/ModifiedWilsonPlotMethodPhysicalpropertiesofwaterat45oC:
æ = 989.83ß®Äa ß = .6384
ÆÄ ∗ ≠
6ã = 4066¨
ß® ∗ ≠ø = .00058
ß®Ä ∗ ©
Physicalpropertiesoftubeandshellside:
¿o = .21±<¿j = .25±<uo = .67Äauj = .79Äa¡ = 14±<Collecteddatafromcounter-currentrun#1:
¬o = 5.78®√;ı<
¬j = 9.52®√;ı<
1b,o = 329.82≠1b,j = 321.48≠1ó,o = 288.15≠1ó,j = 320.37≠Calculatedmassflowrate:
Äo = 5.78®√;ı<
∗. 0038Äa
®√;∗. 0167ı<
©Rƒ∗989.83ß®
Äa = .36ß®©Rƒ
Äj = .60ß®©Rƒ

59
Calculatedtubevelocity:
≈ =
5.78®√;ı< ∗
. 0038Äa
®√; ∗ . 0167ı<
©Rƒ
(∆ ∗ (. 21±< ∗
.0254ı<
2 )8 ∗ 112¥[«R)
= .15Ä©
Calculatedtubeandshellheatflow:
nDEFG = .36ß®©Rƒ
∗ 4066¨ß® ∗ ≠
320.37≠ − 288.15≠ = 47319.81ÆnõbG»» = 20133.71Æ
Calculatedaverageheatflow:
n†T… = 12632.31Æ + 48844.93Æ
2= 33726.76Æ
Calculatedlogmeantemperature:
∆1̀ d = 329.82≠ − 320.37≠ − (321.48≠ − 288.15≠)
ln[329.82≠ − 320.37≠321.48≠ − 288.15≠]
= 18.94≠
Calculatedoverallresistance:
QjT =18.94≠
30738.62Æ= .00062
≠Æ
CalculatedReynoldsnumber:
QR = π π. ∫À{
-∫ ∗.>µ-Ã∗.8>où∗
.ö:sÕ-+.
.rrrµŒÀ{-∗Ã
=1327.71
Calculated >
wG-:
>
wG-=
>
>a8œ.œ>. =0.0032
Wilsonplotconstants(linearregression):
68 = .055Ω
º6> = .0004
Ω
º
Calculatedlocalheattransfercoefficientforoutertube:
ℎj = 1
. 0004≠Æ ∗ .79Ä8
= 3146.56Æ
≠ ∗ Ä8

60
Calculatedlocalheattransfercoefficientforinnertube:
ℎo = 8.65
. 055≠Æ ∗ .67Ä8
= 8170.52Æ
≠ ∗ Ä8
Calculatedoverallheattransfercoefficient:
2 =>
9
9∏ö.s:∑
∂∗-:∗.ª∏-:?
9
∫9Õª.sª∑
∂∗-:∗.∏π-:∗[.œ–Ø:?.qœØ:]
=1085.37 º
Ω∗Ø:
ExperimentDesignExtension
Calculatingvelocityinasingletube:
uóõ = π(0.2±<1
x2.54ƒÄ1±<
x1Ä
2.54ƒÄx12)8 = 2.03x10*µÄ8
v = 12,000ß®
ℎ7x
Äa
993߮x
1(∆/4)(0.00508Ä)8
x1ℎ73600©
x1
400¥[«R©= 0.414m/s
Calculatingpressuredropinthetube:
Re = (993ß®/Äa)(
0.414Ä© )(0.00508Ä)
6.95å10*ÇZ…Ä − ©
= 3.01x10a
Å = 642000
= 3.19x10*8
Å = 0.316(3010)*>/Ç = 4.27x10*8
ΔP = − âäã:
ã9
= Åæ≈8
2¿ âå
ç:
ç9
= 4.27x10*8(993ß®/Äa)(
0.414Ä© )8
2(0.00508)(0.75m − 0m)
= 536.34Pa
Calculatingoverallheattransfercoefficient:
u = ∆0.2±<1
x2.54ƒÄ1±<
x1Ä
2.54ƒÄ)x0.75mx400tubes = 4.788Ä8
< ΔT >`d=(373.15≠ − 358.15≠) − (423.15≠ − 298.15≠)
ln[(373.15≠ − 358.15≠)(423.15≠ − 298.15≠)]
= 51.88K

61
n =12,000ß®
ℎ7å
1ℎ73600©
å(4.184kJ/kg ∗ K)(358.15K– 298.15K) = 836.8kW
2 =836.8ßÆ
(4.788Ä^2)(51.88≠)= 3.369kW/Ä8K
Calculatingsteamflowrate:
Äõ = 2.0039kJ/kg ∗ K(423.15K– 372.75K) + 2257kJ/kg + 4.184kJ/kg
∗ K(372.75K– 373.15K) = 0.355kg/s
ErrorAnalysis
Calculatingconfidenceinterval:
6¢ = 836.36Æ
Ä8 ∗ ≠± 1.96 ∗
61.85Æ
Ä8 ∗ ≠8
6¢ = 836.36Æ
Ä8 ∗ ≠± 42.86
ÆÄ8 ∗ ≠

62
AppendixE–MATLABCodeCo-CurrentOperation(WilsonPlot)clear all clc %For co-current operations Rov = [0.0003831 0.0004170 0.0004068 0.0004968 0.0004075 0.0004965 0.0004687 0.0004272 0.0003870 0.0004088 0.0005044 0.0004919 0.0005403 0.0005391 0.0004841 0.0004787]'; %enters Rov data Re = [1443.69 1334.28 1224.86 1334.28 791.60 1231.43 1006.04 1025.74 901.01 2428.39 1809.12 1809.12 2428.39 2428.39 1809.12 2428.39]'; %Enters Re data

63
j=1; %creates index variable j for i = 0.01:.01:1 p = polyfit(1./(Re.^i),Rov,1); %linearly regresses orginal Wilson equation yfit = polyval(p,1./(Re.^i)); %applies statistics to find Rsquared values ymean = mean(Rov); SSR = sum((yfit-ymean).^2); SST = sum((Rov-ymean).^2); m = polyfit(log(Re),log(1./(Rov-p(2))),1); %linearly regresses modified wilson equation if(p(2)>=0) %condition assuring that C1 is positive diff(j,1) = abs(m(1)-i); %finds the absolute value between the two m values diff(j,3) = i; %places the applied m value in an array diff(j,2) = SSR/SST; %calculates Rsquared and places it in array j=j+1; end end [a b] = min(diff(:,1)); %finds the minimum difference figure %plots Difference vs M valuse hold on plot(diff(:,3),diff(:,1)); title('Optimization of m for Co-Current Operations') ylabel('Difference (between m original and calculated)') xlabel('m values') hold off fprintf('Optimized m value: \n m = %2.2f \n RSquared = %2.2f \n', diff(b,3), diff(b,2)) %reports optimal value

64
Counter-CurrentOperation(WilsonPlot)clear all clc %For counter current operations Rov = [0.000562 0.000679 0.000630 0.000682 0.000650 0.000639 0.000712 0.000667 0.000465 0.000496 0.000560 0.000550 0.000566 0.000544 0.000570]'; %enters Rov data Re = [1327.71 800.35 1220.49 1336.46 1003.85 1001.67 914.14 682.19 2428.39 2428.39 2428.39 1809.12 2428.39 1809.12 1809.12]'; %Enters Re data j=1; %creates index variable j for i = 0.01:.01:1
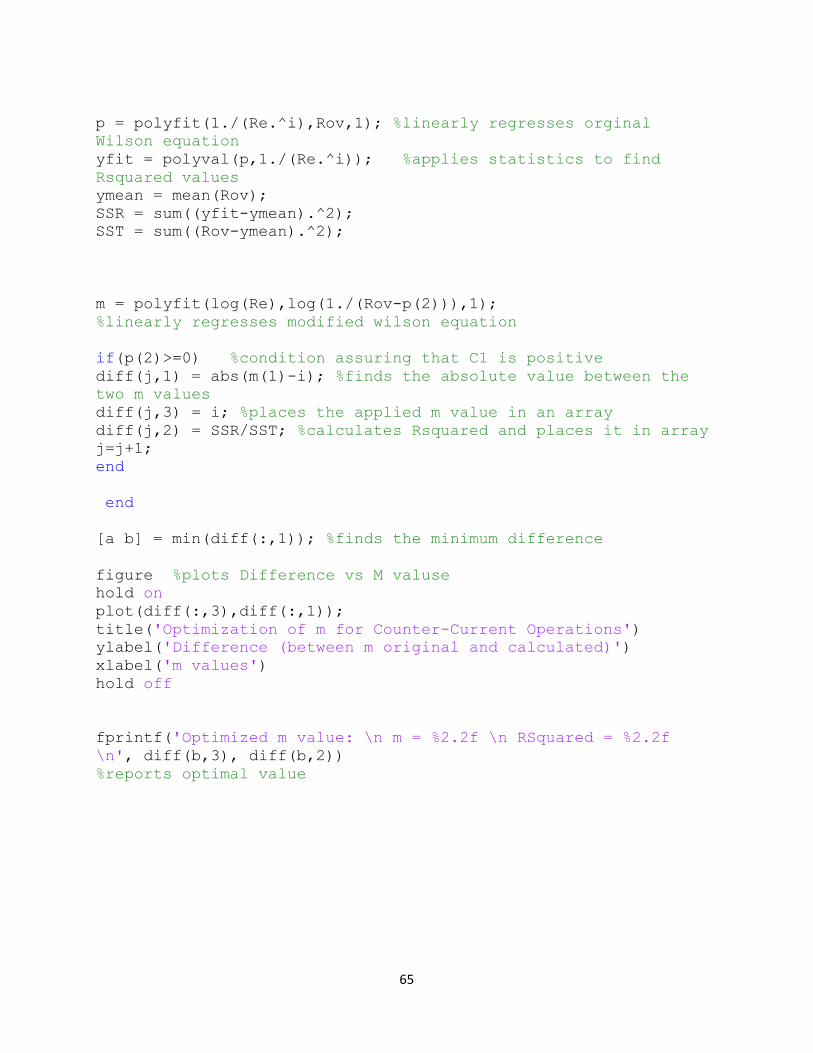
65
p = polyfit(1./(Re.^i),Rov,1); %linearly regresses orginal Wilson equation yfit = polyval(p,1./(Re.^i)); %applies statistics to find Rsquared values ymean = mean(Rov); SSR = sum((yfit-ymean).^2); SST = sum((Rov-ymean).^2); m = polyfit(log(Re),log(1./(Rov-p(2))),1); %linearly regresses modified wilson equation if(p(2)>=0) %condition assuring that C1 is positive diff(j,1) = abs(m(1)-i); %finds the absolute value between the two m values diff(j,3) = i; %places the applied m value in an array diff(j,2) = SSR/SST; %calculates Rsquared and places it in array j=j+1; end end [a b] = min(diff(:,1)); %finds the minimum difference figure %plots Difference vs M valuse hold on plot(diff(:,3),diff(:,1)); title('Optimization of m for Counter-Current Operations') ylabel('Difference (between m original and calculated)') xlabel('m values') hold off fprintf('Optimized m value: \n m = %2.2f \n RSquared = %2.2f \n', diff(b,3), diff(b,2)) %reports optimal value

66
NTU3DScatterPlotclear all clc X=[9.52 7.47 5.91 3.34 6.47 8.45 5.38 9.46 9.95 10.11 7.54 2.80 5.14 2.84 5.15]' %shellside Y=[5.78 3.49 5.32 5.82 4.37 4.36 3.98 2.97 10.11 10.11 10.15 7.92 10.14 7.87 7.84]' %tubeside Z=[0.28 0.406976744 0.280487805 0.223404255 0.329411765 0.325 0.348314607 0.471264368 0.188403908 0.187535285

67
0.237068511 0.434219315 0.312662801 0.428403161 0.288942299]' figure scatter3(X,Y,Z) grid on xlabel('Shell Side Flow Rates (gpm)') ylabel('Tube Side Flow Rates (gpm)') zlabel('Effectiveness') title('Optimal Flow Rates for Counter-Current Operation') legend('Trials','Location','ne')

68
Co/Counter-CurrentOverallHeatTransferCoefficientvs.FlowRatesclc clear all X1=[2.43 3.31 4.32 9.99 8.49 8.92 7.44 5.97 5.88 5.16 7.55 9.95 2.78 2.78 9.95 7.55]' %shellside Y1=[6.29 5.81 5.34 5.81 3.45 5.36 4.38 4.47 3.92 10.58 7.88 7.88 10.58 10.58 7.88 10.58]' %tubeside Z1=[1418.54 1303.45 1335.89 1093.95 1333.57 1094.52 1159.51 1272.28 1404.49

69
1329.33 1077.45 1104.80 1005.85 1008.14 1122.65 1135.26]' %Coefficients X2=[9.52 7.47 5.91 3.34 6.47 8.45 5.38 9.46 9.95 7.55 2.78 5.16 2.78 5.16 5.16]' %shellside Y2=[5.78 3.49 5.32 5.82 4.37 4.36 3.98 2.97 10.58 10.58 10.58 7.88 10.58 7.88 7.88]' %tubeside Z2=[967.66 800.79 863.25 797.29 836.32 850.89 763.27

70
814.57 1169.57 1094.97 970.10 988.68 959.87 999.32 952.95]' %Coefficients figure hold on scatter3(X1,Y1,Z1,'filled') scatter3(X2,Y2,Z2,'filled','markerfacecolor',[1 0 0]) hold off grid on xlabel('Shell Side Flow Rates (gpm)') ylabel('Tube Side Flow Rates (gpm)') zlabel('Overall Heat Transfer Coefficient (W/m^2*K)') title('Optimal Flow Rates for Co/Counter-Current Operation') legend('Co-Current','Counter-Current','Location','ne')

71
AppendixF–CalibrationCurves
Figure16.ShellSideFlowrateCalibrationCurve
Figure17.TubeSideFlowrateCalibrationCurve
y=1.0243x+0.2145
Calib
ratedFlow
rate(G
PM)
MeasuredFlowrate(GPM)
ShellSideCalibrationCo/Countercurrent

72
AppendixG–AdditionalDataCo-CurrentandCounter-CurrentOperationTemperatureProfiles

73

74

75

76

77

78
TableofParametersandConstants
Table14.CalculationConstantsandProperties
Table15.DesignExtensionConstants

79
ExperimentTimeLog
Table16.OperationTimeLog