the oecd and industrial biotechnology: the early - greenchem
TRANSCRIPT
Robert Wells
Head of Biotechnology Unit, OECD
Lund, Sweden
8 November 2010
1
The OECD and Industrial Biotechnology: The Early Stages of Driving International Consensus

Main Themes
• What is the OECD and why does it matter?
• Innovation as a key to future growth
• The Bioeconomy is here… and it’s here to stay.
• Industrial/Environmental Biotechnology: the potential and the challenges
• What comes next…
2

What is the OECD?• Born after World War II to coordinate/implement the
“Marshall Plan” for reconstruction of Europe
• Advises governments on economic, social and technological policies (science, innovation, health etc…) and contributes to economic growth and globalisation
• Today the OECD has 33 member countries in North America, Europe, and Asia-Pacific. 2 more waiting at the door.
• Enhanced Engagement Countries: Brazil, China, India, South Africa
• Global Forum on Biotechnology (Agreed 27/10/2010)
3

OECD Global Outreach
4
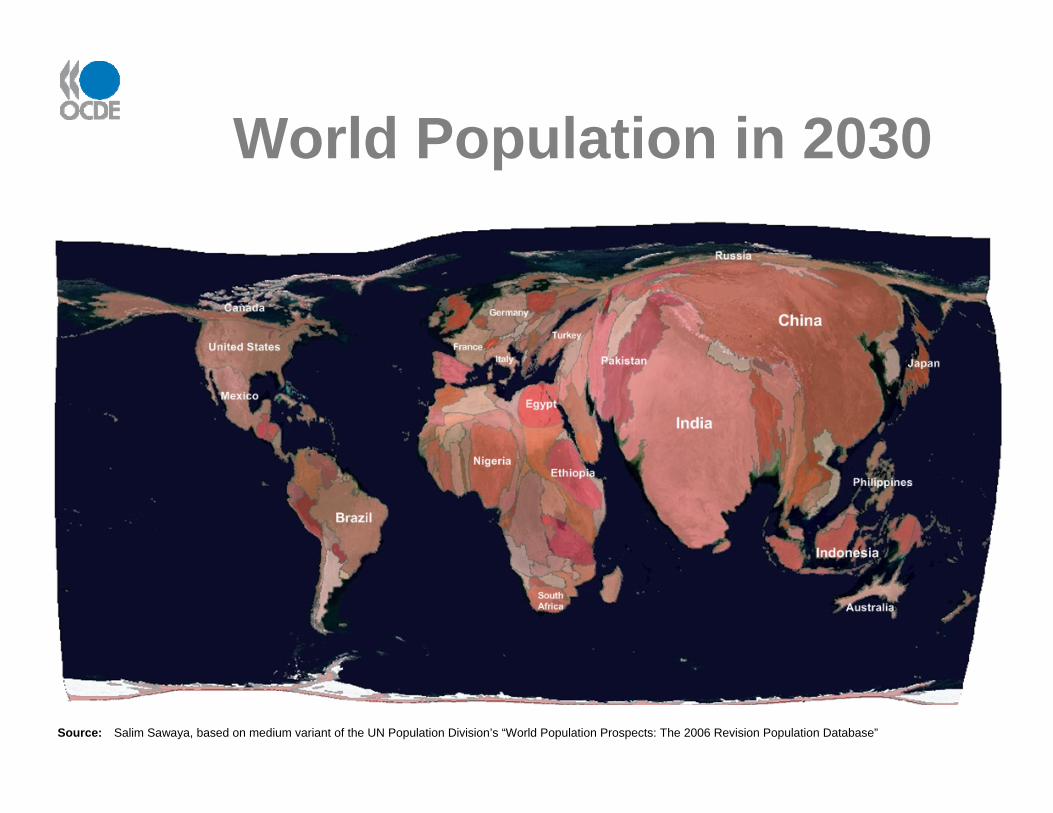
World Population in 2030
Source: Salim Sawaya, based on medium variant of the UN Population Division’s “World Population Prospects: The 2006 Revision Population Database”

By 2030, emerging economies will become the world’s bread basket
• Strong evidence that European agbio R&D has slowed down significantly
• Developing country activity has increased– Of the 8 countries planting more than a million ha of GM
crops, 6 are non-OECD countries
– Over 550 biotech field trials have occurred in 47 non-OECD countries
– Major agricultural biotechnology programmes
Country Agricultural biotechnology R&D spending (in USD PPP)
Brazil 350 million per year over next 10 years
China 120 million per year (24 million going to GM rice)
India 100 million per year

Major Relevant OECD Initiatives
• Report on the Bioeconomy 2030 –2009
• OECD Innovation Strategy – 2010
• OECD Green Growth Strategy -- 2011
7

Innovation is Key to Future Growth
8

Innovation is key to growth... Contributions to labour productivity growth, 1995-2006, in %
* Investment in intangibles and multi-factor productivity growth account for between two-thirds and three-quarters of labour productivity growth
‐1
0
1
2
3
4
5
6
Intangible capital MFP Non‐ICT capital
ICT capital Tangible capital Labour quality

... and innovation increasingly happens across borders
(institutions, countries, disciplines).
10Source: OECD Patent Database.

New global players have emerged …
Contributions to growth in global R&D, 1996-2001 and 2001-2006(in billion constant US PPP and %)
37%
16%
23%
15%
7%
13%
10%
13%
11%
30%
12%
13%
0
20
40
60
80
100
120
140
160
180
1996‐2001 2001‐2006
Other non‐OECD (2)
China
Other OECD (1)
Japan
EU‐27
United States
Note: (1) Australia, Canada, Iceland, Korea, Mexico, New Zealand, Norway and Turkey(2) Argentina, Brazil, India, Israel, Russian Federation, Singapore, South Africa, Chinese Taipei
Source: OECD.
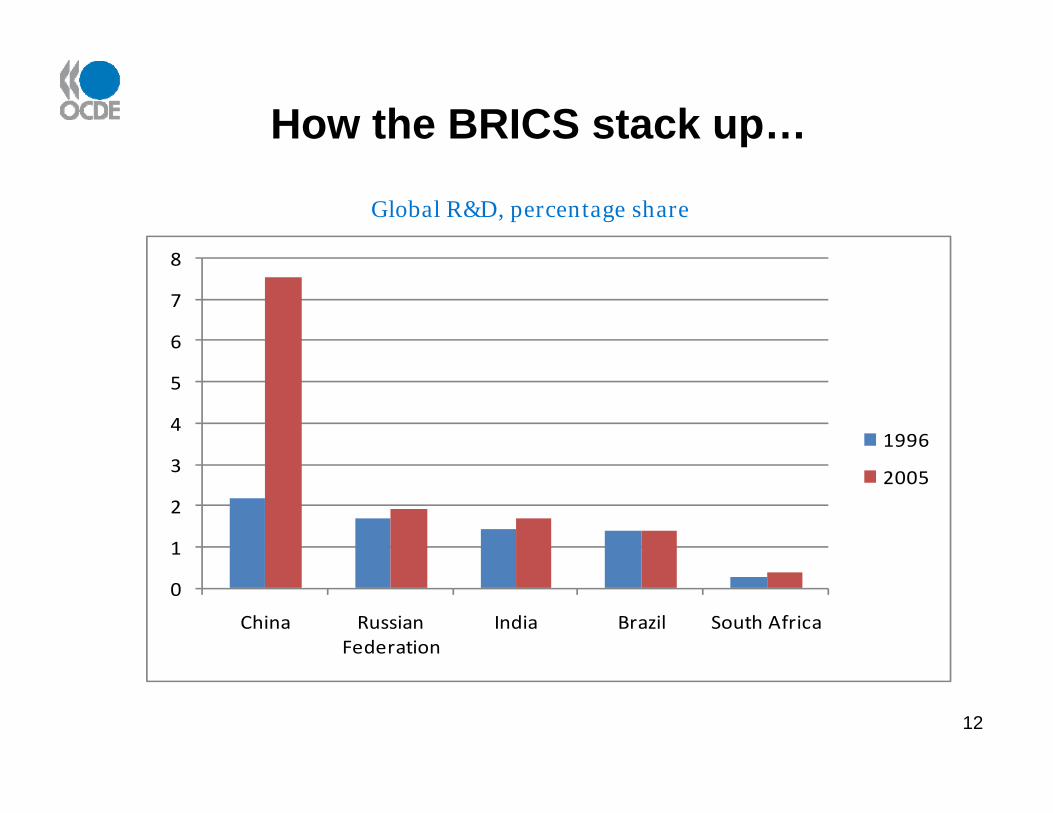
How the BRICS stack up…
Global R&D, percentage share
0
1
2
3
4
5
6
7
8
China Russian Federation
India Brazil South Africa
1996
2005
12

Science and Innovation in Sweden
13
Venture capital investment
As a percentage of GDP, selected countries, 2008
Share of BERD performed in service industries
Percentage of total BERD, selected countries, 2007
GERD as % of GDP
BERD as % of GDP
Venture capital as % GDP
Triadic patents per million population
Scientific articles per million population
% of firms with new‐to‐market product innovations (as a % of all firms)
Share of services in business R&D% of firms collaborating (as a % of all firms)
Patents with foreign co‐inventors
% of GERD financed by abroad
Researchers per thousand total employment
Science & Engineering degrees as % of all new degrees
HRST occupations as % of total employment
Sweden Average
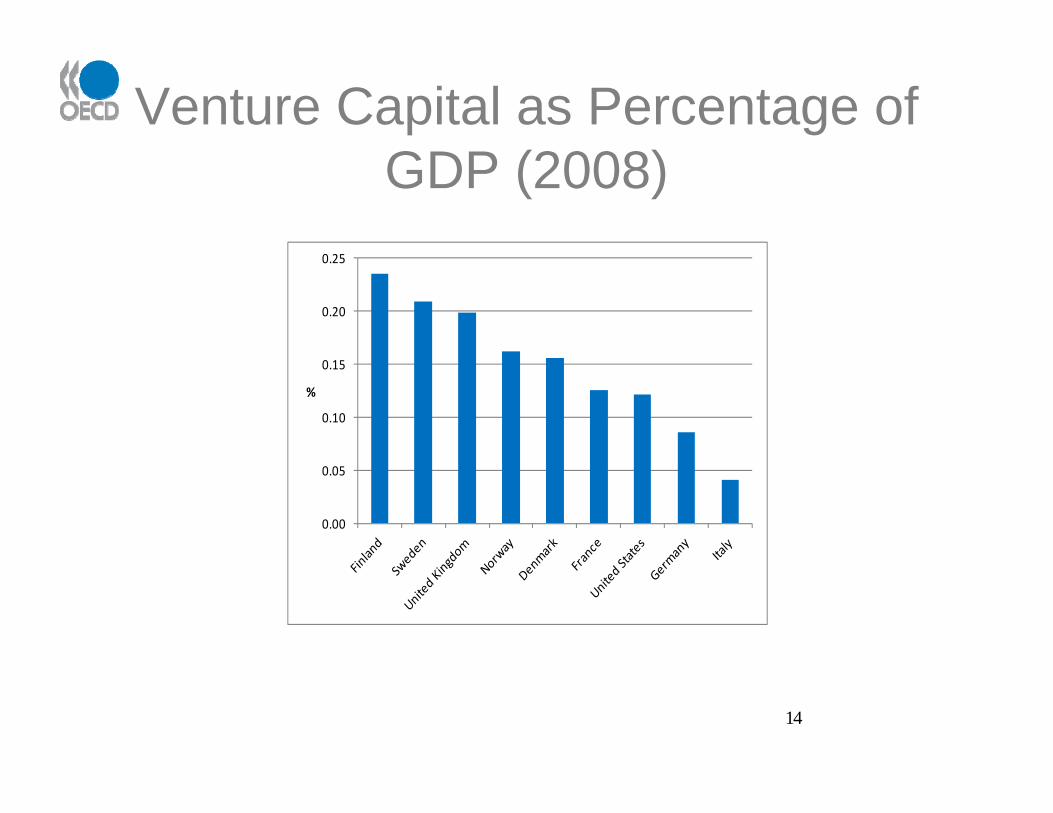
Venture Capital as Percentage of GDP (2008)
14
0.00
0.05
0.10
0.15
0.20
0.25
%
The Bioeconomy 2030
15
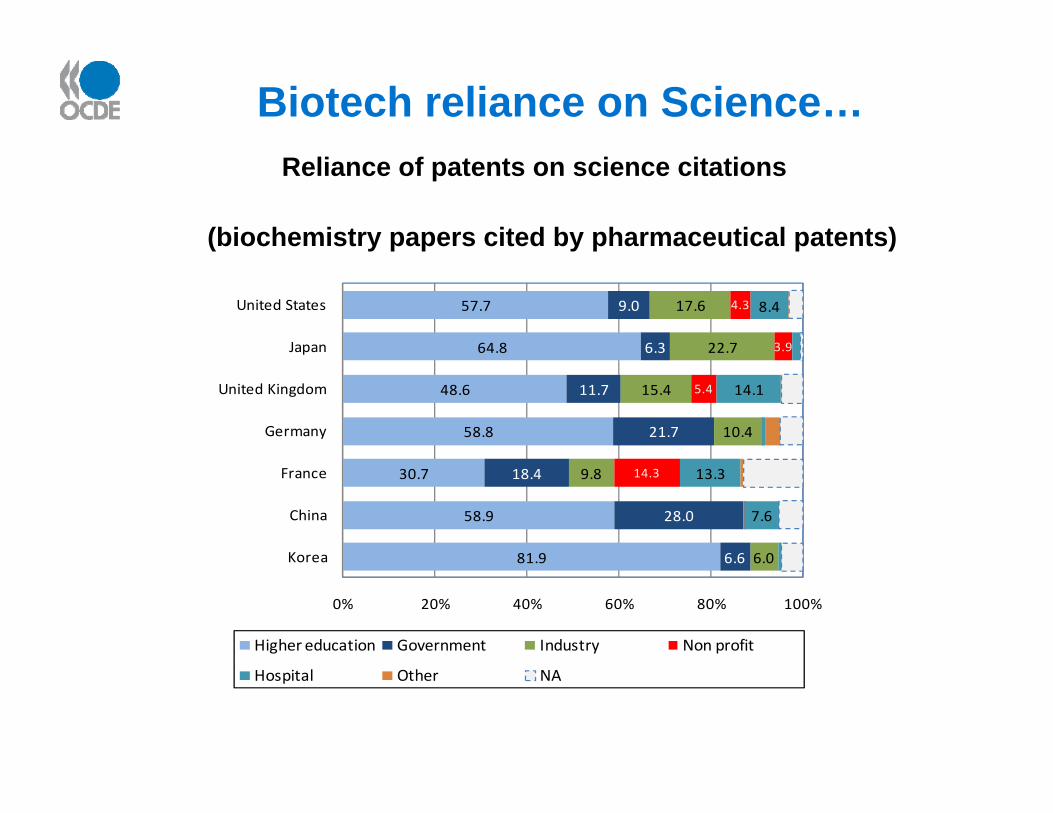
Biotech reliance on Science…Reliance of patents on science citations
(biochemistry papers cited by pharmaceutical patents)
57.7
64.8
48.6
58.8
30.7
58.9
81.9
9.0
6.3
11.7
21.7
18.4
28.0
6.6
17.6
22.7
15.4
10.4
9.8
6.0
4.3
3.9
5.4
14.3
8.4
14.1
13.3
7.6
0% 20% 40% 60% 80% 100%
United States
Japan
United Kingdom
Germany
France
China
Korea
Higher education Government Industry Non profit
Hospital Other NA
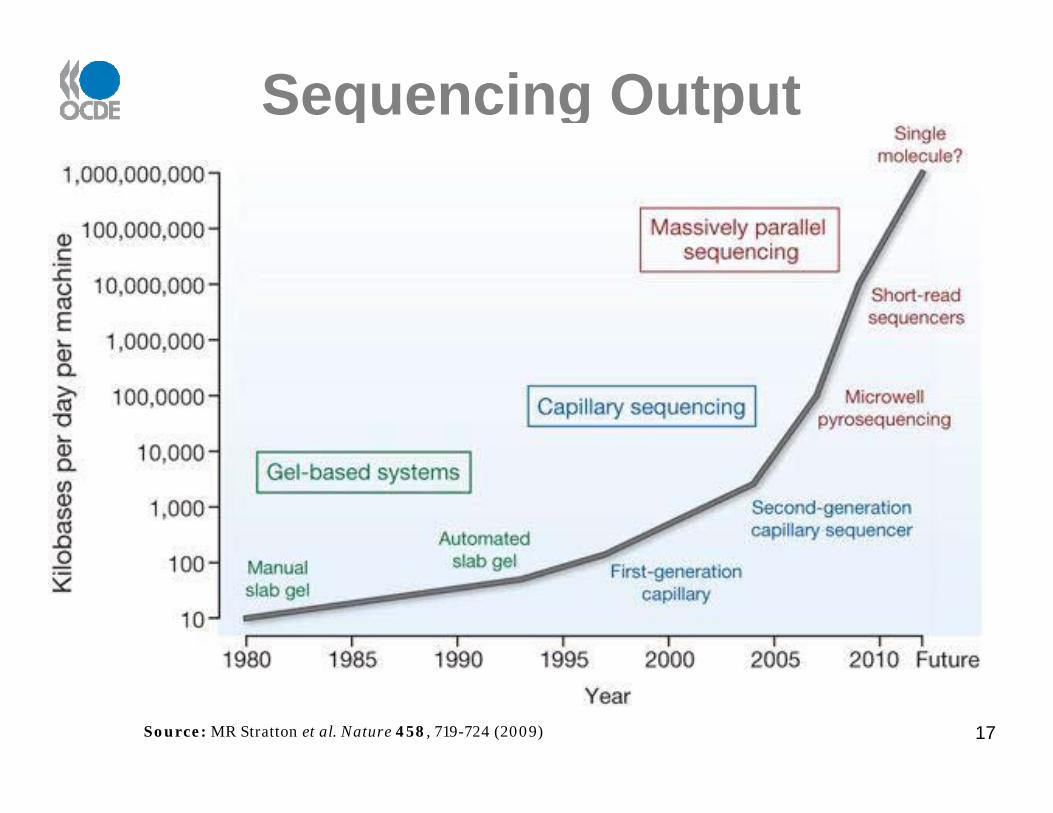
Sequencing Output
17Source: MR Stratton et al. Nature 458, 719-724 (2009)

Number of publications identifying a drug-gene relationship (3yr running avg)
18Source: OECD, based on PharmGKB database as of December 10, 2007.

Diseases for which genetic testing is available
19
Source: OECD, based on GENETests (2007), www.genetests.org/, accessed 14 December 2007.

Chemical and biotech sales per segment 2007
OECD Outlook on Industrial Biotechnology
25,3%
31,0%
22,5%
21,2%
Base chemicals Specialty chemicalsConsumer chemicals Active pharma ingredients
59,2%22,4%
14,5%3,9%
Base chemicals Specialty chemicalsConsumer chemicals Active pharma ingredients
Chemical sales per segment 2007100% = 1,383 billion Euro
Biotech sales1) per segment 2007100% = 48 billion Euro
1,5% of base chemicals
4,8% of specialty
chemicals5,4% of consumer chemicals
18,7% of active pharma
ingredients
1) Sales of chemical products made by biotechnological processes and not chemical processesSource: CEFIC Facts & Figures January 2009, market evaluation of FESTEL CAPITAL from May 2009
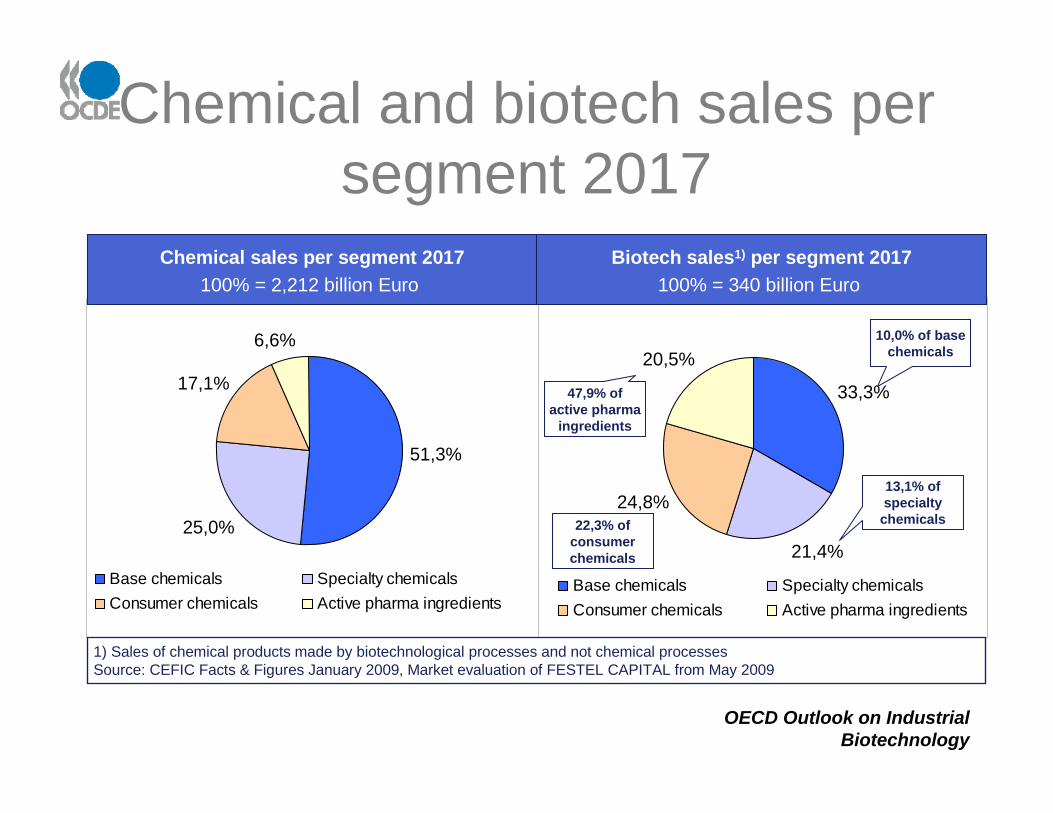
Chemical and biotech sales per segment 2017
OECD Outlook on Industrial Biotechnology
33,3%
21,4%
24,8%
20,5%
Base chemicals Specialty chemicalsConsumer chemicals Active pharma ingredients
51,3%
25,0%
17,1%
6,6%
Base chemicals Specialty chemicalsConsumer chemicals Active pharma ingredients
Chemical sales per segment 2017100% = 2,212 billion Euro
Biotech sales1) per segment 2017100% = 340 billion Euro
10,0% of base chemicals
13,1% of specialty
chemicals22,3% of consumer chemicals
47,9% of active pharma
ingredients
1) Sales of chemical products made by biotechnological processes and not chemical processesSource: CEFIC Facts & Figures January 2009, Market evaluation of FESTEL CAPITAL from May 2009

Key Messages of the Bioeconomy
• Don’t cut R&D support coming out of the crisis. Recovery will depend on it in the medium term.
• Understand and utilise national innovation systems within the evolving networked model of innovation
• Protect investment in intellectual assets and create new models to share and leverage such assets
• Mobility matters – The demand for talent is inescapable. The networked model feeds on it.
• Current systems of prioritisation and governance need to evolve post-crisis – prioritisation, evaluation & subsidiarity,
…and…
• Need to design institutional structures that facilitate multilateral co-operation in STI for global challenges
22
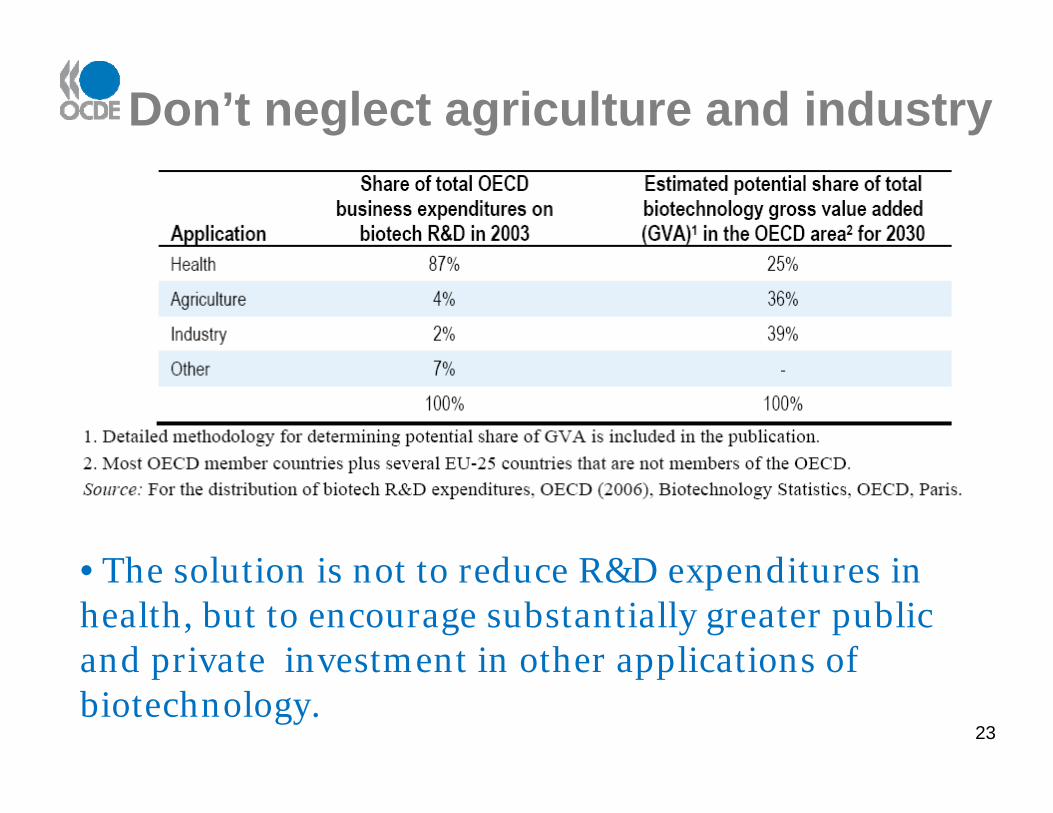
Don’t neglect agriculture and industry
23
• The solution is not to reduce R&D expenditures in health, but to encourage substantially greater public and private investment in other applications of biotechnology.

Last Key Message: What governments do makes a
difference
24
25
(indexed on 1980=1.0, Annex 1 ratification countries)
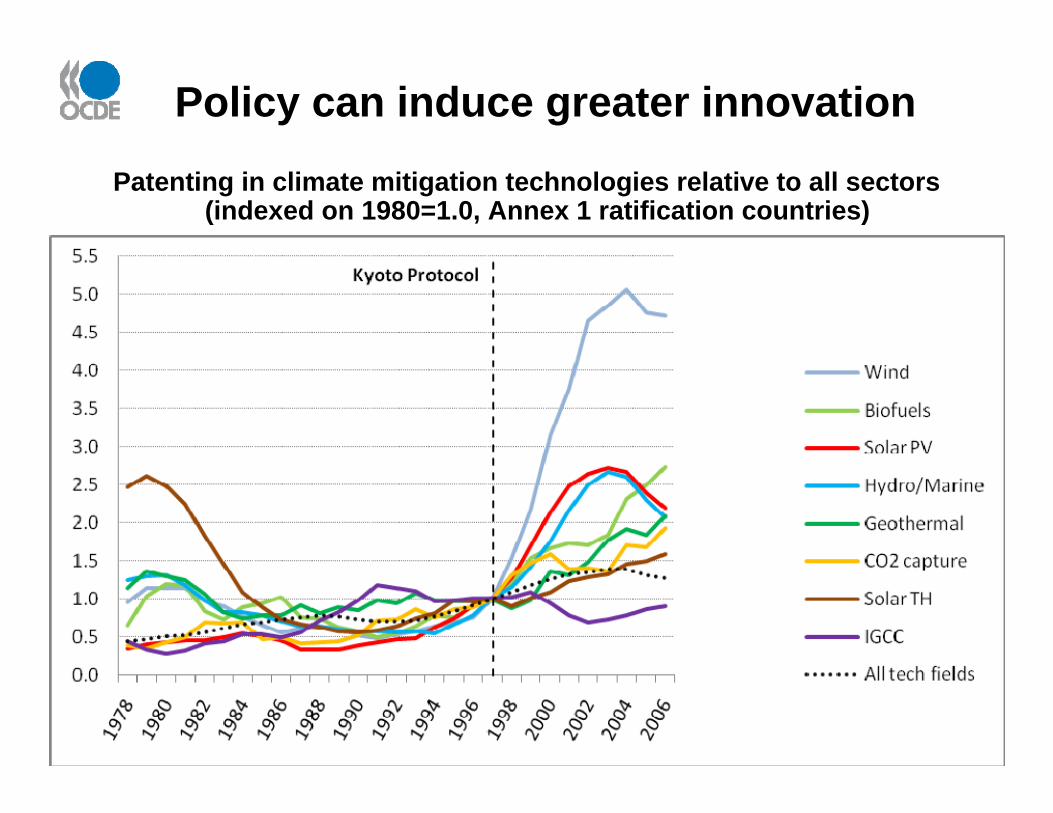
Policy can induce greater innovation
Patenting in climate mitigation technologies relative to all sectors

GM crop plantings 2008
26Source: Salim Sawaya, based on data from James (2008). Notes: (1) Countries planting less than 1,000,000 hectares in 2007 include: Australia (200,000 ha), Bolivia (600,000 ha), Burkina Faso (<50,000), Chile (<50,000), Colombia (<50,000), Czech Republic (<50,000), Egypt (<50,000), Germany (<50,000), Honduras (<50,000), Mexico (100,000 ha), Philippines (400,000 ha), Poland (<50,000), Portugal (<50,000), Slovakia (<50,000), Spain (100,000 ha), Romania (<50,000), and Uruguay (700,000 ha).

Regulation has had a major impact on public research
27
GM field trials by public research organisations in Europe and North America
0
50
100
150
200
250
300
350
400
Source: OECD, based on the UNU-MERIT field trial database.
Europe North America
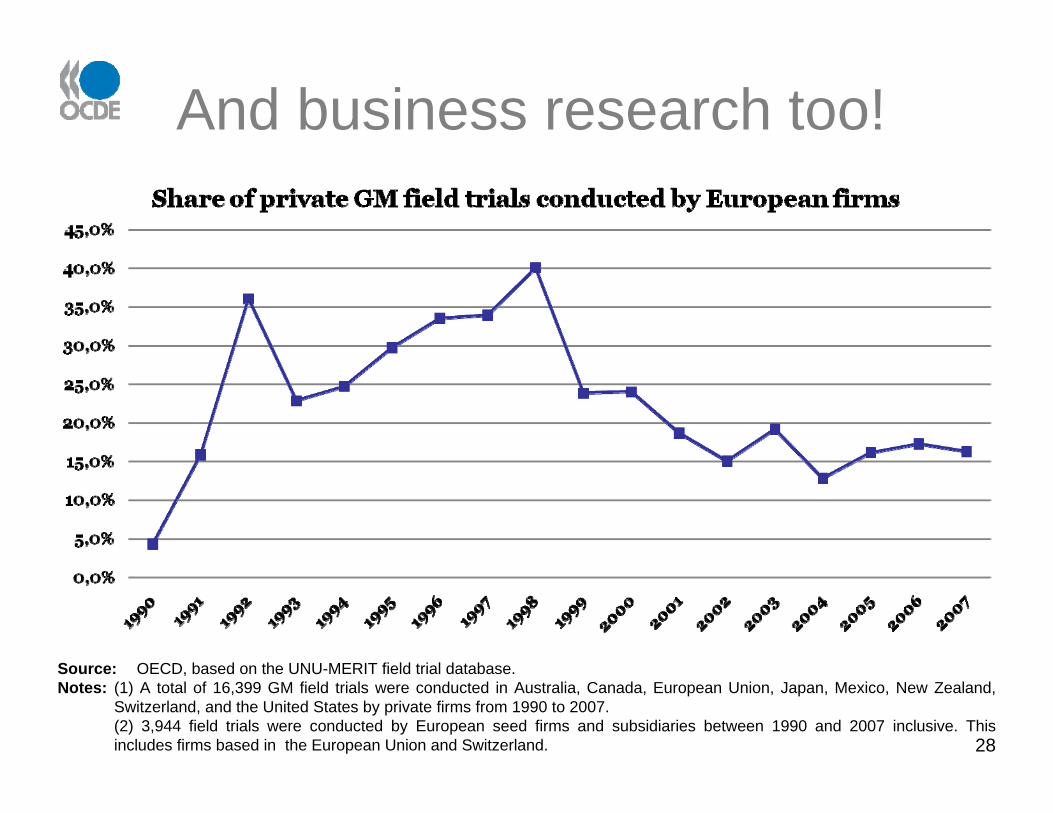
And business research too!
28
Source: OECD, based on the UNU-MERIT field trial database.Notes: (1) A total of 16,399 GM field trials were conducted in Australia, Canada, European Union, Japan, Mexico, New Zealand,
Switzerland, and the United States by private firms from 1990 to 2007. (2) 3,944 field trials were conducted by European seed firms and subsidiaries between 1990 and 2007 inclusive. This includes firms based in the European Union and Switzerland.

SUPPLY SIDE POLICIES
Finance Services
Equity support (i.e. public or,
subsidised private venture capital)
Support for training and mobility (i.e fellowships)
Fiscal measures (i.e. eco-taxes,
R&D tax incentives)
Public-private partnerships (i.e. covenants, tradable
permits)
Grants for industrial R&D(i.e R&D grants)
Information & brokerage support
(i.e. patent database)
Networking measures (i.e. science parks,
university-industry
linkages)
DEMAND SIDE POLICIES
Systemic policies (i.e.
lead markets)
Regulation(i.e. regulations &
Standards)
Procurement(i.e. green public
procurement)
Certification schemes (i.e eco-labels, voluntary
certifications
Support for public sector research (i.e
University funding)
M
M
M
V
V
V
Instrument from innovation policiesInstrument from environmental policiesInstrument from both
Colour key on the use of instruments
V
V
V
Economic Informative
Voluntary Mandatory
Administrative
V
V
M
IEA
V V
M
V
Source: modified from Georghiou (2006), p 23
Policy instruments to be considered for Building a Bio-based Economy

Multi-faceted and Interdisciplinary nature of Green Technologies
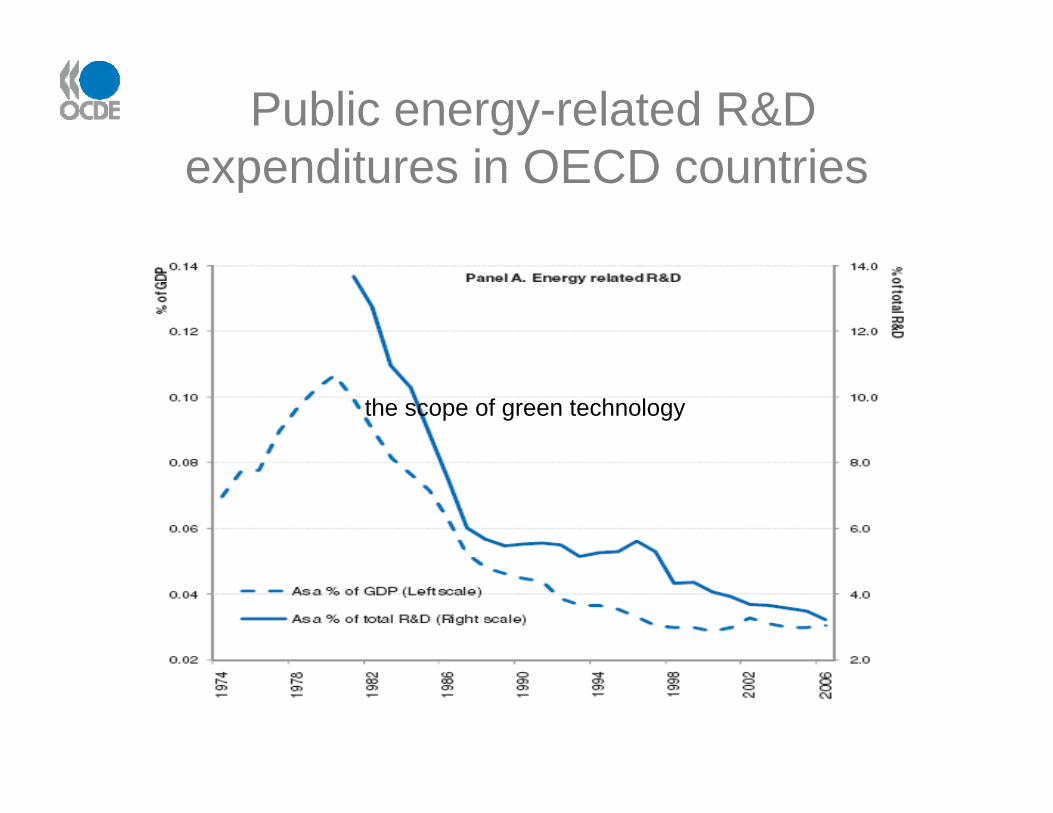
Public energy-related R&D expenditures in OECD countries
the scope of green technology
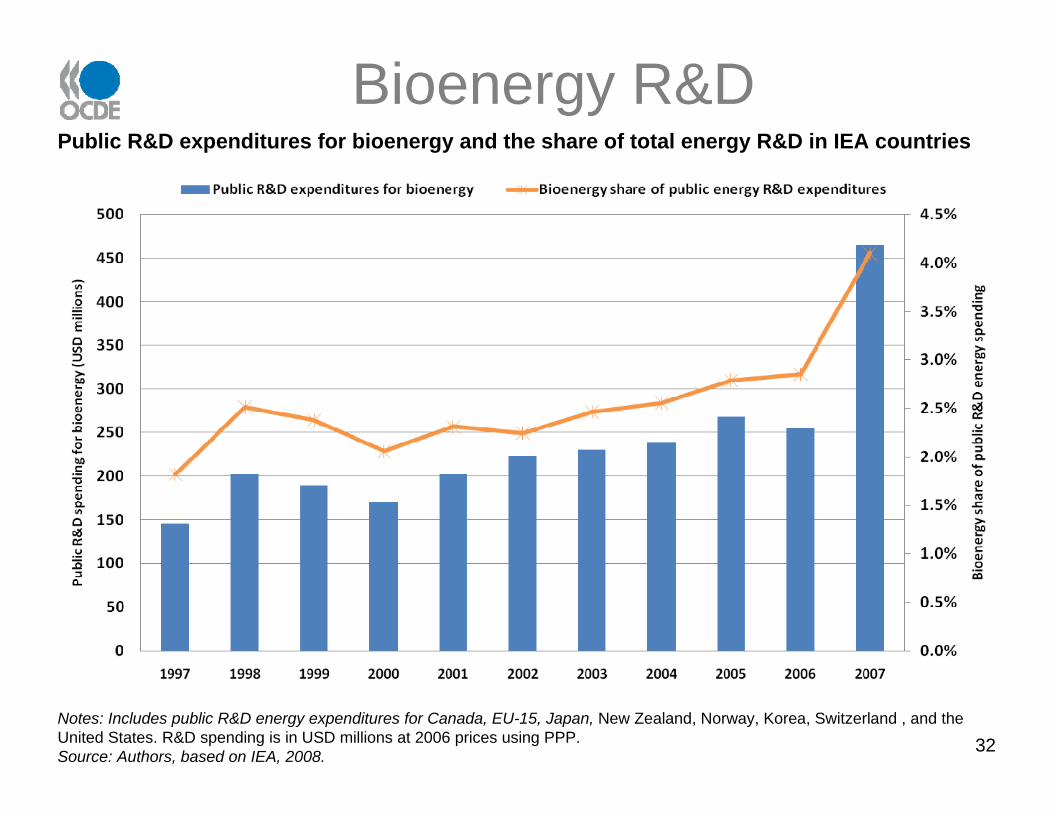
Bioenergy R&D
32
Public R&D expenditures for bioenergy and the share of total energy R&D in IEA countries
Notes: Includes public R&D energy expenditures for Canada, EU-15, Japan, New Zealand, Norway, Korea, Switzerland , and the United States. R&D spending is in USD millions at 2006 prices using PPP.Source: Authors, based on IEA, 2008.

OECD Work in Industrial Biotechnology
• Workshop on Sustainability in Biobased Products – Montreal, July 2009
• Outlook on Industrial Biotechnology –Vienna, January 2010
• Policy Roundtable – Washington, July 2010
• Workshop on Industrial Biotechnology and the BRIC countries – St. Petersburg, October 2010
33

Main barriers within each of the three pillars for successful delivery of industrial biotechnology
34
Pillar Barriers
Science and Technology Base
• Fragmentation of funding and policies
• Lacking analysis of national strengths
• Interdisciplinary research
Capital• Weak marketplace• Capital for scale-up• High costs for feedstock
Human Resources
• Inability to evaluate future HR needs• Gap between education programmes
and industry needs• Poor attractiveness to young
individuals
.

Underlying Structural Policy Concerns
• The need for innovative use of knowledge networks and markets– Collaborative mechanisms for maximizing the
benefits of intellectual property
• Development of innovative governance structures in biotechnology– Invent new structures or retrofit existing ones
• A better understanding of how the convergence of technologies will impact industrial biotechnology and green growth
35

Recent and Upcoming OECD Publications
• “Metrics to Support Informed Decision-making for Consumers of Bio-Based Products” – 2009
• Towards the Development of OECD Best Practices for Assessing the Sustainability of Bio-Based Products” – 2010
• “Outlook on Industrial Biotechnology” – 2011
• OECD Guidelines for Assessing the Sustainability of Bio-Based Products -- 2011
36


• Ensure that incentives for private investment are better aligned with the public interest
• Continue developing regulatory systems that incorporate pharmacogenetics
• Support long term research, using population-based medical databases, into health outcomes
• Cope with long-term impacts of regenerative and personalised medicine on healthcare, including data confidentiality, healthcare delivery, and doctor-patient relationships
38
Prepare for a costly but beneficial revolution in healthcare

Reduce barriers to biotech • Research costs, regulatory barriers, and
concentration can hinder innovation, especially for small market applications
• Identify factors that prevent competitive and innovative markets for biotechnology
• Evaluate possible policy actions that could free up markets and access to knowledge:– Encouraging public research institutions to
adopt intellectual property guidelines that support rapid innovation
– Support collaborative mechanisms for sharing knowledge 39

Preparing the foundation• Optimal benefits from the bioeconomy will
require identifying and preparing for a range of possible futures to prevent locking-in inferior technological solutions
• Agriculture: encourage biotech use by improving access to technologies for use in a small markets and by small firms
• Health: support long terms follow-up research comprehensive health record systems
• Industry: reward environmentally sustainable technologies (e.g. high energy density biofuels)
40

KEY MESSAGES OF THE BIOECONOMY
41

Rapidly declining genome sequencing costs
• Some say the $1000 genome will arrive in 20201, but this could be much sooner
• Complete Genomics will soon start sequencing 8 genomes or more for $20K each and 1,000 genomes $5K each2
• The Archon X-Prize for genomics is offering a $10 million prize to the first team to sequence 100 human genomes at a cost of less than $10,000 per genome in less than 10 days
(1) Carlson, R. (2007), Genome Synthesis and Design Futures: Implications for the US Economy, Bio-Era. (2) Duncan, D. (2009), Complete Genomics Sequences 14 Genomes, MIT Technology Review.

Overwhelming challenge to global health
• MALARIA - 300 million, 2 million deaths annually.
• HEPATITIS C - 170 million chronically infected with Virus. Four million infected each year; 80% chronic, 20% cirrhosis, 5% liver cancer.
• HEPATITIS B - 2 billion people . 400 million people chronically infected and 1 million people die each year.
• TB - One third of the world is infected with M. tuberculosis with 10 million cases every year accounting for two million deaths.
• HIV - Approximately 50 million infected. 3.9 million deaths in 2005.
• OTHERS - Some outbreaks are still relatively unknown - cholera still causes close to 120,000 deaths per year. 43