the odd man out? might climate explain the lower tree
TRANSCRIPT

Journal of Ecology
2007
95
1058ndash1071
copy 2007 The AuthorsJournal compilationcopy 2007 British Ecological Society
Blackwell Publishing Ltd
The odd man out Might climate explain the lower tree αααα
-diversity of African rain forests relative to Amazonian rain forests
INGRID PARMENTIER
12
YADVINDER MALHI
125
BRUNO SENTERRE
2
ROBERT J WHITTAKER
1
A T D N
3
ALFONSO ALONSO
4
MICHAEL P B BALINGA
5
ADAMA BAKAYOKO
6
FRANS BONGERS
24
CYRILLE CHATELAIN
7
JAMES A COMISKEY
48
RENAUD CORTAY
7
MARIE-NOEumlL DJUIKOUO KAMDEM
9
JEAN-LOUIS DOUCET
10
LAURENT GAUTIER
7
WILLIAM D HAWTHORNE
11
YVES A ISSEMBE
12
FRANCcedilOIS N KOUAMEacute
13
LAZARE A KOUKA
2
MIGUEL E LEAL
14
JEAN LEJOLY
2
SIMON L LEWIS
1525
LOUIS NUSBAUMER
7
MARC P E PARREN
16
KELVIN S-H PEH
15
OLIVER L PHILLIPS
1525
DOUGLAS SHEIL
17
BONAVENTURE SONKEacute
9
MARC S M SOSEF
18
TERRY C H SUNDERLAND
174
JULIANA STROPP
19
HANS TER STEEGE
19
MIKE D SWAINE
20
M G P TCHOUTO
18
BAREND S VAN GEMERDEN
21
JOHAN L C H VAN VALKENBURG
22
and HANNSJOumlRG WOumlLL
23
1
Biodiversity Research Group Oxford University Centre for the Environment University of Oxford South Parks Road Oxford OX1 3QY UK
2
Universiteacute Libre de Bruxelles Laboratoire de Botanique Systeacutematique et de Phytosociologie CP 169 50 Av F D Roosevelt B-1050 Bruxelles Belgium
3
Collective author httpwwwbiouunl~herbaGuyanaAmazon_plot_networkIndexhtm
4
Smithsonian Institution S Dillon Ripley Center 1100 Jefferson Drive SW Washington DC 20560-0705 USA
5
Forests Resources and People PO Box 437 Limbe Cameroon
6
Centre Suisse de Recherches Scientifiques en Cocircte drsquoIvoire 01 LP 1303 Abidjan Ivory Coast and UFR Science de la Nature Universiteacute drsquoAbobo Adjameacute 02 BP
801 Abidjan Ivory Coast
7
Conservatoire et Jardin botaniques de la Ville de Genegraveve case postale 60 CH-1292 Chambeacutesy Switzerland
8
Fredericksburg amp Spotsylvania National Military Park 120 Chatham Lane Fredericksburg VA 22405 USA
9
Ecole Normale Supeacuterieure de Yaoundeacute Universiteacute de Yaoundeacute I BP 047 Yaoundeacute Cameroon
10
Laboratoire de Foresterie des Reacutegions Tropicales et Subtropicales Uniteacute de Gestion des Ressources forestiegraveres et des Milieux naturels Faculteacute Universitaire des Sciences Agronomiques 5030 Gembloux Belgium
11
Department of Plant Sciences University of Oxford South Parks Road Oxford OX1 3RB UK
12
Institut de Recherche en Ecologie Tropicale BP 13354 Libreville Gabon
13
Laboratoire de Botanique Universiteacute de Cocody 22 BP 582 Abidjan Ivory Coast
14
Missouri Botanical Garden 4344 Shaw Boulevard St Louis MO 63110 USA
15
Earth amp Biosphere Institute School of Geography University of Leeds Leeds LS2 9JT UK
16
Validation of Legal Timber Programme Forestry Commission PO Box MB 434 Accra Ghana
17
Centre for International Forestry Research PO Box 6596 JKPWB Jakarta 10065 Indonesia
18
National Herbarium of the Netherlands-Wageningen University branch Biosystematics Group Generaal Foulkesweg 37 6703 BL Wageningen the Netherlands
19
Institute of Environmental Biology Section of Plant Ecology and Biodiversity and Nationaal Herbarium Nederland-Utrecht Branch Sorbonnelaan 14ndash16 3584 CA Utrecht the Netherlands
20
School of Biological Sciences University of Aberdeen Aberdeen AB24 3UU UK
21
Conservation Department BirdLife Netherlands PO Box 925 3700 AX Zeist the Netherlands
22
Plantenziektenkundige Dienst Postbus 9102 6700 HC Wageningen the Netherlands and
23
Sommersbergseestr 291 A-8990 Bad Aussee Austria
24
Centre for Ecosystem Studies Wageningen University PO Box 47 6700 AA Wageningen the Netherlands
25
RAINFOR Amazon Forest Inventory Network
Summary
1
Comparative analyses of diversity variation among and between regions allow testingof alternative explanatory models and ideas Here we explore the relationships betweenthe tree
α
-diversity of small rain forest plots in Africa and in Amazonia and climatic
Author to whom correspondence should be addressed I Parmentier Universiteacute Libre de Bruxelles Laboratoire de BotaniqueSysteacutematique et de Phytosociologie CP 169 50 Av F D Roosevelt B-1050 Bruxelles Belgium Tel
+
32 2650 21 26 Fax
+
32 265021 25 E-mail inparmenulbacbe
1059
Climate and rain forest tree
α
-diversity
copy 2007 The AuthorsJournal compilation copy 2007 British Ecological Society
Journal of Ecology
95
1058ndash1071
variables to test the explanatory power of climate and the consistency of relation-ships between the two continents
2
Our analysis included 1003 African plots and 512 Amazonian plots All are locatedin old-growth primary non-flooded forest under 900 m altitude Tree
α
-diversity is esti-mated using Fisherrsquos alpha calculated for trees with diameter at breast height
ge
10 cmMean diversity values are lower in Africa by a factor of two
3
Climate-diversity analyses are based on data aggregated for grid cells of 25
times
25 kmThe highest Fisherrsquos alpha values are found in Amazonian forests with no climaticanalogue in our African data set When the analysis is restricted to pixels of directlycomparable climate the mean diversity of African forests is still much lower than thatin Amazonia Only in regions of low mean annual rainfall and temperature is meandiversity in African forests comparable with or superior to the diversity in Amazonia
4
The climatic variables best correlated with the tree
α
-diversity are largely different inthe African and Amazonian data or correlate with African and Amazonian diversity inopposite directions
5
These differences in the relationship between locallandscape-scale
α
-diversity andclimate variables between the two continents point to the possible significance of anarray of factors including macro-scale climate differences between the two regionsoverall size of the respective species pools past climate variation other forms of long-term and short-term environmental variation and edaphics We speculate that the lower
α
-diversity of African lowland rain forests reported here may be in part a function of thesmaller regional species pool of tree species adapted to warm wet conditions
6
Our results point to the importance of controlling for variation in plot size and forgross differences in regional climates when undertaking comparative analyses betweenregions of how local diversity of forest varies in relation to other putative controllingfactors
Key-words
Africa Amazonia biodiversity biogeography climate comparative ana-lysis diversity theory Fisherrsquos alpha tree alpha diversity tropical forest
Journal of Ecology
(2007)
95
1058ndash1071doi 101111j1365-2745200701273x
Introduction
Tropical rain forests host the highest levels of biodiver-sity on earth Nevertheless our understanding of thedeterminants of rain forest diversity is relatively poorand the causes of the differing diversity levels insideand between the worldrsquos main rain forest areas remainuncertain (Richards 1973 Gentry 1988 Sheil 1996Givnish 1999 Leigh
et al
2004 Wills
et al
2006) In acomparative study of the main tropical forest eco-systems of the world Richards (1973) concluded thatwhenever differences are found it is Africa that is thelsquoOdd man outrsquo African rain forests always seem to dif-fer from American and Asian rain forests more thanthey do from each other One of the major differences isthe relative poverty of the African rain forest flora Inthis paper our goal is to present a comparative analysisof tree alpha (
α
) diversity patterns within the rain forestbiome of West and central Africa and South America
The broad pattern of geographical gradients in spe-cies richness of terrestrial ecosystems from low in PolarRegions to high in the tropical rain forest biome is longestablished and recent work has demonstrated that it is
largely attributable to climate (OrsquoBrien 1998 Francis ampCurrie 2003 Hawkins
et al
2003 Field
et al
2005) Itis therefore sensible to start a comparative diversityanalysis by testing contemporary climatic models ofdiversity variation (Richards 1973 OrsquoBrien 2006) Wetherefore focus herein on the relationships betweenclimate variables and a metric of diversity basing ouranalyses on a large data set derived from small forestplots from both continents
Patterns of diversity at one spatial scale can be dis-tinct from and have distinct drivers from patterns atother (coarser or finer) spatial scales (Whittaker
et al
2001) Besides contemporary climate sources of rainforest diversity variation have been ascribed notably tohistorical factors (varying from centennial to geologicaltime scales) soil fertility constraints related to speciespool size the intermediate disturbance hypothesis animaldisturbances the mid-domain effect anthropogenic influ-ence and extreme disturbances (Connell 1978 Phillips
et al
1994 Sheil 1996 2001 Givnish 1999 Colwell ampLees 2000 Morley 2000 Plotkin
et al
2000 Willis ampWhittaker 2002 Newbery
et al
2004 Rangel amp Diniz-Filho 2005 ter Steege
et al
2006)
1060
I Parmentier
et al
copy 2007 The AuthorsJournal compilation copy 2007 British Ecological Society
Journal of Ecology
95
1058ndash1071
Spatial patterns of plant diversity within the rainforest areas of Africa and Amazonia are not knownwith high precision because the underlying speciesrange data are largely incomplete and highly depend-ent on the sampling intensity (Kier
et al
2005 Kuper
et al
2006 Schulman
et al
2007) ter Steege
et al
(2006) gathered data from large-scale inventories inAmazonia (4
deg
times
6
deg
blocks) that they analysed at thegenus level They distinguished two dominant gradi-ents in composition and function of trees with diameterat breast height (dbh)
ge
30 cm a major gradient insoil fertility and a gradient in dry season length Thesegradients were also correlated with tree diversity
At the community level Gentry (1988) concluded thatequatorial forests are more diverse than tropical forestsfurther from the equator that woody plant diversityvaries little up to 1500 m elevation and that localspecies richness generally increases with soil fertilityand precipitation Clinebell
et al
(1995) reanalysedGentryrsquos 01-ha Neotropical data set and showed thatannual rainfall and rainfall seasonality were the mostimportant variables for explaining species richnessindependent of soil quality With a larger set of typi-cally 1-ha forest plots (trees dbh
ge
10 cm) ter Steege
et al
(2003) reported that dry season length is a strongpredictor of tree density and of lsquomaximumrsquo tree
α
-diversity in Amazonia The metric they used for tree
α
-diversity was Fisherrsquos
α
(Fisher
et al
1943) theproperties of which are discussed below Hence theirwork suggests that while climate may provide reasonablestatistical models for lsquomaximalrsquo
α
-diversity variationwithin Amazonia it is not the only factor influencing
α
-diversityTo permit a proper comparison with these findings
we have assembled tree diversity data from small plotsin the African rain forests By selecting plots from bothcontinents that meet given criteria we attempt what is toour knowledge the first systematic comparative analysisof
α
-diversity variation between African and Amazonian
rain forests We aim to answer the following questions
1
Do African and Amazonian rain forests exhibitcomparable levels of
α
-diversity of trees
2
What are the main climatic differences between therain forest areas of Amazonia and Africa
3
Can climate variables explain
α
-diversity variationwithin and between the two areas and are the climaticrelationships for Africa consistent with those reportedby ter Steege
et al
(2003) for Amazonia
4
Additionally is tree
α
-diversity correlated in the sameway with the climatic variables in both continents
5
Does dry season length covary with lsquomaximalrsquo
α
-diversity in African rain forest
Methods
The Amazon Tree Diversity Network database providedthe Amazonian data (512 plots and transects httpwwwbiouunl~herbaGuyanaAmazon_plot_networkIndexhtm) The African
α-diversity data were com-piled from literature and unpublished data (1003 plotsand transects) References for the African data pointsare listed in Appendix S1 in Supplementary materialThe data points selected for this study are located in oldgrowth terra firme rain forest below 900 m altitude(above this altitude tropical montane influences appearincreasingly in forest plots) Their minimum and maximumsizes and stem numbers are as shown in Table 1 Follow-ing the recommendations of Condit et al (1998) theminimum acceptable number of individual trees in a plotwas set to 50 In Africa plots in monodominant and swampforests were excluded In Amazonia plots on white sandsfloodplains and swamps were excluded Data points areunequally distributed in both continents (Fig 1)
For each data point Fisherrsquos α values were calcu-lated from the number of species and the number ofindividuals of trees dbh ge 10 cm Plots and transects
Table 1 Area number of trees Fisherrsquos α values and altitude for the four data sets (non-aggregated data) full all plots 1 ha c1-ha data sets including only plots with area 1ndash15 ha and maximal length = 500 m Af = Africa Am = Amazonia
Area (ha) Number of trees Fisherrsquos α Altitude (m)
Af-full (n = 1003)Minimum 0044 50 16 7Maximum 7600 2900 856 900Mean plusmn SD 0286 plusmn 045 137 plusmn 200 277 plusmn 133 305 plusmn 205
Af-1 ha (n = 63)Minimum 1000 246 78 9Maximum 1486 781 661 814Mean plusmn SD 1023 plusmn 0104 475 plusmn 91 404 plusmn 138 456 plusmn 237
Am-full (n = 512)Minimum 0250 144 36 0Maximum 5000 3251 2999 841Mean plusmn SD 0968 plusmn 0442 571 plusmn 277 824 plusmn 548 193 plusmn 156
Am-1 ha (n = 144)Minimum 1000 324 36 9Maximum 1500 860 2110 650Mean plusmn SD 1021 plusmn 0100 585 plusmn 99 746 plusmn 45 153 plusmn 137
1061Climate and rain forest tree α-diversity
copy 2007 The AuthorsJournal compilation copy 2007 British Ecological Society Journal of Ecology 95 1058ndash1071
varied greatly in size and shape and although areawas known for each plot the x ndash y dimensions wereunknown for 46 of the Amazonian data set To controlfor the possible influence of plot area number of treesand of plot dimensions (shape) on Fisherrsquos α valuesresults are presented for those reduced data sets thatmet stricter selection criteria as well as for each fulldata set The criteria for the reduced data set are thatplot area is between 10 and 15 ha and that plot lengthis le 500 m For convenience we refer hereafter tothese data sets as the full and c 1-ha data sets usingthe following codes Af-full Af-1 ha Am-full Am-1 ha(where Af = African Am = Amazonian)
Climatic data were extracted from the WorldClim data-base (httpwwwworldclimorg Hijmans et al 2005)which provided globally interpolated values for 19bioclimatic variables (see Table 2)
In addition dry season length (DSL) was calculatedfrom the mean monthly rainfall values (DSL = numberof months lt 100 mm) We refer hereafter to the 19 originalWorldClim variables plus the calculated dry season lengthas lsquo20 climatic variablesrsquo WorldClim also provided anelevation layer based on the Shuttle Radar TopographyMission (SRTM) We extracted the elevation of each datapoint from this SRTM layer WorldClim is based ondata from 1950 to 2000 and has a spatial resolutionof 30 arc s (approximately 1 km) although it must beremembered that in the tropics these data were derivedfrom a very sparse network of climatological observations
Our definition of Amazonia follows Eva amp Huber(2005) including lowland Amazonia the Guyanasand the Tocantins and Gurupi regions to the east of theBrazilian Amazon Basin (Fig 1b) The boundaries ofthe Western and central African rain forest areas were
Fig 1 Tree α-diversity patterns in the rain forests of (a) Africa and (b) Amazonia The focus of the analyses presented in thepaper is a 25-km size squared pixel On these maps pixel size is 50 km for display The 50-km2 pixelrsquos value is the mean Fisherrsquosα value resulting from the aggregation of the 25-km2 pixels The potential rain forest area considered for this study is around 249million ha in Africa vs 668 million ha in Amazonia Note that intervals used are not the same in both continents
1062I Parmentier et al
copy 2007 The AuthorsJournal compilation copy 2007 British Ecological Society Journal of Ecology 95 1058ndash1071
digitized from the land-cover map presented by Mayauxet al (2004) The external boundaries of the originalcover of the rain forest were estimated from the presentextent of the closed evergreen lowland forest degradedevergreen lowland forest and mosaic forestcroplands(Fig 1a)
Following ter Steege et al (2003) tree α-diversity wasestimated with Fisherrsquos α calculated for trees dbh ge10 cm Fisherrsquos α is a constant that represents diversityin a logarithmic series estimating the number of speciesS within N observed individuals (Magurran 2004)S = α ln(1 + Nα) It has been shown elsewhere thatFisherrsquos alpha is a good approximation of the thetaindex in the neutral theory of biogeography and bio-diversity (Etienne amp Alonso 2005) Theta is interpretedas the diversity of the species pool of which the plot is butone sample Condit et al (1998) compared the valuesof several diversity indices between different plots as afunction of the number of individuals sampled In theirstudy Fisherrsquos α gave fairly invariant estimates of diver-sity ratios between plots in all samples of gt 50 individualsNevertheless they recommend that comparisons bebased on samples of approximately standardized num-bers of stems and that samples of fewer than 50 stems(or in very diverse forests of fewer than 100 stems)should be excluded from analysis
Plot area and number of stems were variable in ourfull data sets (Table 1) which as just indicated can biasdiversity estimates In the c 1-ha data sets we controlledfor size and dimensions and consequently we also limitedthe variation in number of stems with the smallest samplebeing 246 trees well above the 50 and 100 thresholds iden-tified by Condit et al (1998) Fisherrsquos α was calculatedfor each plot but to reduce concerns about spatial autoc-orrelation within the data (Lennon 2000 Diniz-Filhoet al 2003) data points have been aggregated to a pixelsize of 25 km Each 25-km pixel was given the mean αvalue of plots included inside the pixel area We madeno interpolation many pixels inside each rain forestarea included no plot and remained as no data Thefocal scale of the analysis sensu Whittaker et al (2001)is thus the mean α of small plots inside a 25-km sizesquare After aggregation the full and c 1-ha data setsincluded respectively 698 and 38 pixels for Africa and307 and 84 pixels for Amazonia We further refer tothese 25-km size pixels as the aggregated data Exceptin Table 1 all diversity results presented are for theaggregated data The values of the climatic variablesand altitude were extracted for the centre of the pixelGeographical data were manipulated with ArcGISreg91 (ESRI Redlands CA USA)
We used Pearsonrsquos correlation coefficient to measurethe relationship of Fisherrsquos α with the 20 climatic vari-ables and altitude The t-tests of these correlations werecorrected to take spatial autocorrelation into account
Table 2 Correlations of 20 climatic variables and altitude to tree α-diversity in the rain forests of Africa and Amazonia for thefull data sets and for the c 1-ha data sets (plots with area 1ndash15 ha and maximal length 500 m aggregated data) Af Africa AmAmazon p ordinary t-test le 005 t-test with Dutilleul correction le 005 Mean diurnal Tdeg range = mean of monthly(maximum Tdeg ndash minimum Tdeg) isothermality = mean diurnal rangeTdeg annual range Tdeg seasonality = SD times 100 Tdeg annualrange = maximum Tdeg warmest month ndash minimum Tdeg coldest month P seasonality = coefficient of variation A quarter is a periodof three successive months
nVariable
Af-full Am-full Af-1 ha Am-1 ha
698Corr p
307Corr p
38Corr p
84Corr p
Mean annual Tdeg mT ndash035 021 ndash044 NSMean diurnal Tdeg range mdrT 020 ndash029 NS NSIsothermality isoT 029 039 NS 032 Tdeg seasonality Tsea ndash027 ndash031 NS ndash025 Maximum Tdeg warmest month Twm ndash032 ndash018 ndash041 NSMinimum Tdeg coldest month Tcm ndash038 029 NS 025 Tdeg annual range Tar NS ndash036 NS ndash026 Mean Tdeg wettest quarter Tweq ndash037 016 ndash050 NSMean Tdeg driest quarter Tdq ndash039 021 ndash040 023 Mean Tdeg warmest quarter Twaq ndash037 015 ndash044 NSMean Tdeg coldest quarter Tcq ndash032 025 ndash046 024 Annual precipitation aP 023 040 NS 036 P wettest month Pwm 022 ndash009 NS NSP driest month Pdm NS 055 NS 034 P seasonality Psea 025 ndash059 NS ndash033 P wettest quarter Pweq 024 NS NS NSP driest quarter Pdq ndash009 053 NS 031 P warmest quarter Pwaq 034 031 032 NSP coldest quarter Pcq ndash008 030 NS 046 Dry season length dsl NS ndash047 NS ndash022 Altitude alt 037 ndash022 034 NS
1063Climate and rain forest tree α-diversity
copy 2007 The AuthorsJournal compilation copy 2007 British Ecological Society Journal of Ecology 95 1058ndash1071
(Dutilleul 1993) using PASSaGE version 11 (httpwwwpassagesoftwarenet Rosenberg 2001)
As a first step in understanding any differences inα-diversity between the two continents we needed toestablish whether the climate regimes of the two rainforest regions are comparable This we did at two levelsfirst comparing the climate space of the entire rainforest biome and second comparing the climate spaceof the pixels for which we had diversity data In order tocompare the complete climatic space of the two rainforest areas the WorldClim pixels within each rain forestregion were systematically subsampled with a similarintensity (~15) in the two continents (African = 45 844 Amazonia n = 112 986) Subsampling wasrequired because analysis of every pixel in the climatespace was too burdensome on computer processingpower
Principal components analysis (PCA) of the 20 climaticvariables was applied to extract the main climaticgradients in (i) the subsample of the WorldClim pixelsof each rain forest area separately and (ii) the com-bined diversity data sets of the two continents Thisallowed us to assess (i) how well each diversity data setrepresents the climate space of each rain forest region(ie either Africa or Amazonia) and (ii) the climaticsimilarity between the two diversity data sets PCA wasperformed for the full and for the c 1-ha data sets
In the interaction model proposed by ter Steegeet al (2003) for the α-diversity of Amazonian foreststree α-diversity (Z) is a linear function of the dry seasonlength and a variety of undefined lsquoother interactingfactorsrsquo (OIFs)
Z = α + β(1 ndash OIF) DSL + ε
where α and β are constants and ε is an error term IfOIF = 0 (the upper bound of the distribution for DSL)this reduces to
Z = α + β (DSL) + ε
This is equal to the maximum Z for a given DSL Thismodel was efficient in predicting the lsquomaximalrsquo diver-sity for a given DSL in Amazonia Here we tested thismodel on the African data set The parameters α andβ were estimated by applying quantile regression(Cade et al 1999) for the 90th percentile where OIFapproaches zero
Results
In both continents there is great variation in α-diversityof forest stands and this can apply at very local scalespixels with low Fisherrsquos α values are found almosteverywhere In Africa pixels with high diversity valuesare clustered in the Western portion of central Africa(Fig 1a) In Amazonia the most diverse stands are locatedin a narrow latitudinal band just south of the equatorwith the highest concentration of very high diversityvalues in the western part of this band (Fig 1b)
Mean α-diversity in Amazonia is much greater thanin Africa (MannndashWhitney U-test P lt 0001 mean αAfrica = 26 mean α Amazonia = 81) Low diversityvalues are present in both continents but high diversityvalues (α gt 100) are absent from Africa (Fig 2) Thisresult is maintained in the c 1-ha data sets (P lt 0001mean α Africa = 36 mean α Amazonia = 69 Fig 2)
The rain forest region in Africa features lower meanvalues for most precipitation variables It also has highermean elevation lower mean temperature and highermean temperature seasonality than the Amazonianrain forest region (see Appendix S2)
The position of the four diversity data sets inside theclimatic space of the corresponding rain forest area ispresented in Fig 3 The diversity data set for Amazoniaspans the climate space of Amazonia very well The
Fig 2 Tree α-diversity of small forest plots in terra firme forest (lt 900 m altitude) in Africa (Af) and Amazonia (Am) aggregateddata full-data sets (n Af = 698 n Am = 307) c 1-ha data sets (n Af = 38 n Am = 84) and points that are inside the climatic overlapbetween the two c 1-ha data sets (over n Af = 34 n Am = 35)
1064I Parmentier et al
copy 2007 The AuthorsJournal compilation copy 2007 British Ecological Society Journal of Ecology 95 1058ndash1071
Fig 3 Climatic position of the diversity pixels (aggregated data) in relation to the climate of their respective rain forest area ThePCA axes are the two main climatic gradients in each rain forest area and are thus not comparable between the two rain forestareas (PCA of 20 climatic variables Africa n = 45 844 Amazonia n = 112 986 Axis 1 horizontal Axis 2 vertical) These axesrepresent 60 of the total climatic variance in Africa and 66 in Amazonia For the significance of these axes see Appendix S3Black points are the position of the diversity data points inside that climatic space (up c 1-ha data sets down full data sets)Shaded points are a random selection of ~1-km pixels inside the rain forest area (only 30 000 pixels are displayed for each rainforest area but these represent fairly the pattern of the whole rain forest pixel sample)
Fig 4 Principal components analysis of 20 bioclimatic variables for the two c 1-ha diversity data sets (Africa n = 38 Amazonian = 84 aggregated data) Axis 1 represents 43 of the climatic variance and axis 2 represents 22 Symbol sizes are proportionalto the Fisherrsquos α value of the pixel (class interval is 20) Details on the variables are provided in Table 2 and details on the PCAin Appendix S4 The scaling factor between the scores of the climatic variables and the scores of the pixels is 026 The arrowsrepresenting the climatic variables should continue to the origin we suppressed their basal part to increase the readability of thefigure Results for the full data sets are presented in Appendix S6
1065Climate and rain forest tree α-diversity
copy 2007 The AuthorsJournal compilation copy 2007 British Ecological Society Journal of Ecology 95 1058ndash1071
African diversity data set coverage appears less com-plete lacking extreme values on the two main climaticgradients Note that the main climatic axes are differentin the two continents PCA details and loadings of the20 climatic variables on the PCA axes for each continentare given in Appendix S3 Mean values of the climaticvariables for the diversity data sets are presented inAppendix S2 where they can also be compared withthose of each rain forest region
The two c 1-ha diversity data sets (Amazon and Africa)are presented in a common PCA climate space in Fig 4(for details see Appendix S4) The first two PCA axesrepresent 65 of the climatic variability The climatevariables cluster into three main groups in the top leftare variables associated with high precipitation andisothermality in the bottom right are variables associ-ated with low precipitation and high seasonality and inthe bottom left are variables associated with high tem-peratures Note that in this data set the precipitationand seasonality variables are largely orthogonal to thetemperature variables and in particular that totalannual precipitation (aP) is almost exactly orthogonalto mean annual temperature (mT) Hence we can rotatethe PCA axes in Fig 4 and adequately describe theclimate space covered by the first two PCA axes by plot-ting annual precipitation against annual temperatureAs these two fundamental climatic variables are moreintuitive than the PCA axes and more readily availableworldwide we adopt them as our main axes of climatevariability in our subsequent analysis
There is only a partial climatic overlap between thec 1-ha diversity data sets in Amazonia and in Africa(Fig 4) In Amazonia the main climatic gradient isrelated to precipitation variables and to precipitationand temperature seasonality (top left to bottom right)In Africa the main climatic gradient is mainly relatedto temperature variables (top right to bottom left) TheAfrican pixels are generally drier than the Amazonianpixels
‒
Correlations of the 20 climatic variables and altitudewith the tree α-diversity are presented in Table 2 (resultsfor untransformed data) The t-tests of these correlationswere corrected to take spatial autocorrelation intoaccount We did not apply Bonferroni corrections formultiple testing Nevertheless except for the Amazonianc 1-ha data set the number of significant correlationsis largely greater than would be expected by chanceResults for transformed data (improving the normalityof the distribution of the diversity data andor the othervariable) are in accordance with those for the untrans-formed data (see Appendix S5) The climatic variablesthat are best correlated with tree α-diversity differbetween the two continents or are correlated in oppo-site directions The most significant correlations withα-diversity in Africa are negative with temperature andpositive with altitude and precipitation of the warmest
quarter In Amazonia the best correlations are positivewith precipitation and isothermality and negative withprecipitation seasonality
The highest α-diversity values are found in Amazo-nian pixels in the wet and aseasonal regions climaticregimes scarcely represented in the African data (topleft of Fig 4) Indeed most African pixels are on thedry and seasonal side of the graph As these climaticdifferences between the two data sets might explain thediversity differences we calculated the mean diversityvalues for the pixels within the PCA (axes 1 and 2) ordi-nation of the combined c 1-ha diversity data sets wherethere was overlap between the African and Amazoniandata (Appendix S4) Even within this subset α-diversityis much greater in Amazonia than in Africa (MannndashWhitney U-test P lt 0001 mean Africa = 20 meanAmazonia = 61 Fig 2)
As the mean annual precipitation and mean annualtemperature gradients are orthogonal (above Fig 4)these two variables are good candidates for a furtherclimate-controlled comparison of α-diversity across thetwo data sets (Fig 5 and Appendix S6) For low valuesof temperature and precipitation African diversity is
Fig 5 Mean annual precipitation and temperature for the c1-ha diversity data sets (aggregated data) Circles sizes areproportional to the Fisherrsquos α value of the pixel (open circlesAmazonian shaded circles Africa) The graph has beendivided into sections Numbers indicate the mean Fisherrsquos αvalue and standard deviation in each section the number ofpixels is given in parentheses (Amazonia values are italicized)Results for the full data sets are presented in Appendix S6
1066I Parmentier et al
copy 2007 The AuthorsJournal compilation copy 2007 British Ecological Society Journal of Ecology 95 1058ndash1071
similar to (c 1-ha data sets) or higher than (full data sets)Amazonian diversity For wetter and warmer climatesthe difference between the diversity values of the twocontinents widens (Fig 5)
In Amazonia DSL is negatively correlated with theupper quantile of α-diversity (P lt 00001 Fig 6) InAfrica the highest diversity values correspond tointermediate DSL values and no significant linear rela-tionship is observed between lsquomaximalrsquo α-diversity andDSL (P = 0971 Fig 6) Results for the c 1-ha data setsare similar for Africa In Amazonia the negative cor-relation of DSL with the upper quantile of α-diversityis weaker (see Appendix S7)
Discussion
This analysis is focused on a diversity index Fisherrsquos αcalculated for trees ge 10 cm dbh for small rain forestplots with greatest weight placed on the analysis ofdata for plots of area between 1 and 15 ha (the c 1-hadata sets) Our analyses are thus of a measure of within-community (local scale) diversity Although the resultspresented here might differ from those we would obtainif analysing coarse-scale diversity data (eg Field et al2005) it is always the case that comparisons of diver-sity should be made with reference to scale (Whittakeret al 2001) Furthermore there are insufficient data
currently available for a reliable comparison at sub-stantially larger plot sizes than detailed herein
There are significant data gaps for both continentsowing to a paucity of inventories from large areas inparticular within tropical Africa The superposition ofour data set with the distribution of closed evergreenlowland forest in Africa (Mayaux et al 2004) indicatesthat we lack data primarily from Liberia and for the largeforest areas of D R Congo Significant gaps occur alsoin the Brazilian regions adjacent to the Guyanas thecentral Colombian Amazon and large tracts of the (dryand seasonal) southern Brazilian Amazon (ter Steegeet al 2003)
The accuracy of the climate data (WorldClim) ismainly dependent upon the density of weather stationsand on the quality of the interpolation The accuracy ofinterpolated precipitation data in mountainous areas isnot particularly good because of extreme local rainfallgradients Areas with low population density such asAmazonia have few weather stations and most of theseare located at the periphery of or along rivers In Africathe distribution of the weather stations is quite goodexcept in some parts of D R Congo This country alsohas very few climate data after 1960 Although theseweaknesses in the climatic data certainly may affect thevalues of the climatic variables for individual points wedo not consider that they seriously undermine the ana-lyses presented Our analysis is further limited by theclimatic variables we used We included the 19 variablesprovided by WorldClim and added the dry season lengthto aid comparison with ter Steege et al (2003) These20 variables are calculated from monthly rainfall andtemperature variables There is no doubt these are keyclimatic variables although others could have beenselected (cf OrsquoBrien 1998)
We arbitrarily selected the plots under 900 m asl inorder to limit the elevational variation between Africaand Amazonia and to exclude submontane forestHowever it is well known that the lower elevationallimit of submontane forest is highly variable (Richards1996 Ashton 2003 Senterre 2005) A selection of sim-ilar forest types between the two continents based onthe forest structure functional types or the presence orabsence of indicator species would have been morerigorous but was not possible here because we lackdetailed data for most of the current data points
The quality of the diversity data is variable Thenumber of individuals that will be identified or attri-buted to a morpho-species is dependent upon the experi-ence of the botanist who made the inventory as well ason the time spent on taxonomic analysis and the degreeof specimen vouchering Additional uncertainties arisefrom the fact that for some data points it is not knownwhether lianas were also included in the number ofindividuals with dbh ge 10 cm and how multistemmedindividuals were considered (number of stems dbh ge10 cm vs numbers of individuals)
We selected plots in old-growth terra firme forest Incompiling the African data set we obtained data for
Fig 6 Tree α-diversity (full data sets aggregated data) as afunction of the dry season length Lines are the quantileregressions (quantile 09 Africa P = 0419 AmazoniaP lt 00001) Results for the c 1-ha data set are presented inAppendix S7
1067Climate and rain forest tree α-diversity
copy 2007 The AuthorsJournal compilation copy 2007 British Ecological Society Journal of Ecology 95 1058ndash1071
some plots that were known to have been selectivelylogged more than 15 years before the plot was recordedWe discarded these plots from the c 1-ha data set Never-theless it is very difficult to be certain that a forest hasnever been logged in the past
Plot shape and dimensions are also well known toinfluence diversity data a long and narrow transect islikely to include more species than a short and wideplot of similar area (Condit et al 1996 Laurance et al1998) We also know that Fisherrsquos α is sensitive to thenumber of individuals (Condit et al 1998) We pre-sented two series of results for our full data set and fora subset limited to plots of 1ndash15 ha that did not exceed500 m in length (c 1-ha data set) As both series of resultsare comparable our analyses seem fairly robust to thesampling variation involved
‒
Within each continent tree α-diversity is correlatedwith climatic variables However the explanatory powerof contemporary climatic controls is questioned bythe substantial differences in the form of the climate ndashα-diversity relationships in Africa and Amazonia(Table 2 Fig 6) This might indicate that either thecontemporary climate cannot provide a fundamentalexplanation for the diversity patterns in both continentsor that our simple empirical approach to determiningthese relationships has failed to recognize the real formof the underlying relationships to climate (for a theo-retically grounded approach see OrsquoBrien 1998 2006Field et al 2005) We also have to remember that thereis only a partial climate overlap between the two diver-sity data sets (Fig 4) which limits direct comparison ofthe diversityndashclimate relationships between the twocontinents
There are many theoretical arguments and empiricalobservations for the variation in different facets ofdiversity phenomena across and within the worldrsquos rainforests (Givnish 1999 Leigh et al 2004) Drivers ofenvironmental change relate to several time framesand heterogeneity in contemporary environment maybe differentially evident at different spatial scales ofanalysis (Willis amp Whittaker 2002) It is very difficultto confidently link analyses of α-diversity variation todeterministic environmental factors andor stochasticand historical factors We cannot evaluate the applic-ability of most ideas and theories that have been putforward in a meaningful way The discussion that followsis therefore necessarily speculative in nature
Animals have an effect on tree α-diversity and foreststructure they disperse the seeds of some tree speciesand predate others while some mega-fauna (eg Africanelephant) are known to cause stem damage and mortality(Silman et al 2003 Sheil amp Salim 2004) Regional vari-ations in the composition density and distribution of thefauna might therefore influence tree diversity patterns
A positive correlation between soil fertility and treediversity has been demonstrated in other studies (eg
Dubbin et al 2006 ter Steege et al 2006) Phillips et al(1994) showed that mean annual tree mortality andrecruitment (ie stem turnover) is a good correlate ofspecies richness We did not test for the correlationsof these two factors with α-diversity in our data setbecause for most of the points we lack soil fertility dataand multicensus data
The mid-domain effect argument (Colwell amp Lees2000 Rangel amp Diniz-Filho 2005) proposes that speciesrichness gradients may arise by stochastic processescombined with geometrical constraints imposed by theedges of the domain in which species are embeddedand by the cohesion of the speciesrsquo geographical rangesThis line of argument appears of little relevance to pat-terns in the alpha-scale diversity metric analysed hereinand hence we do not consider it further
There is some evidence that the Pleistocene andHolocene histories of climate and vegetation of the tworain forest areas have been quite different and mighthave a relevance to understanding variation in diversityat a variety of scales Whilst Pleistocene climate changeclearly impinged on Amazonia recent palaeo-ecologicalanalyses indicate that the rain forests persisted withoutlarge-scale simultaneous reduction in their extent acrossthe basin (Morley 2000 Colinvaux et al 2001 Bush ampSilman 2004 Cowling et al 2004 Mayle et al 2004Maslin et al 2005) It is therefore reasonable to postu-late that macro-scale species richness patterns acrossAmazonia should correspond to expectations of water-energy theory highest diversity where globally optimaltemperatures high precipitation and low seasonalityare combined (OrsquoBrien 1993 1998 2006 Field et al2005) By comparison the African tropics are thoughtto have experienced more dramatic vegetation changesduring the Pleistocene and Holocene (Dupont et al 2000Morley 2000 Elenga et al 2004) During the driest andcoolest periods of the Pleistocene (06ndash0 Ma) Africanrain forests are thought to have been restricted torefuges from which they subsequently spread duringthe Holocene (Maley 1996 Morley 2000) Most authorsagree on the location of the African Pleistocene forestrefuges but there is controversy concerning their extent(Colyn et al 1991 Robbrecht 1996 Sosef 1996 Leal2001) Our African data set presents a concentrationof data points of high α-diversity in proximity to orwithin the proposed locations of the Pleistoceneforest refuges This might indicate that high α-diversityvalues are favoured by long-term suitability of the areafor tropical lowland forest taxa and thus by a largeregional species pool size
Recent studies analysing palaeo-ecological datafrom both marine and terrestrial signals suggest thatclimate changes also occurred in the equatorial regionof West Africa during the late Holocene around 4ndash38 kyr (Marret et al 2006) and around 3 kyr
(Vincens et al 1999) Maley (2002) describes a cata-strophic destruction of African forests about 2500 yearsago These Pleistocene and Holocene events could pos-sibly still exert an influence on present-day vegetation
1068I Parmentier et al
copy 2007 The AuthorsJournal compilation copy 2007 British Ecological Society Journal of Ecology 95 1058ndash1071
For instance some part of the rain forest species poolmay not have had enough time since these events toreach all the areas that are forested today yielding adispersal limitation gradient from the forest refugia tothose areas that were covered in savanna The correla-tions of tree α-diversity with the climatic variables andaltitude we describe here for the African data set mighttherefore reflect a greater degree of departure of speciesdistributions from equilibrium with current climatethan pertains in Amazonia Such imbalances as aconsequence of slow post-glacial spread from iceage refuges are well described in Europe (eg Arauacutejo ampPearson 2005 Giesecke et al 2007) but our currentunderstanding of such phenomena in the tropicsremains tantalisingly uncertain
The lower overall floristic diversity of tropical Africawhen compared with tropical America and Asia is welldocumented (Richards 1996 Primack amp Corlett 2005)However at the local or community level Reitsma(1988) and Gentry (1988) showed that a hectare ofAfrican rain forest may contain the same level of α-diversity as many equivalent areas in Southeast Asiaand tropical South America Here we provide a formalcomparison of tree α-diversity between the Africanand Amazonian rain forests that has been calibratedfor climate For low values of mean annual temperatureand mean annual rainfall the tree α-diversity of smallplots in Africa is equivalent or even superior to that inAmazonian rain forests but when both mean annualtemperature and mean annual precipitation increasethe difference between the diversity values increases(Fig 5) Gentry (1988) using a much smaller data setobtained similar results for all species with dbh gt 25 cmthe Central African rain forests may be as diverse astheir Neotropical equivalents for sites with precipita-tion of 1600ndash2000 mm In our data set for combinedhigher values of precipitation and temperature it maybe argued that African forests were not able to fill upthe lsquospecies holding capacitiesrsquo that the climate providespossibly because there are insufficient species in theregional pool that are adapted to warm wet conditionsIndeed the regional species-pool theory relates localspecies richness to the richness of the regional speciespool from which the local community was presumablyassembled (Fox amp Srivastava 2006) The regional poolof species adapted to cool dry conditions may be quitelarge in Africa however because of its palaeoclimatichistory explaining why in cool dry conditions Africanplots seem to have similar or possibly higher diversitythan Amazonian plots
We expect a smaller regional species pool of tree spe-cies adapted to warm and wet conditions in Africa thanin Amazonia due to the contrasting history of climateand vegetation of the two rain forest areas At the endof the Middle Miocene savanna expanded over much
of the African tropics at the expense of rain forests andlarge areas of the continent underwent uplift prevent-ing many lowland rain forest taxa from dispersing intosuitable low-altitude habitats This resulted in wide-spread extinction in the rain forest flora from the LateMiocene into the Pliocene (Morley 2000) In contrastpalaeoclimate and palaeoecological records suggestthat tropical forests were established in the lowlands ofAmazonia at least by the end of the Miocene and havebeen continuously maintained since then (Willis ampMcElwain 2002 Maslin et al 2005) This prolongedenvironmental constancy may have minimized extinc-tion rates in Amazonia (Morley 2000 Colinvaux amp DeOliveira 2001) Extinction processes are also likely tobe stronger in Africa than in Amazonia because of thesmaller African rain forest area Smaller area is asso-ciated with smaller population sizes which in turnenhances extinction risk According to the rain forestlimits used in this study the potential rain forest areacorresponding to the current climate is around 249million ha in Africa vs 668 million ha in Amazonia Asspeciation and extinction are processes that operateover millions of years an adequate test of arearsquoscontribution to diversity patterns must take intoconsideration the fact that biome areas have changedthrough time in response to climate Both the size andthe age of a biome are important factors in explainingits current species richness but only when an integratedmeasure of both factors is included (Fine amp Ree 2006)Such an analysis has not been performed for the trop-ical rain forests of the two continents
A simple way to evaluate the regional species poolhypothesis would be to compare the number of wet-affiliated trees in the flora of the two rain forest areas Asfar as we know such figures have not yet been calculatedFine amp Ree (2006) provide estimates of the number oftree species for the Neotropics (22 500) and Africantropics (6500) Although their definition of lsquotropicsrsquo isvery large (areas that never experience 0 degC temperature)and also includes dry forest and miombo it is likelythat a similar proportion applies also for the number ofrain forest tree species We would predict that tropical Africaand Amazonia have similar regional pool sizes of dry-affiliate rain forest tree species (possibly with Africa havinga slightly larger pool) but that Africa has a greatly reducedpool of wet-affiliate rain forest tree species
It has also been speculated that the lower diversity ofthe African vs the Amazonian rain forest could resultfrom a stronger anthropogenic impact in Africa (Rich-ards 1973) This theory is based mainly on the discoveryof charcoal and pottery below mature forests (White ampOates 1999) and on the fact that many of the large treespecies that dominate the African rain forests are foundto recruit poorly within the forest (especially the light-demanding species van Gemerden et al 2003) Thepresence of canopy gaps is insufficient for the regenera-tion of these trees they might need larger-scale distur-bances such as those produced by shifting cultivationHowever our knowledge of the extent and intensity of
1069Climate and rain forest tree α-diversity
copy 2007 The AuthorsJournal compilation copy 2007 British Ecological Society Journal of Ecology 95 1058ndash1071
the long-term human occupation of the rain forestsis limited especially in Amazonia (Heckenberger et al1999 2003) as is our understanding of its effects onforest diversity It is therefore difficult to evaluatethe historical anthropogenic impacts on rain forestα-diversity within the two continents
Conclusion and perspectives
Analysis of large data sets (ie AH Gentryrsquos workSlik et al 2003) and the existence of extended scientificnetworks (ATDN RAINFOR CTFS) have stronglyimproved our knowledge of rain forest diversityvariation providing a basis for intensive and efficientresearch Such coordinated efforts are insufficientlydeveloped in Africa and as a consequence the literatureabout rain forest diversity often lacks reference toAfrican data Our comparison of the tree α-diversity ofsmall plots in the African and Amazonian rain forestshas highlighted the large differences in one facet ofdiversityndashclimate relationships between the two con-tinents that pertaining to the alpha diversity values ofsmall blocks of forest In the future understanding ofthe lower species richness and diversity of African rainforests relative to Amazonian and South-East Asian rainforests will certainly benefit from phylogenetic studiesof the African forestrsquos component species (Penningtonet al 2004 Plana 2004) and from further intercon-tinental comparative analyses of the structure anddynamism of rain forest communities
Acknowledgements
We wish to thank C Adou Yao M Betafo P Dutilleul GEilu C Ewango E Fombod T Hart J Miller RLadle M Ndoundou-Hockemba D M Newbery LNgok Banak Z Nitua Ngoe P Nkeng R Nyanga-douma T Nzabi D Obiang A D Poulsen U Saba PSavill G Walters J Wong H Wright and all the peoplewho contributed to the field collection of these datasets The following institutions projects and networkscontributed to fund the research and to organize thefield work ATDN CARPE CTFS CUREF DFID(UK) DIVEAC ECOFAC FNRS Forest Resourcesand People Ghanaian Forestry Service Limbe BotanicGarden Marie Curie Fellowship Association (EU)National Geographic Society National Herbariumof Gabon Missouri Botanical Garden RAINFORSmithsonian Institution Tropenbos CameroonProgramme USAID The Royal Society and WildlifeConservation Society The Wiener-Anspach Foundationfunded IPrsquos research grant We thank Jeacuterocircme Chaveand an anonymous referee for their constructive com-ments on an earlier draft of this paper
References
Arauacutejo MB amp Pearson RG (2005) Equilibrium of speciesrsquodistributions with climate Ecography 28 693ndash695
Ashton PS (2003) Floristic zonation of tree communities onwet tropical mountains revisited Perspectives in Plant EcologyEvolution and Systematics 6 87ndash104
Bush MB amp Silman MR (2004) Observations on late Pleis-tocene cooling and precipitation in the lowland NeotropicsJournal of Quaternary Science 19 677ndash684
Cade BS Terrell JW amp Schroeder RL (1999) Estimatingeffects of limiting factors with regression quantiles Eco-logy 80 311ndash323
Clinebell RR Phillips OL Gentry AH Stark N ampZuuring H (1995) Prediction of Neotropical tree and lianaspecies richness from soil and climatic data Biodiversityand Conservation 4 56ndash90
Colinvaux PA amp De Oliveira PE (2001) Amazon plantdiversity and climate through the Cenozoic Palaeogeo-graphy Palaeoclimatology Palaeoecology 166 51ndash63
Colinvaux PA Irion G Rasanen ME Bush MB amp deMello J (2001) A paradigm to be discarded geologicaland paleoecological data falsify the Haffer amp Prancerefuge hypothesis of Amazonian speciation Amazoniana-Limnologia et Oecologia Regionalis Systemae FluminisAmazonas 16 609ndash646
Colwell RK amp Lees DC (2000) The mid-domain effectgeometric constraints on the geography of species richnessTrends in Ecology and Evolution 15 70ndash76
Colyn M Gautier-Hion A amp Verheyen W (1991) A re-appraisal of paleoenvironmental history in central Africa ndashEvidence for a major fluvial refuge in the Zaire basin Journalof Biogeography 18 403ndash407
Condit R Foster RB Hubbell SP Sukumar R LeighEG Manokaran N Loo de Lao S LaFranckie JV ampAshton PS (1998) Assessing forest diversity on smallplots calibration using species-individual curves from50 ha plots Forest Biodiveristy Research Monitoring andModelling (eds F Dallmeier amp JA Comiskey) pp 247ndash268 UNESCO Paris and the Parthenon Publishing GroupNew York
Condit R Hubbell SP Lafrankie JV Sukumar RManokaran N Foster RB amp Ashton PS (1996) Speciesndasharea and speciesndashindividual relationships for tropical treesa comparison of three 50-ha plots Journal of Ecology 84549ndash562
Connell JH (1978) Diversity in tropical rain forests andcoral reefs Science 1999 1302ndash1310
Cowling SA Betts RA Cox PM Ettwein VJ Jones CDMaslin MA amp Spall SA (2004) Contrasting simulatedpast and future responses of the Amazonian forest toatmospheric change Philosophical Transactions of the RoyalSociety of London Series B-Biological Sciences 359 539ndash547
Diniz-Filho JAF Bini LM amp Hawkins BA (2003)Spatial autocorrelation and red herrings in geographicalecology Global Ecology and Biogeography 12 53ndash64
Dubbin WE Penn MG amp Hodson ME (2006) Edaphicinfluences on plant community adaptation in the Chiquibulforest of Belize Geoderma 131 76ndash88
Dupont LM Jahns S Marret F amp Ning S (2000)Vegetation change in equatorial West Africa time-slices forthe last 150 ka Palaeogeography Palaeoclimatology Palae-oecology 155 95ndash122
Dutilleul P (1993) Modifying the t test for assessing the correla-tion between two spatial processes Biometrics 49 305ndash314
Elenga H Maley J Vincens A amp Farrera I (2004) Paleo-environments palaeoclimates and landscape developmentin Atlantic Equatorial Africa a review of key sites coveringthe last 25 kyrs Past Climate Variability Through Europeand Africa (eds RW Battarbee F Gasse amp CE Sticley)pp 181ndash198 Kluwer Academic Publishers Dordrecht
Etienne RS amp Alonso D (2005) A dispersal-limitedsampling theory for species and alleles Ecology Letters 81147ndash1156
1070I Parmentier et al
copy 2007 The AuthorsJournal compilation copy 2007 British Ecological Society Journal of Ecology 95 1058ndash1071
Eva HD amp Huber O (2005) A proposal for defining the geo-graphical boundaries of Amazonia Synthesis of the Resultsfrom an Expert Consultation Workshop Organized by theEuropean Commission in collaboration with the AmazonCooperation Treaty Organization Office for Official Publica-tions of the European Communities
Field R OrsquoBrien EM amp Whittaker RJ (2005) Globalmodels for predicting woody plant richness from climatedevelopment and evaluation Ecology 86 2263ndash2277
Fine PVA amp Ree RH (2006) Evidence for a time-integratedspeciesndasharea effect on the latitudinal gradient in tree diver-sity The American Naturalist 168 796ndash804
Fisher RA Corbet AS amp Williams CB (1943) The relationbetween the number of species and the number of indi-viduals in a random sample of an animal population Journalof Animal Ecology 12 42ndash58
Fox JW amp Srivastava D (2006) Predicting localndashregionalrichness relationships using island biogeography modelsOikos 113 376ndash382
Francis AP amp Currie DJ (2003) A globally consistentrichnessndashclimate relationship for angiosperms AmericanNaturalist 161 523ndash536
van Gemerden BS Olff H Parren MPE amp Bongers F(2003) The pristine rain forest Remnants of historicalhuman impacts on current tree species composition anddiversity Journal of Biogeography 30 1381ndash1390
Gentry AH (1988) Changes in plant community diversity andfloristic composition on environmental and geographicalgradients Annals of the Missouri Botanical Garden 75 1ndash34
Giesecke T Hickler T Kunkel T Sykes MT amp BradshawRHW (2007) Towards an understanding of the Holocenedistribution of Fagus sylvatica L Journal of Biogeography34 118ndash131
Givnish TJ (1999) On the causes of gradients in tropical treediversity Journal of Ecology 87 193ndash210
Hawkins BA Field R Cornell HV Currie DJ GueganJF Kaufman DM Kerr JT Mittelbach GG Ober-dorff T OrsquoBrien EM Porter EE amp Turner JRG(2003) Energy water and broad-scale geographic patternsof species richness Ecology 84 3105ndash3117
Heckenberger MJ Kuikuro A Kuikuro UT Russell JCSchmidt M Fausto C amp Franchetto B (2003) Amazonia1492 pristine forest or cultural parkland Science 3011710ndash1714
Heckenberger MJ Peterson JB amp Neves EG (1999)Village size and permanence in Amazonia two archaeologicalexamples from Brazil Latin American Antiquity 10 353ndash376
Hijmans RJ Cameron SE Parra JL Jones PG ampJarvis A (2005) Very high resolution interpolated climatesurfaces for global land areas International Journal ofClimatology 25 1965ndash1978
Kier G Mutke J Dinerstein E Ricketts TH Kuper WKreft H amp Barthlott W (2005) Global patterns of plantdiversity and floristic knowledge Journal of Biogeography32 1107ndash1116
Kuper W Sommer JH Lovett JC amp Barthlott W (2006)Deficiency in African plant distribution data ndash missingpieces of the puzzle Botanical Journal of the Linnean Society150 355ndash368
Laurance WF Ferreira LV Rankin-de Merona JM ampHutchings RW (1998) Influence of plot shape on estimatesof tree diversity and community composition in centralAmazonia Biotropica 30 662ndash665
Leal ME (2001) Microrefugia small ice age forest remnantsSystematics and Geography of Plants 71 1073ndash1077
Leigh EG Davidar P Dick CW Puyravaud JP Ter-borgh J ter Steege H amp Wright SJ (2004) Why do sometropical forests have so many species of trees Biotropica36 447ndash473
Lennon JJ (2000) Red-shifts and red herrings in geograph-ical ecology Ecography 23 101ndash113
Magurran AE (2004) Measuring Biological DiversityBlackwell Oxford
Maley J (1996) The African rain forest ndash main characteristicsof changes in vegetation and climate from the UpperCretaceous to the Quaternary Proceedings of the RoyalSociety of Edinburgh 104 31ndash73
Maley J (2002) A catastrophic destruction of Africanforests about 2500 years ago still exerts a major influenceon present vegetation formations IDS Bulletin 33 13ndash30
Marret F Maley J amp Scourse J (2006) Climatic instabilityin west equatorial Africa during the Mid- and LateHolocene Quaternary International 150 71ndash81
Maslin M Malhi Y Phillips O amp Cowling S (2005) Newviews on an old forest assessing the longevity resilienceand future of the Amazon rainforest Transactions of theInstitute of British Geographers 30 477ndash499
Mayaux P Bartholome E Fritz S amp Belward A (2004) Anew land-cover map of Africa for the year 2000 Journal ofBiogeography 31 861ndash877
Mayle FE Beerling DJ Gosling WD amp Bush MB(2004) Responses of Amazonian ecosystems to climatic andatmospheric carbon dioxide changes since the last glacialmaximum Philosophical Transactions of the Royal Societyof London Series B-Biological Sciences 359 499ndash514
Morley RJ (2000) Origin and Evolution of Tropical Rain ForestsJohn Wiley amp Sons Chichester
Newbery DM van der Burgt XM amp Moravie MA(2004) Structure and inferred dynamics of a large grove ofMicroberlinia bisulcata trees in central African rain forestthe possible role of periods of multiple disturbance eventsJournal of Tropical Ecology 20 131ndash143
OrsquoBrien EM (1993) Climatic gradients in woody plant spe-cies richness towards an explanation based on an analysisof southern Africarsquos woody flora Journal of Biogeography20 181ndash198
OrsquoBrien EM (1998) Waterndashenergy dynamics climate andprediction of woody plant species richness an interim generalmodel Journal of Biogeography 25 379ndash398
OrsquoBrien EM (2006) Biological relativity to waterndashenergydynamics Journal of Biogeography 33 1868ndash1888
Pennington RT Cronk QCB amp Richardson JA (2004)Introduction and synthesis plant phylogeny and the originof major biomes Philosophical Transactions of the RoyalSociety of London Series B-Biological Sciences 359 1455ndash1464
Phillips OL Hall P Gentry AH Sawyer SA ampVasquez R (1994) Dynamics and species richness of trop-ical rain-forests Proceedings of the National Academy ofSciences of the United States of America 91 2805ndash2809
Plana V (2004) Mechanisms and tempo of evolution in theAfrican Guineo-Congolian rainforest Philosophical Trans-actions of the Royal Society of London Series B-BiologicalSciences 359 1585ndash1594
Plotkin JB Potts MD Yu DW Bunyavejchewin SCondit R Foster R Hubbell S LaFrankie J ManokaranN Seng LH Sukumar R Nowak MA amp Ashton PS(2000) Predicting species diversity in tropical forests Pro-ceedings of the National Academy of Sciences of the UnitedStates of America 97 10850ndash10854
Primack RB amp Corlett R (2005) Tropical Rain Forests anEcological and Biogeographical Comparison Blackwell Oxford
Rangel T amp Diniz-Filho JAF (2005) Neutral communitydynamics the mid-domain effect and spatial patterns inspecies richness Ecology Letters 8 783ndash790
Reitsma JM (1988) Forest Vegetation of Gabon The TropenbosFoundation Ede
Richards PW (1973) Africa the lsquoodd man outrsquo Tropical For-est Ecosystems of Africa and South America a ComparativeReview (eds BJ Meggers ES Ayensu amp WD Duckworth)pp 21ndash26 Smithsonian Institution Press Washington DC
1071Climate and rain forest tree α-diversity
copy 2007 The AuthorsJournal compilation copy 2007 British Ecological Society Journal of Ecology 95 1058ndash1071
Richards PW (1996) The Tropical Rain Forest an EcologicalStudy 2nd edn Cambridge University Press Cambridge
Robbrecht E (1996) Geography of African Rubiaceae withreference to glacial rain forest refuges The Biodiversityof African Plants (eds LJG van der Maesen XM vander Burgt amp JM van Medenbach de Rooy) pp 564ndash581Kluwer Dordrecht
Rosenberg MS (2001) PASSAGE Pattern Analysis SpatialStatistics and Geographic Exegesis Department of Bio-logy Arizona State University Tempe
Schulman L Toivonen T amp Ruokolainen K (2007) Ana-lysing botanical collecting effort in Amazonia and correctingfor it in species range estimation Journal of Biogeographydoi 101111j1365-2699200701716x
Senterre B (2005) Methodological research for the typologyof the vegetation and phytogeography of densest Africantropical forests Acta Botanica Gallica 152 409ndash419
Sheil D (1996) Species richness tropical forest dynamics andsampling questioning cause and effect Oikos 76 587ndash590
Sheil D (2001) Long-term observations of rain forest succes-sion tree diversity and responses to disturbance PlantEcology 155 183ndash199
Sheil D amp Salim A (2004) Forest tree persistence elephantsand stem scars Biotropica 36 505ndash521
Silman MR Terborgh JW amp Kiltie RA (2003) Popula-tion regulation of a dominant-rain forest tree by a majorseed-predator Ecology 84 431ndash438
Slik JWF Poulsen AD Ashton PS Cannon CHEichhorn KAO Kartawinata K Lanniari I Naga-masu H Nakagawa M van Nieuwstadt MGL PayneJ Purwaningsih Saridan A Sidiyasa K Verburg RWWebb CO amp Wilkie P (2003) A floristic analysis of thelowland dipterocarp forests of Borneo Journal of Bio-geography 30 1517ndash1531
Sosef MSM (1996) Begonias and African rainforest refugesgeneral aspects and recent progress The Biodiversity ofAfrican Plants (eds LJG van der Maesen XM van derBurgt amp JM van Medenbach de Rooy) pp 602ndash611Kluwer Dordrecht
ter Steege H Pitman NCA Phillips OL Chave J SabatierD Duque A Molino JF Prevost MF Spichiger RCastellanos H von Hildebrand P amp Vasquez R (2006)Continental-scale patterns of canopy tree composition andfunction across Amazonia Nature 443 444ndash447
ter Steege H Pitman N Sabatier D Castellanos H Vander Hout P Daly DC Silveira M Phillips O Vasquez RVan Andel T Duivenvoorden J De Oliveira AA Ek RLilwah R Thomas R Van Essen J Baider C Maas PMori S Terborgh J Vargas PN Mogollon H ampMorawetz W (2003) A spatial model of tree alpha-diversityand tree density for the Amazon Biodiversity and Conser-vation 12 2255ndash2277
Vincens A Schwartz D Elenga H Reynaud-Farrera IAlexandre A Bertaux J Mariotti A Martin LMeunier JD Nguetsop F Servant M Servant-Vildary Samp Wirrmann D (1999) Forest response to climate changesin Atlantic Equatorial Africa during the last 4000 yearsBP and inheritance on the modern landscapes Journal ofBiogeography 26 879ndash885
White LJT amp Oates JF (1999) New data on the history ofthe plateau forest of Okomu southern Nigeria an insightinto how human disturbance has shaped the African rainforest Global Ecology and Biogeography 8 355ndash361
Whittaker RJ Willis KJ amp Field R (2001) Scale and speciesrichness towards a general hierarchical theory of speciesdiversity Journal of Biogeography 28 453ndash470
Willis KJ amp McElwain JC (2002) The Evolution of PlantsOxford University Press Oxford
Willis KJ amp Whittaker RJ (2002) Species diversity ndash scalematters Science 295 1245ndash1248
Wills C Harms KE Condit R King D Thompson JHe FL Muller-Landau HC Ashton P Losos EComita L Hubbell S LaFrankie J Bunyavejchewin SDattaraja HS Davies S Esufali S Foster R Guna-tilleke N Gunatilleke S Hall P Itoh A John RKiratiprayoon S de Lao SL Massa M Nath CNoor MNS Kassim AR Sukumar R Suresh HSSun IF Tan S Yamakura T amp Zimmerman E (2006)Non-random processes maintain diversity in tropical forestsScience 311 527ndash531
Received 9 December 2006 accepted 21 May 2007Handling Editor David Burslem
Supplementary material
The following Supplementary material is available forthis article
Appendix S1 References and details for the Africantree α-diversity data set
Appendix S2 Mean and standard deviations of 20 cli-matic variables and altitude within (i) the whole rainforest area (ii) the full diversity data sets and (iii) the c1-ha diversity data sets
Appendix S3 Loadings of the PCA of the values of 20climatic variables for a systematic sampling inside therain forest area of Africa and of Amazonia and corre-lations between the climatic variables
Appendix S4 Loadings of the PCA of the values of 20climatic variables for the combined diversity datasets PCA graph for the full data sets PCA graph withthe limits of the climatic overlap for the c 1-ha datasets
Appendix S5 Correlations of 20 climatic variables andaltitude to the tree α-diversity in the rain forests ofAfrica and Amazonia transformed data
Appendix S6 Mean annual precipitation and temper-ature for the full diversity data sets (aggregated data)with circles sizes proportional to the Fisher alpha valueof the pixel
Appendix S7 Tree α-diversity as a function of the dryseason length (c 1-ha data sets aggregated data) andquantile regression
This material is available as part of the online articlefrom httpwwwblackwell-synergycomdoiabs101111j1365-2745200701273x
Please note Blackwell Publishing is not responsiblefor the content or functionality of any supplementarymaterials supplied by the authors Any queries (otherthan missing material) should be directed to the cor-responding author of the article
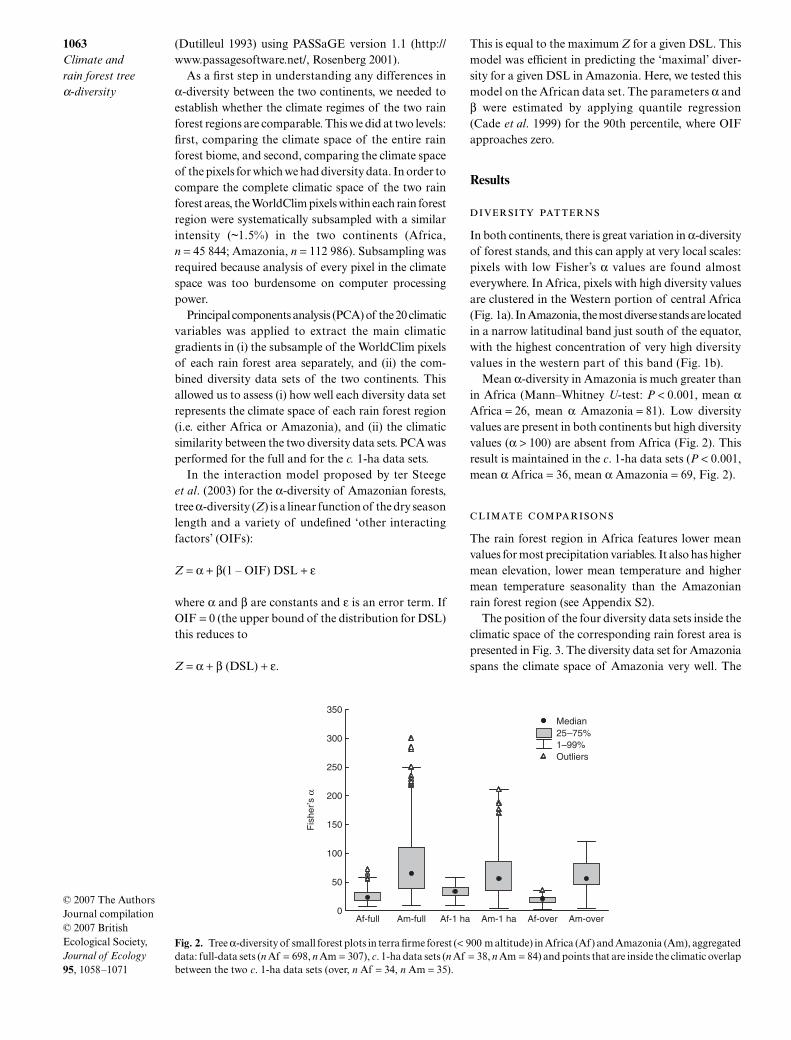