the nominees for management change - … nominees for... · the nominees for management change...
TRANSCRIPT

The Nominees for Management Change
February 6, 2012
Pershing Square Capital Management, L.P.

1
Disclaimer and Forward Looking Statements
1
The information contained in this presentation (“Information”) is based on publicly available information about Canadian Pacific Railway Limited (“CP”
or the “Company”), which has not been independently verified by Pershing Square Capital Management, L.P. ("Pershing Square"). Pershing Square
recognizes that there may be confidential or otherwise non-public information in the possession of CP or others that could lead CP or others to disagree
with Pershing Square’s conclusions. This presentation and the Information is not a recommendation or solicitation to buy or sell any securities.
The analyses provided may include certain forward-looking statements, estimates and projections prepared with respect to, among other things,
general economic and market conditions, changes in management, changes in Board composition, actions of CP and its subsidiaries or competitors,
the ability to implement business strategies and plans and pursue business opportunities and conditions in the railway and transportation industries.
Such forward-looking statements, estimates, and projections reflect various assumptions by Pershing Square concerning anticipated results that are
inherently subject to significant uncertainties and contingencies and have been included solely for illustrative purposes, including those risks and
uncertainties detailed in the continuous disclosure and other filings of CP and its subsidiary Canadian Pacific Railway Company with applicable
Canadian securities commissions, copies of which are available on the System for Electronic Document Analysis and Retrieval ("SEDAR") at
www.sedar.com. No representations, express or implied, are made as to the accuracy or completeness of such forward-looking statements, estimates
or projections or with respect to any other materials herein. Actual results may vary materially from the estimates and projected results contained
herein.
Funds managed by Pershing Square and its affiliates have invested in common shares of CP. Pershing Square manages funds that are in the business
of trading – buying and selling – securities and financial instruments. It is possible that there will be developments in the future that cause Pershing
Square to change its position regarding CP. Pershing Square may buy, sell, cover or otherwise change the form of its investment in CP for any reason.
Pershing Square hereby disclaims any duty to provide any updates or changes to the analyses contained herein including, without limitation, the
manner or type of any Pershing Square investment.
The Information does not purport to include all information that may be material with respect to CP, Pershing Square’s proposed slate of directors, E.
Hunter Harrison or any other matter. Thus, shareholders and others should conduct their own independent investigation and analysis of CP, the
proposed slate of directors, E. Hunter Harrison and the Information.
Except where otherwise indicated, the Information speaks as of the date hereof.
All references to dollars are to Canadian currency unless otherwise stated.

2
Legal Notice
2
This solicitation is being made by Pershing Square, and by Pershing Square, L.P., Pershing Square II, L.P. and Pershing Square International, Ltd. (excluding
Pershing Square, collectively, the "Pershing Square Funds"), and not by or on behalf of the management of CP. The address of CP is Suite 500, 401 - 9th
Avenue S.W., Calgary, Alberta T2P 4Z4.
Pershing Square has filed an information circular dated January 24, 2012 (the “Pershing Square Circular”) containing the information in respect of its proposed
nominees. The Pershing Square Circular is available on CP’s company profile on SEDAR at http://www.sedar.com and at www.cprising.ca.
Proxies for CP shareholders meeting may be solicited by mail, telephone, facsimile, email or other electronic means as well as by newspaper or other media
advertising and in person by managers, directors, officers and employees of Pershing Square who will not be specifically remunerated therefor. Pershing
Square may also solicit proxies in reliance upon the public broadcast exemption to the solicitation requirements under applicable Canadian laws. Pershing
Square may engage the services of one or more agents and authorize other persons to assist it in soliciting proxies on behalf of Pershing Square and the
Pershing Square Funds.
Pershing Square has entered into an agreement with Kingsdale Shareholder Services Inc. (“Kingsdale”) pursuant to which Kingsdale has agreed that it will act
as Pershing Square’s proxy agent should Pershing Square commence a formal solicitation of proxies. Pursuant to this agreement Kingsdale would receive a
fee of $100,000, plus an additional fee of $6.00 for each telephone call to or from CP shareholders. In addition, Kingsdale may be entitled to a success fee on
the successful completion of Pershing Square’s solicitation, as determined by Pershing Square in consultation with Kingsdale.
All costs incurred for the solicitation will be borne by the Pershing Square Funds.
A registered holder of common shares of CP that gives a proxy may revoke it: (a) by completing and signing a valid proxy bearing a later date and returning it
in accordance with the instructions contained in the form of proxy to be provided by Pershing Square, or as otherwise provided in the proxy circular, once made
available to shareholders; (b) by depositing an instrument in writing executed by the shareholder or his or her authorized attorney: (i) at the registered office of
CP at any time up to and including the last business day preceding the shareholders meeting, or (ii) with the chairman of the meeting prior to its
commencement; or (c) in any other manner permitted by law.
A non-registered holder of common shares of CP will be entitled to revoke a form of proxy or voting instruction form given to an intermediary at any time by
written notice to the intermediary in accordance with the instructions given to the non-registered holder by its intermediary.
Neither Pershing Square, the Pershing Square Funds, nor any of their managing members, directors or officers, or any associates or affiliates of the foregoing,
nor any of Pershing Square’s nominees for the Board of Directors of CP, or their respective associates or affiliates, has: (i) any material interest, direct or
indirect, in any transaction since the beginning of CP’s most recently completed financial year or in any proposed transaction that has materially affected or
would materially affect CP or any of its subsidiaries; or (ii) any material interest, direct or indirect, by way of beneficial ownership of securities or otherwise, in
any matter currently known to be acted on at the upcoming meeting of CP shareholders, other than the election of directors.

3
Pershing Square manages approximately $11 billion in
capital
We are a concentrated, research-intensive, value fund
We seek to invest in high-quality businesses, often with a catalyst to unlock value
Our holding period for our “active” investments averages about 4 years (which is approximately half of our eight-year history)
Canadian Pacific is our second largest investment
We currently own 14.2% of the company, representing ~16%
of our funds
Introduction to Pershing Square
3

4
We are not seeking:
- A sale or change of control or a financial engineering transaction
We are seeking Board and management change to enhance the
long-term performance and competitive position of the company
Pershing Square has a track record of active, long-term value
creation
We are Long-term Shareholders Seeking Better
Management and Governance at CP
4

5
J.C. Penney – Case Study
5
JCP Share Price (July 2010 to Current)
$15
$20
$25
$30
$35
$40
$45
Jul 2010 Sep 2010 Nov 2010 Jan 2011 Mar 2011 May 2011 Jul 2011 Sep 2011 Nov 2011 Jan 2012
Pershing Files 13D
Pershing acquires $1.0bn of JCP
Pershing acquires $0.4bn of JCP
Invited to Join Board (2 Seats)(1)
JCP announces hiring of new CEO
Ron Johnson
Ron Johnson starts at JCP
JCP reveals new transformational
strategy
________________________________________________
(1) J.C. Penney offered Board seats to Bill Ackman of Pershing Square and Steve Roth of Vornado Realty Trust; Pershing Square and Vornado acted in concert in acquiring this position.
6
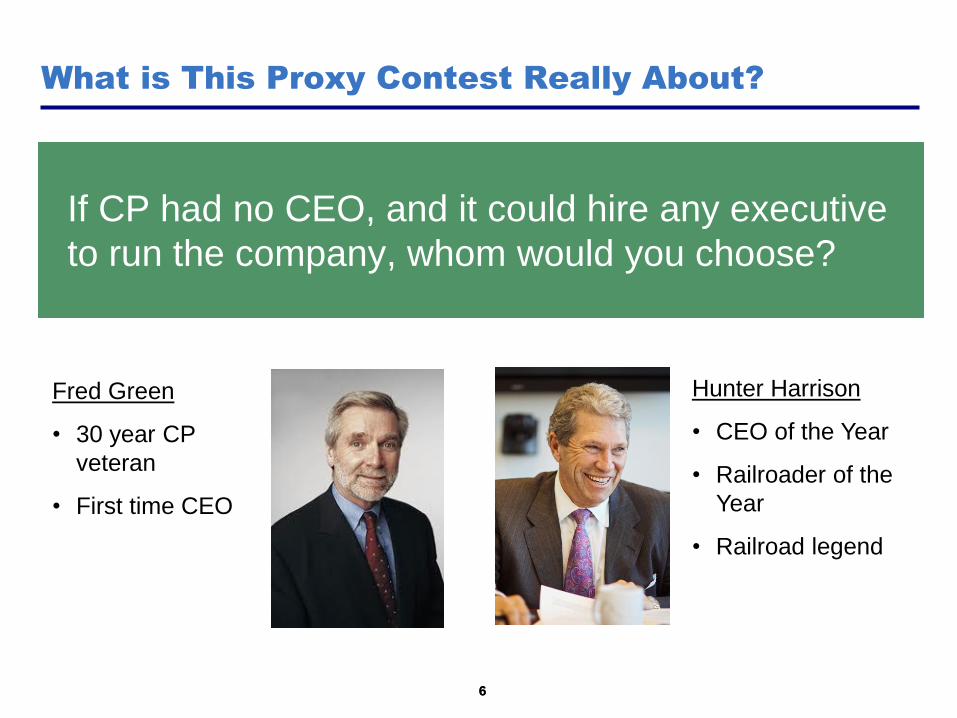
If CP had no CEO, and it could hire any executive
to run the company, whom would you choose?
What is This Proxy Contest Really About?
6
Fred Green
• 30 year CP
veteran
• First time CEO
Hunter Harrison
• CEO of the Year
• Railroader of the
Year
• Railroad legend
7
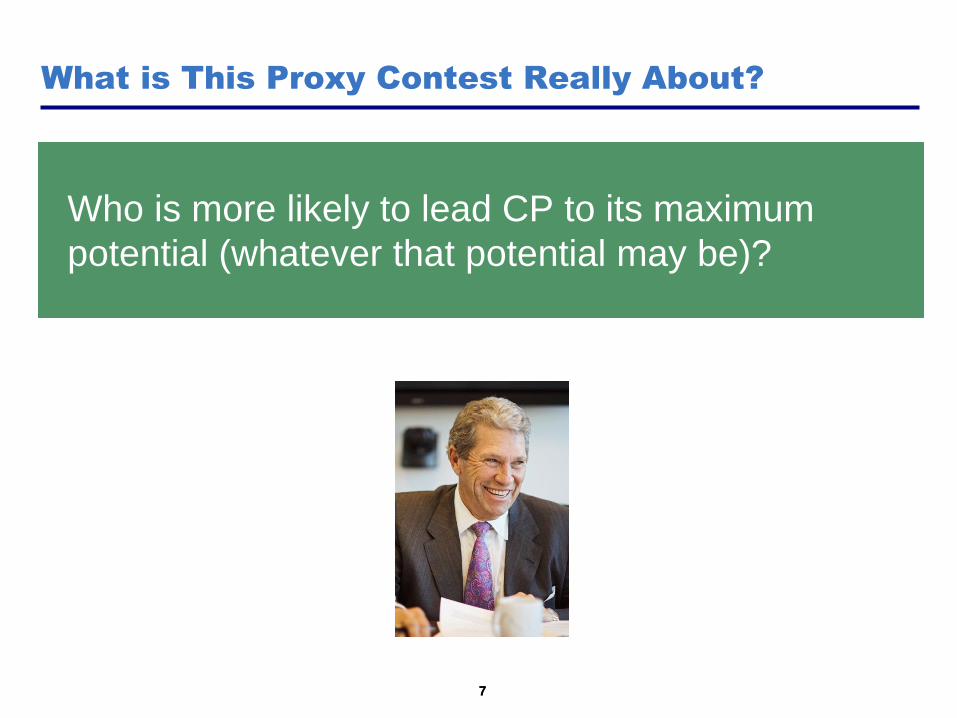
Who is more likely to lead CP to its maximum
potential (whatever that potential may be)?
What is This Proxy Contest Really About?
7

8
Are you satisfied with CP’s performance over the
last 5½ years of Fred Green’s leadership?
The Questions to Ask are:
8
Are you satisfied with the Board’s stewardship of
CP over the last ten years?
9
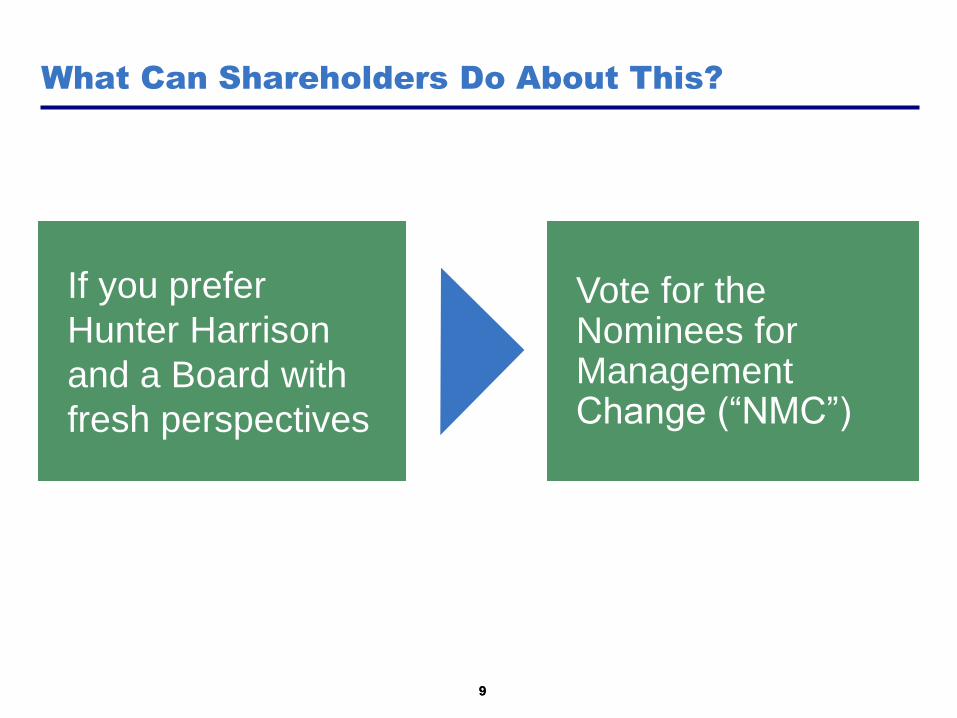
If you prefer
Hunter Harrison
and a Board with
fresh perspectives
What Can Shareholders Do About This?
9
Vote for the Nominees for Management Change (“NMC”)

10
The Nominees for Management Change
10
Three independent Canadian business leaders(1)
Gary F. Colter (66)
Founder of CRS (corporate restructuring, strategic and management consulting firm),
former Vice Chair of KPMG Canada, director of CIBC, Owens Illinois, Core-Mark,
former director of Viterra
Restructuring / accounting background, relevant Board experience
Rebecca MacDonald (58)
Founder and Executive Chairman of Just Energy Group Inc. (independent marketer of
deregulated gas and electricity), previously founded Energy Marketing
Entrepreneur, owner-manager, shareholder-value orientation
Dr. Anthony R. Melman (64)
Chairman and CEO of Nevele Inc., provider of strategic business and financial
services, former Managing Director of Onex Corporation
Strategic transformation, financial acumen
________________________________________________
(1) Independent of Canadian Pacific and Pershing Square Capital Management.

11
The Nominees for Management Change (continued)
11
Proportionate shareholder representation for Pershing Square
Bill Ackman (45)
Founder and CEO of Pershing Square Capital Management, director of J. C. Penney
(NYSE: JCP), Chairman of the Board of Howard Hughes (NYSE: HHC), director of
Justice Holdings (LSE: JUSH)
Largest shareholder, shareholder value orientation, investment management expertise
Paul Hilal (45)
Partner at Pershing Square Capital Management, former Chairman of the Board and
Interim Chief Executive Officer of Worldtalk Communications Corporation, former
director of Ceridian Corporation
Pershing Square’s railroad industry expert, largest shareholder, shareholder value
orientation, investment management expertise, investment banking / M&A expertise

12
We are confident that with a shareholder mandate, the Board will
make the right CEO decision
What Does a Vote for the NMC Mean?
12
What does a vote for the NMC mean?
- Support for management change
- Valuable skills and new perspectives for the Board
- Three independent Canadian directors and Board representation
for a major shareholder
What a vote for the NMC does NOT mean:
- Not a change of control; NMC will be five of 13 or 15 directors
- Pershing Square would have two of 13 or 15 Board seats (proportionate to ownership)
- The entire, refreshed Board will make the CEO hiring decision

What is the economic opportunity?
13

14 14
Canadian Pacific Canadian National
As of Sept. 22, 2011 As of Feb. 3, 2012 As of Feb. 3, 2012
Market Capitalization $7.9bn $12.5bn $35.8bn
Enterprise Value(1) $13.0bn $18.3bn $42.2bn
Summary Financials (2011)
Miles of Road (as of 2010) 14,785 14,785 20,560
Revenue Ton Miles 129,059 129,059 187,753
Revenues $5.2bn $5.2bn $9.0bn
EBIT $1.0bn $1.0bn $3.3bn
% Margin 19% 19% 37%
Net Income $0.6bn $0.6bn $2.5bn
% Margin 11% 11% 27%
70% the Railroad, 40% the Market Value
Canadian Pacific is 70% the size of Canadian National, yet has an enterprise
value 40% as large, due to its inferior profitability and asset utilization
70% of Size 40% of Enterprise Value Large Value Creation Opportunity
Size: ~70%
EV: ~40%
________________________________________________
Source: Company filings. Bloomberg. Market Capitalization and Enterprise Value for CP shown as of September 22, 2011 (prior to Pershing Square’s accumulation) and February 3, 2012 (current). (1) Enterprise Value includes 12/31/10 pension liability balances. Current pension deficits have likely grown materially for both CP and CN given changes in interest rates.

15
Compare the track
record, background
and experience of
Fred Green and the
current Board…
How Does One Choose Between the NMC or the
Current Board?
15
…with the track
record of Hunter
Harrison and the
potential contribution
of the NMC

Fred Green’s Track Record
17
Rail Share Prices (May 5, 2006 through Sept 22, 2011)
50
75
100
125
150
175
200
May 2006 Nov 2006 May 2007 Nov 2007 May 2008 Nov 2008 May 2009 Nov 2009 May 2010 Nov 2010 May 2011
Sh
are
Pri
ce (
Ind
exed
to
100)
50
75
100
125
150
175
200
CP Average of Competitors
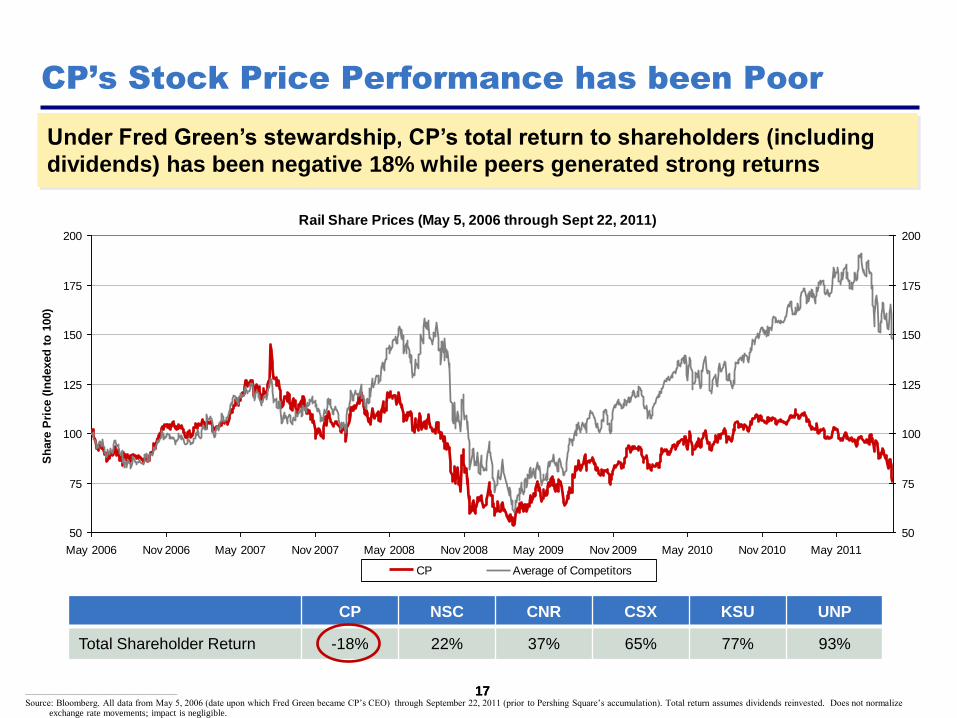
Under Fred Green’s stewardship, CP’s total return to shareholders (including
dividends) has been negative 18% while peers generated strong returns
CP NSC CNR CSX KSU UNP
Total Shareholder Return -18% 22% 37% 65% 77% 93%
________________________________________________
Source: Bloomberg. All data from May 5, 2006 (date upon which Fred Green became CP’s CEO) through September 22, 2011 (prior to Pershing Square’s accumulation). Total return assumes dividends reinvested. Does not normalize exchange rate movements; impact is negligible.
17
CP’s Stock Price Performance has been Poor

18
60%
65%
70%
75%
80%
85%
90%
95%
2005 2006 2007 2008 2009 2010 2011
Operating Ratio by Year
CP CNR NSC CSX UNP KSU
CP’s Operating Ratio Remains Stubbornly High
CP has the worst OR in the industry; its closest comp has the best
Rank Amongst
Class I Rails #3 #3 #3 #6 #5 #6 #6
18 ________________________________________________
Source: Company filings.
U.S. rails reset legacy contracts

19
Revenue per RTM (CP vs. CN)
(20.0%)
(15.0%)
(10.0%)
(5.0%)
-
5.0%
10.0%
15.0%
20.0%
Freight Revenue per RTM Total Revenue per RTM
The Pricing Myth: CP Commands Lower Pricing…
CP’s pricing deficit vs. CN has persisted and remains substantial
19
2000 2001 2002 2003 2004 2005 2006 2007 2008 2009 2010 2011
________________________________________________
Source: Company filings.
Fred Green
appointed
CEO
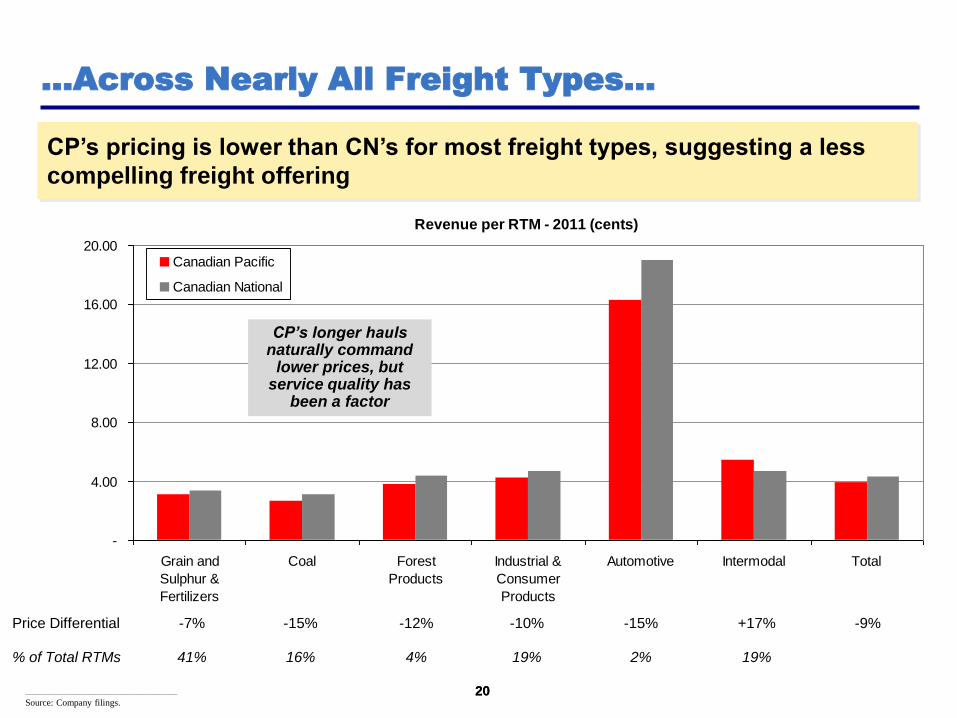
20 20
Revenue per RTM - 2011 (cents)
-
4.00
8.00
12.00
16.00
20.00
Grain and
Sulphur &
Fertilizers
Coal Forest
Products
Industrial &
Consumer
Products
Automotive Intermodal Total
Canadian Pacific
Canadian National
Price Differential -7% -15% -12% -10% -15% +17% -9%
% of Total RTMs 41% 16% 4% 19% 2% 19%
…Across Nearly All Freight Types…
CP’s pricing is lower than CN’s for most freight types, suggesting a less
compelling freight offering
CP’s longer hauls naturally command
lower prices, but service quality has
been a factor
________________________________________________
Source: Company filings.

21
Unit Pricing vs. Length of Haul (2011)
NSC
UNP
CP
CNR
CSX
3.00
3.50
4.00
4.50
5.00
5.50
6.00
20 25 30 35 40 45 50 55 60 65
Length of Haul - 1000 RTMs per Carload
Reven
ue p
er
RT
M (
cen
ts)
…But Haul-Adjusted, the Deficit is Modest
________________________________________________
Source: Company filings. Excludes Kansas City Southern due to the short-haul nature of its traffic mix.
21
The problem is not principally pricing

22
Yield Growth
-3.0%
0.0%
3.0%
6.0%
9.0%
12.0%
15.0%
18.0%
6 Year (2005-11) 3 Year (2008PF-11)
Re
ve
nu
e p
er
RT
M G
row
th
CP CN
CP
CN
CP’s revenue yield lags CN’s given its inferior service levels
Issue #1: Poor Yield Growth is Troubling…
22 ________________________________________________
Source: Company filings.
Efficient & Disciplined Operations Improved Service Volume / Pricing
23
0%
10%
20%
30%
40%
50%
60%
2005 2006 2007 2008 2009 2010 2011
Ma
rke
t S
ha
re (
% o
f T
ota
l R
TM
s)
CP (Intermodal) CN (Intermodal)
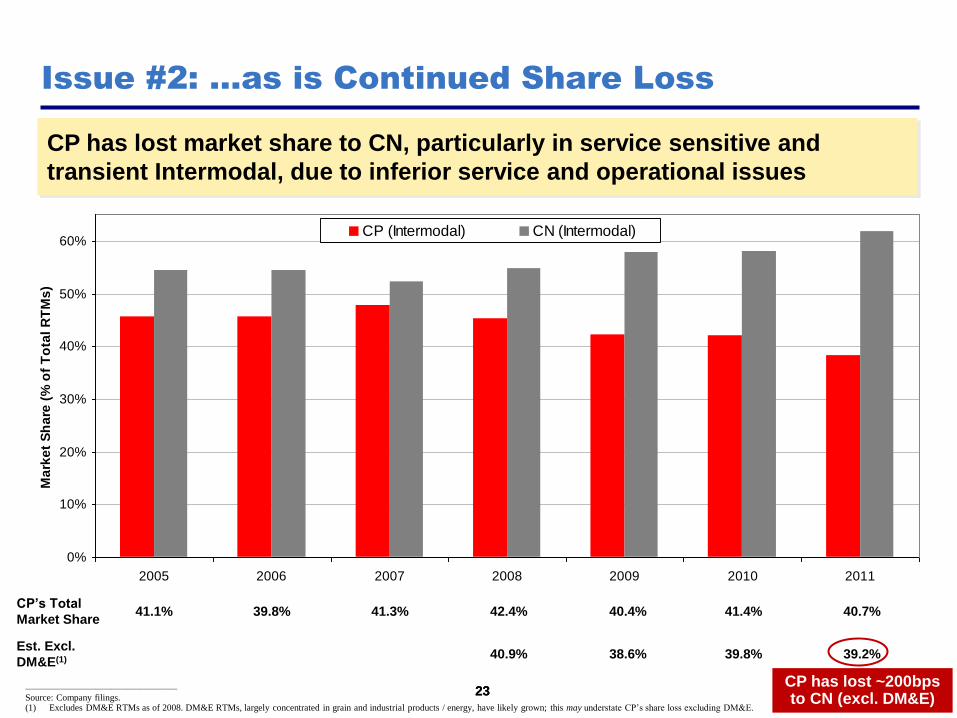
Issue #2: …as is Continued Share Loss
CP has lost market share to CN, particularly in service sensitive and
transient Intermodal, due to inferior service and operational issues
CP’s Total
Market Share 41.1% 39.8% 41.3% 42.4% 40.4% 41.4% 40.7%
Est. Excl.
DM&E(1) 40.9% 38.6% 39.8% 39.2%
23 CP has lost ~200bps to CN (excl. DM&E)
________________________________________________
Source: Company filings. (1) Excludes DM&E RTMs as of 2008. DM&E RTMs, largely concentrated in grain and industrial products / energy, have likely grown; this may understate CP’s share loss excluding DM&E.

24
Operating Expenses per RTM (CP vs. CN)
(10.0%)
(7.5%)
(5.0%)
(2.5%)
-
2.5%
5.0%
7.5%
10.0%
Operating Expense (excl. Fuel) per RTM Operating Expense per RTM
Issue #3: CP’s Unit OpEx Disadvantage has Grown
CP’s unit costs are substantially higher than CN’s, despite longer average
hauls and a greater bulk / unit train mix
24
2000 2001 2002 2003 2004 2005 2006 2007 2008 2009 2010 2011
CP’s longer hauls and bulk / unit train mix should give CP a LOWER unit cost profile than CN
________________________________________________
Source: Company filings.
Fred Green
appointed
CEO

25
Unit Cost Growth
-2.0%
0.0%
2.0%
4.0%
6.0%
8.0%
10.0%
12.0%
6 Year (2005-11) 3 Year (2008PF-11)
Op
ex
, e
xc
l. F
ue
l p
er
RT
M G
row
th
CP
CN CP
CN
CP’s efficiency & cost control dramatically lag its already best-in-class competitor
CP’s Unit Costs have Grown Far More Rapidly
25 ________________________________________________
Source: Company filings.
“Many stakeholders commented that CN was generally more aggressive than CP in pursuing financial objectives, including cost cutting and other efficiency measures” – Rail Freight Service Review, January 2011
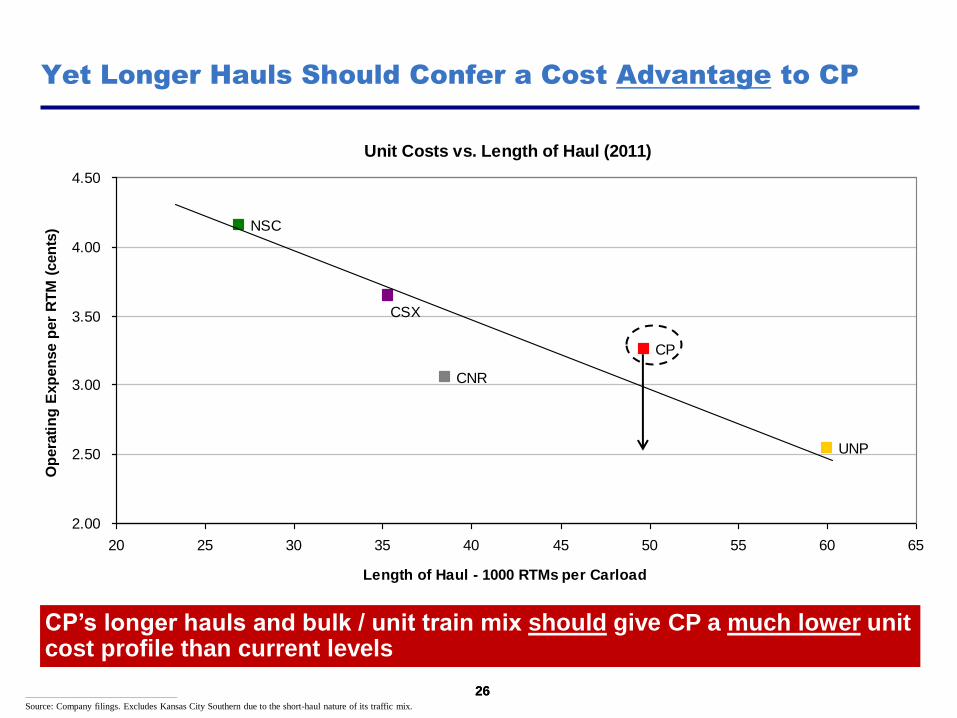
26
Unit Costs vs. Length of Haul (2011)
CP
NSC
UNP
CNR
CSX
2.00
2.50
3.00
3.50
4.00
4.50
20 25 30 35 40 45 50 55 60 65
Length of Haul - 1000 RTMs per Carload
Op
era
tin
g E
xp
en
se p
er
RT
M (
cen
ts)
Yet Longer Hauls Should Confer a Cost Advantage to CP
________________________________________________
Source: Company filings. Excludes Kansas City Southern due to the short-haul nature of its traffic mix.
26
CP’s longer hauls and bulk / unit train mix should give CP a much lower unit cost profile than current levels
27
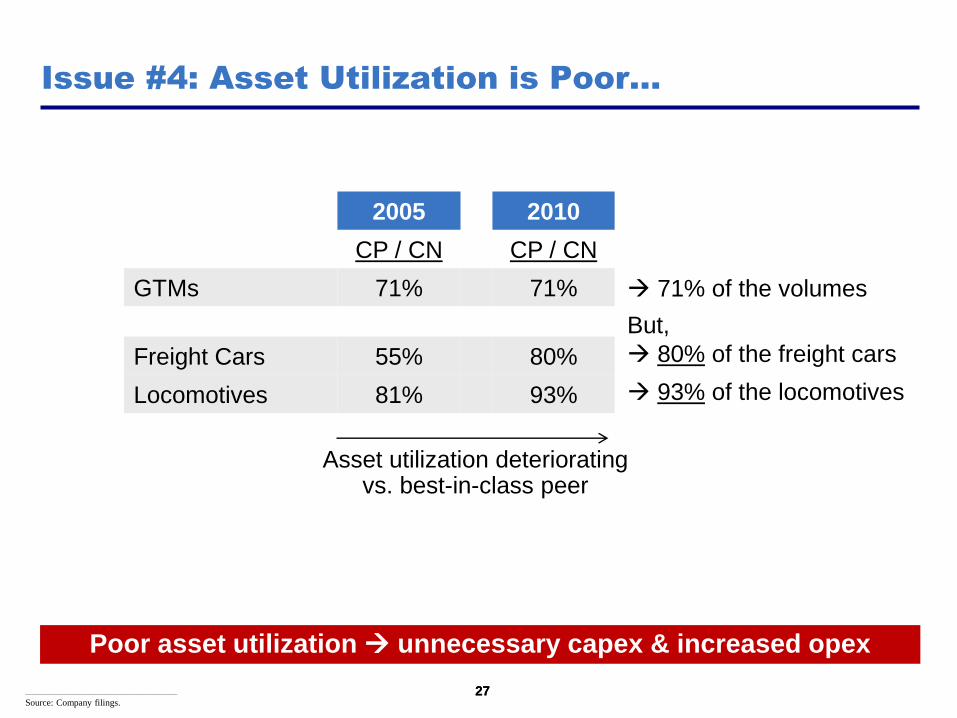
Issue #4: Asset Utilization is Poor…
27
71% of the volumes
But,
80% of the freight cars
93% of the locomotives
2005 2010
CP / CN CP / CN
GTMs 71% 71%
Freight Cars 55% 80%
Locomotives 81% 93%
Poor asset utilization unnecessary capex & increased opex
Asset utilization deteriorating vs. best-in-class peer
________________________________________________
Source: Company filings.

28
…and Management is Making the Problem Worse
28
Poor Asset Utilization:
Locomotive utilization 23% lower than CN’s as of 2010
“[CP] doesn't need more locomotives. [CP] already has one of the best fleets that I've ever seen in my travels whether as a consultant or a prior executive.”
- Ed Harris, June 2010
CP’s MYP includes:
- 91 new locomotives in 2011 / Q1 2012
- $500mm of capex for new and remanufact-ured locomotives from 2011-14

29
EBIT Margins
0%
10%
20%
30%
40%
2000 2001 2002 2003 2004 2005 2006 2007 2008 2009 2010 2011
CP CN
The Result: CP's EBIT Margin Deficit Persists
Cost control and asset utilization differences have led to a large and
growing margin deficit
29
Margin
Deficit -7.5% -9.1% -7.6% -10.3% -13.0% -12.9% -14.6% -12.0% -13.5% -15.0% -14.0% -17.8%
________________________________________________
Source: Company filings.
30
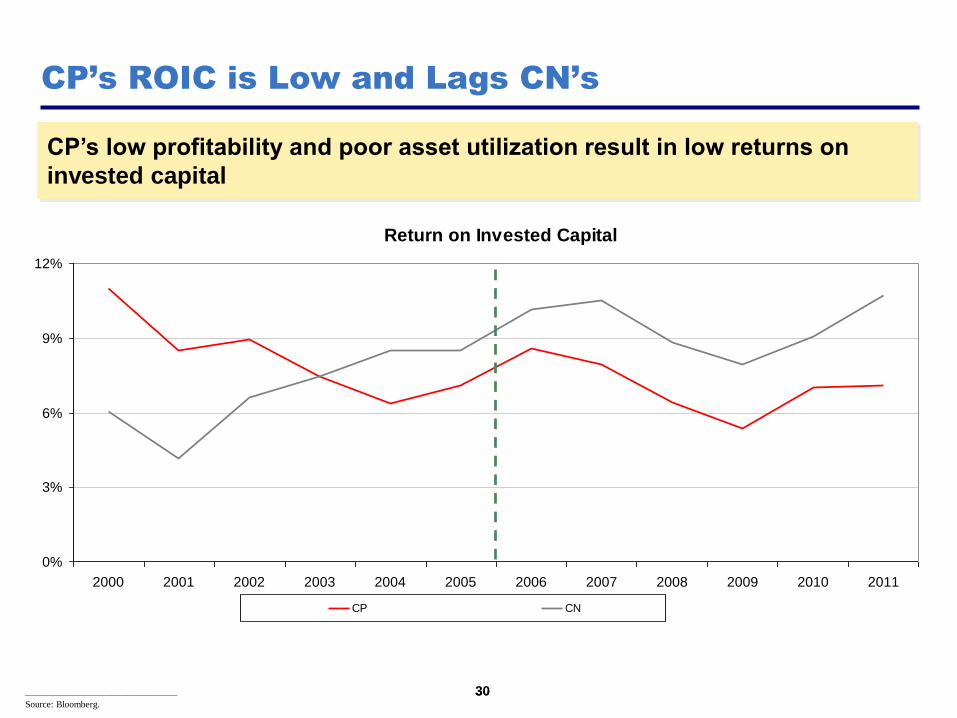
Return on Invested Capital
0%
3%
6%
9%
12%
2000 2001 2002 2003 2004 2005 2006 2007 2008 2009 2010 2011
CP CN
CP’s ROIC is Low and Lags CN’s
30
CP’s low profitability and poor asset utilization result in low returns on
invested capital
________________________________________________
Source: Bloomberg.

31
EBITDA - Capex Margins
0%
10%
20%
30%
40%
2000 2001 2002 2003 2004 2005 2006 2007 2008 2009 2010 2011
CP CN CP (at CN CapEx levels)
CP’s Cash Margin is Low and Dramatically Lags CN’s
CP’s inferior operating margins lead to lower cash flows and
underinvestment in CapEx, driving long-term share loss
31 ________________________________________________
Source: Company filings.
Reported EBITDA – Capex overstated due to underinvestment
32
$7
$6
$5
$4
$3
$2
$1
$0
-$1
-$2
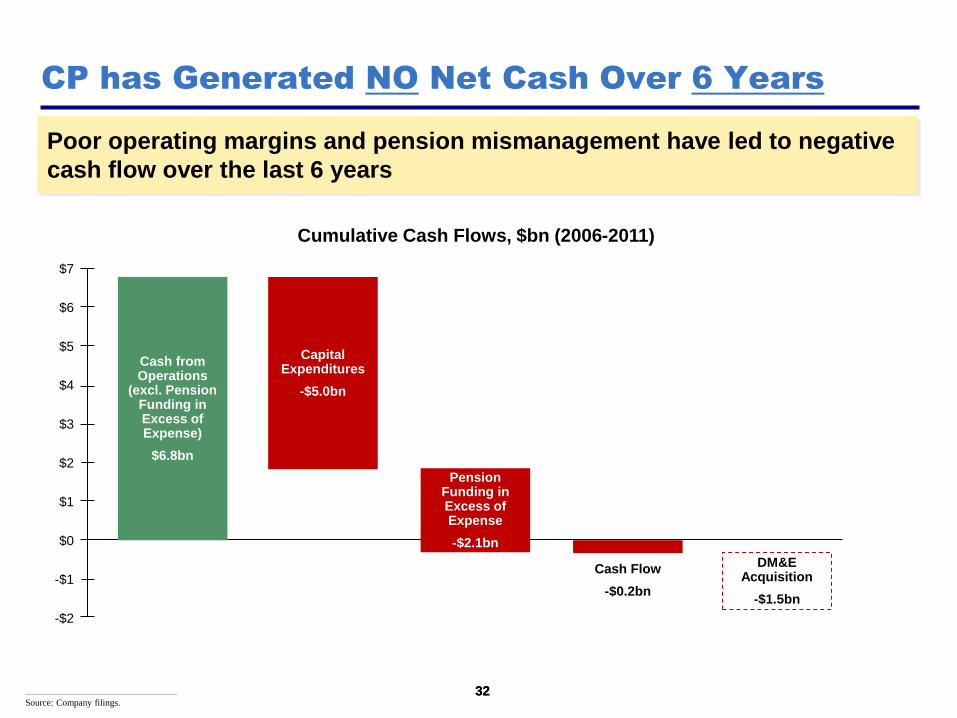
CP has Generated NO Net Cash Over 6 Years
Poor operating margins and pension mismanagement have led to negative
cash flow over the last 6 years
32 ________________________________________________
Source: Company filings.
Cash from Operations
(excl. Pension Funding in Excess of Expense)
$6.8bn
Cumulative Cash Flows, $bn (2006-2011)
Capital Expenditures
-$5.0bn
Pension Funding in Excess of Expense
-$2.1bn
DM&E Acquisition
-$1.5bn
Cash Flow
-$0.2bn
33
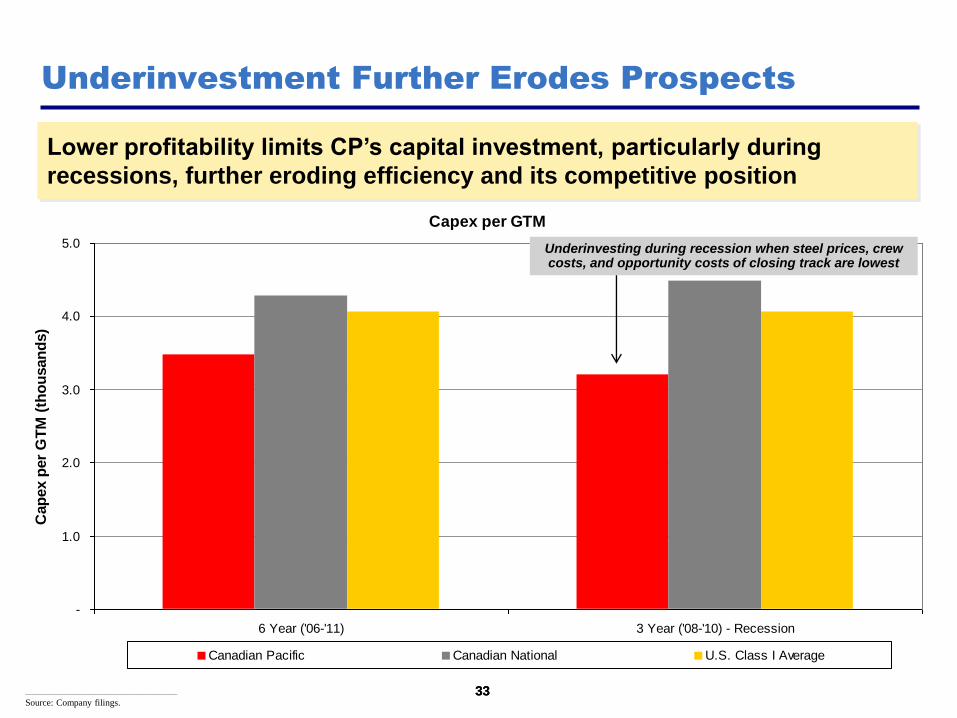
Capex per GTM
-
1.0
2.0
3.0
4.0
5.0
6 Year ('06-'11) 3 Year ('08-'10) - Recession
Cap
ex p
er
GT
M (
tho
usan
ds)
Canadian Pacific Canadian National U.S. Class I Average
Underinvestment Further Erodes Prospects
33
Lower profitability limits CP’s capital investment, particularly during
recessions, further eroding efficiency and its competitive position
Underinvesting during recession when steel prices, crew costs, and opportunity costs of closing track are lowest
________________________________________________
Source: Company filings.
34
DM&E Acquisition was a Mistake
34
High valuation
- $1.5bn + $300mm of capex deficiency = 18x EBIT of ~$100mm
- What was the return to shareholders on this capital?
No compelling strategic rationale
- Extremely expensive option to be the 3rd rail carrier in PRB
Irresponsible financing
- Excess leverage forced equity raise at market bottom
Diverted capital and management focus away from core franchise and necessary operational improvements
Reputedly a “poison pill” to fend off financial and strategic acquirers
OR at time of acquisition was ~70%; should have been margin accretive

35
CP - Stock Price
$0
$25
$50
$75
$100
2006 2007 2008 2009 2010 2011
Low Profitability
& Cash Flow
Excess Leverage &
Pension Mismanagement
Shareholder
Dilution
35
Feb 2009: Issued 12.6mm shares at $36.75 ($511mm)
2006: Repurchased
5.0mm shares at $57.28 ($286mm)
2007: Repurchased
3.2mm shares at $71.99 ($231mm)
Buy High, Sell Low
Total repurchases of $517mm for 8.2mm shares at $63.03
Total issuances of $511mm or 12.6mm shares at $36.75
While CP issued shares during the recession, responsible capital management
allowed other rails to opportunistically repurchase shares at depressed prices
Buyout inquiry
DM&E acquired, with leverage

36
Poor operating performance
- Worst operating margins in industry; closest comp has the best
- Revenue lagging, continued market share losses
- Cost inefficiency substantial
- Poor asset utilization
- No cash flow generation
Poor strategic decisions
- DM&E acquisition: expensive, poorly financed, diverted capital and attention from core franchise, poison pill
Balance sheet mismanagement
- Excess leverage and pension mismanagement
- Share buybacks / issuances dilutive
Performance Summary: Poor
36

Underlying Drivers
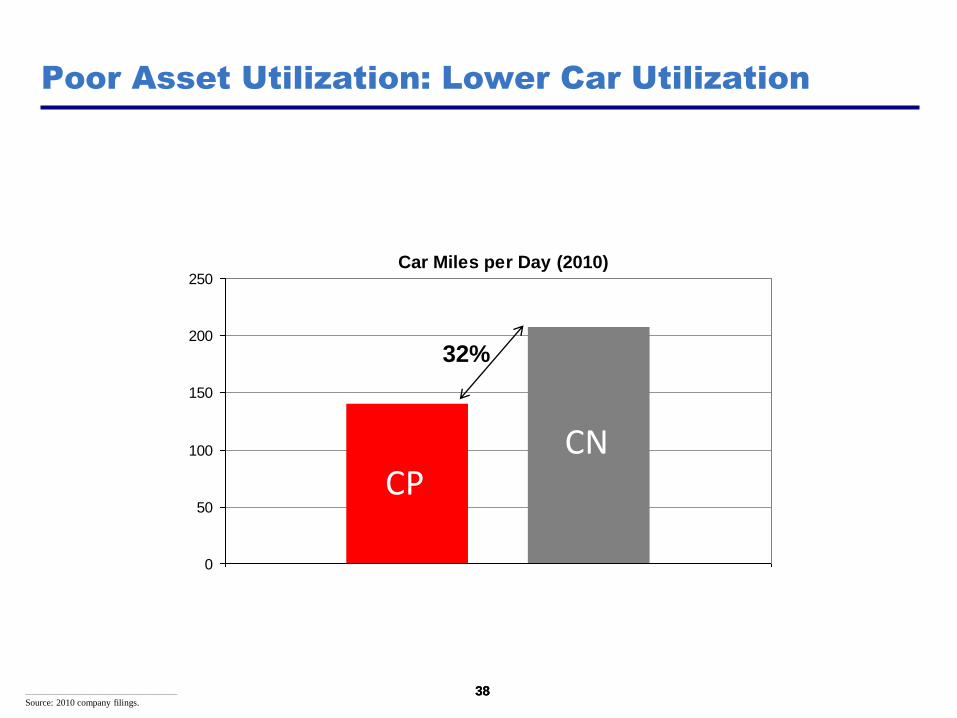
38
Car Miles per Day (2010)
0
50
100
150
200
250
CPCN
Poor Asset Utilization: Lower Car Utilization
32%
38 ________________________________________________
Source: 2010 company filings.
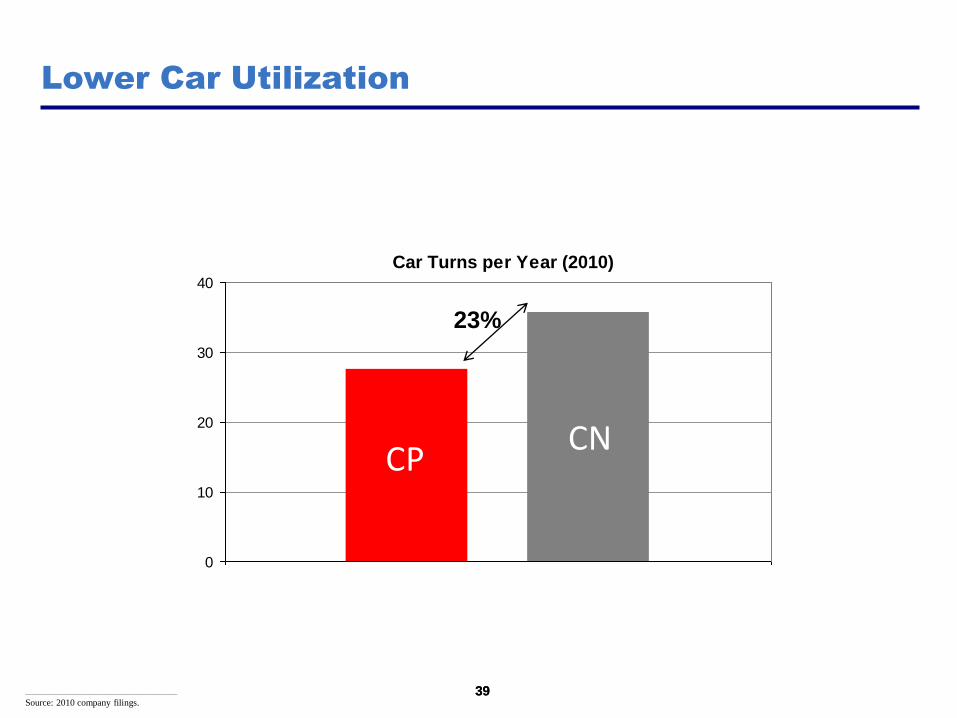
39
Car Turns per Year (2010)
0
10
20
30
40
CPCN
23%
39 ________________________________________________
Source: 2010 company filings.
Lower Car Utilization
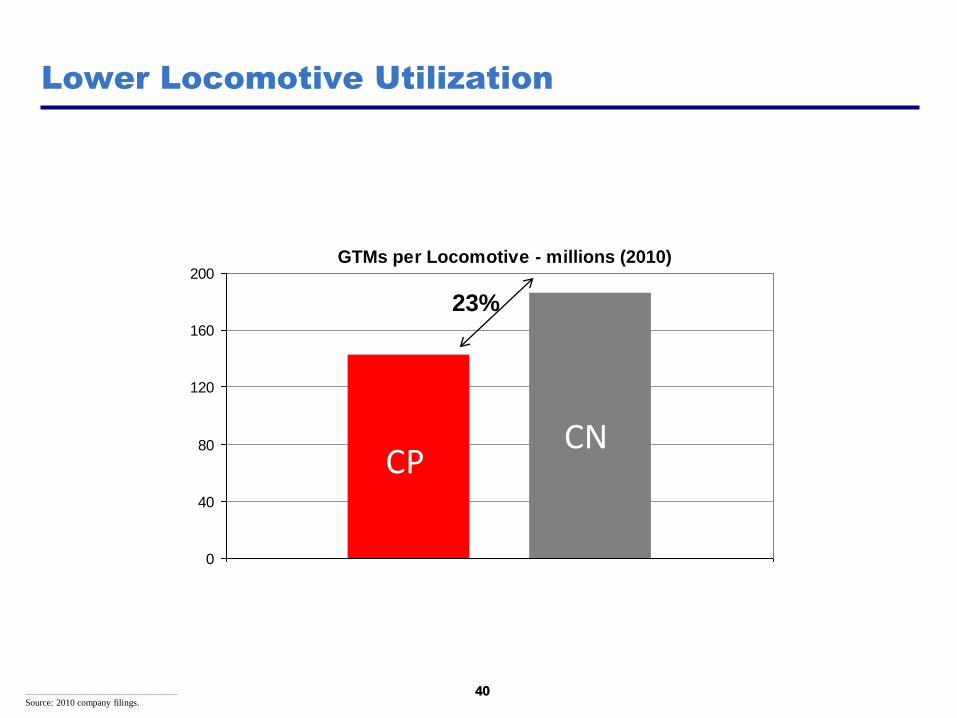
40
GTMs per Locomotive - millions (2010)
0
40
80
120
160
200
CPCN
23%
40
Lower Locomotive Utilization
________________________________________________
Source: 2010 company filings.

41
Cars per Train (2010)
0
20
40
60
80
100
CPCN
23%
41
Shorter Trains
________________________________________________
Source: 2010 company filings.

42
Gallons of Locomotive Fuel per 1,000 GTMs (2010)
0.00
0.25
0.50
0.75
1.00
1.25
CP CN
12%
42
Higher Fuel Consumption
________________________________________________
Source: 2010 company filings.

43
Average Train Speed, mph (2010)
0
5
10
15
20
25
30
CPCN
19%
43
Poor Fluidity: Slower Trains
________________________________________________
Source: 2010 company filings.
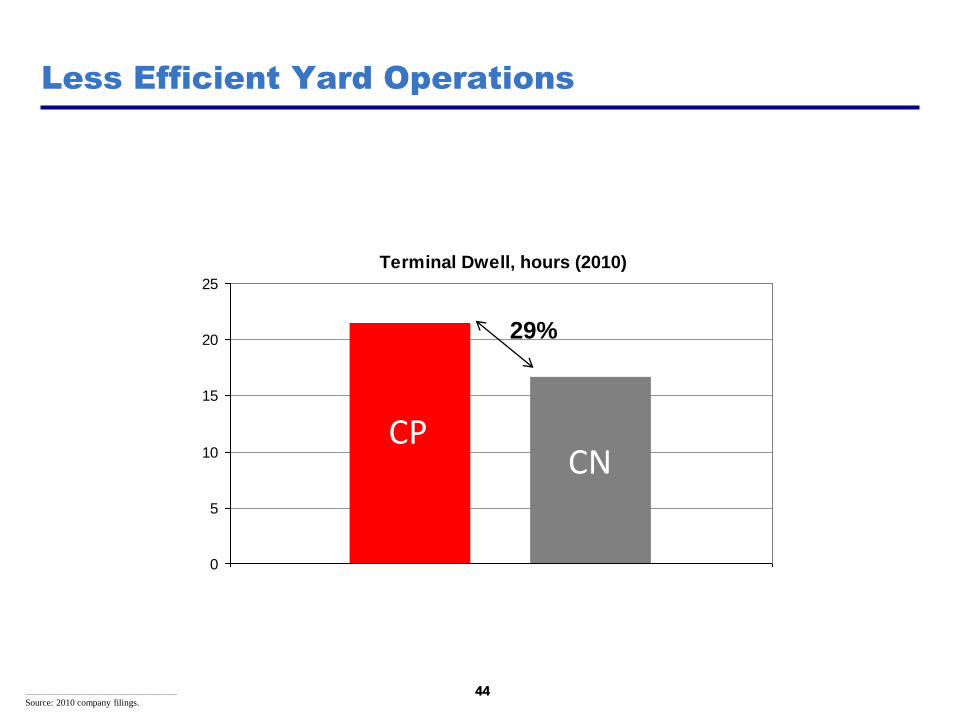
44
Terminal Dwell, hours (2010)
0
5
10
15
20
25
CPCN
29%
44
Less Efficient Yard Operations
________________________________________________
Source: 2010 company filings.
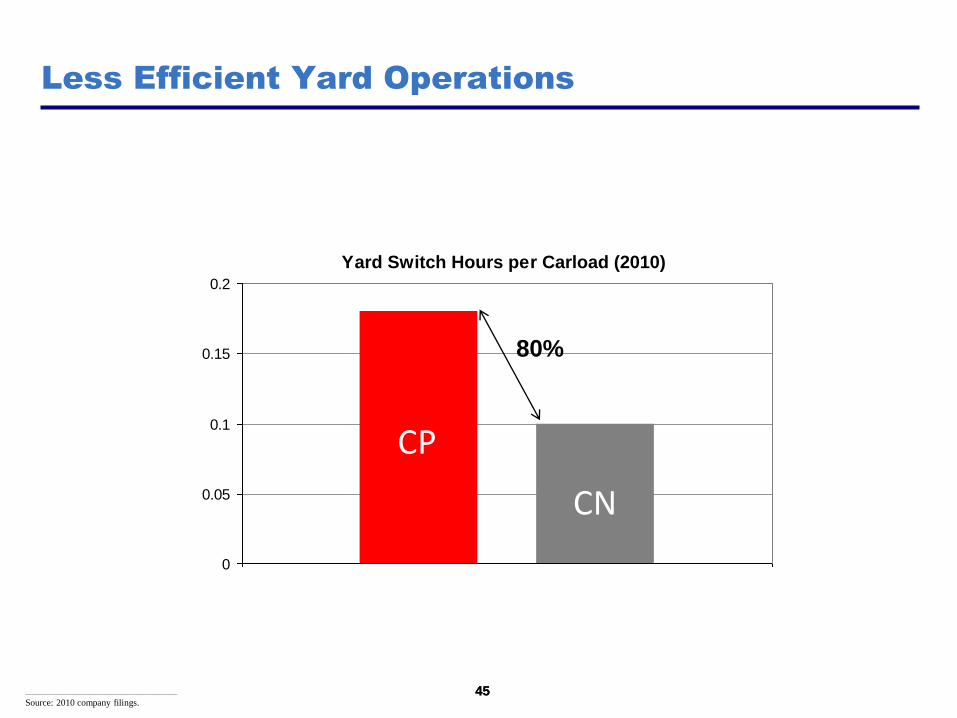
45
Yard Switch Hours per Carload (2010)
0
0.05
0.1
0.15
0.2
CP
CN
80%
45
Less Efficient Yard Operations
________________________________________________
Source: 2010 company filings.
46
0
50
100
150
200
250
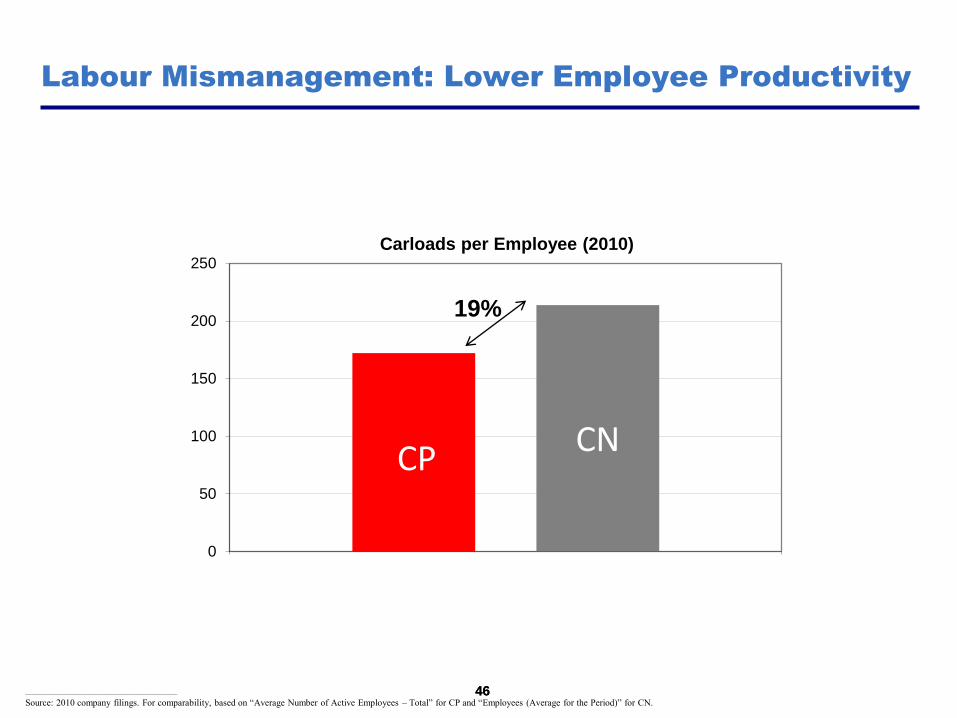
Carloads per Employee (2010)
CPCN
46
Labour Mismanagement: Lower Employee Productivity
________________________________________________
Source: 2010 company filings. For comparability, based on “Average Number of Active Employees – Total” for CP and “Employees (Average for the Period)” for CN.
19%
47
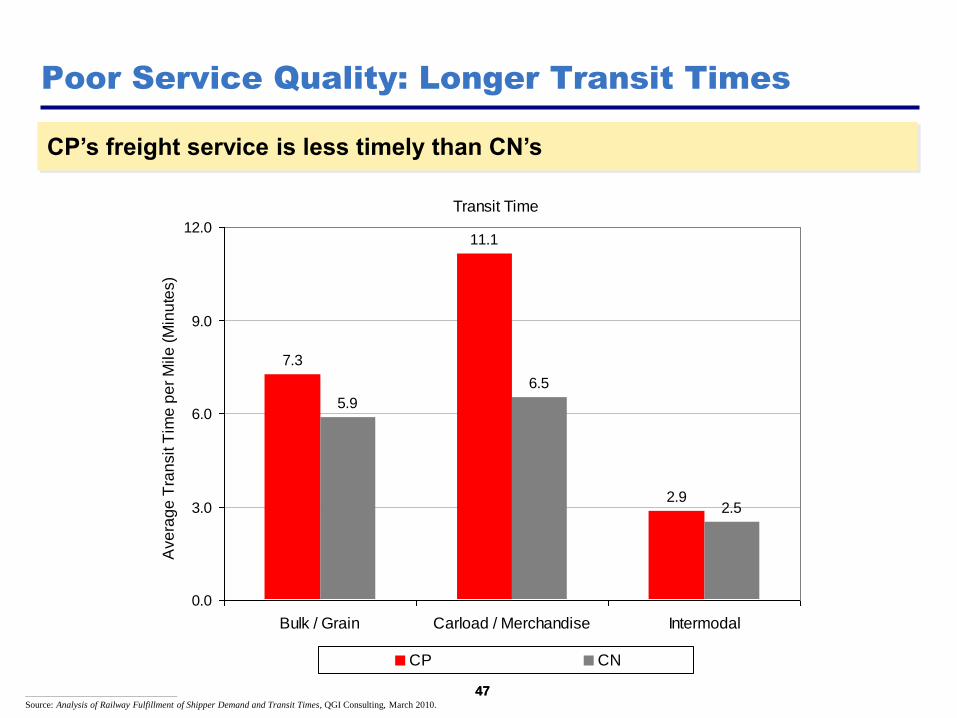
Poor Service Quality: Longer Transit Times
CP’s freight service is less timely than CN’s
47
Transit Time
5.9
6.5
2.52.9
11.1
7.3
0.0
3.0
6.0
9.0
12.0
Bulk / Grain Carload / Merchandise Intermodal
Ave
rag
e T
ran
sit T
ime
pe
r M
ile
(M
inu
tes)....
CP CN
________________________________________________
Source: Analysis of Railway Fulfillment of Shipper Demand and Transit Times, QGI Consulting, March 2010.
48
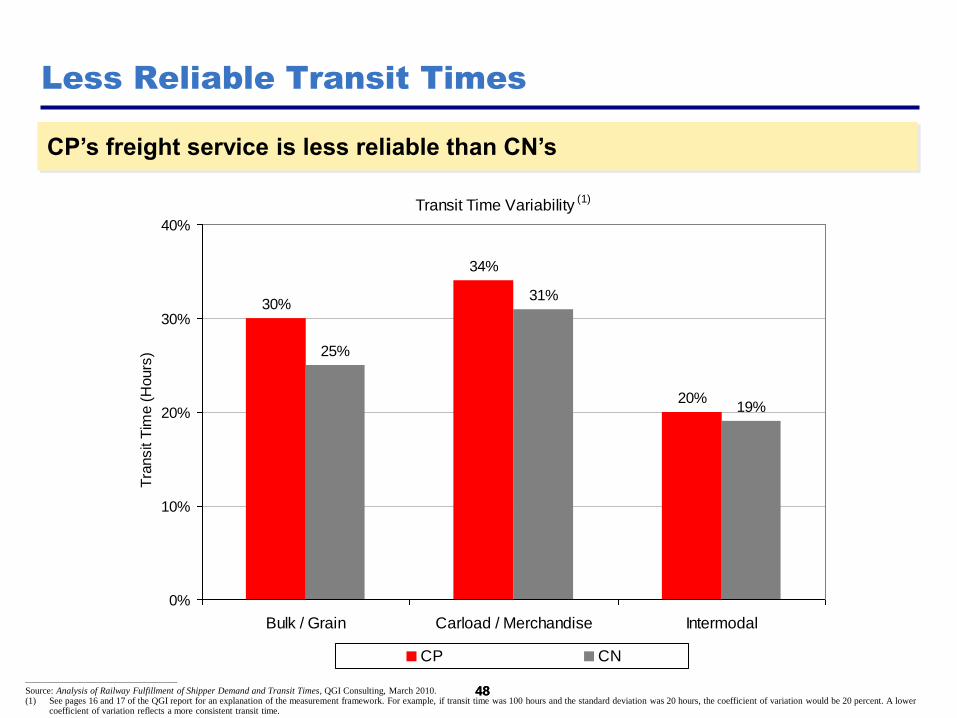
Less Reliable Transit Times
CP’s freight service is less reliable than CN’s
48 ________________________________________________
Source: Analysis of Railway Fulfillment of Shipper Demand and Transit Times, QGI Consulting, March 2010. (1) See pages 16 and 17 of the QGI report for an explanation of the measurement framework. For example, if transit time was 100 hours and the standard deviation was 20 hours, the coefficient of variation would be 20 percent. A lower
coefficient of variation reflects a more consistent transit time.
Transit Time Variability (1)
30%
34%
20%
25%
31%
19%
0%
10%
20%
30%
40%
Bulk / Grain Carload / Merchandise Intermodal
Tra
nsit
Tim
e (
Hours
)....
CP CN

49
Car Supply Performance
73%
86%97% 98%
0%
25%
50%
75%
100%
Bulk / Grain Merchandise
% O
rde
r F
ulfillm
en
t
CP CN
Car Supply is Less Reliable
CP’s car supply fulfillment is less reliable than CN’s
49 ________________________________________________
Source: Analysis of Railway Fulfillment of Shipper Demand and Transit Times, QGI Consulting, March 2010.

50
CP Suffers from Vicious Cycle
Less Efficient and Less Disciplined
Operations
Lesser Service, Lower Yield, Lost Share
Cost Inefficiency, Poor Asset
Utilization, Poor Operating Margins
Less Cash Flow, Poor Returns
on Capital
Diminished Investment and Balance Sheet
Flexibility
50
Poor Stewardship by Board & CEO
Poor Discipline
Complacent
Culture

What is CP’s “Detailed Plan”?
52
Current Multi-Year Plan (“MYP”) is not Fred Green’s first plan
CP has had at least 10 distinct plans / initiatives during Green’s tenure
Many aspects of the current “Detailed Plan” are previous initiatives rebranded as MYP
Green’s most recent MYP projections (as of 1/30/2012) are driven by substantially increased volume expectations
What is CP’s “Detailed Plan”…
52

53
…That Depends on When You Ask
53
June 2011 “Detailed Plan”
Driven by various productivity
and efficiency initiatives
Assumed 2-3% volume
growth
“Three big initiatives of asset
velocity, structural costs and
the long train principles; I
would say those are the three
great building blocks that
capture some pretty
substantial course of what
we're doing.”
Current “Detailed Plan”
New forecast; now driven by
materially above-consensus
volume expectations
Assumes ~5% volume growth
Volume growth drives ~3/4 of
expected net OR improvement
“Revenue growth is integral to
achieving lower OR and is
dependent on maintaining
strong personal relationships
with customers.”

54
The June 2011 “Detailed Plan”
54 ________________________________________________
Source: CP Analyst Day, June 2011.
Financial Projections for CP’s June 2011 “Detailed Plan”
55
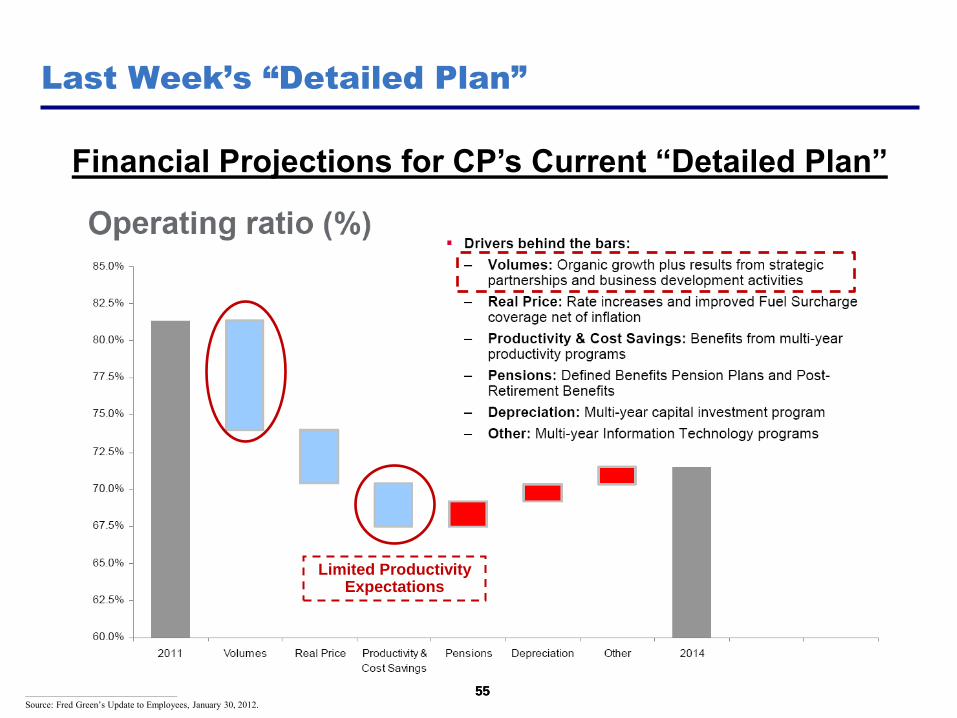
Last Week’s “Detailed Plan”
55 ________________________________________________
Source: Fred Green’s Update to Employees, January 30, 2012.
Financial Projections for CP’s Current “Detailed Plan”
Limited Productivity Expectations

56
Canadian Pacific – Operating Ratio
1999 2000 2001 2002 2003 2004 2005 2006 2007 2008 2009 2010 2011
78% 77% 78% 77% 80% 80% 78% 76% 76% 79% 82% 78% 81%
Another “Detailed Plan” – Will the Results Differ?
Integrated Operating Plan (“IOP”), Scheduled Railroad (May 1999 - Current)
Multi-Year Plan (“MYP”) (2011+)
Western Capacity Exp. (‘04-’05+)
Execution Excellence (“EE”) (‘05-’07)
Numerous IT Initiatives (MultiRail, Service Excellence Suite, TYES, TRIEX, SAP, Shipment Suite, Engineering Excellence, TrAM, Others)
Execution Excellence for Efficiency (“E3”) (‘08-’10)
“Railway of the Future” (’08-‘09)
________________________________________________
Source: Annual reports, CP investor books.
56
“Driving the Digital Railway” (2010+)
Grouped IOP and Yield teams into “Strategy & Yield” (2008+)
Organizational reorg., fewer layers / oper.
regions (‘10+)
Reducing structural costs: offices, loco / freight repair (‘10+)
“Long Train Strategy” (Pre-2008+)
Restructured commercial org. Marketing, Sales, Customer
Services (‘09+)
“First Mile Last Mile” (2010+)
Many former initiatives
rebranded as “MYP”
- Lots of plans and
initiatives
- No results

Five Years of Promises
and Claims of Progress
57

“I expect our team to gain traction on expense reduction
and drive step-change productivity improvements across
the property…
…I believe this franchise has more to deliver. I’m not
satisfied with our operating ratio [2006 target was ~75%
OR], and I’m raising the bar on Execution Excellence as a
vehicle to drive accelerated improvements.”
- Fred Green, Analyst Day
November 2005
58

“It all brings me back to my key message; through
Execution Excellence we are transforming this railway into
a highly efficient business. The more we do, the more we
learn, and the more potential we are seeing.”
- Fred Green, Analyst Day
November 2006*
59

November 2006
60
“I told you we had a value creation strategy that works. It's
delivering results, and we expect our success to continue.”
- Fred Green, Analyst Day

“Our focus on network fluidity and Execution Excellence
have transformed CP into a more resilient railway, better
able to manage through and recover from uncontrollable
events.”
- Fred Green, Q1 2007 Earnings Call
April 2007
61

“We have a series of Vice Presidents who have sat right in
front of Kathryn and I and stared us in the eyeballs and
told us how they're going to deliver the types of
improvements that Brock referred to.
And because of that level of attack, level of effort, and that
level of commitment, we're able to sit here today and say
that we've got a program [Execution Excellence for
Efficiency or “E3”] that over the next couple of years, is
another C$100 million.”
- Fred Green, Analyst Day
November 2008*
62
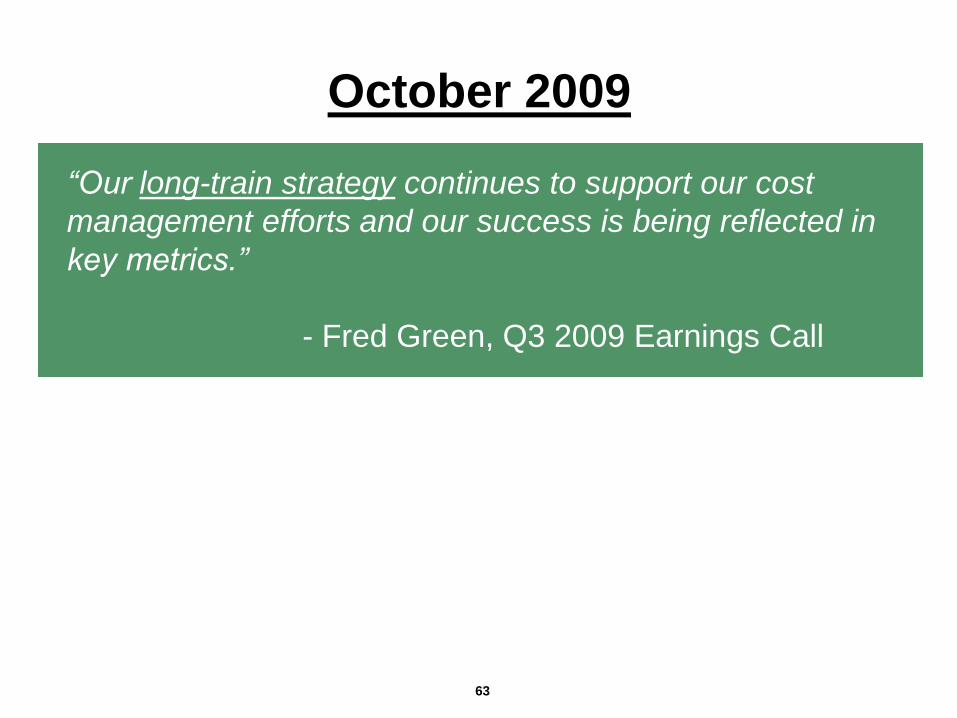
“Our long-train strategy continues to support our cost
management efforts and our success is being reflected in
key metrics.”
- Fred Green, Q3 2009 Earnings Call
October 2009
63

“We said we’d do $100 million in variable costs, and we
are clearly going to do that. We also said we were going
to attack the structural costs. We didn't know exactly how
big it was, but that we thought it was probably at least as
big as the variable cost component, but it would take a
couple of years to deliver that…directionally, everything is
consistent with our expectations in that regard.”
- Fred Green, Q3 2009 Earnings Call
October 2009
64

“Looking at 2010, you can expect more of the same from
CP, emphasis on cost management, productivity and the
realization of longer-term structural savings.”
- Fred Green, Q4 2009 Earnings Call
January 2010*
65
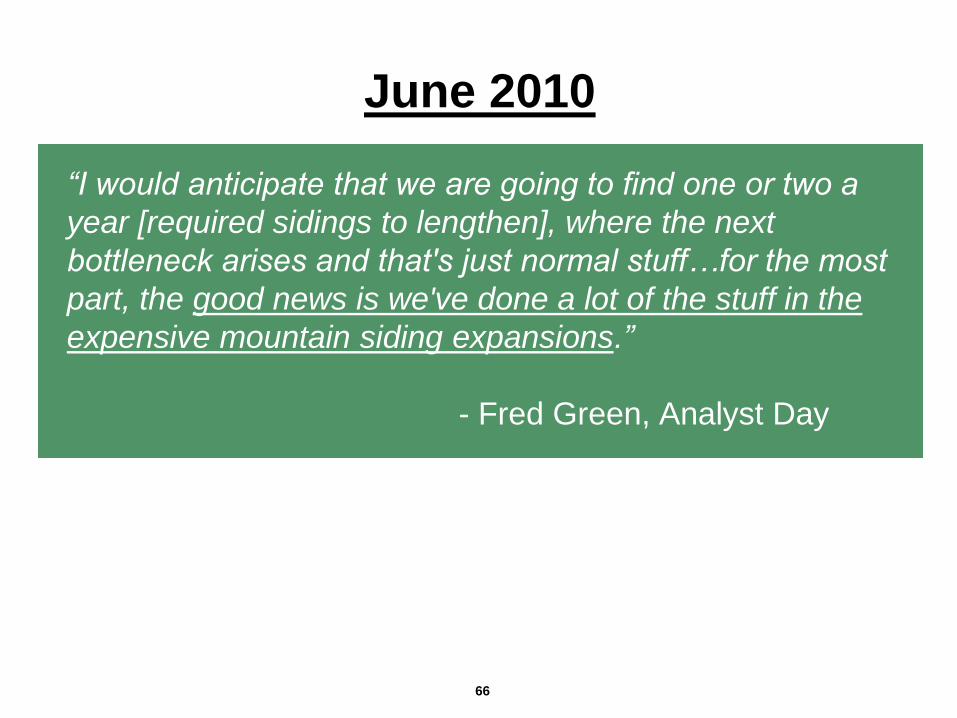
“I would anticipate that we are going to find one or two a
year [required sidings to lengthen], where the next
bottleneck arises and that's just normal stuff…for the most
part, the good news is we've done a lot of the stuff in the
expensive mountain siding expansions.”
- Fred Green, Analyst Day
June 2010
66

The Results?
67

EBIT down 1%
Excluding DM&E, EBIT down ~10%
Operating Ratio up 360bps
Total return to shareholders including dividends:
negative 18%(1)
Fred Green’s Results (2006 – 2011)
68 ________________________________________________
(1) Represents total return to shareholders, assuming dividends reinvested. Returns from May 5, 2006 (date upon which Fred Green became CP’s CEO) through September 22, 2011 (prior to Pershing Square’s accumulation).
69
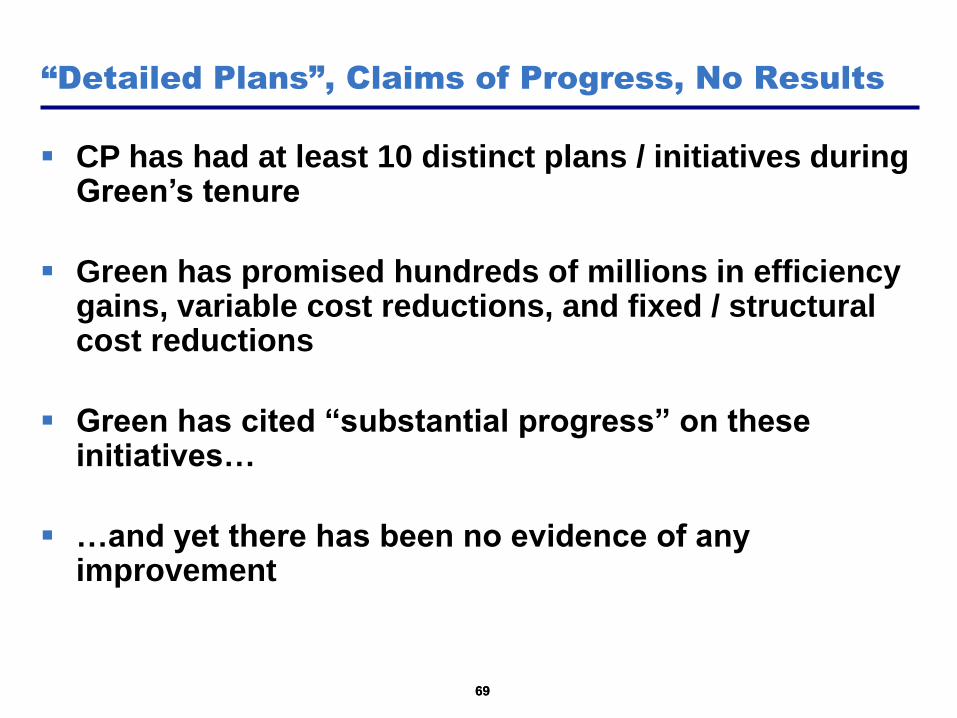
CP has had at least 10 distinct plans / initiatives during Green’s tenure
Green has promised hundreds of millions in efficiency gains, variable cost reductions, and fixed / structural cost reductions
Green has cited “substantial progress” on these initiatives…
…and yet there has been no evidence of any improvement
“Detailed Plans”, Claims of Progress, No Results
69
The Board’s Track Record

71
What are the Board’s Primary Responsibilities?
71
1. Hire the best CEO and executive management team
2. Set proper performance targets and incentives and
compensate appropriately
3. Monitor and review performance and strategy
4. Hold management accountable for execution

72 72
Worst
performing
railroad
The Board Chose the Wrong CEO and Will Not
Consider Alternatives
Board is “unanimous” in its support
of current CEO
Board wouldn’t even meet
Hunter Harrison

73
Brock Winter
(SVP, Ops)
Kathryn McQuade
(EVP, COO)
Brock Winter
(SVP, Ops)
Edmond Harris
(EVP, COO)
Mike Franczak
(EVP, Ops)
Has the Board Successfully Managed Executive
Ranks?
73
April 2011 – Present April 2010 – April 2011 Sept 2008 – April 2010 June 2007 – Sept 2008 May 2006 – June 2007
Head of Operations (COO or Equivalent)
Brian Grassby (Acting CFO)
Michael Lambert (EVP, CFO)
Kathryn McQuade (EVP, CFO)
Head of Finance (CFO or Equivalent)
Sept 2008 – Present Oct 2006 – Sept 2008 April 2006 – Oct 2006
Instability in key roles, particularly operations, hampers performance

74
Fred Green’s Targets
Yet, Fred Green deemed to
have met 17 of 18 individual
performance objectives set
by the Board
Only one missed objective:
financial targets in 2008
Financial targets for Green
were eliminated after 2008
Fred Green's Performance
Worst operating
performance in the
industry
EBIT has declined ~10%
excluding DM&E
Negative cash flow
Has the Board Set Proper Targets and Compensation?
74
75
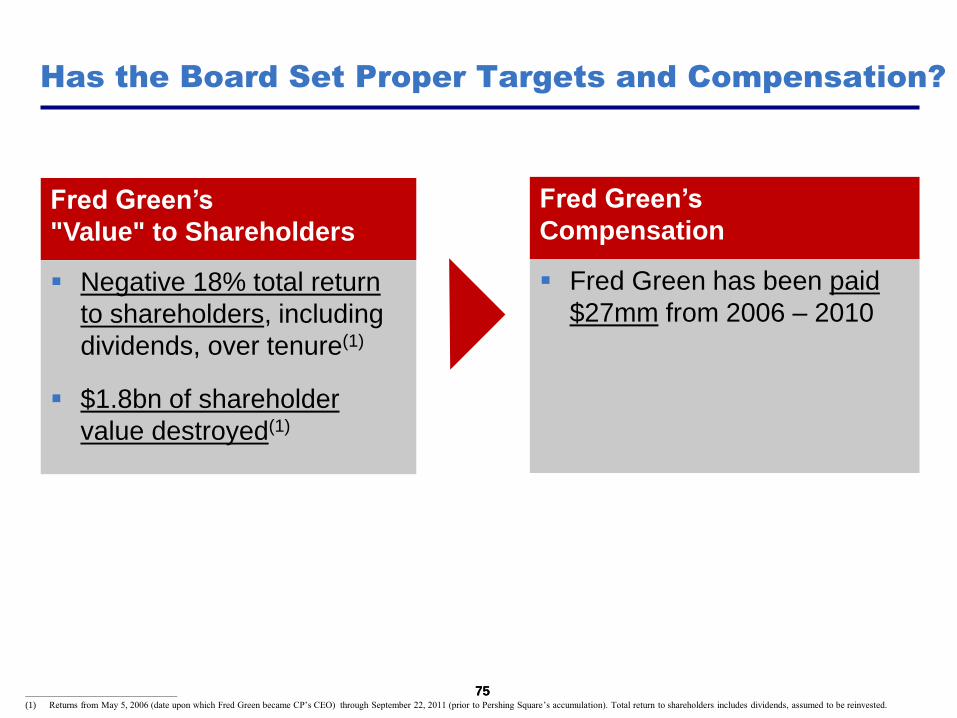
Fred Green’s
"Value" to Shareholders
Negative 18% total return
to shareholders, including
dividends, over tenure(1)
$1.8bn of shareholder
value destroyed(1)
Has the Board Set Proper Targets and Compensation?
75 ________________________________________________
(1) Returns from May 5, 2006 (date upon which Fred Green became CP’s CEO) through September 22, 2011 (prior to Pershing Square’s accumulation). Total return to shareholders includes dividends, assumed to be reinvested.
Fred Green’s
Compensation
Fred Green has been paid
$27mm from 2006 – 2010

76
Has the Board Set Proper Targets and Compensation?
76 ________________________________________________
Source: CP Proxy Circular, May 2011.
Performance targets are lowered in the face of underperformance
2009 Performance Share Units – Targets
2010 Performance Share Units – Targets Reduced ROCE
targets ~200bps
77
Has the Board Set Proper Targets and Compensation?
77 ________________________________________________
Source: CP Proxy Circular, May 2011. CN Proxy Circular, April 2011.
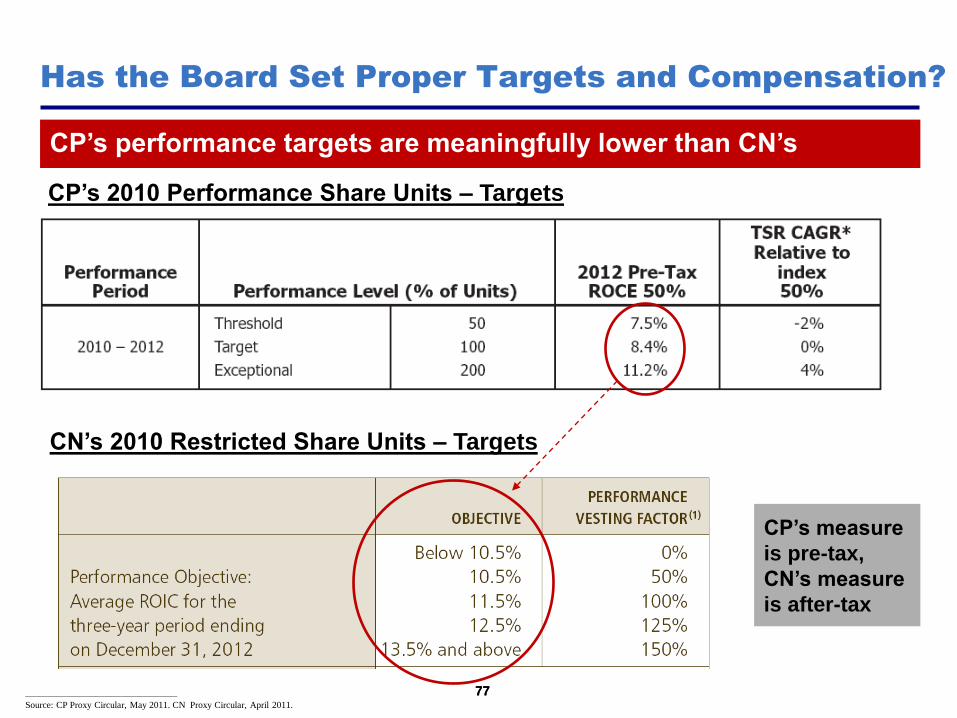
CP’s 2010 Performance Share Units – Targets
CP’s performance targets are meaningfully lower than CN’s
CN’s 2010 Restricted Share Units – Targets
CP’s measure
is pre-tax,
CN’s measure
is after-tax
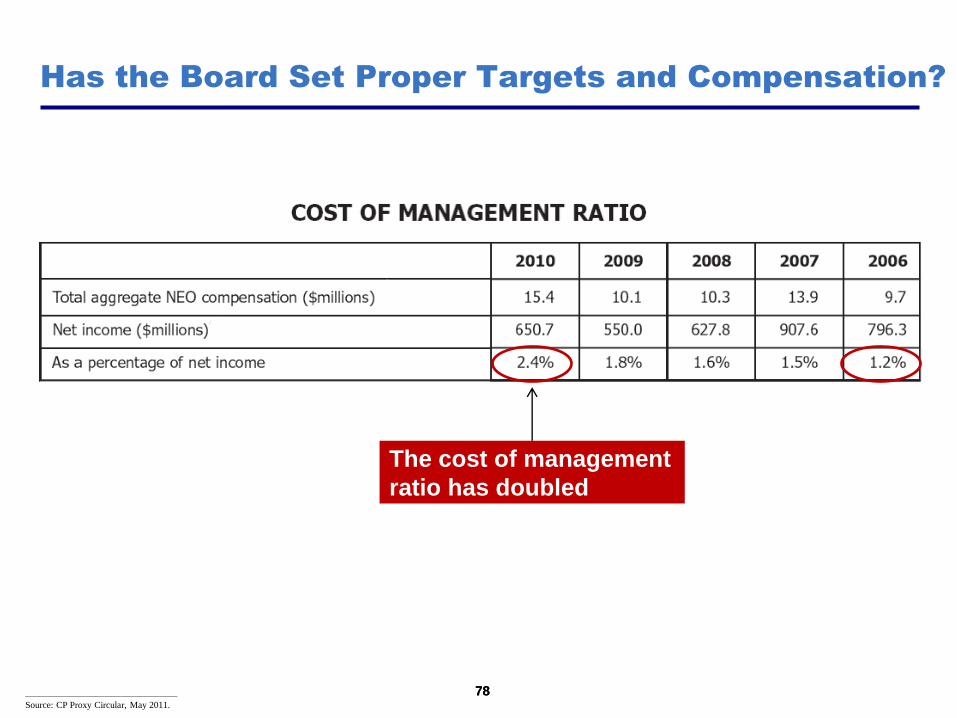
78
Has the Board Set Proper Targets and Compensation?
78 ________________________________________________
Source: CP Proxy Circular, May 2011.
The cost of management
ratio has doubled
79
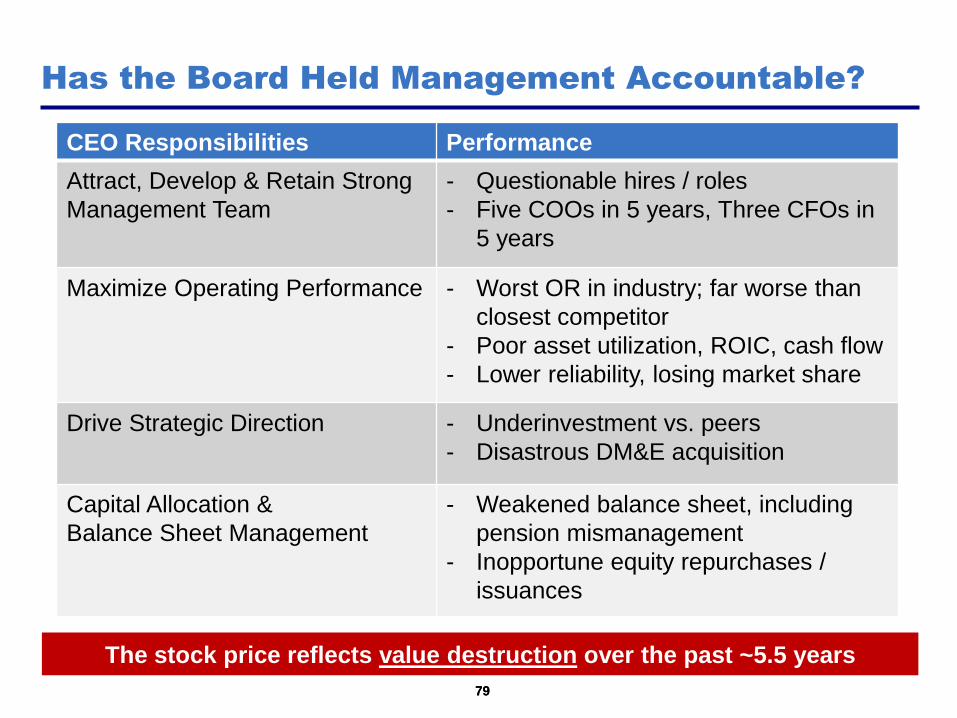
Has the Board Held Management Accountable?
79
CEO Responsibilities Performance
Attract, Develop & Retain Strong
Management Team
- Questionable hires / roles
- Five COOs in 5 years, Three CFOs in
5 years
Maximize Operating Performance - Worst OR in industry; far worse than
closest competitor
- Poor asset utilization, ROIC, cash flow
- Lower reliability, losing market share
Drive Strategic Direction - Underinvestment vs. peers
- Disastrous DM&E acquisition
Capital Allocation &
Balance Sheet Management
- Weakened balance sheet, including
pension mismanagement
- Inopportune equity repurchases /
issuances
The stock price reflects value destruction over the past ~5.5 years
80
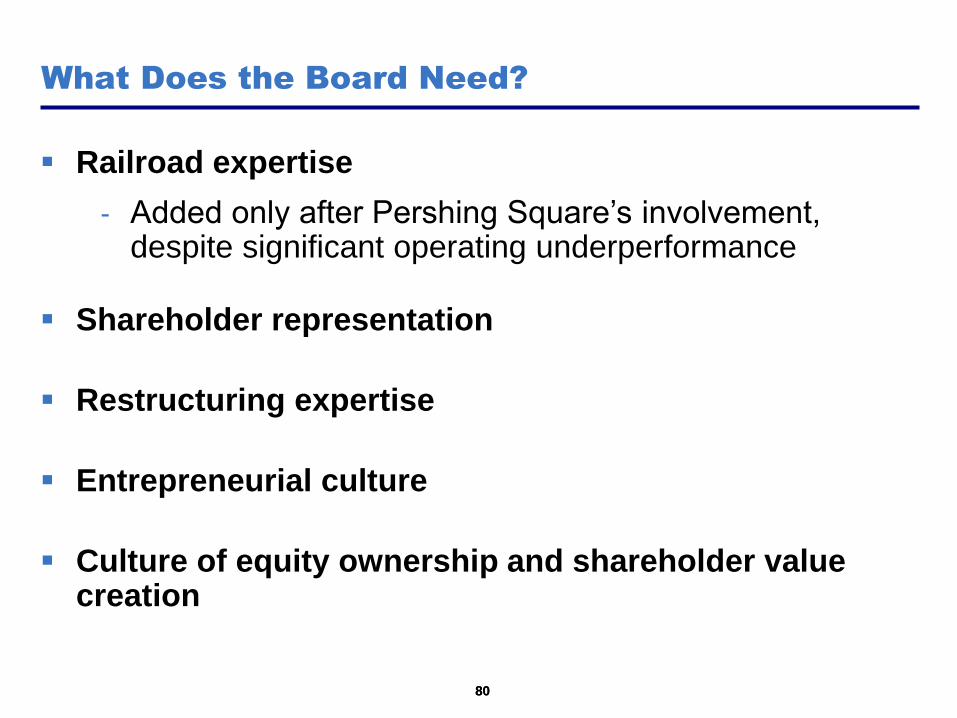
Railroad expertise
- Added only after Pershing Square’s involvement, despite significant operating underperformance
Shareholder representation
Restructuring expertise
Entrepreneurial culture
Culture of equity ownership and shareholder value creation
What Does the Board Need?
80

What Should CP Do?
82
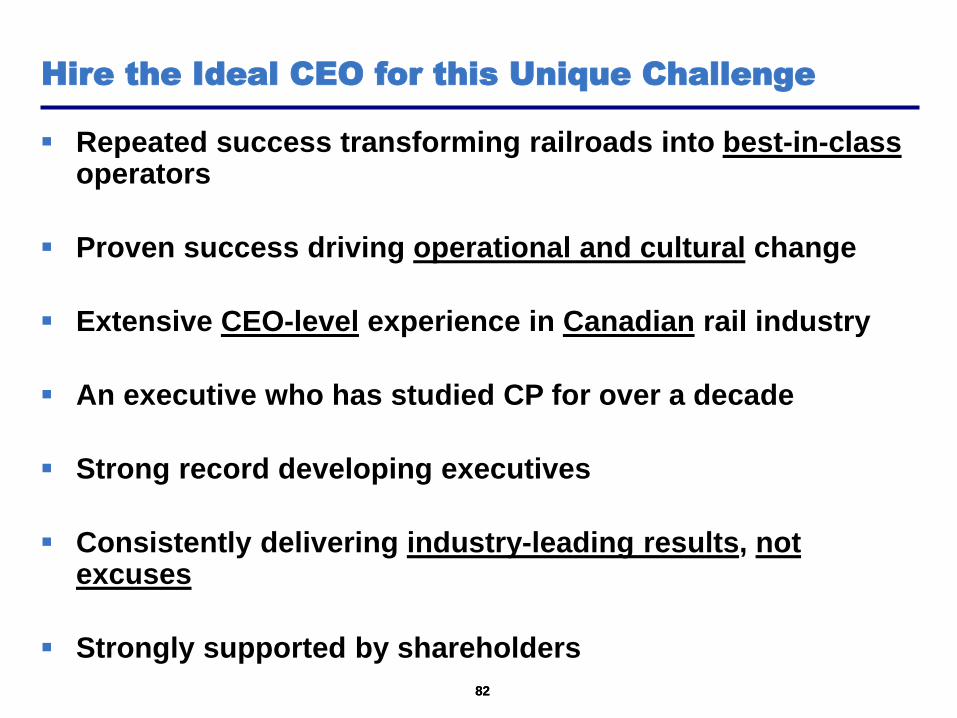
Repeated success transforming railroads into best-in-class operators
Proven success driving operational and cultural change
Extensive CEO-level experience in Canadian rail industry
An executive who has studied CP for over a decade
Strong record developing executives
Consistently delivering industry-leading results, not excuses
Strongly supported by shareholders
82
Hire the Ideal CEO for this Unique Challenge
Who is the best CEO alternative for CP?
83
84
Hunter Harrison
84
Led operational and cultural transformations at two underperforming railroads, including one in Canada. Drove unprecedented performance, far ahead of peers

85
Hunter Harrison
85
Hunter's experience gives him a unique and massive head start in the transformation of Canadian Pacific

86
Illinois Central - Case Study
86
Hunter Harrison led IC’s transformation into the best operating
railroad in the industry, ~2,000bps ahead of the competition
Pioneered and implemented Precision Scheduled Railroading
EBIT increased 2.8x
OR improved 1,700bps from 80% in 1989 to 63% in 1997
- Massive operating improvement despite price decreases prevailing at IC and within industry at the time
- Dramatic reduction in asset intensity, with 29% reduction in locomotives and 10% reduction in rolling stock, despite growing volumes
Bought by CN: 450% return to equity holders
Operating Ratio by Year
60%
65%
70%
75%
80%
19
89
19
90
19
91
19
92
19
93
19
94
19
95
19
96
19
97

87
Canadian National - Case Study
87
Operational / cultural transformation and implementation of Precision Scheduled Railroading
EBIT increased 2.6x
OR improved 1,100bps from 78% in 1997 to 67% in 2009
- As low as 62% OR in 2006 (1,600bps)
- $3bn of acquisitions (at high 70%s OR), integrating and transforming these rails, leading to flattish ORs in high 60%s in the early 2000s
- Not capital intensive capex = 17% of rev.
Total return to shareholders of 350%
Hunter Harrison led CN’s operational and cultural transformation
into the best operating railroad in the industry
Operating Ratio by Year
60%
65%
70%
75%
80%
19
97
19
98
19
99
20
00
20
01
20
02
20
03
20
04
20
05
20
06
20
07
20
08
20
09
20
10
20
11

88
Hunter is an Experienced
Culture Change Agent
Hunter Harrison
88
89
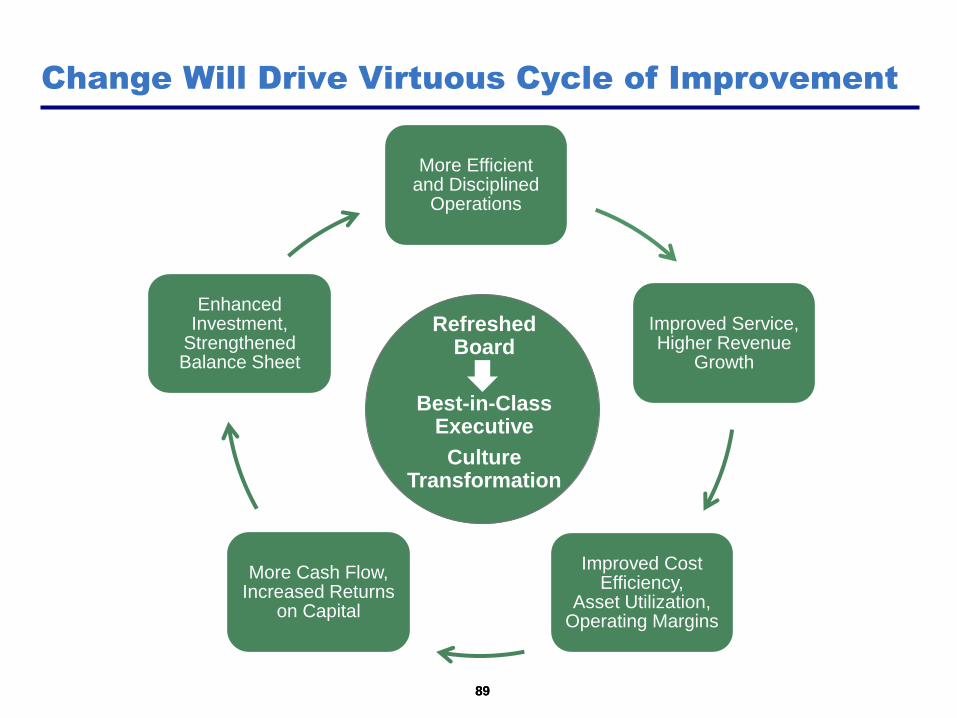
Change Will Drive Virtuous Cycle of Improvement
More Efficient and Disciplined
Operations
Improved Service, Higher Revenue
Growth
Improved Cost Efficiency,
Asset Utilization, Operating Margins
More Cash Flow, Increased Returns
on Capital
Enhanced Investment,
Strengthened Balance Sheet
89
Refreshed Board
Best-in-Class Executive
Culture Transformation

90
4% 6% 8%
69% $111.25 $121.48 $132.30
Year 4 (2015) 67% $119.90 $130.79 $142.30
Operating 65% $128.63 $140.18 $152.38
Ratio % 63% $137.44 $149.64 $162.55
61% $146.32 $159.19 $172.80
Revenue Growth, p.a. (2012 - 2015)
Intrinsic Value at Year 3 (12/31/2014) assuming 14x NTM Earnings
Change Will Drive Enormous Value Creation
90
4% 6% 8%
69% $7.95 $8.68 $9.45
Year 4 (2015) 67% $8.56 $9.34 $10.16
Operating 65% $9.19 $10.01 $10.88
Ratio % 63% $9.82 $10.69 $11.61
61% $10.45 $11.37 $12.34
Revenue Growth, p.a. (2012 - 2015)
Year 4 (2015) Earnings per Share
Assuming a mid-60% OR by year 4 (2015), CP’s intrinsic value could
be ~$140 per share in three years (12/31/2014)

…We now have the opportunity to do so ourselves
91
CP’s Board would not even interview Hunter Harrison…

Appendix:
CP’s Potential

93
Operating Ratio by Year
60%
65%
70%
75%
80%
85%
90%
1995 1996 1997 1998 1999 2000 2001 2002 2003 2004 2005 2006 2007 2008 2009 2010 2011
CP CN
A Look Back at Operating Margins
93
Hunter Harrison Joins CN
Is it possible that CP has always been efficient while CN (and every other U.S. Class I rail) improved margins massively?

94
Each Rail has Advantages and Disadvantages
While each Class I rail has specific characteristics, these
differences do not explain CP’s massive operating profit deficit
94
CP vs. CN
Potential Advantages Potential Disadvantages
- Most direct route through the
Rockies (100-miles shorter)
- Strong franchise, bulk / unit train
mix, longer hauls
- Bakken and ethanol access
- Unencumbered by low density
eastern Canada lines
- Steeper Rockies grade
- Fewer sidings / double track
- Lack of Prince Rupert & Halifax
access
- Less Alberta access
- Low density of U.S. lines
Earlier in his tenure, Fred Green privately told numerous investors that CP’s “structural disadvantage” vs. CN was benchmarked at ~200-300 bps
95
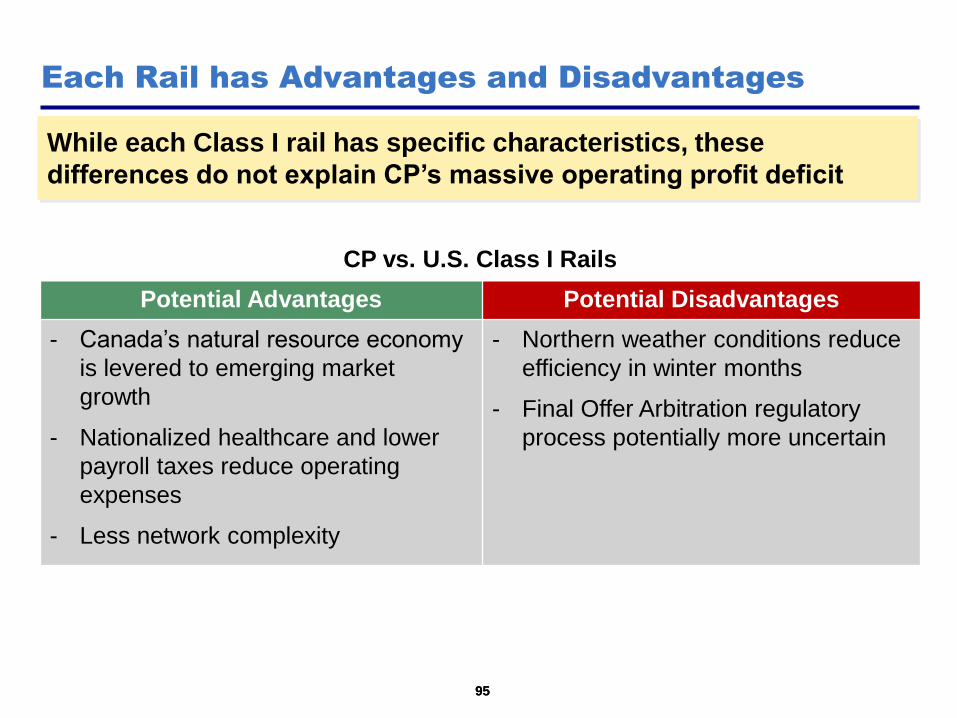
Each Rail has Advantages and Disadvantages
While each Class I rail has specific characteristics, these
differences do not explain CP’s massive operating profit deficit
95
CP vs. U.S. Class I Rails
Potential Advantages Potential Disadvantages
- Canada’s natural resource economy
is levered to emerging market
growth
- Nationalized healthcare and lower
payroll taxes reduce operating
expenses
- Less network complexity
- Northern weather conditions reduce
efficiency in winter months
- Final Offer Arbitration regulatory
process potentially more uncertain
96
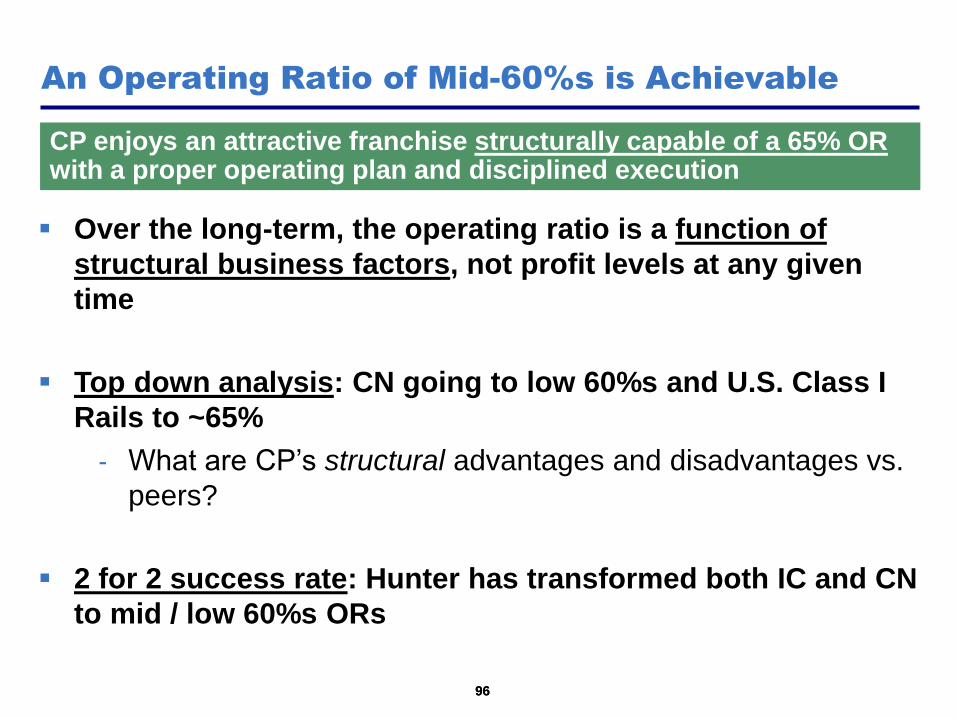
Over the long-term, the operating ratio is a function of
structural business factors, not profit levels at any given
time
Top down analysis: CN going to low 60%s and U.S. Class I
Rails to ~65%
- What are CP’s structural advantages and disadvantages vs.
peers?
2 for 2 success rate: Hunter has transformed both IC and CN
to mid / low 60%s ORs
An Operating Ratio of Mid-60%s is Achievable
CP enjoys an attractive franchise structurally capable of a 65% OR with a proper operating plan and disciplined execution
96

97
Hunter’s third turnaround, 47 years of experience, 12 more than when joining CN and 21 more than when joining IC
- Apply the many successful practices, learn and adapt from mistakes
Pace of similar OR improvement at IC and CN was slowed by a declining price environment (IC) and integration of lower margin acquisitions (CN)
Decade-plus of experience with CP, Canada, and competitive landscape
- Customers, terrain / routes, labour, regulations (FOA, interswitching)
Operating plan is proven and successful, similar best operating practices are already in place and producing results for CP’s competitor
- Adoption of concepts by employees / unions, customers, regulators, and other stakeholders will be more rapid given proven success of concepts
A Mid-60%s OR is Achievable in Four Years
Wealth of experience and massive “head start” enable four year improvement
97
Appendix:
Hunter Harrison & The Plan

99
Why Hunter Harrison?
99
Illinois Central – 1989 to 1997
- Led transformation of IC into best performing railway in North America, nearly ~2,000 bps ahead of industry at the time
- EBIT increased 2.8x, OR improved from 80% in 1989 to industry-best 63% in 1997
- Sold to CN: 450% return to equity holders
Canadian National – 1998 to 2009
- Led transformation of CN into best performing railway in North America
- EBIT increased 2.6x, OR improved from 78% in 1997 to industry-best 67% in 2009 (OR as low as 62% in 2006)
- Total returns to shareholders of 350%
Best executive in railroad industry; led operational and cultural
transformation of both Illinois Central and Canadian National into
best-in-class railways

100
Why Hunter Harrison?
100
Recognitions (amongst many):
- Railroader of the Year, Railway Age (2002)
- Award of Merit, B'nai Brith (2006)
- 1 of 10 appointed by PM Harper to North American Competitiveness Council (2006)
- CEO of the Year, Globe and Mail (2007)
- International Executive of the Year, Canadian Chamber of Commerce (2009)
- Railroad Innovator Award, Progressive Railroading (2009)
Best executive in railroad industry; led operational and cultural
transformation of both Illinois Central and Canadian National into
best-in-class railways
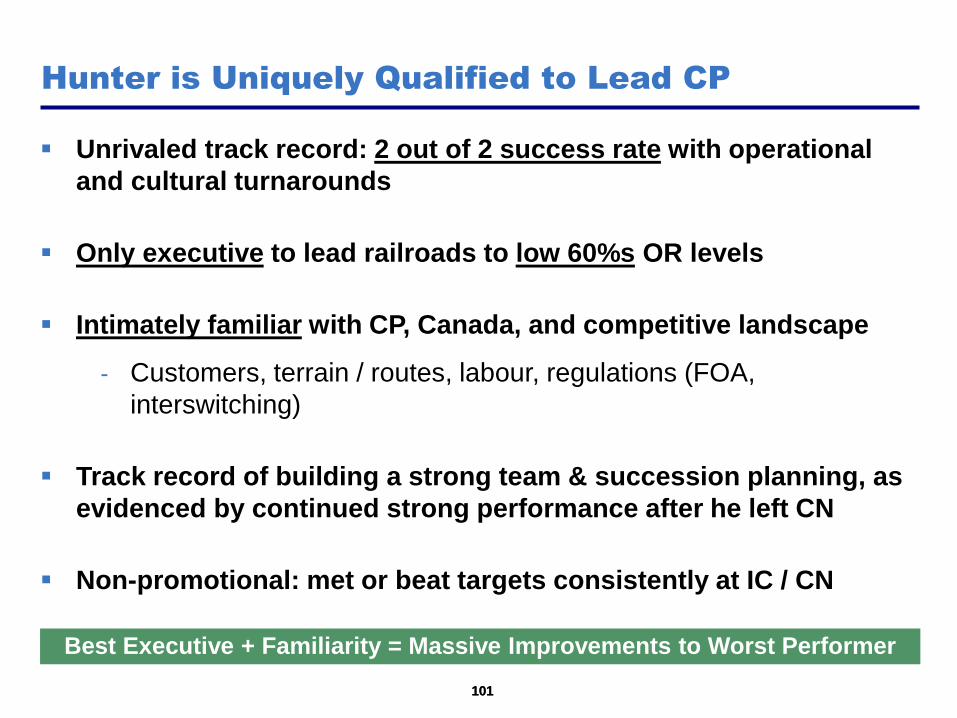
101
Unrivaled track record: 2 out of 2 success rate with operational
and cultural turnarounds
Only executive to lead railroads to low 60%s OR levels
Intimately familiar with CP, Canada, and competitive landscape
- Customers, terrain / routes, labour, regulations (FOA,
interswitching)
Track record of building a strong team & succession planning, as
evidenced by continued strong performance after he left CN
Non-promotional: met or beat targets consistently at IC / CN
Hunter is Uniquely Qualified to Lead CP
Best Executive + Familiarity = Massive Improvements to Worst Performer
101

102
Hunter’s Impact Is Transformational
102
“We will aim to be below 80 percent [operating ratio] in the year 2000. Ambitious goals? Perhaps, but I am convinced that they must be achieved.”
- Paul M. Tellier, CN’s 1996 Annual Report (April 1997)
“With an operating ratio of 62.3% during 1997, Illinois Central is one of the most efficiently operating railroads in North America. As a result, a portion of the
anticipated synergies from the Acquisition will be derived from the application of Illinois Central’s ‘best practices’.”
- CN / IC Merger Debt Securities Prospectus (May 1998)
Canadian National achieved a 69.6% operating ratio in 2000, utilizing Precision Scheduled Railroading, on the way to the low 60s by the mid-2000s

103
Operating philosophy is detailed in two published books with nearly 300 pages of detail(1)
Cultural transformation chronicled in another published book(2)
Philosophies described at length to CN and other industry employees at “Hunter camps”
Unrivaled track record of results
- 2 for 2 success rate
- Low 60%s operating ratios achieved
Hunter’ Plan – Precision Scheduled Railroading
The Precision Scheduled Railroading plan is the most known and transparent plan in the industry and has an unrivaled track record of results
103 ________________________________________________
(1) How We Work and Why (Running A Precision Railroad) and Change, Leadership, Mud and Why (How We Work and Why Volume II), by E. Hunter Harrison (2) Switch Points: Culture Change on the Fast Track to Business Success, by Judy Johnson, Les Dakens, Peter Edwards, Ned Morse

104
Superior service and reliability
- Service and reliability drives yield and volumes
Reduced capital spending levels with better asset utilization
- Capacity enhancements without excess capital spending
Enhanced cash flow increases ability to invest in and grow
franchise
Strong growth in earnings and cash flows lead to improved share
price performance
Good for all stakeholders and Canada
- Shippers / exporters, employees / unions, taxpayers, environment
Advantages of Precision Scheduled Railroading
An operationally efficient CP would be better for all stakeholders,
including employees, shippers, consumers, and shareholders
104

Appendix:
The Nominees for
Management Change

106
The Nominees for Management Change:
Bio – Bill Ackman
106
Bill Ackman, 45, is the founder and Chief Executive Officer of Pershing Square Capital
Management, L.P., an investment advisor with $11 billion of assets under management,
founded in 2003 and registered with the United States Securities and Exchange
Commission. Investors in Pershing Square's managed funds include university
endowments, public and private U.S., Canadian and European pension funds, individuals,
charitable foundations and sovereign wealth funds. Ackman is a director of the J. C. Penney
Company, Inc. (NYSE: JCP), Chairman of the Board of The Howard Hughes Corporation
(NYSE: HHC), and a director of Justice Holdings Ltd. (LSE: JUSH). Ackman is a member of the Board of
Dean's Advisors of the Harvard Business School and a Trustee of the Pershing Square Foundation, which
has made more than $130 million in grants towards inner city education, global health care delivery,
poverty alleviation, human rights, venture philanthropy, urban planning and the arts. Ackman received an
M.B.A. from Harvard Business School and a Bachelor of Arts magna cum laude from Harvard College.
107
The Nominees for Management Change:
Bio – Gary F. Colter
107
Gary F. Colter, 66, is the President of CRS Inc., a corporate restructuring, strategic and
management consulting company which he founded in 2002. Previously, Mr. Colter spent
34 years with KPMG Canada and its predecessor firm Peat Marwick, where he was a
Partner for 27 years, holding various senior positions, including Vice Chairman of
Financial Advisory Services and a member of the Management Committee from 1989 to
1998. From 1998 to 2000, Mr. Colter was Global Managing Partner of Financial Advisory
Services and a member of a then new International Executive Team for KPMG International.
In 2002, he retired as Vice Chairman of KPMG Canada. Since 2002, Colter has been a director of Owens-
Illinois Inc. (NYSE:OI), the largest manufacturer of glass bottles in the world, where he serves on the
Governance and Audit Committees and previously chaired the Audit Committee for over six years. In 2003,
he joined the Board of Canadian Imperial Bank of Commerce ("CIBC") (TSX:CM; NYSE:CM) where he
chairs the Governance Committee and serves on the Audit Committee. He previously served on the
Compensation Committee and Chaired the Audit Committee of CIBC for over five years and the Risk
Committee for one year. In 2004, Colter joined the Board of Core-Mark Holding Company, Inc.
(NASDAQ:CORE), a leading North American manufacturer of fresh and broad line supply solutions to the
convenience retail industry. Mr. Colter is Chair of the Governance Committee and serves on the Audit
Committee. He previously chaired the Compensation Committee for over three years. In 2005, he joined
the Board of Retirement Residences REIT, a company that provides accommodation, care and services for
seniors. In 2007, the company was purchased by Public Service Pension Investment Board and changed
its name to Revera Inc. Colter is Chair of Revera's Audit Committee and serves on the Governance
Committee. From 2003 to 2006, Colter was a director of Saskatchewan Wheat Pool Inc., now Viterra Inc.
(TSX:VT), and chaired the company's Audit Committee and was a member of the Strategic and Business
Planning Committee. Mr. Colter has a B.A. (Honours) in Business Administration from the Ivey Business
School of the University of Western Ontario, and is a Fellow Chartered Accountant.

108
The Nominees for Management Change:
Bio – Paul C. Hilal
108
Paul C. Hilal, 45, is a Partner at Pershing Square, which he joined in 2006. From 2002 to
2005, he was the Managing Partner of Caliber Capital Management, LP. From 1998 to
2001, he ran the information technology sector investment program at Hilal Capital
Management. From 1992 to 1997, Hilal was a Principal at Broadview Associates, providing
mergers and acquisitions advisory services to information technology companies. From
1999 to 2000, Hilal served as the Chairman of the Board and Interim Chief Executive Officer
of Worldtalk Communications Corporation. He served as a director of Ceridian Corporation
in 2007, prior to its sale to the Thomas H Lee Company. Hilal received an A.B. degree in Biochemistry from
Harvard College in 1988, a J.D. from Columbia University School of Law in 1992, and an M.B.A. from
Columbia University School of Business in 1992.
109
Rebecca MacDonald, 58, is a founder and current Executive Chair of Just Energy Group
Inc. (TSX:JE), a Toronto-based independent marketer of deregulated gas and electricity,
with annual sales of $3 billion. Just Energy currently supplies more than 3.5 million
customers across Canada and the United States, having signed its first customer in 1997.
She has been a director of Just Energy since 2001 and has held the position of Executive
Chair since 2007. In 1989, she founded Energy Marketing Inc., the first company which
targeted small customers under Canadian natural gas deregulation, which she subsequently
sold. Following the sale of that business, in 1995 she founded another company which aggregated
customers within the U.K. natural gas deregulation, which was also sold. Ms. MacDonald served as
President and Chief Executive Officer of Just Energy prior to becoming Executive Chair in 2007.
MacDonald is a member of the Board of Governors of the Royal Ontario Museum. She founded the
Rebecca MacDonald Centre for Arthritis and Autoimmune Disease at Mount Sinai Hospital in Toronto. She
is Vice-Chair of the Board of Directors of Mount Sinai Hospital. Previously, she was a director of the
Arthritis Society. In 2002, MacDonald received the Rotman Canadian Woman Entrepreneur of the Year
Lifetime Achievement Award. That same year, the University of Toronto, Rotman School of Business
named her Canadian Woman Entrepreneur of the Year for 2002. She was also named the top woman chief
executive officer for each year from 2003 to 2009 by Profit Magazine. She was named Ontario
Entrepreneur of the Year by Ernst & Young in 2003. In 2009, Ms. MacDonald received the Canadian
Horatio Alger Award for demonstrated community leadership. She received an honourary degree from the
University of Victoria in 2002.
The Nominees for Management Change:
Bio – Rebecca MacDonald
109
110
The Nominees for Management Change:
Bio – Dr. Anthony R. Melman
110
Dr. Anthony R. Melman, 64, is Chairman and Chief Executive Officer of Nevele Inc., providing
strategic business and financial advice to a wide range of businesses. Previously, Dr. Melman was
a Managing Director (until 2006) and a Special Advisor, Strategic Acquisitions (2006-07) at Onex
Corporation (TSX: OCX), which he joined as a Partner and Vice President at its inception in 1984.
At Onex, Dr. Melman led or participated in the company's bids for Labatt and Air Canada, and the
acquisitions of Sky Chefs Inc., Beatrice Canada and electronics maker Celestica Inc. (TSX: CLS;
NYSE: CLS), IBM's manufacturing arm. Together with Celestica's management team he developed
Celestica from a single-facility manufacturing operation in Toronto with under US$1 billion in annualized sales in
1996, to a global public company listed on both the New York and Toronto Stock Exchanges with over US$10
billion in sales by 2001. Prior to joining Onex, Dr. Melman served as a Senior Vice President of the Canadian
Imperial Bank of Commerce in charge of worldwide merchant banking, project financing, acquisitions and other
specialized financing activities. Since 2010, Dr. Melman has served as a director and Chair of the Budget and
Finance Committee of the Ontario Lottery and Gaming Corporation. He is a past director of Celestica Inc.,
ProSource Inc. and the University of Toronto Asset Management Corporation. He was until February 2, 2012 Chair
of The Baycrest Centre for Geriatric Care, one of the world's premier academic health sciences centres focused
on aging. Dr. Melman will continue as director of the Baycrest Centre, but has now assumed the role of Chair of
Baycrest Global Solutions, a for-profit corporation that will commercialize the intellectual property, assets, and
technologies of the Baycrest Centre. He is also the former Chair of the Childhood Cancer Charitable Council of the
Pediatric Oncology Group of Ontario (POGO) and a member of the Board of Governors of Mount Sinai Hospital. In
2011, Dr. Melman was appointed Chair of the Board of Directors of Cogniciti Inc., a for-profit joint venture created
by Baycrest and MaRS Discovery District, an organization that helps science, technology and social entrepreneurs
build their companies. Dr. Melman was born in Johannesburg, South Africa, and is a Canadian citizen. He holds a
Bachelor of Science degree in Chemical Engineering from the University of the Witwatersrand, a M.B.A. degree
(Gold Medalist) from the University of Cape Town and a Ph.D. in Finance from the University of the Witwatersrand.
111
Hunter Harrison, 67, served as the President and Chief Executive Officer of Canadian
National Railway Company ("CN") (TSX: CNR; NYSE: CNI) from January 1, 2003 to
December 31, 2009 and as Executive Vice President and Chief Operating Officer from
March 26, 1998 to December 31, 2002. Harrison served on CN's Board of directors from
December 1999 until December 2009. Prior to joining CN, Harrison served as President and
Chief Executive Officer of Illinois Central Corporation ("IC") and Illinois Central Railroad
Company ("ICRR") from 1993 to 1998, and as a director of IC and ICRR from 1993 to 1998.
At IC and ICRR, Harrison first held the position of Vice-President and Chief Operating Officer in 1989,
becoming Senior Vice-President – Transportation in 1991, Senior Vice-President – Operations in 1992,
and President and Chief Executive Officer the following year. His railroad career began nearly five decades
ago in 1963 when he joined the Frisco (St. Louis-San Francisco) Railroad as a carman-oiler in Memphis,
while still attending school. He advanced through positions of increasing responsibility in the operations
function, first with the Frisco, then with Burlington Northern after it acquired the Frisco in 1980. Before
moving to IC and ICRR in 1989, Harrison served as Burlington Northern's Vice-President – Transportation
and Vice-President – Service Design. Harrison currently serves or has served as a director on several
railway companies and industry associations, including The Belt Railway of Chicago, Wabash National
Corporation (NYSE: WNC), The American Association of Railroads, Terminal Railway, TTX Company,
Canadian National Railway Company, Illinois Central Corp., and Illinois Central Railroad Company.
Harrison has received numerous accolades, including North America's Railroader of the Year by Railway
Age magazine in 2002 and CEO of the Year by the Globe and Mail's Report on Business magazine in
2007.
Meet Hunter Harrison:
Bio – Hunter Harrison
111