the nitrogen cycle and its influence on the european ... nitrogen cycle and... · the nitrogen...
TRANSCRIPT

The nitrogen cycle and
its influence on the European
greenhouse gas balance
Integrated Project funded under the 6th Framework Programme
2006–2011
I 2 www.nitroeurope.eu
Table of contents
1 Key messages for policy makers 03
2 Technical Summary 04
3 Project overview, aims and scope 07
4 Main findings 08
4.1 Observations quantifying nitrogen fluxes and pools 08
4.2 Manipulation experiments 14
4.3 Plot-scale modelling of C-N interactions 19
4.4 Landscape analysis 22
4.5 European integration and up-scaling 25
4.6 Independent verification, uncertainties and policy analysis 29
4.7 Long-term curation and integrated management of data 32
5 Synthesis and integration 33
6 Key references and selected publications 37
7 List of project partners 42
Edited by: Mark Sutton and Stefan reiS
Report Authors: Sutton, M a, neMitz, e, Skiba, u M, beier, C, butterbaCh-bahl, k, Cellier, P, de VrieS, W, eriSMan, J W, reiS, S, bleeker, a, bergaMaSChi, P, CalanCa, P l, Cotrufo, M f, dalgaard, t, duyzer, J, gunderSen, P, henSen, a, kroS, J, leiP, a, oleSen, J e, oWen, S, reeS, r M, ShePPard, l J, SMith, P, zeChMeiSter-boltenStern, S, SouSSana, J f, theobald, M r, tWigg, M, Van oiJen, M, VeldkaMP, t, VeSala, t, WiniWarter, W, Carter, M S, dragoSitS, u, fleChard, C, helfter, C, kitzler, b,rahn, k h, reindS, g J, SChlePPi, P, with contributions from the NitroEurope community. 2011. The nitrogen cycle and its influence on the European greenhouse gas balance.
Published by Centre for Ecology & Hydrology
ISBN 978-1-906698-21-8
Cover images - Shutterstock

www.nitroeurope.eu 3 I
1 Key messages for policy makers ▪ Humans have more than tripled the circulation of
reactive nitrogen (Nr) in Europe, mainly through the production and release of fertilizers, in addition to fossil fuel combustion and biological nitrogen fixation.
▪ NitroEurope has combined experiments and modelling to quantify nitrogen fluxes and their influence on the European greenhouse gas budget. Additional synthesis activities have shown how these effects compare with the climate effects of Nr via aerosol and ozone.
▪ The new methods developed and comprehensive datasets obtained show how Nr interacts with other drivers of change at site, landscape, regional and European scales, pointing to opportunities for better Nr management and the development of mitigation options.
▪ A comprehensive nitrogen budget has been established, showing that Europe produces 15.6 Tg Nr annually, with 11.2 Tg from fertilizers, 3.4 Tg from combustion sources and 1 Tg from biological nitrogen fixation. In addition to the combustion emissions, agricultural Nr use is very leaky, wasting about 13 Tg to air and water annually.
▪ Atmospheric deposition of Nr increases the carbon storage of European forests, but this is constrained by an increase in Nr losses, while the ammonia (NH3) fraction of Nr deposition also represents a loss of productivity from agricultural systems.
▪ Comparing the warming effects of Nr emissions (N2O formation, ozone warming and phytotoxic effects) with the cooling effects (faster forest growth, altered methane lifetime and aerosol formation) leads to a rough balance over Europe (-16 (-47 to +15) mW m-2).
▪ Cost-benefit analysis indicates that the threats of Nr particles to human health and of Nr deposition to biodiversity loss greatly outweigh their potential climate benefits.
▪ There are many opportunities to reduce the climate warming effects of Nr losses.
• Efforts to reduce the Nr-related warming effects of tropospheric ozone must decrease both NOx and volatile organic compounds (VOCs), requiring ongoing improvement in combustion technologies and further efforts to reduce transport mileage and energy use.
• Efforts to reduce N2O emissions must focus on improving overall nitrogen use efficiency in agriculture, for which the implementation of technical measures to reduce ammonia emissions, denitrification to N2 and nitrate leaching is essential.
• The overall European nitrogen cycle is driven by the human quest for luxury consumption of animal products. Of the Nr in crops produced or imported to Europe (12 Tg) only 15% is used to feed people directly, with 85% going to feed animals.
• Avoiding dietary excess of meat and diary products would provide a major contribution to decreasing the climate warming effects of N2O, while reducing the threat of Nr emissions to human health and biodiversity at the same time.
Phot
ogra
ph -
Shu
tter
stoc
k

I 4 www.nitroeurope.eu
2 Technical summary
1 The NitroEurope IP has established an unprecedented level of collaboration across Europe to investigate the ways in which reactive nitrogen (Nr) affects the greenhouse gas balance. The 5-year programme has joined 62 institutes, combining measurements and models over multiple spatial scales.
Flux measurement2 Intensive measurements at a series of 13 flux
‘super sites’, have quantified N budgets and net greenhouse gas exchange (NGE), improving our understanding of the component fluxes. These have been supported by low-cost flux methods applied at 9 ‘regional sites’, with air chemistry and indicator measurements at 56 ‘inferential sites’.
3 The comparison of total atmospheric and agricultural Nr inputs with long-term CO2 flux datasets demonstrates higher carbon sequestration with increased Nr supply, with the relationship modified by land-use and climatic interactions.
4 The intensive flux datasets quantify how gaseous and water N losses increase with Nr inputs, constraining the benefit of Nr in increasing net carbon storage. Combined with changes in nitrous oxide (N2O) and methane (CH4) fluxes, most sites experience net greenhouse gas uptake. Nitrogen has a net benefit for NGE at the field scale, but not as big as previously been proposed because of the Nr loss processes.
5 Special topic studies have investigated the dynamics of N fluxes, showing how particle growth and evaporation processes are important in determining net Nr inputs to semi-natural ecosystems, and providing understanding in how fire affects NGE of Mediterranean shrublands, in addition to enabling the moisture and temperature sensitivity of soil gas fluxes to be quantified.
Global change effects6 A network of manipulation experiments has
investigated the ways in which global change
affects N fluxes and their impact on greenhouse gas balance. Experiments over different land use types have addressed the effects of land management, temperature, water availability, CO2 and Nr deposition.
7 The experiments in forests have quantified how soil warming and N status both increase N2O emissions, while in organic soils soil pH and groundwater dynamics were most important. These factors also controlled CH4 emission rates from wet soils, with CH4 soil uptake rates in dry soils being reduced by both warming and Nr availability.
8 Agricultural soils are the main source of N2O emission in Europe, highlighting the importance of developing appropriate management practices. It is estimated that better nutrient use efficiency, improved soil management and improved agronomy reduce emissions by 10 to 30%.
9 Over shrublands, NGE was dominated by CO2 exchange, with smaller fluxes of N2O and CH4, while wetlands provided peak CH4 fluxes. Nr input as NH3 gave a larger increase in N2O and CH4 from wetland compared with wet deposition, coupled with larger phytotoxic effects. Climate and Nr supply had interacting effects on CO2 fluxes, highlighting the complexity of simulating future conditions.
Plot scale modelling10 Efforts have focused on further development of
biogeochemical models for improved simulation of terrestrial C and N cycling, especially in relation to trace gas exchange, using a wide range of models. Testing the models in relation to experimental datasets has provided the basis for application in up-scaling to landscape and European scales.
11 An innovative aspect has been the use of Bayesian Calibration of the models to assess uncertainty and improve parametrization in the biogeochemical models. This has allowed model uncertainties to be compared with field measurements, as well as provided a basis to

www.nitroeurope.eu 5 I
identify model weaknesses and over/under parametrization, reducing overall uncertainties.
12 Examples of the processes investigated include the evaluation of competing hypotheses on processes driving spring-thaw N2O and the explanation of how grazing can actually decrease rather than increase N2O emissions in continental steppeland.
13 Application of the developed models to the NitroEurope measurement sites gives a better understanding of N and C cycling and its link to net GHG fluxes, and a sound basis for application in upscaling and testing mitigation options. One example shows how balanced fertilization can reduce N2O emissions from cropland by 20%.
Landscape analysis1 Up-scaling from plot to regional scale needs to
account for the complex interaction between individual landscape elements and their relation to land management. These interactions have received little study previously, with NitroEurope filling this gap by investigating the N and GHG interactions within explicit spatial contexts.
2 Detailed inventories were established for 6 European landscapes, providing harmonized data for application of a newly development modelling framework ‘NitroScape’ and a reference for verification measurements and scenario testing. A shared measurement strategy for characterizing landscape level nitrogen flows was adopted.
3 The NitroScape modelling framework was established by coupling existing component models (atmospheric, farm, ecosystem and hydrological models) to simulate spatially distributed N fluxes in a dynamic way using the Palm® model coupling system.
4 First testing of the NitroScape model has shown the importance of landscape scale interactions. It highlights the importance of spatial relationships between source and sink elements, for example with more than 10% of N2O emissions in the landscape caused by either short range NH3 dispersion or nitrate transfer through groundwater. Testing of example scenarios has shown the value of NitroScape as a new tool for assessing the effect of landscape structure and management/environmental management on nitrogen fluxes and impacts.
European up-scaling and integration5 European Integration within NitroEurope has
developed and applied GIS-based tools to assess changes in Nr and NGE fluxes for terrestrial ecosystems for the EU27. This included the development of a multicomponent model (INTEGRATOR), establishing a consistent database, application of upscaled ecosystem models and scenario studies.
6 Comparisons of models provided the basis to assess uncertainty on a European scale, including NH3, N2O and nitrate leaching. These show comparable estimates for NH3 emissions, while differences in N2O emissions are larger, reflecting the larger variation in model approaches.
7 Scenarios of changed N inputs induced by altered livestock numbers and land management, including the IPCC-SRES A1 and B2 scenarios, were evaluated using various terrestrial ecosystem models.
8 Results show that the impact of the IPCC scenarios on NH3 and N2O emissions is limited. Under the A1 scenario both European NH3 and N2O emissions are projected to increase by less than 4-8% between 2010 and 2030. By comparison, the B2 scenario indicates a slight decrease of similar magnitude over the same period.
9 Given these small estimated changes, achieving major reductions in emissions for N2O and NH3 is expected to depend on better farm management methods, requiring an improvement in nitrogen use efficiency (NUE) by reducing the N losses (NH3, denitrification to N2, nitrate leaching), as a basis to reduce total N2O emissions.
Independent verification, uncertainties and policy analysis10 Independent verification activities at the
European scale focused on estimates of nitrogen wet deposition, inverse modelling of N2O and CH4 emissions, uncertainty analysis and assesment the needs of policy stakeholders.
11 Precipitation chemistry data from several sources including the EMEP, ICP-Forest, ICP-IM and other national programmes were evaluated with quality assurance procedures and combined to establish a new estimate of wet nitrogen deposition at the European scale.

I 6 www.nitroeurope.eu
12 Atmospheric measurements combined with inverse atmospheric models were used to provide independent top-down estimates of N2O and CH4 fluxes using five modelling systems, as a basis to for a model ensemble approach to assess overall uncertainties, including a novel bias correction scheme to handle the low signal-to-noise ratio. The top-down estimates of N2O emissions are consistent with bottom-up inventories reported to the UNFCCC showing how the top-down approach can reduce the overall uncertainty in N2O emissions.
13 Five protocols for model uncertainty assessment were established, considering the suitability of different model types, parameter uncertainty and uncertainty in independent evaluation data, with these applied to ecosystem models, INTEGRATOR and the inverse models. The models were aggregated to a common resolution, including gap filling allowing the common uncertainties to be assessed.
14 Structured interviews were conducted with policy stakeholders identifying their needs and the importance of rapid transfer of new science outcomes. For this reason a strategy paper on 'Interactions of reactive nitrogen with climate change' was developed for the Executive Body of the UNECE Convention on Long-range Transboundary Air Pollution, and made available in support of the IPCC AR5 process and the UNFCCC.
Long term curation and data management15 Data management has included the
establishment of databases, grouped according to plot data (fluxes, manipulation, modelling), landscape data, and European wide datasets. Beyond the end of NitroEurope these databases will be integrated into a wider database portal, Environment and Climate interactions — Observations and Responses in Ecosystems (ENCORE), which is currently being developed. ENCORE will coordinate access
to high-quality climate-change related data throughout Europe, in which NitroEurope and other projects will be curated.
Synthesis and integration16 The results of NitroEurope have been synthesized
playing a key role to underpin development of the European Nitrogen Assessment. Key elements include the advancement of process understanding, establishment of European maps and a new European Nitrogen Budget, and estimation of the net effect of Nr emissions on the European radiative balance.
17 The policy relevant findings of NitroEurope are also being transferred to the UN process, both through the Task Force on Reactive Nitrogen (TFRN) of the UNECE Air Convention and through the 5th Assessment Report of the Intergovernmental Panel on Climate Change (IPCC). The TFRN has been established with the direct support of NitroEurope partners engaging with policy stakeholders. It has delivered a special report on nitrogen and climate to the Executive Body of the Air Convention, and is currently contributing to the revision of the Gothenburg Protocol.
18 One of the key messages to emerge is that reducing N2O emissions will require common efforts between the Air and Climate conventions. In particular, reducing N2O emissions will require efforts to improve nitrogen use efficiency (NUE) in agriculture, which are fundamentally dependent on reaching agreement to reduce both NH3 emissions and nitrate leaching. The current negotiations to revise the Gothenburg Protocol leading to reductions in NOx and NH3 emissions are therefore essential to meet multiple targets for air quality (particulate matter, ozone), climate (N2O and ozone), water and soil quality (NO3 leaching) and biodiversity (N deposition).

www.nitroeurope.eu 7 I
3 Project overview, aims and scopeThe NitroEurope IP — or NEU for short — addresses the major question: What is the effect of reactive nitrogen (Nr) supply on net greenhouse gas budgets for Europe? Its objectives have been to:
1 establish robust datasets of N fluxes and net greenhouse-gas exchange (NGE) in relation to C-N cycling of representative European ecosystems, as a basis to investigate interactions and assess long-term change,
2 quantify the effects of past and present global changes (climate, atmospheric composition, land-use/land-management) on C-N cycling and NGE,
3 simulate the observed fluxes of N and NGE, their interactions and responses to global change/land-management decisions, through refinement of plot-scale models,
4 quantify multiple N and C fluxes for contrasting European landscapes, including interactions between farm-scale management, atmospheric and water dispersion, and consideration of the implications for net fluxes and strategies,
5 scale up Nr and NGE fluxes for terrestrial ecosystems to regional and European levels, considering spatial variability and allowing assessment of past, present and future changes,
6 assess uncertainties in the European model results and
use these together with independent measurement/inverse modelling approaches for verification of European N2O and CH4 inventories and refinement of IPCC approaches.
These objectives are met by a programme that integrates: 1) an observing system for N fluxes and pools, 2) a network of manipulation experiments, 3) plot-scale C-N modelling, 4) landscape analysis, 5) European up-scaling and 6) uncertainty and verification of European estimates. Cross-cutting activities address management, databases, training & dissemination.
Within NitroEurope, 62 partner institutions and more than 300 scientists have collaborated over the course of five years to deliver a first, comprehensive analysis of the European nitrogen cycle. These findings are of substantial importance to assess the influence on greenhouse gas (GHG) emissions on a European scale, and the relationships between the full range of environmental effects of reactive nitrogen (Nr).
NitroEurope has interacted with a variety of international activities with a focus on nitrogen
research, such as the European Science Foundation programme Nitrogen in Europe (ESF-NinE), COST Action 729, the United Nations Economic Commission for Europe (UNECE) Task Force on Reactive Nitrogen (TFRN), and the International Nitrogen Initiative (INI) and other programs of IGBP and SCOPE. The synthesis activity of NitroEurope has taken place in close cooperation with these activities, implemented through the European Nitrogen Assessment (ENA), substantially extending the range and impact of the project beyond the original plan. In this way, the findings of NitroEurope have been fed directly to support policy analysis by the Member States of the European Union and Parties to the UN Framework Convention on Climate Change (FCCC), the Intergovernmental Panel on Climate Change (IPCC), the Convention on Biological Diversity (CBD), and especially the UNECE Convention on Long-range Transboundary Air Pollution (CLRTAP).
Figure 1 A map of the NitroEurope measurement network — Level 1, 2 and 3 sites.
NitroEurope — NEUflux network
Level 3: 'super sites'
Level 2: 'flux trend sites'
Level 1: 'inferential sites'
Biogeographical
regions
AlpineAtlanticBoreal
ContinentalMacaronesia
MediterraneanPannonian

I 8 www.nitroeurope.eu
4 Main findings
For the 7 Level-2 sites low-cost flux methods were developed to provide cumulative sampling methods. A COnditional Time Averaged Gradient (COTAG; Famulari et al., 2010) system was developed and tested to provide monthly average ammonia and nitric acid fluxes and was established at 15 of the Level-2 and Level-3 field sites across Europe. For measurements of soil nitrous oxide and methane fluxes a low-cost technique for sampling cumulative gases over long time periods (several weeks) was developed (Ambus et al, 2010). In this new approach, referred to as the SIGMA method (System for Inert Gas Monitoring by Accumulation), autochambers were applied for a period of 18 months at the Level-2 sites (Figure 5). A low cost approach was developed to estimate biological N fixation in intensively managed grasslands (Klump et al., 2010).
4.1 Observations quantifying nitrogen fluxes and pools
Nitrogen and greenhouse gas budgets were calculated for 56 sites across Europe (see Figure 1). The sites cover the main European climate zones and key ecosystems types: 30 forests, 8 wetlands/shrublands, 9 grasslands and 9 arable. Given the infeasibility of deploying a large network for all reactive nitrogen (Nr) measurements, a measurement strategy was developed that matches different data objectives to three levels of measurements. This tiered strategy included:
Level 1: 56 'Inferential Sites', combining basic reactive nitrogen concentration monitoring and indicators with micrometeorological datasets to infer nitrogen fluxes.
Level 2: 9 'Regional Sites', focusing on long-term time-integrated flux measurements, increasing regional coverage.
Level 3: 13 'Super Sites' with intensive measurements quantifying nitrogen budgets and advancing process understanding.
The Level-1 sites were established in 2006 to infer Nr deposition fluxes including dry deposition using inferential modelling, with wet deposition measurements at selected sites (Tang et al., 2009). Air chemistry was measured using the DELTA
denuder/filter method, which separates gaseous (NH3, HNO3, SO2, HCl) and aerosol (NH4
+, NO3
-, SO42-, Cl- and Na+, Ca2+,
Mg2+) species using monthly time-integrated sampling. (DELTA; Figure 2). This was combined with a modelling framework to infer deposition fluxes (Flechard et al., 2011). Results from four years of measurements demonstrated the atmospheric input of a wide range of Nr species across the European network, with the largest component contribution to estimated dry deposition resulting from gaseous ammonia (NH3, Figure 3), which mainly originates from agricultural activities. The contribution from wet deposition ranges from <20%, e.g. in Spain, to >50% in parts of Northern Europe and the Alps. These results permit analysis of net greenhouse gas exchange in relation to atmospheric and agricultural nitrogen inputs across the NitroEurope IP network combined with carbon flux data from the CarboEurope network (Figure 3). A clear positive relationship can be seen between nitrogen inputs and gross primary productivity, which is moderated both by management and climate differences for each of the main ecosystem types considered.
Phot
ogra
ph -
Shu
tter
stoc
k
Figure 2 The DELTA low-cost
measurement system, at the Level-1 oak
forest, Puechabon, France.

www.nitroeurope.eu 9 I
At each of the Level-3 sites (4 forests, 3 grasslands, 2 wetlands and 4 arable fields; e.g. Figure 6) the major components of the nitrogen budget were measured at a high spatial and
temporal frequency for 4.5 years. Measurement techniques included a combination of classical micrometeorological and chamber methods (Skiba et al., 2009). Examples of nitrogen
budgets for some of the Level-3 sites (Figure 7) demonstrate that in ‘natural’ ecosystems (forests, moorlands, shrublands, natural grasslands) the rate of atmospheric nitrogen deposition determines the rate of nitrogen losses. Atmospheric nitrogen deposition increases emissions of the greenhouse gas nitrous oxide, the atmospheric pollutant nitric oxide and the pollutant of waters, nitrate. In agricultural ecosystems nitrogen fertilisers and harvest products (i.e. grass, cereal, animals) dominate the
20
15
10
5
0
GP
P [M
g C
ha
-1 y
r-1]
2 3 4 5 6 7 8 910
2 3 4 5 6 7 8 9100
2 3 4
Total N input [k g N ha-1
y r-1
]
20
15
10
5
0
BE
DE
DE
DKFR
IT
UK
BE
NL
BE
CH
DE
DE
DK
ESFI
FI
FR
FR IT
IT
IT
PTRU
SE
SE
CH
DEDK
FR
IE
DE
ES
FI
HU
IT
NL
PL
UK
Crop Forest Grassland Semi-natural
FR
CZ
DE
ES
NL
UK
IE
PT
IT
FR
UK
Figure 3 The composition of dry deposited nitrogen species to semi-natural vegetation across Europe, as measured and modelled by the Nitroeurope IP. Contributions from wet deposition include site based measurement and EMEP model estimates.
Figure 4 Nitrogen input effects on gross primary productivity (GPP). In semi-natural ecosystems GPP appears to be related to atmospheric nitrogen deposition, whereas in agricultural ecosystems nitrogen supply is dominated by nitrogen fertiliser additions.
N dep [kg N/ ha / yr ]
50
25
0
NH3 gas dry
NH4+ aerosol dry
HNO3 gas dry
NO3- aerosol dry
NO2 gas dry
NH4+ wet
NO3- wet

I 10 www.nitroeurope.eu
nitrogen budgets (Ammann et al., 2010), while the conversion of fertiliser N to hay (e.g., CH-Oen) is much larger than the conversion to sheep (meat and wool) (e.g., UK-EBu).
Each of the Level-3 sites were sinks for carbon dioxide (CO2). At the arable and grassland sites the sink strength for CO2 was offset by emissions of the much stronger greenhouse-gas nitrous oxide (N2O). The application
of nitrogen fertiliser (including grazing excreta at Easter Bush) was the main source of the N2O. The rice paddy soil in Italy (IT-Cas) and the natural wetland in North Finland (FI-Lom) were large sources of the greenhouse gas methane (CH4). At the grazed grassland in the UK (UK-EBu) the sheep (~7 adult sheep per hectare) were also a significant source of CH4.
Overall, comparing this range of European ecosystems, nitrogen supply is expected to have the largest effect by altering the CO2 sink strength and by increasing N2O emissions. Wetland or grazing management (rather than Nr per se) were the main reasons for CH4 emission, while the effect of Nr on methane uptake made only a small contribution to the net greenhouse gas exchange when expressed in CO2 equivalents.
For the forest and peatland sites the results shown in Figure 6 highlight the large magnitude of N losses in response to increasing N inputs. The scale of these N losses clearly demonstrates
Figure 5 The low-cost COTAG gradient mast + denuders and the SIGMA chamber. Both systems were developed in the NitroEurope IP and are shown here at the Level-2 alpine grassland ‘Monte Bondone’, Italy.
Figure 6 The intensive measurement station at the Level-3 grazed grassland ‘Easter Bush’, UK.
Figure 7 Nitrogen budgets at Level-3 sites. Nitrogen inputs are wet and dry atmospheric deposition, biological nitrogen fixation. Losses of nitrogen are harvest (the nitrogen content in crop or in animals leaving the field), gaseous losses of nitrous oxide, nitric oxide, ammonia and nitrogen gas and leaching of nitrate and organic nitrogen compounds.
-40 -20 0 20 40
FI-Lom
UK-AMo
FI-Hyy
DE-Hog Atmospheric deposition
N fixation
Gaseous losses
Leaching losses
N losses N input
kg N ha-1 y-
forest
forest
peat wetland
peat wetland
-400 -200 0 200 400
UK-EBu
CH-Oen
HU_Bug
FR-Gri Atmospheric deposition
N fertilisation/fixation
Gaseous losses
Leaching losses
Harvest losses
N losses N input
kg N ha-1
arable
seminatural grassland
cut grassland
grazed grassland

www.nitroeurope.eu 11 I
2007; de Vries et al., 2008; Sutton et al., 2008). While some of the added N allows an increased carbon storage, at
increasing rates of N input over half of the added N may be lost by increased emissions to the air (N2, NOx, N2O) and water (NO3, organic Nr).
Specialist flux measurements: In addition to the comprehensive
why there are limitations to the increase in CO2 updake in response to N deposition, as debated during the course of NitroEurope (Magnani et al.,
-3200
-2800
-2400
-2000
-1600
-1200
-800
-400
0
400
800
FI-
Hyy
DK
-Sor
NL-
Spe
DE
-Hog
DE
-Geb
FR
-Gri
IT-C
as
IT-B
Ci
CH
-Oen
HU
-Bug
UK
-
FI-
Lom
UK
-AM
o
N2O
CH4
NEEg C
O2
eq m
-2 y
-1Figure 8 Field-level greenhouse gas budgets in CO2 equivalents (i.e. taking into account the higher warming potentials of N2O (298) and CH4 (25)) for the Level-3 forests FI-Hyy, DK-Sor, NL-Spe, DE-Hog, the arable fields DE-Geb, FR-Gri, IT-Cas (rice paddy), IT-BCi, the grasslands CH-Oen, HU-Bug, UK-EBu, and the peat wetlands FI-Lom, UK-AMo. Negative fluxes = greenhouse gas sink, positive fluxes = greenhouse gas source.
Figure 9 Time-series of the submicron aerosol chemical components, measured by the AMS (thin solid lines) and the MARGA at two measurements heights of 37 (dark coloured line) and 45 m (light coloured line) in the Dutch forest Speulderbos (Level 3 site).
12
8
4
0
21/06/2009 24/06/2009 27/06/2009 30/06/2009 03/07/2009 06/07/2009
10
8
6
4
2
0
0.50.40.30.20.10.0
6
4
2
0
Aero
sol M
ass
Load
ing
[ µg
m-3
]
AMS (45 m) MARGA-1 (45 m) MARGA-2 (37 m)
Ammonium
Chloride
Sulphate
Nitrate

I 12 www.nitroeurope.eu
programme of nitrogen and greenhouse gas budget measurements common to all Level-3 sites, the NitroEurope measurements included (a) the development of new advanced measurement and analysis approaches for the fluxes of
individual nitrogen compounds and (b) their application at the Level-3 sites as ‘Special Topic’ investigations. Collaborative measurement campaigns included a validation study of flux chambers for nitrous oxide and methane (Christiansen et al.
2011), a field intercomparison of ammonia analysers (von Bobrutzki et al., 2010) and an integrated field campaign at the Speulder Bos site (NL-Spe).
The aim of the Speulder Bos campaign was to study in detail the deposition of the nitrogen components contained in aerosol and the interaction between gas-phase ammonium (NH3), nitric acid (HNO3) and aerosol ammonium nitrate (NH4NO3), through measurements above and within the tree canopy. Figure 9 compares the aerosol composition
Figure 10 Soils collected from the NitroEurope network to measure greenhouse gas fluxes under controlled conditions (Schaufler et al., 2010).
Figure 11 Variations in potential nitrous oxide fluxes across European forests (olive), croplands (yellow), grasslands (green) and wetland/shrublands (blue).

www.nitroeurope.eu 13 I
measured with a High Resolution Aerosol Mass Spectrometer (AMS) (De Carlo et al., 2006) which detects PM1 non-refractory aerosol mass that evaporates at 600 °C, with a wet-chemistry analyser (MARGA), based on a steam jet aerosol collector (SJAC), coupled to online chemical analysis by ion chromatography (Thomas et al., 2008). This instrument detects the water soluble components in PM1. This measurement dataset provides evidence of how gas and aerosol processes interact within the canopy air space during the course of emission/deposition, as also investigated over fertilized grassland (Nemitz et al., 2009; Sutton et al., 2009).
Soil, vegetation and microbial measurements In order to fully understand the nitrogen cycling in terrestrial ecosystems, it is important to take into account the plant and soil pools, processes and interactions between nitrogen and carbon. For this purpose soil and plant samples were sent from all
measurement sites to NitroEurope partners in Italy, France, Denmark, Estonia, Austria and the Netherlands specialising in such analyses (Figure 10).
The measured data established empirical relationships which served as a basis for modelling to investigate the drivers and limiting factors of nitrogen cycling and greenhouse gas fluxes (e.g., Figure
11). In addition, a concerted effort was undertaken to assess the effect of fire in Mediterranean ecosystems (Figure 12). This enterprise triggered a large collaboration involving several new groups and served as an incentive for future European research in the area. Initial results showed that burning increased nitric oxide emissions, but reduced methane uptake and soil respiration rates.
Phot
ogra
ph -
Shu
tter
stoc
k
Figure 12 The effect of burning on soil carbon and nitrogen pools and fluxes was studied in Quintos de Mora, Spain.

I 14 www.nitroeurope.eu
4.2 Manipulation experiments
Global, climate and land use changes will affect how Nr impacts on greenhouse gas emissions from terrestrial ecosystems. In order to understand the magnitude of such changes and the underlying mechanisms, experiments with major drivers of change were conducted at 31 sites across Europe in forest, arable, shrubland and grassland ecosystems (Figure 13), and intensive measurement campaigns of N2O, CH4 and CO2 were conducted.
Forest Greenhouse gas exchange of mainly N2O and CH4 were measured for a wide range of European forests ranging from Sweden to Portugal and included coniferous and broadleaved forests. The manipulations included changes in N deposition, climate, soil hydrological condition, harvest intensity, wood ash addition, tree species and afforestation of arable land.
Soil hydrology dynamics was found to control the temporal and spatial variability of N2O fluxes (Figure 14). Increasing soil temperatures also lead to elevated N2O emissions by up to 73% compared to non-warmed plots (Figure 15). The emissions of N2O were positively related to mineral soil N status (Figure 16), but responses of N2O fluxes to Nr addition were negligible at a C:N ratio >25 in the mineral soil. For organic forest soils, soil pH and groundwater dynamics were found to be most important for N2O and CH4 dynamics.
The main factor controlling CH4 emission was soil moisture with hydrological manipulations affecting emissions the most (Figure 14). In drier conditions where uptake of CH4 dominates, the uptake rate showed a negative relationship with soil
Figure 13 The climate change experiment CLIMAITE at Brandbjerg, Denmark, with manipulation of temperature, precipitation and atmospheric CO2 in a shrubland ecosystem.
water content and inhibition of CH4 oxidation by increased Nr levels in the soil was indicated. Increased soil temperatures decreased CH4 uptake rates by 10–20% compared to non-warmed plots (Figure 15).
The changes of N2O and CH4 fluxes from external drivers on undisturbed forests are expected to occur on a decadal scale. However, management practices such as clear cuts can have immediate effects on GHG fluxes through changes in soil hydrology, soil temperature and N status. In aggrading forests fluxes of N2O
Figure 14 Spatial distribution of a) N2O and b) CH4 as controlled by hydrological conditions in a small beech forest catchment at Strødam, Denmark (Christiansen et al., 2010).
0 5 10 20 30 40Meters
(a) Strødam: N2O exchange
ChambersCH4 flux rate ug CH4-Cm-2 h-1
<-10-10 - 7.5-7.5 - 0 0 - 100 100 - 150 150 - 200
ChambersN2O flux rate ug N2O-Nm-2 h-1
<1.51.5 - 33 - 4.5 4.5 - 6 7.5 - 9 9 - 10.5 10.5 - 1212 - 13.5 >13.5
(b) Strødam: CH4 exchange

www.nitroeurope.eu 15 I
and CH4 are of little importance for the GHG balance since much CO2 is sequestered in biomass, but as the forest matures and soil drivers (N status, pH etc.) favour GHG exchange, the importance of N2O and CH4 for the forest GHG balance increase.
Agriculture and grasslands Agricultural soils are a major source of nitrous oxide in Europe, and management strategies to reduce greenhouse gas emissions are important. However, the effect of such management can be difficult to
assess against a background of fluxes that are highly variable in time and space. A network of seven arable experimental sites in Europe and one in Zimbabwe has therefore focussed on nitrous oxide emissions and management related environmental drivers including alternative tillage treatments, organic and conventional system management, changes in nutrient management, land use change and drainage treatments.
Nitrous oxide fluxes varied widely between sites and as a result of manipulation treatments. Average site emissions (throughout the study period) varied between 0.04 and 16.85 kg N2O-N ha-1 y-1 with largest variability associated with the grassland sites (Figure 17). Within the arable sites the fluxes varied between 1.0 and 4.9 kg N2O-N ha-1 y-1, with the highest fluxes observed from the Belgian tillage experiment at Maulde. Single variables were often poor predictors of emissions.
There was a large variability in fluxes related to mitigation treatments and generally greater than that among years and sites. In Zimbabwe the clearance of woodland and additions of N fertiliser were shown to be important in stimulating emissions, although annual emissions from most treatments were generally low (see Figure 18).
00.20.40.60.8
11.21.41.61.8
2
24/0
5/20
06
24/0
8/20
06
24/1
1/20
06
24/0
2/20
07
24/0
5/20
07
24/0
8/20
07
24/1
1/20
07
24/0
2/20
08
24/0
5/20
08
24/0
8/20
08
24/1
1/20
08
24/0
2/20
09
24/0
5/20
09
24/0
8/20
09
kg N
2O-N
ha-
1 yr
-1
control
warmed
-4.5
-4
-3.5
-3
-2.5
-2
-1.5
-1
-0.5
0
kg C
H4-
C h
a-1
yr-1
control
warmed
Figure 15 Effects of soil warming by 4°C at Achenkirchen, Austria. The graph shows how accumulated fluxes of N2O (kg N2O-N ha-1 y-1) increase and CH4 (kg CH4-C ha-1 y-1) decrease in the period 2006–2009.
-100
-50
0
50
100
150
200
250
300
350
01/04/07 31/03/08 31/03/09 31/03/10
N2O
flux
(nm
ol /
m² /
h)
controlN-addition
Figure 16 Effects of long-term nitrogen addition on N2O fluxes from the soil at Alptal, Switzerland.

I 16 www.nitroeurope.eu
Characterising the magnitude of potential mitigation is an essential prerequisite for the implementation of policies designed at reducing greenhouse gas emissions from the agricultural sector. It has been suggested that interventions that include better nutrient use efficiency, improved soil management and improved agronomy could achieve a reduction in emissions of 10 to 30%.
Shrublands Measurements of GHG exchange were conducted in nine European shrubland manipulation experiments with manipulation of climate related factors and nutrient and water availability. Among the shrublands, GHG exchange exhibited large spatial heterogeneity and fluxes were generally small, typically dominated by CO2, although the wetlands do provide peak fluxes of CH4 at times.
Changes in N2O fluxes were mostly dominated by hydrological changes such as drought/rewetting or changes
in water table depth, but were also strongly dependent on nitrogen availability, with weaker interactions with temperature and nutrient availability (Table 1). Nitrogen form (dry deposited ammonia gas or wet deposited ammonium or nitrate) was also important for N2O emissions in peatlands (NH3 and NO3
- > NH4+,
see Figure 19) and linked to the concentration of nitrate in the surface soil water in peatland,
likely as a consequence of nitrification. Drought reduced the flux of N2O and CH4, but generally not CO2 (Figure 20., from Sowerby et al. 2010). N2O emission showed significant interactions among climate related factors (Figure 21, from Carter et al., 2011)
Fluxes of CH4 were generally characterised by oxidation rather than emission, except
0
1
2
3
4
5
6M
auld
e
El E
ncin
Bea
no
Tullo
ch
Logå
rden
Pau
linen
aue
Foul
umMea
n N
2O-N
flux
kg
N2O
-N h
a-1 y
-1
-5
0
5
10
15
20
Cric
hton
Zarn
ekow
Thei
x
Naf
ferto
n
Göd
öllö
(SZI
U)
Pea
knaz
eMea
n N
2O
-N fl
ux k
g N
2O
-N h
a-1 y
-1
Figure 17 Nitrous oxide fluxes averaged across treatments and across years from the seven arable and six grassland sites included in the NitroEurope manipulation study. Bars represent standard errors.
0
10
20
30
40
50
60
70
80
90
100
Euca
lypt
us-p
lant
atio
nM
iom
bo-
woo
dlan
dPe
renn
ial-
tropi
cal
Rec
ently
-tre
es-c
utR
egul
ar-
crop
land
Rec
ently
clea
red
Mio
mbo
-w
oodl
and
Pere
nnia
l-tro
pica
l R
ecen
tly-
trees
-cut
Ef
fluen
t-irr
igat
edR
egul
ar-
crop
land
Rec
ently
-cl
eare
d
UZF UZF UZF UZF UZF UZF GRS CHU GRS PEN DTC GRSPLN WLD GLD CLD WLD GLD CLD
CLAY SOIL SAND / SANDY LOAM SOIL
N 2O
(μg
N 2O
-N m
-2 h
r-1)
Utilisation/ Alteration:
Site:Ecosystem:
Soil type:
+ = mean
Figure 18 Nitrous oxide emissions from a range of land use systems in Zimbabwe.

www.nitroeurope.eu 17 I
Table 1 Summary of drivers for GHG fluxes in shrublands as found in NitroEurope.
Figure 19 Mean N2O-N and CH4-C fluxes between May and December 2007 (blue) and July 2008 and June 2009 (red) measured using static chambers on a peat bog Whim in the Scottish Borders treated with additional precipitation, control (0 kg N ha-1 y-1), sodium nitrate (Nox56), ammonium chloride (Nred56) or exposed to ammonia, through free air release, at 56 kg N ha-1 y-1 since 2002. (n=10, the error bars are large due to spatial heterogeneity and only the effects of ammonia on N2O fluxes are significant).
N2O CH4 CO2 Indirect effects and interactions
Water Dominant driver (if N status allows N2O emissions). Precipitation variability, water table changes, drying/rewetting. (Carter et al., 2011; Sowerby et al., 2010)
Dominant driver. Water table, rewetting pulses. (Carter et al., 2011; Sowerby et al., 2010)
Repeated drought have long term effects on soil structure, soil carbon and microbial community (Sowerby et al., 2008; 2010)
Nitrogen High N status is main pre-requisite for N2O emissions (Carter et al., 2011)
N form important in wet bogs
N form or high levels of N may affect species composition affecting GHG emissions. Nitrogen input affects on pH — relevant for studies on various N forms
Temperature Potential minor effect through stimulated N availability and interactions with labile C in elevated CO2 (Carter et al., 2011).
Minor effect on effluxes from wetlands.Warming increase CH4 uptake at well-drained heathland site (Carter et al., 2011)
Reduced at drought (Sowerby et al., 2010)
Remove water and potentially nitrogen through growth stimulation — potential effect on N2O emission
Other Nutrients
No effect Short term stimula-tion of emission by nutrient addition if microbes limited (Lund et al., 2009). Stimulate plant uptake (Lund et al., 2009)
Management Management/disturbance is not an issue for most of the shrubland sites except from cata-strophic events such as wild fires.
May-Dec 2007
cont
rol
µg N
2O-N
m-2
h-1
µg C
H4-
C m
-2 h
-1
cont
rolN
ox56
Nox
56Nre
d56
Nre
d56
amm
onia
56
amm
onia
56
July 2008 - June 2009 2000
1500
1000
500
0
40
30
20
10
0
-10

I 18 www.nitroeurope.eu
from wetlands and were largely controlled by water table depth and rewetting cycles. The CH4 uptake increased with increasing soil temperature and decreasing soil moisture, while nutrient availability had no effect (Lund et al., 2009). Nitrogen form also affected the CH4 emissions in wet bogs with high CH4 emissions associated with nitrate addition related to increased soil pH. The risk from N deposition increasing CH4 and N2O production is relatively small unless peatlands are close to an ammonia source <1 km, or until the level of N deposition starts to impact the vegetation i.e. reduce moss or higher plant cover.
Generally, GHG fluxes at the sites were dominated by soil respiration (e.g. Sowerby et al. 2010). Therefore factors affecting the carbon uptake in plants (e.g. nitrogen, nutrients and water availability) or release from the soil (e.g. water and temperature) are important for the overall GHG exchange. Repeated drought treatment has had the most significant impact, with impacts being seen throughout the year, not just during periods of drought or re-wetting following the drought (Sowerby et al., 2008; 2010).
-1.0
0.0
1.0
2.0
3.0
4.0
5.0
2000 2008
CH
4 flu
x as
CO
2 equ
ival
ents
(gC
H4 a
s C
O2 e
quiv
.m-2
yr-1
)
Control CH4Drought CH4Warming CH4
-1.0
0.0
1.0
2.0
3.0
4.0
5.0
2000 2008
N2O
flux
as
CO
2 equ
ival
ents
(gN
2O a
s C
O2 e
quiv
.m-2
yr-1
)Control N2ODrought N2OWarming N2O
-10
0
10
20
30
40
50
60
2000 2008
(gC
O2 m
-2 y
r-1)
Control CO2Drought CO2Warming CO2
Figure 20 GHG flux from the Clocaenog site; measured in 2000 (following 1 drought period) and 2008 (following 10 repeated summer drought periods). All data converted to GHG equivalents, based on conversion values in IPCC 3rd Assessment Report (2001). Note: the change in scale between N2O/CH4 and Soil respiration. Error bars show the standard error of the mean, n=3.
ACO2 D
DCO2 TTCO2 TD
TDCO2
Mea
n N
2O fl
ux (
g N
m-2
h-1
)µ
µ
-2
0
2
4
6
8
CO2 ×D P=0.047
D×Time P<0.0001
(b)
Mea
n CH
4 fl
ux (
g C
m-2 h
-1)
-100
-80
-60
-40
-20
0 (a)
T CO2×Time
P=0.044P<0.0001
Figure 21 Mean CH4 fluxes (a) and mean N2O fluxes (b) across measuring campaigns in the full-factorial study at Brandbjerg (DK) for the ambient treatment (A) in addition to elevated CO2 (CO2), drought (D) and elevated temperature (T) as single treatments and in all combinations (CH4, n=54; N2O, n=66; means ± SE). Figure from Carter et al., 2011).

www.nitroeurope.eu 19 I
4.3 Plot-scale modelling of C-N interactions
The main focus of the plot scale modeling work has been on the further development and provision of biogeochemical models for an improved simulation of C and N cycling in terrestrial ecosystems and associated C and N trace gas exchange. A focus of model development at the site scale has fed into upscaling to landscapes and the European scale. Several models have been involved, specifically the multi-ecosystem models COUP, DailyDAYCENT and MOBILE-DNDC, the agro-ecosystem models CERES-EGC, ECOSSE and FASSET as well as ecosystem specific forest (BASFOR) and grassland models (PASIM and PROGRASS).
Even though the most advanced biogeochemical models have been included in NitroEurope,
the models still have weaknesses with regard to the representation of specific soil-plant processes and/or uncertainties about environmental drivers and parameter values (Van Oijen et al., 2011). To narrow these shortcomings, protocols for various aspects of Uncertainty Quantification and Uncertainty Analysis (UQ/UA) were developed and applied. An innovative aspect here was the use of Bayesian Calibration for assessing parametric uncertainty and improving parameterization of parameter-rich biogeochemical models. This approach allowed e.g. to quantify uncertainties of model outputs in comparison to field measurements (Figure 22), to identify model weaknesses and over-parameterization of processes requiring further improvements or simplifications. It could also been shown that Bayesian Calibration is a promising tool to quantify and reduce uncertainties in initial carbon distribution in the most widely applied soil biogeochemical models. This is of outstanding importance, since the initial distribution of soil organic matter into two or more kinetically defined conceptual
pools influences the simulations of biosphere-atmosphere-hydrosphere exchange of CO2, N2O, NO3 and other C and N compounds (Yeluripati et al., 2009). Giving a specific focus to N2O emissions at various arable field sites in France, the work of e.g. Lehuger et al. (2009) shows that Bayesian Calibration of the nitrous oxide emission module of the agro-ecosystem model CERES-EGC model allowed significant reduction in uncertainties in in simulated soil N2O emissions. Based on this type of work carried out within NitroEurope it will be possible to obtain more realistic estimates of N2O emissions from arable soils at regional or continental scales.
On the basis of the evaluation of model uncertainties, NEU stimulated the further improvement of model structures and process descriptions. An example of this is the evaluation of competing hypotheses on processes driving spring-thaw N2O emissions, with spring-thaw N2O emissions being periods which may dominate annual N2O emissions in cool temperate climates. Figure 23 shows, that implementation of three competing hypotheses
0 50 100 150 200 250 300 350
020
4060
80
day of year
NO
em
issi
on in
[gN
ha−
1]
Figure 22 Annual time course of measured and simulated soil NO emissions at the NEU Level-3 site Höglwald, Germany. The shaded area represents the model uncertainty due to uncertain values of model parameters needed for simulating soil NO emissions.

I 20 www.nitroeurope.eu
in one of the NEU core models allowed on the one hand to identify relevant processes and mechanism and on the other hand to dismiss other explanations. It further demonstrates that a close cooperation of measuring and modelling communities is needed to further advance the state of knowledge, while providing the theoretical basis to understand unexpected observations. For example, research published in Nature, of how grazing can actually decrease N2O emissions in continental steppeland (Wolf et al., 2010).
One of the major tasks of the plot scale modelling component
was the application of models to various field sites of the NitroEurope network in order to gain a better understanding of N and C cycling and N2O emissions at ecosystem scale for various systems across Europe. Figure 24 shows results of the application of two NEU core models (FASSET, MOBILE-DNDC) to the experimental site at Foulum, Denmark (Chirinda et al., 2011). By this thorough testing of models at various field sites confidence was gained that models are ready for regional application for European upscaling. To facilitate regional application some models were re-structured to speed up
computational performance and further processing of results, e.g. for the calculation of national and European wide inventories.
Another aspect of this work has been the simulation of impacts of alternative farming management practices on ecosystem N dynamics and N2O emissions. The aim of this activity is to identify at various field sites of the NitroEurope network potential mitigation options for GHG emissions. This work also helps in quantifying the sensitivity of different input parameters on model results, especially N2O emissions and crop productivity. Figure 25 shows simulated N2O
Figure 23 Simulated and measured ammonium concentration in the upper soil 1994–1997, (b) nitrate concentration in the upper soil 1994–1997, (c) N2O emissions from the soil 1994–1997, (d) close up of the freeze–thaw event in spring 1996. Hypothesis 1: Lower oxygen diffusion stimulates anaerobiosis and denitrification, Hypothesis 2: Microbes, dying of frost, deliver dissolved organic carbon to the soil which drives growth when temperatures increase again, Hypothesis 3: N2O reductase is more sensitive to lower temperatures than other N-reductases. Please note that Hypothesis 1 and the default simulation cannot be identified in the figure because they are both very near to the axis (De Bruijn et al., 2009).
30 Dec 13 Jan 27 Jan 10 Feb 24 Feb 9 Mar 23 Mar 6 Apr 1995 1996 1996 1996 1996 1996 1996 1996
1994 1995 1995 1996 1996 1997
(a) NH4 (µgNgDW-1)
(b) NO3 (µgNgDW-1)
(c) N2O emissions (gNha-1day-1)
(d) Measured and modelled N2O emissions (gNha-1day-1)
MeasuredDefault modelHypothesis 1Hypothesis 2Hypothesis 3Hypothesis 1+2
100
75
50
25
0
250
200
150
100
50
150
100
50
100
80
60
40
20
0

www.nitroeurope.eu 21 I
emissions following balanced N fertiliser application as compared to normal fertiliser application at the Grignon arable site using the ECOSSE model. If fertiliser is applied to meet the crop demands (Balance N fertiliser) — with yields remaining unaffected — total cumulative N2O emissions in the period between 16/07/2003–22/04/2008 can be reduced from 8.8 kg N2O-N/ha to 6.9 kg N2O-N/ha, a reduction of about 22%. 0
20
40
60
80
100
FASSET
O4+CC
0
20
40
60
80
100
O4-CC
Dai
ly s
oil C
O2
flux
(kg
C h
a-1 d
-1)
0
20
40
60
80
1000
20
40
60
80
100
O2+CC
Date
Oct-07 Feb-08 Jun-08
MOBILE-DNDCMeasured
a
d
c
b
C4-CC
0
1000
2000
3000
4000
5000
O4-CC
Cum
ulat
ive
soil
CO
2 flu
x (k
g C
ha-1
)
0
1000
2000
3000
4000
5000
O4+CC
0
1000
2000
3000
4000
5000
Oct-07 Feb-08 Jun-08
0
1000
2000
3000
4000
5000FASSET
O2+CC
MOBILE-DNDC Measured
e
f
g
h
C4-CCFigure 24 Daily and
cumulative soil heterotrophic CO2 respiration as predicted
using the FASSET (thick black lines) and MoBiLE-DNDC (grey
lines) models and compared with field measurements
(closed symbols and thin black line with error bars) in plots
from one mineral fertilizer based (C4−CC) and two
organic rotations with (O4+CC) and without (O4−CC) a catch
crop and also an organic crop rotation that included a
grass-clover ley and catch crop (O2+CC). Field measurements are means of two replicates. The arrows indicate times of
fertilization. Bars indicate standard error (n=2).
-2
8
18
28
38
48
58
68
78
88
98
28/06/2003 14/01/2004 01/08/2004 17/02/2005 05/09/2005 24/03/2006 10/10/2006 28/04/2007 14/11/2007 01/06/2008
Date
N2O
em
issi
ons
(g N
/ha/
day)
Current fertiliser
Balance N fertiliser
Figure 25 Simulated reductions in soil N2O emissions by balance N fertiliser application as compared to normal fertiliser application from 16/07/2003–22/04/200 at the Grignon arable site.
I 22 www.nitroeurope.eu
4.4 Landscape analysis
In rural landscapes, upscaling from the plot to the regional scale involves accounting for the complex interactions between individual landscape elements (patchwork of crops, grassland, forest and other ecosystems, hedgerows, rivers, farmsteads, etc.) as well as their relations with farm management. Up to now, neither regional nor plot models include those effects of local spatial interactions and the constraints/possibilities implied by decisions on N management at the farm and landscape levels on GHG and Nr fluxes. The landscape analysis within NitroEurope aimed at filling this gap by investigating such interactions for European landscapes in an explicit spatial context (land use, topography, hydrology, etc) and with a special focus on Nr interactions
with GHG fluxes. This work has been organised around (i) the development of a landscape model, the so-called NitroScape model, (ii) its verification on a network of European landscapes and (iii) scenario studies using this model for investigating environmental and policy issues.
The landscape analysis was naturally linked with other NitroEurope components. At smaller scale, it makes it possible to link between sources and sinks, integrate farm management and perform assessment of indirect effects due to spatial relationship. At larger scale, it allows assessing the importance of local heterogeneity and local interactions when upscaling, and analysing sub-grid processes.
Establishing a network and a database for European landscapesOne key output is the establishment of a network of European landscapes aiming at studying the N flows and processes and their consequences in agricultural areas. Six landscapes (in Denmark, France,
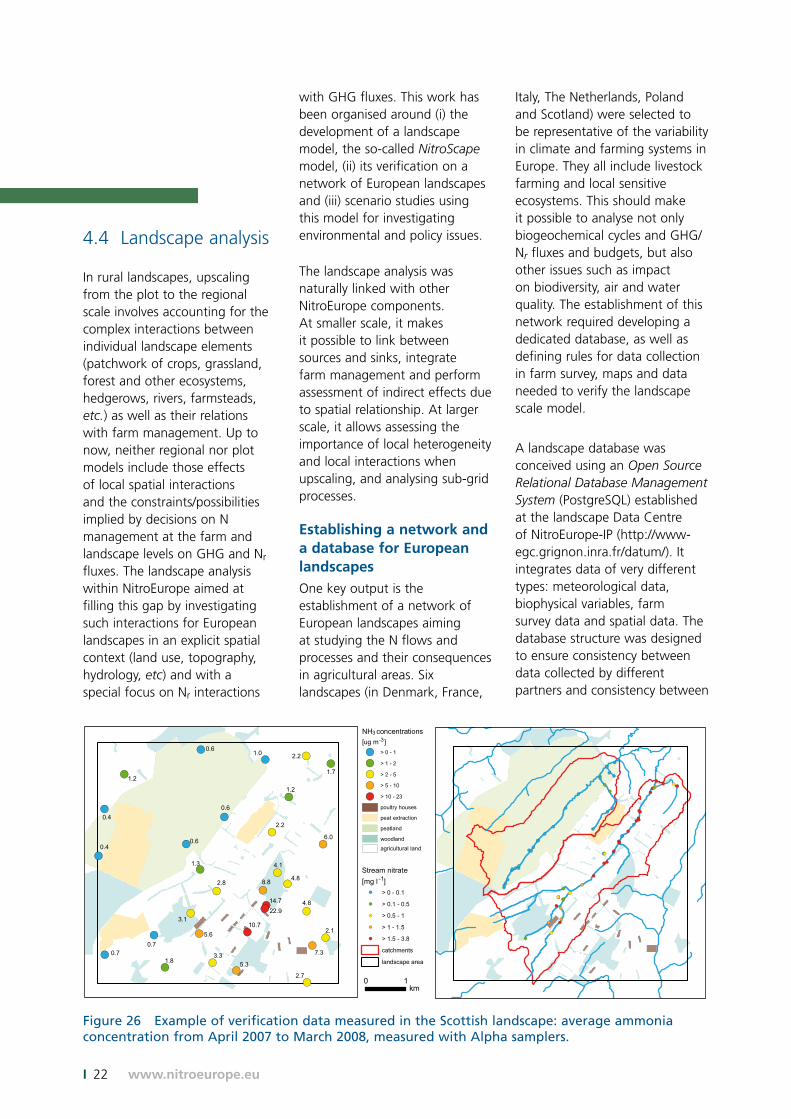
Italy, The Netherlands, Poland and Scotland) were selected to be representative of the variability in climate and farming systems in Europe. They all include livestock farming and local sensitive ecosystems. This should make it possible to analyse not only biogeochemical cycles and GHG/Nr fluxes and budgets, but also other issues such as impact on biodiversity, air and water quality. The establishment of this network required developing a dedicated database, as well as defining rules for data collection in farm survey, maps and data needed to verify the landscape scale model.
A landscape database was conceived using an Open Source Relational Database Management System (PostgreSQL) established at the landscape Data Centre of NitroEurope-IP (http://www-egc.grignon.inra.fr/datum/). It integrates data of very different types: meteorological data, biophysical variables, farm survey data and spatial data. The database structure was designed to ensure consistency between data collected by different partners and consistency between
Figure 26 Example of verification data measured in the Scottish landscape: average ammonia concentration from April 2007 to March 2008, measured with Alpha samplers.
!(
!(
!(
!(
!(
!(
!(
!(
!(
!(
!(
!(!(
!(
!(
!(
!(
!(
!(!(
!(
!(
!(
!(
!(
!(
!(
!(
!(
!(
!(
6.0
1.0
0.7
0.6
0.6
0.6
0.71.8
7.3
4.8
4.8
1.2
2.2
1.7
2.1
2.2
8.8
4.1
5.3
5.6
2.7
1.2
0.4
0.4
3.1
2.8
1.3
3.3
22.914.7
10.7
0 1km
!(!(
!(!(
!(!(!(!(
!(
!(
!(
!(!(
!(
!(
!(
!(
!(
!(!(
!(!(!(!(
!(!(!(!(!(
!(!(!(
!(
!(!( !(!(
!(!(!(
!(!(
!(!(!(!(
!(!(!(
!(!(!(
!(!(!(!(!(
!(!(
!(
!(
!(!(!(
!(!(!(!(
!(!(
!(
!(
!(!(
!(
-1Stream nitrate[mg l ]
!( > 0 - 0.1
!( > 0.1 - 0.5
!( > 0.5 - 1
!( > 1 - 1.5
!( > 1.5 - 3.8
catchments
landscape area
NH concentrations[ug m ]
!( > 0 - 1
!( > 1 - 2
!( > 2 - 5
!( > 5 - 10
!( > 10 - 23
poultry houses
peat extraction
peatland
woodland
agricultural land
3-3