the nist 2014 speaker recognition i-vector machine ... · the nist 2014 speaker recognition...
TRANSCRIPT

224
Odyssey 2014:The Speaker and Language Recognition Workshop16-19 June 2014, Joensuu, Finland
The NIST 2014 Speaker Recognition i-Vector Machine Learning
Challenge
Craig S. Greenberg1, Désiré Bansé
1*, George R. Doddington
1, Daniel Garcia-Romero
2,
John J. Godfrey2, Tomi Kinnunen
3, Alvin F. Martin
1, Alan McCree
2, Mark Przybocki
1,
Douglas A. Reynolds4
1 National Institute of Standards and Technology, Gaithersburg, MD
2 Human Language Technology Center of Excellence, Johns Hopkins University, Baltimore, MD
3 University of Eastern Finland
4 MIT Lincoln Laboratory, Lexington, MA
*Guest Researcher
Abstract
During late-2013 through mid-2014 NIST coordinated a
special machine learning challenge based on the i-vector
paradigm widely used by state-of-the-art speaker recognition
systems. The i-vector challenge was run entirely online and
used as source data fixed-length feature vectors projected into
a low-dimensional space (i-vectors) rather than audio
recordings. These changes made the challenge more readily
accessible, enabled system comparison with consistency in the
front-end and in the amount and type of training data, and
facilitated exploration of many more approaches than would
be possible in a single evaluation as traditionally run by NIST.
Compared to the 2012 NIST Speaker Recognition Evaluation,
the i-vector challenge saw approximately twice as many
participants, and a nearly two orders of magnitude increase in
the number of systems submitted for evaluation. Initial results
indicate that the leading system achieved a relative
improvement of approximately 38% over the baseline system.
1. Introduction
The National Institute of Standards and Technology (NIST)
regularly coordinates speaker recognition technology
evaluations [1], the most recent of which occurred in late 2012
[2]. The task in the NIST Speaker Recognition Evaluations
(SRE) is speaker detection, i.e., determine whether a specified
speaker is speaking during a given segment of speech. The
objective of this series is to drive the technology forward, to
measure the state of the art, and to find the most promising
algorithmic approaches.
During late-2013 and continuing through mid-2014, NIST
coordinated a special i-vector challenge [3]. Like the SRE
series, the goal of the i-vector challenge was to foster research
progress in order to improve the performance of speaker
recognition technology. Unlike the SRE series, the i-vector
challenge utilized i-vectors [4] as source data (rather than
audio recordings), was run entirely online (rather than the data
being shipped), and system performance scores were made
available to participants throughout the evaluation period
(rather than after the evaluation period was over). These
changes made the challenge more readily accessible,
especially to participants from outside the audio processing
field, hoping to draw interest from the machine learning
community. Additionally, these changes enabled system
comparison with consistency in the front-end and in the
amount and type of training data as well as the exploration of
many more approaches than would be possible in a single
SRE.
In this paper we provide a description of the 2014 i-vector
challenge task and an overview of the initial results. We begin
with a very brief description of key components of an i-vector
based speaker recognition system. In Section 3 we describe
evaluation objectives, followed by the task, data, experimental
design, and performance metric utilized in the i-vector
challenge in Section 4. In Section 5 we describe the baseline
system that was made available as part of the challenge, as
well as some experiments run using an oracle system. We
then provide an overview of challenge participation in Section
6 and the results obtained to date in Section 7. Finally, in
Section 8 we draw conclusions and discuss future directions
for i-vector challenge series.
2. i-Vectors
Here we provide a high-level description of the i-vector
approach used in state-of-the-art speaker recognition systems
(for a detailed description see, for example, [4] [5]). In
Figure 1 we show a simplified block diagram of i-vector
extraction and scoring. An audio segment (e.g., one side of a
telephone call) is first processed to find the locations of speech
in the audio (speech activity detection) and to extract acoustic
features that convey speaker information (typically mel-
frequency cepstra and derivatives at 100 feature
vectors/second). This sequence of feature vectors is then
represented by their distribution relative to a Universal
Background Model (UBM), which is a Gaussian mixture
model (GMM) characterizing speaker-independent speech
feature distributions. The parameters of this distribution are
then transformed into an i-vector of 600 dimensions using a
total variability matrix, T. The i-vector is whitened by
subtracting a global mean, m, scaled by the inverse square root
of a global covariance matrix, W, and then normalized to unit
length [5].
Finally, a score between a model and test i-vector is
computed. The simplest scoring function is the cosine distance
between the i-vector representing the speaker model (average
of i-vectors from the speaker’s training segments) and the i-
vector representing the test segment. The current state-of-the-
art scoring function, called Probabilistic Linear Discriminant
Analysis (PLDA) [5] [6], requires a within-class (WC) matrix,
characterizing how i-vectors from a single speaker vary, and

225
an across class (AC) matrix, characterizing how i-vectors
between different speakers vary.
Figure 1: Simplified block diagram of i-vector
extraction and scoring.
Collectively, the UBM, T, W, m, WC, and AC are known as
the system’s hyper-parameters and must be trained before a
system can enroll and/or score any data. The UBM, T, W, and
m represent general feature distributions and total variance of
statistics and i-vectors, so they only require unlabeled data for
training. The WC and AC matrices, however, each require a
large collection of i-vectors from thousands of speakers each
of whom have tens of samples.
The i-vectors used for the challenge were extracted using a
speaker recognition system developed by the Johns Hopkins
University Human Language Technology Center of
Excellence in conjunction with MIT Lincoln Laboratory for
the 2012 NIST Speaker Recognition Evaluation [7]. Standard
MFCC and deltas acoustic features and a GMM trained speech
activity detector were used. The 2048 mixture UBM and T
matrix used in i-vector extraction were trained using the
development partition described in Section 4.3. The speech
duration used for each i-vector was also supplied as side
information.
3. Evaluation Objectives
The primary technical objective of the challenge, similar to
that of other NIST evaluations of speaker recognition
technology, was to support and encourage the development of
new methods, utilizing i-vectors, for speaker detection in the
context of conversational telephone speech. This included
more specific goals of:
Exploring new ideas in machine learning for use in
speaker recognition
Making the field more accessible to participants
from the machine learning community
Improving technology performance over an
established baseline
3.1. Objectives Based on Challenge Format
This challenge, however, also had other key objectives, based
on its data limitation to only i-vectors and its development of
an easily accessed web platform. It sought a broad expansion
in the number and types of participating sites, including ones
in the machine learning community and others not generally
involved in processing large quantities of audio data.
Given that all participants would be provided with a single
large development set of unlabeled vectors, along with an
initial baseline system, it was anticipated that many would
experiment with new, perhaps unexpected and creative,
approaches to modeling and clustering, and that these
approaches, rather than facility with data management, would
drive performance improvement. Further, it was hoped that
fast scoring turnaround and support for large numbers of
iterative system submissions would allow effective approaches
to be recognized and enhanced during the evaluation period.
Beyond the challenge this year, it was hoped that some key
aspects of this evaluation, including its use of web-based
registration, data distribution, and submission of results would
be found convenient and effective and become usual practice
in future NIST evaluations of speaker recognition and similar
technologies.
3.2. Objectives Based on Data Selection
With a speaker detection task based on conversational
telephone speech of previously unknown speakers, this
challenge was in other respects similar to prior NIST
evaluations before 2012, but several of the data selection
choices made affected the results and the performance factors
to be examined.
In most prior evaluations the core task has involved use of
a single conversation for modeling target speakers in the core
test, but multiple conversational modeling has frequently been
an optional test. For this challenge it was decided to have only
one test and for it to use training segments from five different
conversations. Past results suggest that the use of multiple
sessions may improve performance more than simply
providing longer duration segments [8], perhaps because the
additional variability offered produces enriched models.
With respect to segment duration, most prior evaluations
had segments of fixed signal duration, typically five minutes
(nominally 2.5 minutes of speech) in the core test, and often
ten seconds in an optional test. In the i-vector challenge
segment durations were selected from a log-normal
distribution. Such variability is probably more realistic for
many real applications, particularly ones not involving
cooperating participants paid to provide five minute
conversations. It also supports an objective of post-evaluation
analysis of the effects of duration across a broad range of
values.
Most past NIST evaluations have emphasized the harder
aspect of the speaker recognition problem with respect to two
other factors, one involving non-target trials, the other target
trials. The selected non-target trials have generally been same-
sex trials, and the overall test could be separated into male and
female subsets. (Target speaker gender information was
generally provided.) Target trials have generally been chosen
to be trials involving different telephone handsets (to the
extent this information was known), to avoid conflating
speaker match with handset match, as non-target trials are
unlikely to involve matched handsets.
In this challenge it was decided to include cross-sex non-
target trials and same handset target trials in large numbers.
This was partly because it was decided to include as trials all
possible model and test segment pairs (with speaker gender
not specified). This will allow post-evaluation examination, in
the context of i-vector based systems and the type of data
supplied, of the extent to which system performance is
enhanced or perfected when non-target trials are cross-sex or
target trials involve the same handset.
226
4. Evaluation Design
The main elements of an evaluation are (1) the task being
evaluated, (2) the metric used to measure performance on the
task, (3) the data sources and partitions used, and (4) the rules
and conditions to be followed. In this section we describe
these elements for the 2014 i-vector challenge. Since the focus
of the first i-vector challenge was to make it accessible to
researchers not familiar with prior SREs, details of these
elements were kept clear and uncomplicated.
4.1. Task
The task in the i-vector challenge was speaker detection, i.e.,
to determine if a particular person is speaking in a test audio
recording. Each system’s performance on this task was
evaluated by completing a set of trials, where a trial compares
a target speaker model (defined by a set of training audio
recordings represented as i-vectors) to a test audio recording
(represented as an i-vector). A system must determine whether
or not the speaker in the test recording is the target speaker
and return a single (real) number, where higher a value
indicates a greater degree of belief that the target speaker was
the speaker in the test recording. These system outputs are
then compared with ground truth (i.e., the evaluation key) and
a measure of performance for the system is computed.
4.2. Performance Measure
The trials consisted of a mix of target and non-target trials.
Target trials were those in which the target and test speaker
are the same person. Non-target trials were those in which the
target and test speaker were different persons. A decision to
accept or reject a trial was made by comparing a system’s
output to a threshold; an output greater than the threshold
meant to accept a trial as a target trial. When a target trial was
incorrectly rejected, this is a miss error. When a non-target
trial was incorrectly accepted, this is a false-alarm error. By
using the sorted values of outputs from a system as thresholds,
the system’s misses and false-alarms were accumulated at all
possible a-posteriori thresholds.
The overall performance measure was a decision cost
function (DCF) given by a linear combination of the miss and
false alarm error rates at a threshold, t:
DCF(t) = (|misses(t)| / |target trials|)
+ (100 × |false alarms(t)| / |non-target trials|)
The minimum DCF obtained over all threshold values was
the official metric for the challenge. Thus for each a system
submission, the performance score returned during the
challenge was this minimum DCF (minDCF) over the set of
trials in the progress set (see section 4.3.1). At the conclusion
of the challenge, the score for each site’s final submission was
determined based on the trials in the evaluation set.
4.3. Data
The data used for the i-vector challenge was derived from
pooling telephone audio collections from the MIXER corpora
collected by the LDC for the NIST Speaker Recognition
Evaluations (MIXER 1-7, and REMIX) [2] [9] [10]. Although
these corpora were used in prior SREs (04, 05, 06, 08, 10, and
12), it is believed that there is little issue with this negatively
impacting the evaluation since the i-vector challenge does not
provide audio and controls the data that can be used. The
aggregate collection consisted of audio from 59,729 telephone
call sides from 6,087 speakers. The calls typically were of 5
minutes in duration, giving nominally 2 minutes of speech per
call side. To add in duration variability, from each call side a
segment following a log-normal distribution (mean of 39.6
seconds) of durations was used. For each segment a 600
dimensional i-vector was produced along with the speech
duration in seconds in the audio. From this pool, enroll/test
and development partitions were defined.
4.3.1. Enroll/Test Partition
For the enroll/test partition, 500 speakers, evenly divided
between males and females, were selected as target speakers.
Each speaker selected had calls from at least 5 distinct
telephone numbers, and had at least 8 calls from a single
telephone number. From each speaker’s telephone number,
groups of 5 calls were used for model enrollment and the
remaining calls were used for tests. This selection process
produces more than one model per speaker and allows for
same telephone number target trial tests (model and test come
from the same telephone number) as well as different
telephone number target trial tests (model and test come from
different telephone numbers). The number of same-phone-
number and diff-phone-number target trials per speaker was
limited to 10 each.
Non-target trials were created from “in-set” and “out-of-
set” speakers. Trials of one target speaker’s model compared
to test segments from another target speaker constituted “in-
set” non-target trials. From an additional 500 speakers, evenly
divided between males and females, at most 10 calls were
selected for “out-of-set” non-target trials. These different sets
were created to allow testing of system responses to seen and
unseen non-target speakers, similar to SRE121.
The enroll/test partition consists of 1,306 target speaker
models (comprised of 6,530 i-vectors) and 9,634 test i-vectors.
4.3.2. Development Partition
The remaining calls from speakers not used in the enroll/test
partition were used for the development partition. The
development partition consisted of 36,572 call sides coming
from 4,958 speakers (1930 males and 3028 females). Speaker
labels were not provided with the development set to add in an
inherent clustering task that reflects a real-world problem of
having access to large but unlabeled data. The development set
could be used for any purpose, such as deriving whitening
parameters, unsupervised clustering to create synthetic labels
to train compensation matrices, or as background set vectors
for Support Vector Machine (SVM) training.
4.3.3. Trials for Submission and Scoring
The full set of trials for the challenge consisted of all possible
pairs involving a target speaker model and a single i-vector
test segment. Thus the total number of trials was 12,582,004.
It is worth noting that, unlike in the traditional SREs, the
challenge included cross-sex trials as well as same-phone-
number trials.
1 Though, due to the evaluation rule restricting model interaction, the
expectation is that performance on these two sets should be the same.

227
The trials were divided into two randomly selected
subsets: a progress subset, and an evaluation subset. The
progress subset comprised 40% of the trials and was used to
monitor progress on a scoreboard viewable by all challenge
participants. The remaining 60% of the trials formed the
evaluation subset, which was used to generate the official,
final scores at the end of the challenge.
4.4. Rules and Conditions
Each system submission was required to contain outputs for
the full set of trials in order to be scored. The output produced
for each trial had to be based solely on the training and test
segment i-vectors provided for the trial (along with the
development data). Use in any way of the i-vectors provided
for other trials was not permitted. For example, the following
were not allowed:
1. Normalization over multiple test segments
2. Normalization over multiple target speakers
3. Use of evaluation data for impostor modeling
4. Training system parameters using data not provided
as part of the challenge
These rules were put in place to focus the evaluation on the
core speaker detection task. The first rule reflects that the task
is detection on individual test segments not on an ordered
sequence of segments or a batch of segments. The second rule
was instituted to keep all non-target trials from “unseen”
speakers, minimize the dependency of trials, and reflect a
system that is ready to operate after enrolling a single speaker
without an implicit assumption of a large set of other target
models available. The third rule is related to the issues
discussed above. The last rule is new for this evaluation and
was instituted to remove the “data engineering” dimension
present in past evaluations. Data engineering not only makes it
difficult to distinguish system gains due to data selection and
algorithmic/technique improvements; it also serves as a barrier
to entry for sites without extensive knowledge and access to
applicable speech data resources.
5. Baseline and Oracle Systems
In this section, we present the official baseline system
distributed to the participants, as well as an oracle PLDA
system that makes use of the speaker labels of the
development set. The oracle system is used to quantify the
value of having access to the speaker labels as reflected by the
performance gap.
5.1. Baseline system
The algorithm used in the baseline system is a variant of
cosine scoring with the following recipe:
1) Use the unlabeled development data to estimate a
global mean and covariance.
2) Center and whiten the evaluation i-vectors based on the
computed mean and variance.
3) Project all the i-vectors into the unit sphere.
4) For each model, average its five i-vectors and project
the resulting average-model i-vector into the unit
sphere.
5) Compute the inner product between all the average-
model i-vectors and test i-vectors.
Unlike in the typical supervised setup for cosine scoring
[4], WCCN and LDA cannot be used due to the lack of
speaker labels; instead, the baseline system pre-processes the
i-vectors by an unsupervised technique that performs centering
and whitening based on the statistics of the development data.
The performance of the baseline system on the progress set
and evaluation set is shown in Figure 2.
5.2. Oracle PLDA system
The oracle system is a gender-independent PLDA system with
a 400 dimensional speaker space (see [5] for details). For
scoring, all the i-vectors from a model are averaged together
and then the log-likelihood ratio is computed pretending that
there is a single enrolment i-vector. This heuristic works well
in practice and deals with the incorrect assumption of
conditional independence of enrolment i-vectors (see [11] for
a more detailed discussion). Also, length-normalization is
applied to the individual i-vectors prior to the averaging.
Therefore, the average i-vector used for enrolment does not
have unit length. Renormalizing the average i-vector resulted
in higher minDCF values.
Duration variability is one of the dominant challenges of
this task. However, since the evaluation setup only provides
access to i-vectors, available techniques to deal with duration
variability (such as pi-vectors [11], or uncertainty propagation
[12] [13]) are not applicable. Instead, to constrain the amount
of duration variability in the development set, the i-vectors
from speech cuts shorter than 30 seconds are discarded. This
reduces the development data from 4,958 speakers with
36,572 i-vectors to 3,769 speakers with 17,424 i-vectors.
Filtering out the i-vectors from short cuts results in a slight
improvement on minDCF from 0.241 to 0.226 on the progress
set. Figure 2 shows the DET plot for the Oracle PLDA system
on the progress and evaluation sets.
5.3. Analysis of Performance
Figure 2 shows the gap in performance between the baseline
and the oracle PLDA system for the progress and evaluation
sets. The large gap in performance represents the value of
having access to the speaker labels. Therefore, there is a big
space for techniques that can obtain good estimates of the
labels (e.g., clustering the development set). It is important to
note that the difference between the progress and evaluation
sets is very small, although the evaluation set seems slightly
easier. This is purely coincidental, as the partition into sets
was performed by random selection of trials.
Figure 2: A DET plot of the baseline and oracle PLDA
systems on the progress set and evaluation set.

228
Figure 3: A plot showing minDCF of the baseline and
oracle PLDA systems on the progress set broken down
by trial type. Pool includes male and female, and
Pool+X also includes cross-gender trials.
Unlike in the standard NIST evaluations, this challenge
includes cross-gender trials in the task. Approximately, 50%
of the non-target trials are cross-gender. Figure 3 shows the
performance of the baseline and oracle systems in terms of
gender. The inclusion of cross-gender trials makes the task
easier but not trivial. Also, it forces systems to be able to work
under a more general setup.
6. Participation
A total of 297 participants registered for the i-vector
challenge. The participants represented 47 different countries,
and the greatest number of participants were from the USA
(67), China (36), Russia (21), and India (18). Of the registered
participants, 140 (~47%), representing 105 unique sites,
submitted at least one valid submission, nearly doubling the
number of sites in SRE12.
During the official scoring period challenge participants
submitted in excess of 8192 submissions. This number
exceeds the number of system submission in SRE12 by nearly
two orders of magnitude, which suggests that the i-vector
challenge was successful in reducing the barrier of
participation.
Table 1: A comparison of participation between
SRE12 and the i-vector challenge.
SRE12 i-vector 2014
# of Sites 58 105
# of New Sites 16 50
# of System Submissions 212 8192
Table 1 shows a comparison of SRE12 and the i-vector
challenge in terms of the number of sites, number of new sites,
and number of systems submitted. More information regarding
participation in the i-vector challenge, including affiliation
types and geographic information, can be found in [14].
7. Initial Results
What follows is an initial analysis of results focusing primarily
on the evaluation set. Initial results on the progress set can be
found in [14].
Figure 4: The minDCF for the ten top performing
systems.
Figure 4 shows the minDCF values on the progress set and
evaluation set for the baseline system as well as the best
performing systems (on the progress set) for the 10 leading
participants.
Male Female Pool Pool+X0
0.05
0.1
0.15
0.2
0.25
0.3
0.35
0.4
0.45
0.5
Trial type
min
DC
F 0.269 0.2650.278
0.226
0.405
0.474
0.442
0.386
Baseline
Oracle PLDA
0.2
0.24
0.28
0.32
0.36
0.4m
inD
CF
Top Performing Systems
System Performance on
Progress and Eval Sets
Progress Eval
Figure 5: A plot showing minDCF over time. The blue line shows the lowest minDCF on a given day on the progress
and the green line shows the same on the eval set. The red line shows the minDCF on the progress set for the
participant with the leading performance on the progress set at the end of the evaluation period.
0.386
0.326
0.310
0.294
0.276
0.271
0.252 0.246
0.348
0.314
0.2930.278
0.2670.258
0.241
0.285
0.2640.260
0.2470.241
0.2270.22
0.24
0.26
0.28
0.3
0.32
0.34
0.36
0.38
min
DC
F
Lowest minDCF Each Day vs Leading Final System Over Time(from 12-04-13 to of 04-07-14)
Progress Set Progress Set (Single System) Eval Set
0.224
229
At the end of the official scoring period, the baseline
system, with a minDCF value of 0.378, ranked 105th out of
140 (139 participants and 1 baseline system) on the eval set,
meaning approximately 75% of challenge participants
submitted a system that outperformed the baseline. The
leading system at the end of the evaluation period had a
minDCF value of 0.224, which represents an approximate
40% relative improvement over the baseline. The participant
with the 10th lowest minDCF had a value of .261, an
approximate 32% improvement over the baseline.
In Figure 5 we see the lowest minDCF value on the
progress set at any given time over all submitted systems,
along with the corresponding minDCF on the eval set. It is
interesting to note that these systems consistently exhibited
better performance on the eval set value than on the progress
set. Also in Figure 5 we see the minDCF value for the
participant submitting the system with the leading
performance on the progress set at the end of the evaluation
period. It is worth noting that the relative rate of performance
improvement decreased rapidly, with little improvement
observed after the evaluation had been running for 6 weeks.
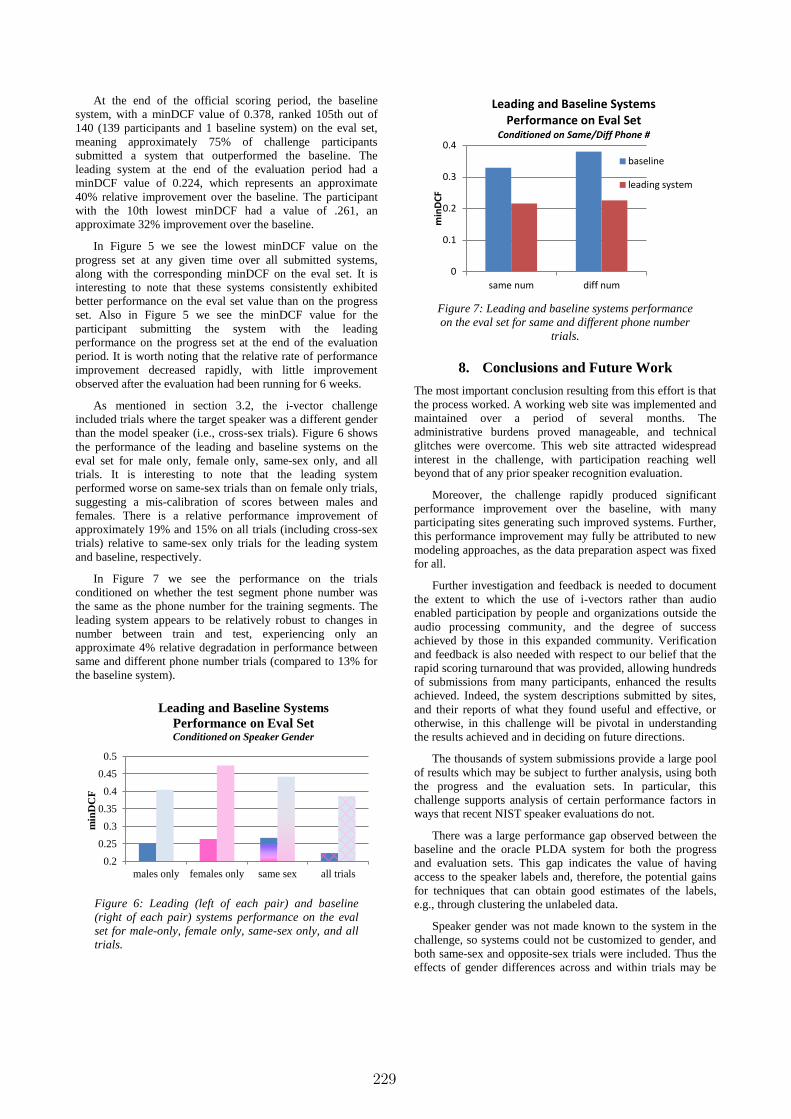
As mentioned in section 3.2, the i-vector challenge
included trials where the target speaker was a different gender
than the model speaker (i.e., cross-sex trials). Figure 6 shows
the performance of the leading and baseline systems on the
eval set for male only, female only, same-sex only, and all
trials. It is interesting to note that the leading system
performed worse on same-sex trials than on female only trials,
suggesting a mis-calibration of scores between males and
females. There is a relative performance improvement of
approximately 19% and 15% on all trials (including cross-sex
trials) relative to same-sex only trials for the leading system
and baseline, respectively.
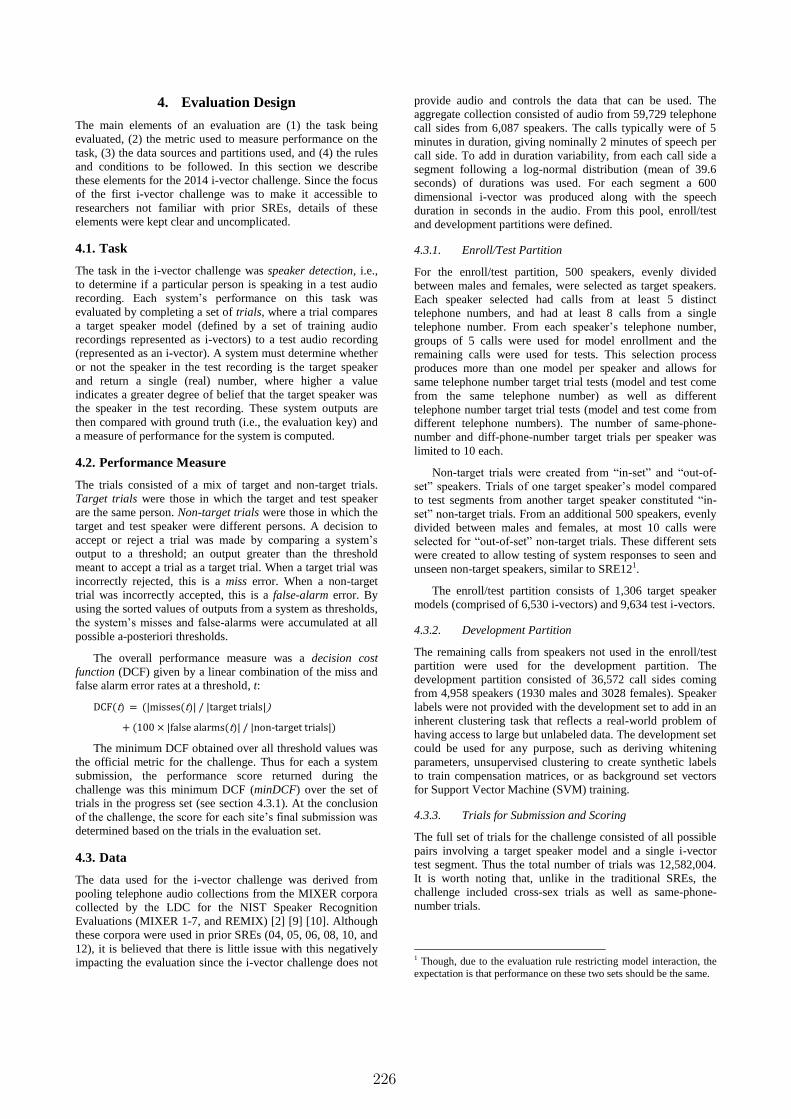
In Figure 7 we see the performance on the trials
conditioned on whether the test segment phone number was
the same as the phone number for the training segments. The
leading system appears to be relatively robust to changes in
number between train and test, experiencing only an
approximate 4% relative degradation in performance between
same and different phone number trials (compared to 13% for
the baseline system).
Figure 6: Leading (left of each pair) and baseline
(right of each pair) systems performance on the eval
set for male-only, female only, same-sex only, and all
trials.
Figure 7: Leading and baseline systems performance
on the eval set for same and different phone number
trials.
8. Conclusions and Future Work
The most important conclusion resulting from this effort is that
the process worked. A working web site was implemented and
maintained over a period of several months. The
administrative burdens proved manageable, and technical
glitches were overcome. This web site attracted widespread
interest in the challenge, with participation reaching well
beyond that of any prior speaker recognition evaluation.
Moreover, the challenge rapidly produced significant
performance improvement over the baseline, with many
participating sites generating such improved systems. Further,
this performance improvement may fully be attributed to new
modeling approaches, as the data preparation aspect was fixed
for all.
Further investigation and feedback is needed to document
the extent to which the use of i-vectors rather than audio
enabled participation by people and organizations outside the
audio processing community, and the degree of success
achieved by those in this expanded community. Verification
and feedback is also needed with respect to our belief that the
rapid scoring turnaround that was provided, allowing hundreds
of submissions from many participants, enhanced the results
achieved. Indeed, the system descriptions submitted by sites,
and their reports of what they found useful and effective, or
otherwise, in this challenge will be pivotal in understanding
the results achieved and in deciding on future directions.
The thousands of system submissions provide a large pool
of results which may be subject to further analysis, using both
the progress and the evaluation sets. In particular, this
challenge supports analysis of certain performance factors in
ways that recent NIST speaker evaluations do not.
There was a large performance gap observed between the
baseline and the oracle PLDA system for both the progress
and evaluation sets. This gap indicates the value of having
access to the speaker labels and, therefore, the potential gains
for techniques that can obtain good estimates of the labels,
e.g., through clustering the unlabeled data.
Speaker gender was not made known to the system in the
challenge, so systems could not be customized to gender, and
both same-sex and opposite-sex trials were included. Thus the
effects of gender differences across and within trials may be
0.2
0.25
0.3
0.35
0.4
0.45
0.5
males only females only same sex all trials
min
DC
F
Leading and Baseline Systems
Performance on Eval Set Conditioned on Speaker Gender
0
0.1
0.2
0.3
0.4
same num diff num
min
DC
F
Leading and Baseline Systems Performance on Eval Set
Conditioned on Same/Diff Phone #
baseline
leading system

230
studied further, and the possible existence of speakers who are
highly confusable with some of the opposite gender may be
investigated.
The inclusion for many target speakers of multiple models
involving different handsets, and of target trial segments
involving both the same and different handsets as the training,
will support investigation of the effects of such handset match
or non-match to a greater extent than in other recent
evaluations.
The chosen log-normal distribution of segment durations
will also allow investigation of the role of duration on
performance across a fairly broad range of values. The use of
such a range, rather than limiting duration to one or several
fixed values, perhaps represents a more realistic scenario for
some possible applications.
The i-vector challenge was the first NIST evaluation of
this technology area conducted entirely online. Several
enhancements were made to the platform during the evaluation
period, and more are planned, including putting performance
analysis tools on the platform for participant use. Further such
online challenges using data collected in the past are likely, as
they are more readily organized than traditional full-fledged
evaluations involving newly collected audio data.
But future full-fledged traditional evaluations with new
audio data will be affected as well. These will become
increasingly web-based, hopefully with simpler and more use-
friendly procedures for participant registration and data
distribution. The idea of two separate evaluation sets, one for
iterated use by sites in driving performance improvement,
while reserving the other for less frequent overall performance
evaluation with limited exposure, has some past history in
NIST evaluations of speech recognition (word recognition); it
may now see renewed use in speaker recognition and related
technology evaluation.
9. Disclaimer
These results are not to be construed or represented as
endorsements of any participant’s system, methods, or
commercial product, or as official findings on the part of NIST
or the U.S. Government.
Certain commercial equipment, instruments, software, or
materials are identified in this paper in order to specify the
experimental procedure adequately. Such identification is not
intended to imply recommendation or endorsement by NIST,
nor is it intended to imply that the equipment, instruments,
software or materials are necessarily the best available for the
purpose.
Lincoln Laboratory’s work was sponsored by the
Department of Defense under Air Force contract FA8721-05-
C-0002. Opinions, interpretations, conclusions, and
recommendations are those of the authors and are not
necessarily endorsed by the United States Government.
The work of T. Kinnunen was supported by Academy of
Finland (proj. no. 253120).
10. Bibliography
[1] NIST, "NIST SRE Homepage," [Online]. Available:
http://www.nist.gov/itl/iad/mig/sre.cfm.
[2] C. S. Greenberg and A. F. Martin, "The 2012 NIST
Speaker Recognition Evaluation," in Interspeech, Lyon,
France, 2013.
[3] NIST, "NIST i-vector Challenge Homepage," [Online].
Available: http://www.nist.gov/itl/iad/mig/ivec.cfm.
[4] N. Dehak, P. Kenny, R. Dehak, P. Dumouchel and P.
Ouellet, "Front-End Factor Analysis for Speaker
Verification," IEEE Transactions on Audio, Speech and
Language Processing, vol. 19, no. 4, pp. 788-798, 2011.
[5] D. Garcia-Romero and C. Y. Espy-Wilson, "Analysis of
i-vector Length Normalization in Speaker Recognition
Systems," in Interspeech, Florence, Italy, 2011.
[6] S. J. D. Prince, "Probabilistic Linear Discriminant
Analysis for Inferences About Identity," in IEEE 11th
International Conference on Computer Vision (ICCV),
Rio de Janeiro, Brazil, 2007.
[7] NIST, "NIST SRE12 Homepage," [Online]. Available:
http://www.nist.gov/itl/iad/mig/sre12.cfm.
[8] A. Martin, M. Przybocki and J. Campbell, "The NIST
Speaker Recognition Evaluation Program," in Biometric
Systems: Technology, Design, and Performance
Evaluation, London, Springer-Verlag, 2005.
[9] C. Cieri, L. Corson, D. Graff and K. Walke, "Resources
for New Research Directions in Speaker Recognition:
The Mixer 3, 4 and 5 Corpora," in Interspeech, Antwerp,
Belgium, 2007.
[10] L. Brandschain, C. Cieri, D. Graff, A. Neely and K.
Walker, "Speaker Recognition: Building the Mixer 4 and
5 Corpora," in LREC 2008: 7th International Conference
on Language Resources and Evaluation, Marrakech,
Morocco, 2008.
[11] A. McCree and D. Garcia-Romero, "Subspace-
Constrained Supervector PLDA for Speaker
Verification," in Interspeech, Lyon, France, 2013.
[12] P. Kenny, T. Stafylakis, P. Ouellet, M. J. Alam and P.
Dumouchel, "PLDA for speaker verification with
utterances of arbitrary duration," in International
Conference on Acoustics, Speech, and Signal Processing
(ICASSP), Vancouver, Canada, 2013.
[13] S. Cumani, O. Plchot and P. Laface, "Probabilistic linear
discriminant analysis of i–vector posterior distributions,"
in International Conference on Acoustics, Speech, and
Signal Processing (ICASSP), Vancouver, Canada, 2013.
[14] D. Bansé, G. R. Doddington, D. Garcia-Romero, J. J.
Godfrey, C. S. Greenberg, T. Kinnunen, A. F. Martin, A.
McCree, M. Przybocki and D. A. Reynolds, "Summary
and Initial Results of the 2013-2014 Speaker Recognition
i-vector Machine Learning Challenge," (submitted to)
Interspeech, Singapore, 2014.