the next generation in fl ow...
TRANSCRIPT
The next generation in fl ow cytometry
Attune NxT Flow Cytometer—expand your research capabilities with acoustic focusing technology
2
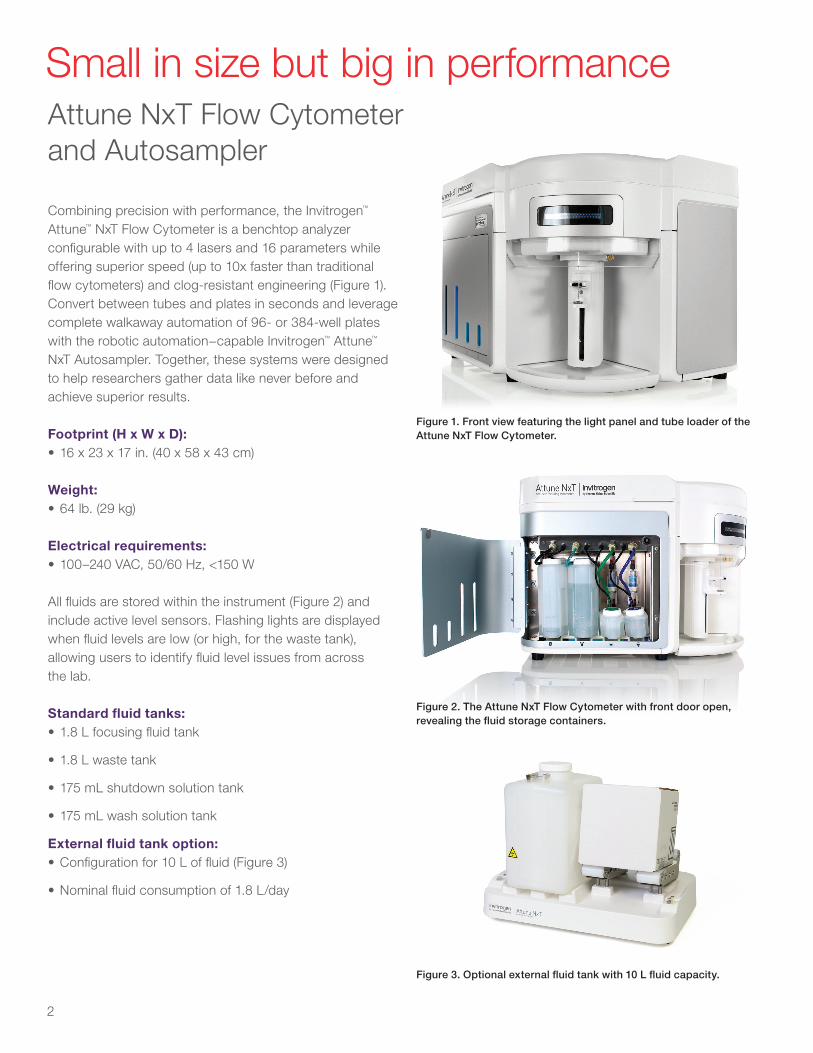
Combining precision with performance, the Invitrogen™
Attune™ NxT Flow Cytometer is a benchtop analyzer confi gurable with up to 4 lasers and 16 parameters while offering superior speed (up to 10x faster than traditional fl ow cytometers) and clog-resistant engineering (Figure 1). Convert between tubes and plates in seconds and leverage complete walkaway automation of 96- or 384-well plates with the robotic automation−capable Invitrogen™ Attune™
NxT Autosampler. Together, these systems were designed to help researchers gather data like never before and achieve superior results.
Footprint (H x W x D):• 16 x 23 x 17 in. (40 x 58 x 43 cm)
Weight:• 64 lb. (29 kg)
Electrical requirements:• 100–240 VAC, 50/60 Hz, <150 W
All fl uids are stored within the instrument (Figure 2) and include active level sensors. Flashing lights are displayed when fl uid levels are low (or high, for the waste tank), allowing users to identify fl uid level issues from across the lab.
Standard fl uid tanks:• 1.8 L focusing fl uid tank
• 1.8 L waste tank
• 175 mL shutdown solution tank
• 175 mL wash solution tank
External fl uid tank option:• Confi guration for 10 L of fl uid (Figure 3)
• Nominal fl uid consumption of 1.8 L/day
Small in size but big in performance
Figure 1. Front view featuring the light panel and tube loader of the Attune NxT Flow Cytometer.
Figure 2. The Attune NxT Flow Cytometer with front door open, revealing the fl uid storage containers.
Figure 3. Optional external fl uid tank with 10 L fl uid capacity.
Attune NxT Flow Cytometer and Autosampler
3
The Attune NxT Flow Cytometer enables higher sensitivity when you need it most. The system maintains precise alignment, thanks to the acoustic focusing, even at sample rates of up to 1,000 μL/min.
Data acquisition rateThe Attune NxT Flow Cytometer is designed to acquire data at up to 35,000 events/second.
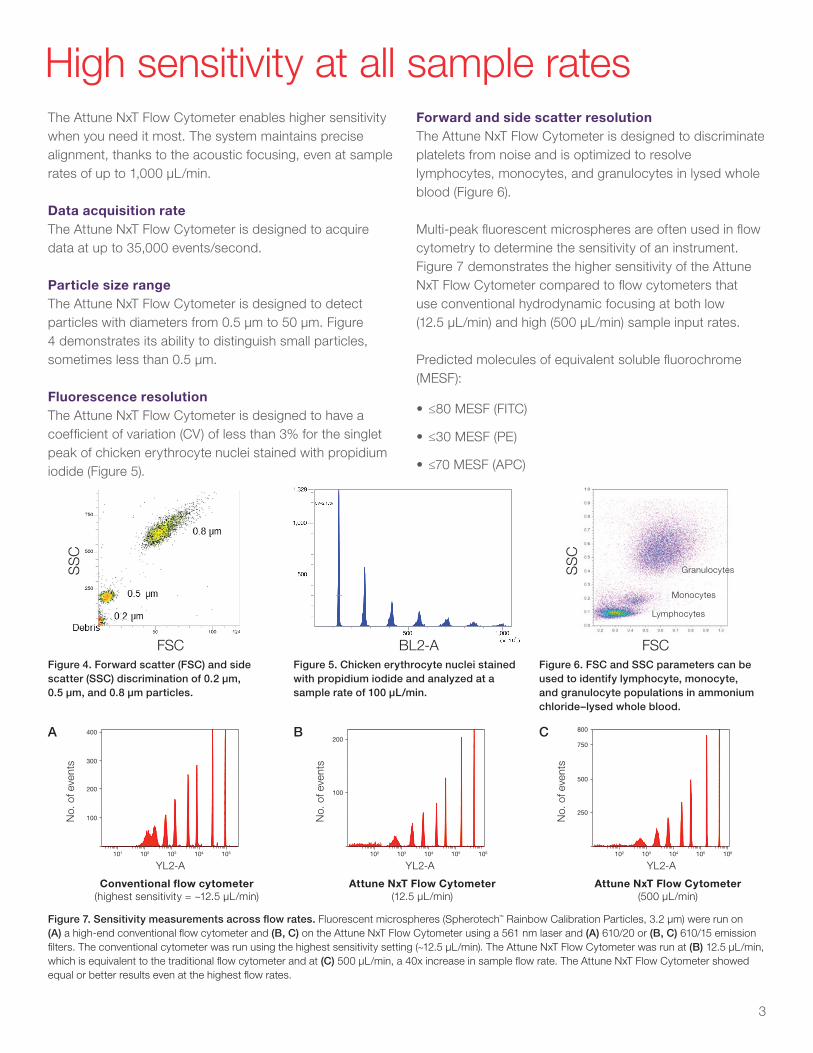
Particle size rangeThe Attune NxT Flow Cytometer is designed to detect particles with diameters from 0.5 µm to 50 µm. Figure 4 demonstrates its ability to distinguish small particles, sometimes less than 0.5 µm.
Fluorescence resolutionThe Attune NxT Flow Cytometer is designed to have a coefficient of variation (CV) of less than 3% for the singlet peak of chicken erythrocyte nuclei stained with propidium iodide (Figure 5).
High sensitivity at all sample rates
Figure 7. Sensitivity measurements across flow rates. Fluorescent microspheres (Spherotech™ Rainbow Calibration Particles, 3.2 μm) were run on (A) a high-end conventional flow cytometer and (B, C) on the Attune NxT Flow Cytometer using a 561 nm laser and (A) 610/20 or (B, C) 610/15 emission filters. The conventional cytometer was run using the highest sensitivity setting (~12.5 μL/min). The Attune NxT Flow Cytometer was run at (B) 12.5 μL/min, which is equivalent to the traditional flow cytometer and at (C) 500 μL/min, a 40x increase in sample flow rate. The Attune NxT Flow Cytometer showed equal or better results even at the highest flow rates.
Attune NxT Flow Cytometer(500 μL/min)
Conventional flow cytometer(highest sensitivity = ~12.5 μL/min)
A B C
Attune NxT Flow Cytometer(12.5 μL/min)
YL2-A YL2-A YL2-A
No.
of e
vent
s
No.
of e
vent
s
No.
of e
vent
s
Figure 4. Forward scatter (FSC) and side scatter (SSC) discrimination of 0.2 µm, 0.5 µm, and 0.8 µm particles.
Figure 5. Chicken erythrocyte nuclei stained with propidium iodide and analyzed at a sample rate of 100 µL/min.
Figure 6. FSC and SSC parameters can be used to identify lymphocyte, monocyte, and granulocyte populations in ammonium chloride–lysed whole blood.
SS
C
Lymphocytes
Monocytes
Granulocytes
Forward and side scatter resolutionThe Attune NxT Flow Cytometer is designed to discriminate platelets from noise and is optimized to resolve lymphocytes, monocytes, and granulocytes in lysed whole blood (Figure 6).
Multi-peak fluorescent microspheres are often used in flow cytometry to determine the sensitivity of an instrument. Figure 7 demonstrates the higher sensitivity of the Attune NxT Flow Cytometer compared to flow cytometers that use conventional hydrodynamic focusing at both low (12.5 µL/min) and high (500 µL/min) sample input rates.
Predicted molecules of equivalent soluble fluorochrome (MESF):
• ≤80 MESF (FITC)
• ≤30 MESF (PE)
• ≤70 MESF (APC)
No.
of e
vent
s
101 102 103 104 105 102 102 103 104 105 106103 104 105 106
YL2-A
No.
of e
vent
s
100
100
250
500
750
800
200
200
300
400
YL2-A
No.
of e
vent
s
YL2-A
No.
of e
vent
s
101 102 103 104 105 102 102 103 104 105 106103 104 105 106
YL2-A
No.
of e
vent
s
100
100
250
500
750
800
200
200
300
400
YL2-A
No.
of e
vent
s
YL2-A
No.
of e
vent
s
101 102 103 104 105 102 102 103 104 105 106103 104 105 106
YL2-A
No.
of e
vent
s
100
100
250
500
750
800
200
200
300
400
YL2-A
No.
of e
vent
s
YL2-A
FSC BL2-A FSC
SS
C
4
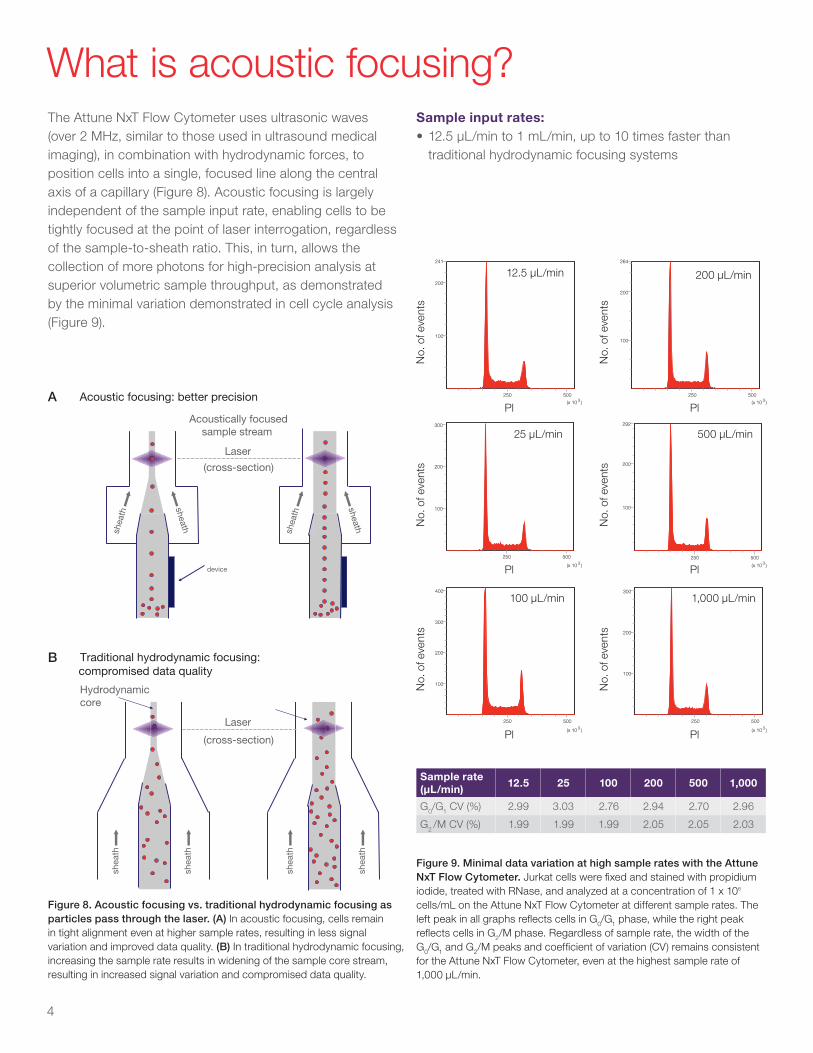
The Attune NxT Flow Cytometer uses ultrasonic waves (over 2 MHz, similar to those used in ultrasound medical imaging), in combination with hydrodynamic forces, to position cells into a single, focused line along the central axis of a capillary (Figure 8). Acoustic focusing is largely independent of the sample input rate, enabling cells to be tightly focused at the point of laser interrogation, regardless of the sample-to-sheath ratio. This, in turn, allows the collection of more photons for high-precision analysis at superior volumetric sample throughput, as demonstrated by the minimal variation demonstrated in cell cycle analysis (Figure 9).
What is acoustic focusing?
Hydrodynamiccore
Laser
(cross-section)
shea
th
shea
th
shea
th
shea
th
B. Traditional hydrodynamic focusing: compromised data quality
device
shea
th sheath
sheath
Acoustically focusedsample stream
Laser
(cross-section)
A. Acoustic focusing: better precision
shea
th
Figure 8. Acoustic focusing vs. traditional hydrodynamic focusing as particles pass through the laser. (A) In acoustic focusing, cells remain in tight alignment even at higher sample rates, resulting in less signal variation and improved data quality. (B) In traditional hydrodynamic focusing, increasing the sample rate results in widening of the sample core stream, resulting in increased signal variation and compromised data quality.
Figure 9. Minimal data variation at high sample rates with the Attune NxT Flow Cytometer. Jurkat cells were fi xed and stained with propidium iodide, treated with RNase, and analyzed at a concentration of 1 x 10⁶ cells/mL on the Attune NxT Flow Cytometer at different sample rates. The left peak in all graphs refl ects cells in G0/G1 phase, while the right peak refl ects cells in G2/M phase. Regardless of sample rate, the width of the G0/G1 and G2/M peaks and coeffi cient of variation (CV) remains consistent for the Attune NxT Flow Cytometer, even at the highest sample rate of 1,000 μL/min.
Sample rate (μL/min)
12.5 25 100 200 500 1,000
G0/G1 CV (%) 2.99 3.03 2.76 2.94 2.70 2.96
G2 /M CV (%) 1.99 1.99 1.99 2.05 2.05 2.03
A
B
Sample input rates:• 12.5 µL/min to 1 mL/min, up to 10 times faster than
traditional hydrodynamic focusing systems
250 500
100
200
241
µ
250 500
100
200
300
µ
250 500
100
200
300
400
µ
250 500
(x 10 )3 (x 10 )3
100
200
264
µ
250 500
100
200
292
µ
250 500
100
200
300
µ
Pl Pl
Pl Pl
Pl Pl
No.
of e
vent
sN
o. o
f eve
nts
No.
of e
vent
s
No.
of e
vent
sN
o. o
f eve
nts
No.
of e
vent
s
12.5 L/min 200 L/min
(x 10 )3 (x 10 )3
(x 10 )3 (x 10 )3
5
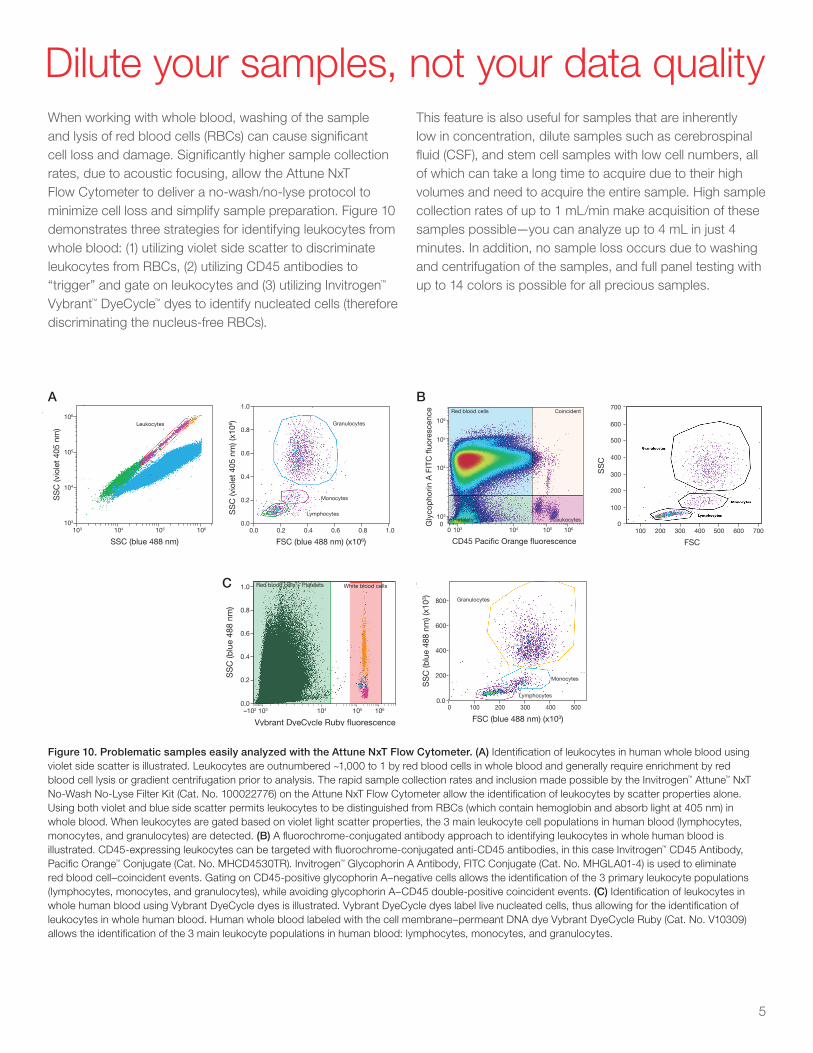
When working with whole blood, washing of the sample and lysis of red blood cells (RBCs) can cause signifi cant cell loss and damage. Signifi cantly higher sample collection rates, due to acoustic focusing, allow the Attune NxT Flow Cytometer to deliver a no-wash/no-lyse protocol to minimize cell loss and simplify sample preparation. Figure 10 demonstrates three strategies for identifying leukocytes from whole blood: (1) utilizing violet side scatter to discriminate leukocytes from RBCs, (2) utilizing CD45 antibodies to “trigger” and gate on leukocytes and (3) utilizing Invitrogen™
Vybrant™ DyeCycle™ dyes to identify nucleated cells (therefore discriminating the nucleus-free RBCs).
Dilute your samples, not your data quality
A
C
B
This feature is also useful for samples that are inherently low in concentration, dilute samples such as cerebrospinal fl uid (CSF), and stem cell samples with low cell numbers, all of which can take a long time to acquire due to their high volumes and need to acquire the entire sample. High sample collection rates of up to 1 mL/min make acquisition of these samples possible—you can analyze up to 4 mL in just 4 minutes. In addition, no sample loss occurs due to washing and centrifugation of the samples, and full panel testing with up to 14 colors is possible for all precious samples.
FSC (blue 488 nm) (x106)
SS
C (v
iole
t 40
5 nm
) (x1
06 )
0.00.0 0.2 0.4 0.6 0.8 1.0
0.2
0.4
0.6
1.0
0.8Granulocytes
Monocytes
Lymphocytes
E106
105
104
103
103 104 105 106
SSC (blue 488 nm)
SS
C (v
iole
t 40
5 nm
)
D
CD45 Paci�c Orange™ �uorescence
Gly
cop
horin
A F
ITC
�uo
resc
ence
0 103 105 1061040
103
104
105
106
Coincident
Leukocytes
Leukocytes
Red blood cells
Platelets
C
FSC (blue 488 nm) (x106)
SS
C (v
iole
t 40
5 nm
) (x1
06 )
0.00.0
0.2 0.4 0.6 0.8 1.0
0.2
0.4
0.6
1.0
0.8
B
FSC (blue 488 nm) (x106)
SS
C (b
lue
488
nm) (
x106 )
0.0 0.2 0.4 0.6 0.8 1.00.0
0.2
0.4
0.6
1.0
0.8
A
FSC (blue 488 nm) (x106)
SS
C (v
iole
t 40
5 nm
) (x1
06 )
0.00.0 0.2 0.4 0.6 0.8 1.0
0.2
0.4
0.6
1.0
0.8Granulocytes
Monocytes
Lymphocytes
CD45 Pacific Orange fluorescence
Gly
cop
horin
A F
ITC
�uo
resc
ence
0 103 105 1061040
103
104
105
106
Coincident
Leukocytes
Red blood cells
Platelets
SS
C
FSC
7006005004003002001000
100
200
300
400
500
600
700
Vybrant DyeCycle Ruby fluorescence
SS
C (b
lue
488
nm)
–102 103 105 1061040.0
0.2
0.4
0.6
1.0
0.8
Red blood cells + Platelets White blood cells C
FSC (blue 488 nm) (x103)
SS
C (b
lue
488
nm) (
x103 )
0.0
200
400
600
800
0 100 200 300 400 500
Granulocytes
Monocytes
Lymphocytes
B
Figure 10. Problematic samples easily analyzed with the Attune NxT Flow Cytometer. (A) Identifi cation of leukocytes in human whole blood using violet side scatter is illustrated. Leukocytes are outnumbered ~1,000 to 1 by red blood cells in whole blood and generally require enrichment by red blood cell lysis or gradient centrifugation prior to analysis. The rapid sample collection rates and inclusion made possible by the Invitrogen™ Attune™ NxT No-Wash No-Lyse Filter Kit (Cat. No. 100022776) on the Attune NxT Flow Cytometer allow the identifi cation of leukocytes by scatter properties alone. Using both violet and blue side scatter permits leukocytes to be distinguished from RBCs (which contain hemoglobin and absorb light at 405 nm) in whole blood. When leukocytes are gated based on violet light scatter properties, the 3 main leukocyte cell populations in human blood (lymphocytes, monocytes, and granulocytes) are detected. (B) A fl uorochrome-conjugated antibody approach to identifying leukocytes in whole human blood is illustrated. CD45-expressing leukocytes can be targeted with fl uorochrome-conjugated anti-CD45 antibodies, in this case Invitrogen™ CD45 Antibody, Pacifi c Orange™ Conjugate (Cat. No. MHCD4530TR). Invitrogen™ Glycophorin A Antibody, FITC Conjugate (Cat. No. MHGLA01-4) is used to eliminate red blood cell–coincident events. Gating on CD45-positive glycophorin A–negative cells allows the identifi cation of the 3 primary leukocyte populations (lymphocytes, monocytes, and granulocytes), while avoiding glycophorin A–CD45 double-positive coincident events. (C) Identifi cation of leukocytes in whole human blood using Vybrant DyeCycle dyes is illustrated. Vybrant DyeCycle dyes label live nucleated cells, thus allowing for the identifi cation of leukocytes in whole human blood. Human whole blood labeled with the cell membrane–permeant DNA dye Vybrant DyeCycle Ruby (Cat. No. V10309) allows the identifi cation of the 3 main leukocyte populations in human blood: lymphocytes, monocytes, and granulocytes.
6
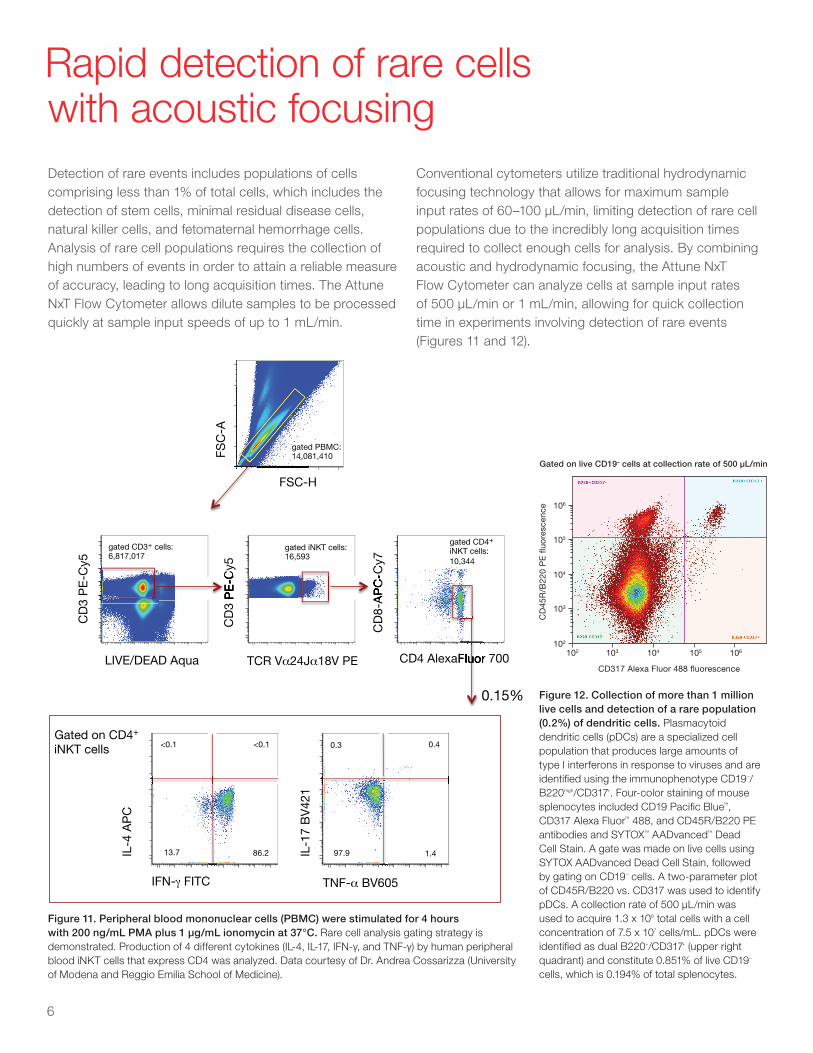
Detection of rare events includes populations of cells comprising less than 1% of total cells, which includes the detection of stem cells, minimal residual disease cells, natural killer cells, and fetomaternal hemorrhage cells. Analysis of rare cell populations requires the collection of high numbers of events in order to attain a reliable measure of accuracy, leading to long acquisition times. The Attune NxT Flow Cytometer allows dilute samples to be processed quickly at sample input speeds of up to 1 mL/min.
Rapid detection of rare cells with acoustic focusing
Conventional cytometers utilize traditional hydrodynamic focusing technology that allows for maximum sample input rates of 60–100 µL/min, limiting detection of rare cell populations due to the incredibly long acquisition times required to collect enough cells for analysis. By combining acoustic and hydrodynamic focusing, the Attune NxT Flow Cytometer can analyze cells at sample input rates of 500 µL/min or 1 mL/min, allowing for quick collection time in experiments involving detection of rare events (Figures 11 and 12).
Figure 11. Peripheral blood mononuclear cells (PBMC) were stimulated for 4 hours with 200 ng/mL PMA plus 1 µg/mL ionomycin at 37°C. Rare cell analysis gating strategy is demonstrated. Production of 4 different cytokines (IL-4, IL-17, IFN-γ, and TNF-γ) by human peripheral blood iNKT cells that express CD4 was analyzed. Data courtesy of Dr. Andrea Cossarizza (University of Modena and Reggio Emilia School of Medicine).
FSC-H
FSC
-A
Gated on CD4+
iNKT cells
IFN-γ FITC
IL-4
AP
C
TNF-α BV605
IL-1
7 B
V42
1
LIVE/DEAD Aqua
CD
3 P
E-C
y5
CD
3 P
E-C
y5
TCR Vα24Jα18V PE CD4 AlexaFluor 700
CD
8-A
PC
-Cy7
gated PBMC:14,081,410
gated CD3+ cells:6,817,017
gated iNKT cells:16,593
gated CD4+
iNKT cells:10,344
<0.1 <0.1
13.7 86.2
0.3 0.4
97.9 1.4
CD
3 P
E-C
CD
8-A
PC
-C
Fluor
0.15% Figure 12. Collection of more than 1 million live cells and detection of a rare population (0.2%) of dendritic cells. Plasmacytoid dendritic cells (pDCs) are a specialized cell population that produces large amounts of type I interferons in response to viruses and are identifi ed using the immunophenotype CD19–/B220high/CD317+. Four-color staining of mouse splenocytes included CD19 Pacifi c Blue™, CD317 Alexa Fluor™ 488, and CD45R/B220 PE antibodies and SYTOX™ AADvanced™ Dead Cell Stain. A gate was made on live cells using SYTOX AADvanced Dead Cell Stain, followed by gating on CD19– cells. A two-parameter plot of CD45R/B220 vs. CD317 was used to identify pDCs. A collection rate of 500 μL/min was used to acquire 1.3 x 10⁶ total cells with a cell concentration of 7.5 x 10⁷ cells/mL. pDCs were identifi ed as dual B220+/CD317+ (upper right quadrant) and constitute 0.851% of live CD19– cells, which is 0.194% of total splenocytes.
CD317 Alexa Fluor 488 �uorescence
102 103 104 105 106
Gated on live CD19– cells at collection rate of 500 µL/min
CD
45R
/B22
0 P
E �
uore
scen
ce 106
105
104
103
102
7
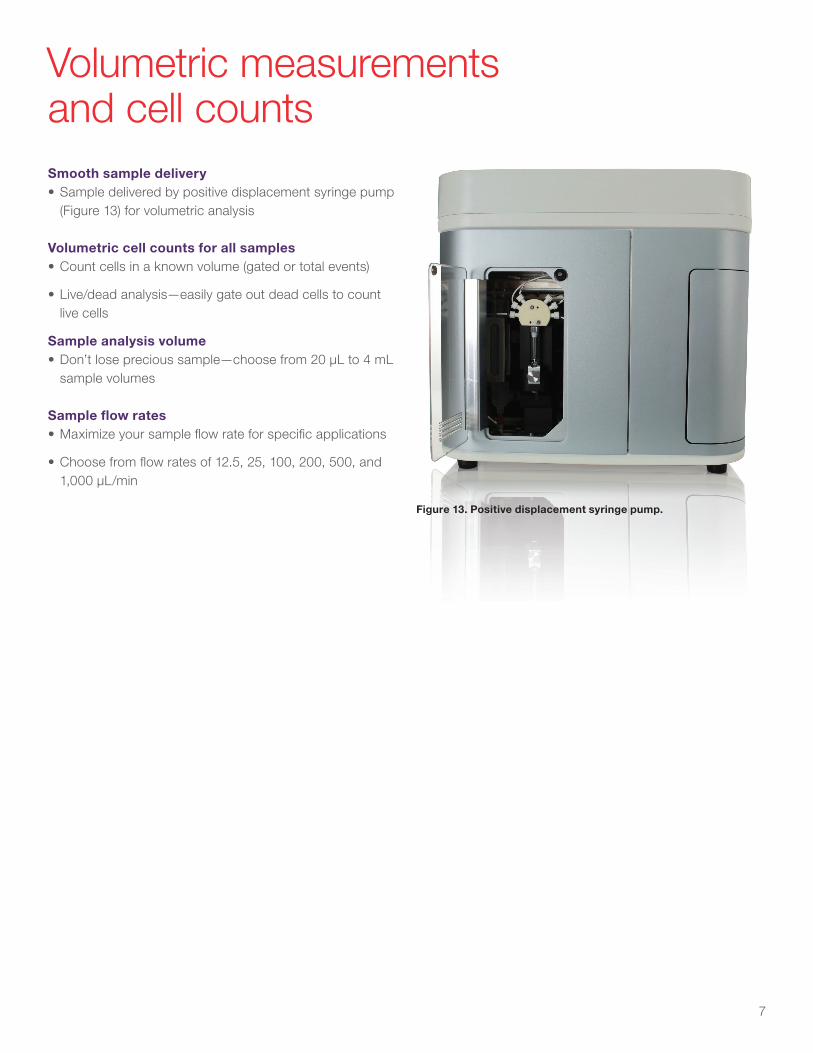
Smooth sample delivery• Sample delivered by positive displacement syringe pump
(Figure 13) for volumetric analysis
Volumetric cell counts for all samples• Count cells in a known volume (gated or total events)
• Live/dead analysis—easily gate out dead cells to count live cells
Sample analysis volume• Don’t lose precious sample—choose from 20 μL to 4 mL
sample volumes
Sample fl ow rates• Maximize your sample fl ow rate for specifi c applications
• Choose from fl ow rates of 12.5, 25, 100, 200, 500, and 1,000 μL/min
Volumetric measurements and cell counts
Figure 13. Positive displacement syringe pump.
8
Flow that fits: modular design configurable to your needs and budget
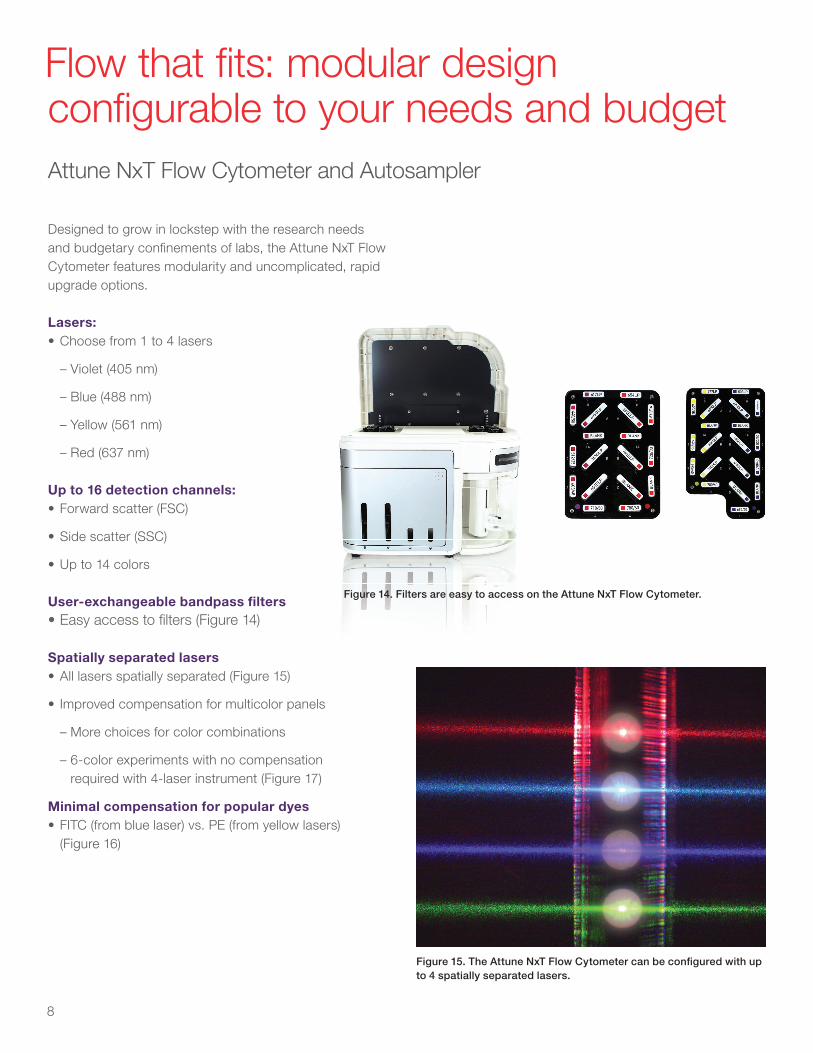
Figure 14. Filters are easy to access on the Attune NxT Flow Cytometer.
Figure 15. The Attune NxT Flow Cytometer can be confi gured with up to 4 spatially separated lasers.
Designed to grow in lockstep with the research needs and budgetary confi nements of labs, the Attune NxT Flow Cytometer features modularity and uncomplicated, rapid upgrade options.
Lasers:• Choose from 1 to 4 lasers
– Violet (405 nm)
– Blue (488 nm)
– Yellow (561 nm)
– Red (637 nm)
Up to 16 detection channels: • Forward scatter (FSC)
• Side scatter (SSC)
• Up to 14 colors
User-exchangeable bandpass fi lters• Easy access to fi lters (Figure 14)
Spatially separated lasers• All lasers spatially separated (Figure 15)
• Improved compensation for multicolor panels
– More choices for color combinations
– 6-color experiments with no compensation required with 4-laser instrument (Figure 17)
Minimal compensation for popular dyes• FITC (from blue laser) vs. PE (from yellow lasers)
(Figure 16)
Attune NxT Flow Cytometer and Autosampler
9
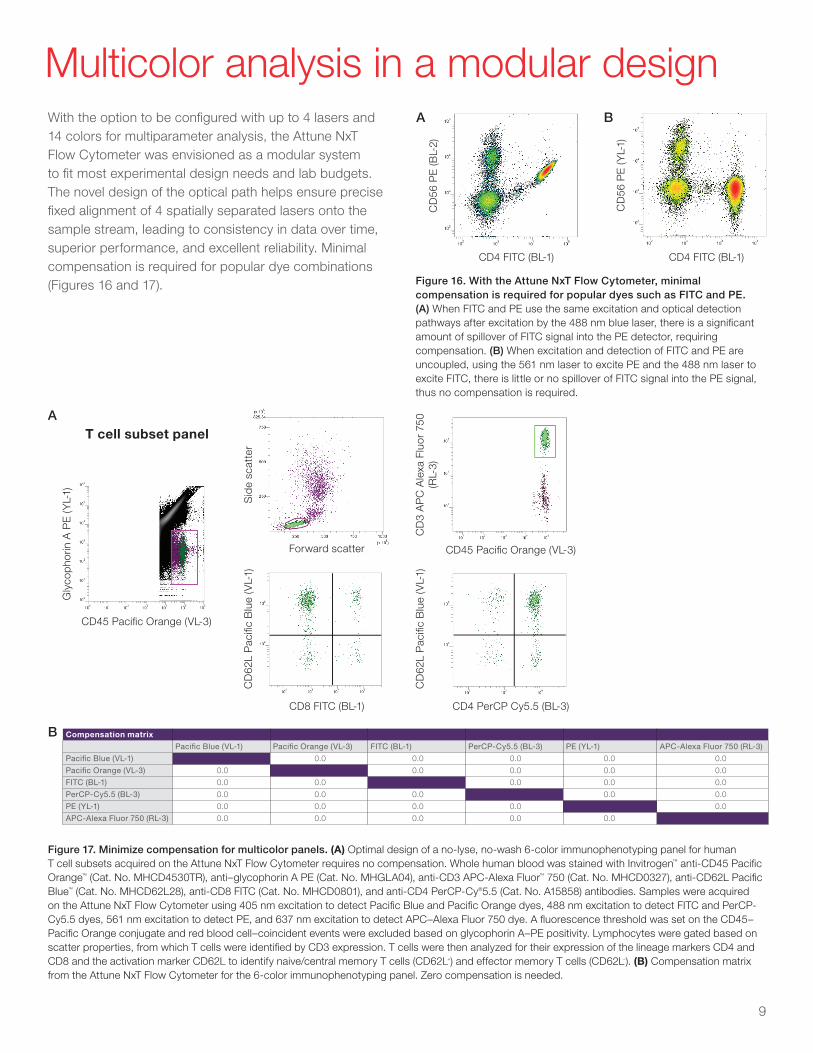
With the option to be configured with up to 4 lasers and 14 colors for multiparameter analysis, the Attune NxT Flow Cytometer was envisioned as a modular system to fit most experimental design needs and lab budgets. The novel design of the optical path helps ensure precise fixed alignment of 4 spatially separated lasers onto the sample stream, leading to consistency in data over time, superior performance, and excellent reliability. Minimal compensation is required for popular dye combinations (Figures 16 and 17).
Multicolor analysis in a modular design
Figure 16. With the Attune NxT Flow Cytometer, minimal compensation is required for popular dyes such as FITC and PE. (A) When FITC and PE use the same excitation and optical detection pathways after excitation by the 488 nm blue laser, there is a significant amount of spillover of FITC signal into the PE detector, requiring compensation. (B) When excitation and detection of FITC and PE are uncoupled, using the 561 nm laser to excite PE and the 488 nm laser to excite FITC, there is little or no spillover of FITC signal into the PE signal, thus no compensation is required.
CD4 FITC (BL-1)
CD
56 P
E (B
L-2)
CD4 FITC (BL-1)
CD
56 P
E (Y
L-1)
Figure 17. Minimize compensation for multicolor panels. (A) Optimal design of a no-lyse, no-wash 6-color immunophenotyping panel for human T cell subsets acquired on the Attune NxT Flow Cytometer requires no compensation. Whole human blood was stained with Invitrogen™ anti-CD45 Pacific Orange™ (Cat. No. MHCD4530TR), anti–glycophorin A PE (Cat. No. MHGLA04), anti-CD3 APC-Alexa Fluor™ 750 (Cat. No. MHCD0327), anti-CD62L Pacific Blue™ (Cat. No. MHCD62L28), anti-CD8 FITC (Cat. No. MHCD0801), and anti-CD4 PerCP-Cy®5.5 (Cat. No. A15858) antibodies. Samples were acquired on the Attune NxT Flow Cytometer using 405 nm excitation to detect Pacific Blue and Pacific Orange dyes, 488 nm excitation to detect FITC and PerCP-Cy5.5 dyes, 561 nm excitation to detect PE, and 637 nm excitation to detect APC–Alexa Fluor 750 dye. A fluorescence threshold was set on the CD45–Pacific Orange conjugate and red blood cell–coincident events were excluded based on glycophorin A–PE positivity. Lymphocytes were gated based on scatter properties, from which T cells were identified by CD3 expression. T cells were then analyzed for their expression of the lineage markers CD4 and CD8 and the activation marker CD62L to identify naive/central memory T cells (CD62L+) and effector memory T cells (CD62L–). (B) Compensation matrix from the Attune NxT Flow Cytometer for the 6-color immunophenotyping panel. Zero compensation is needed.
CD45 Pacific Orange (VL-3)
Gly
cop
horin
A P
E (Y
L-1)
Forward scatter
CD8 FITC (BL-1)
Sid
e sc
atte
r
CD45 Pacific Orange (VL-3)
CD
3 A
PC
Ale
xa F
luor
750
(R
L-3)
CD4 PerCP Cy5.5 (BL-3)
CD
62L
Pac
ific
Blu
e (V
L-1)
CD
62L
Pac
ific
Blu
e (V
L-1)
T cell subset panel
A B
A
B Compensation matrix
Pacific Blue (VL-1) Pacific Orange (VL-3) FITC (BL-1) PerCP-Cy5.5 (BL-3) PE (YL-1) APC-Alexa Fluor 750 (RL-3)
Pacific Blue (VL-1) 0.0 0.0 0.0 0.0 0.0
Pacific Orange (VL-3) 0.0 0.0 0.0 0.0 0.0
FITC (BL-1) 0.0 0.0 0.0 0.0 0.0
PerCP-Cy5.5 (BL-3) 0.0 0.0 0.0 0.0 0.0
PE (YL-1) 0.0 0.0 0.0 0.0 0.0
APC-Alexa Fluor 750 (RL-3) 0.0 0.0 0.0 0.0 0.0
10
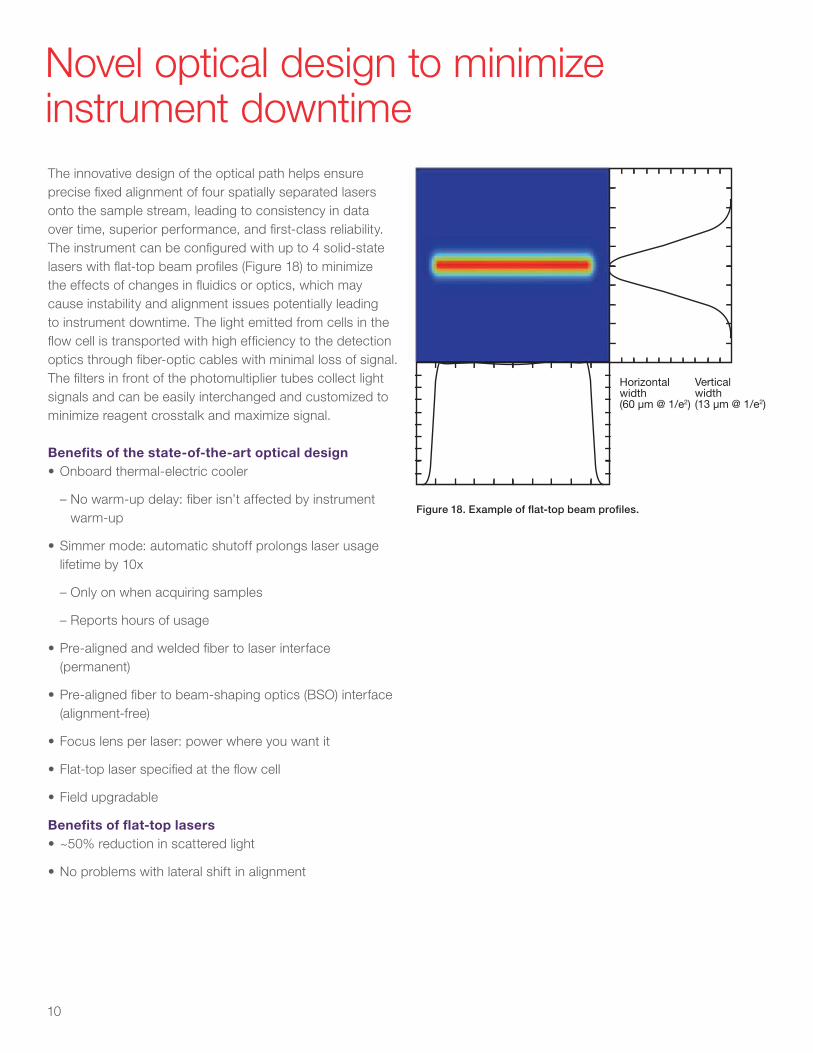
The innovative design of the optical path helps ensure precise fixed alignment of four spatially separated lasers onto the sample stream, leading to consistency in data over time, superior performance, and first-class reliability. The instrument can be configured with up to 4 solid-state lasers with flat-top beam profiles (Figure 18) to minimize the effects of changes in fluidics or optics, which may cause instability and alignment issues potentially leading to instrument downtime. The light emitted from cells in the flow cell is transported with high efficiency to the detection optics through fiber-optic cables with minimal loss of signal. The filters in front of the photomultiplier tubes collect light signals and can be easily interchanged and customized to minimize reagent crosstalk and maximize signal.
Benefits of the state-of-the-art optical design• Onboard thermal-electric cooler
– No warm-up delay: fiber isn’t affected by instrument warm-up
• Simmer mode: automatic shutoff prolongs laser usage lifetime by 10x
– Only on when acquiring samples
– Reports hours of usage
• Pre-aligned and welded fiber to laser interface (permanent)
• Pre-aligned fiber to beam-shaping optics (BSO) interface (alignment-free)
• Focus lens per laser: power where you want it
• Flat-top laser specified at the flow cell
• Field upgradable
Benefits of flat-top lasers• ~50% reduction in scattered light
• No problems with lateral shift in alignment
Novel optical design to minimize instrument downtime
Horizontalwidth(60 µm @ 1/e2)
Verticalwidth(13 µm @ 1/e2)
Figure 18. Example of flat-top beam profiles.
11
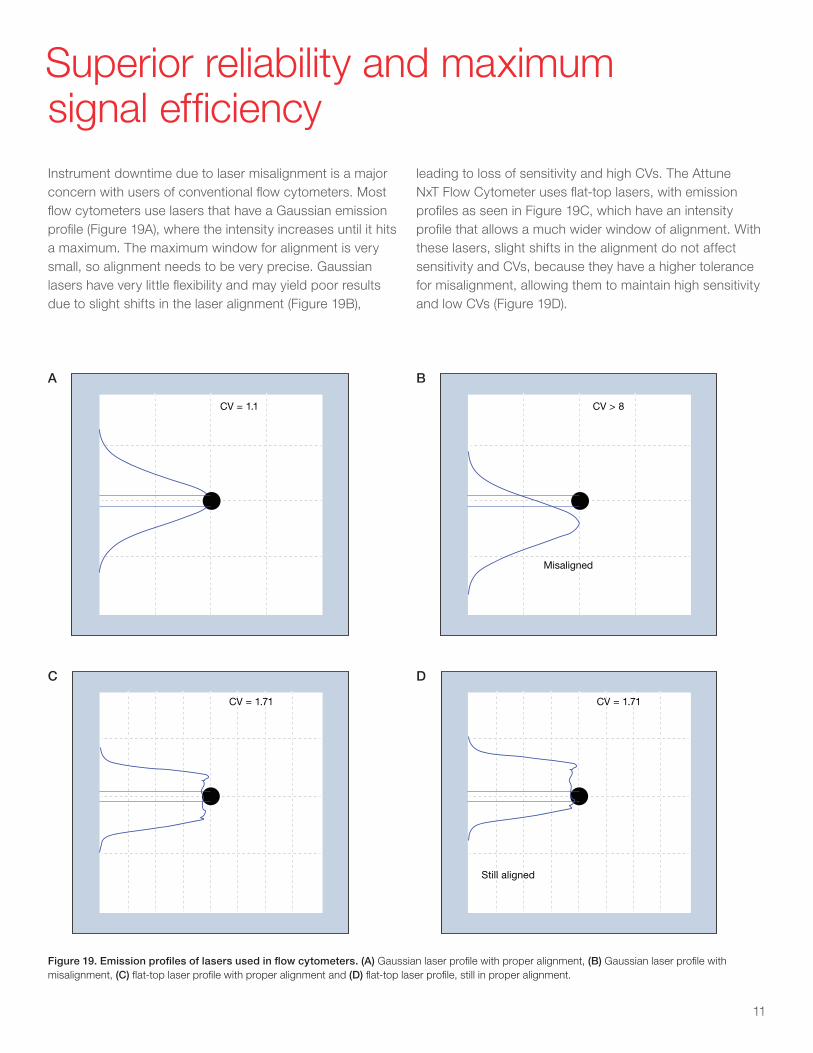
Instrument downtime due to laser misalignment is a major concern with users of conventional flow cytometers. Most flow cytometers use lasers that have a Gaussian emission profile (Figure 19A), where the intensity increases until it hits a maximum. The maximum window for alignment is very small, so alignment needs to be very precise. Gaussian lasers have very little flexibility and may yield poor results due to slight shifts in the laser alignment (Figure 19B),
leading to loss of sensitivity and high CVs. The Attune NxT Flow Cytometer uses flat-top lasers, with emission profiles as seen in Figure 19C, which have an intensity profile that allows a much wider window of alignment. With these lasers, slight shifts in the alignment do not affect sensitivity and CVs, because they have a higher tolerance for misalignment, allowing them to maintain high sensitivity and low CVs (Figure 19D).
Superior reliability and maximum signal efficiency
CV = 1.71
CV = 1.1
CV = 1.71
Still aligned
Misaligned
CV > 8
Figure 19. Emission profiles of lasers used in flow cytometers. (A) Gaussian laser profile with proper alignment, (B) Gaussian laser profile with misalignment, (C) flat-top laser profile with proper alignment and (D) flat-top laser profile, still in proper alignment.
A
C
B
D
12
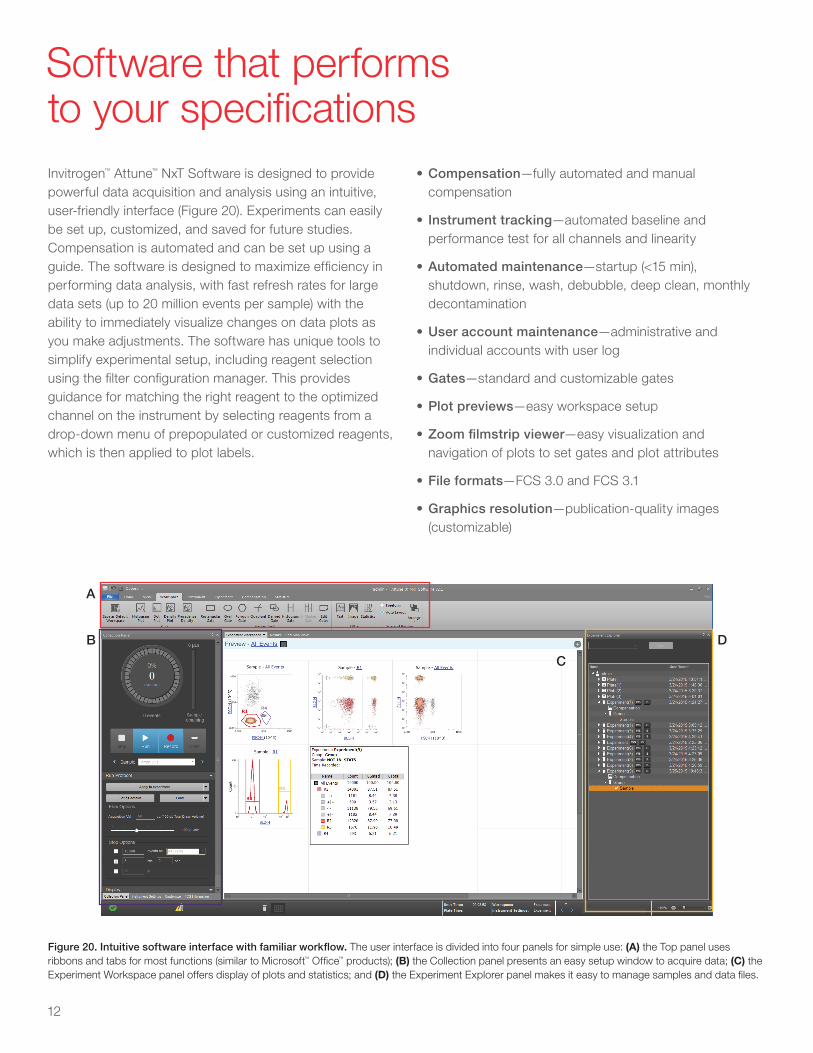
Invitrogen™ Attune™ NxT Software is designed to provide powerful data acquisition and analysis using an intuitive, user-friendly interface (Figure 20). Experiments can easily be set up, customized, and saved for future studies. Compensation is automated and can be set up using a guide. The software is designed to maximize effi ciency in performing data analysis, with fast refresh rates for large data sets (up to 20 million events per sample) with the ability to immediately visualize changes on data plots as you make adjustments. The software has unique tools to simplify experimental setup, including reagent selection using the fi lter confi guration manager. This provides guidance for matching the right reagent to the optimized channel on the instrument by selecting reagents from a drop-down menu of prepopulated or customized reagents, which is then applied to plot labels.
• Compensation—fully automated and manual compensation
• Instrument tracking—automated baseline and performance test for all channels and linearity
• Automated maintenance—startup (<15 min), shutdown, rinse, wash, debubble, deep clean, monthly decontamination
• User account maintenance—administrative and individual accounts with user log
• Gates—standard and customizable gates
• Plot previews—easy workspace setup
• Zoom fi lmstrip viewer—easy visualization and navigation of plots to set gates and plot attributes
• File formats—FCS 3.0 and FCS 3.1
• Graphics resolution—publication-quality images (customizable)
Software that performs to your specifications
Figure 20. Intuitive software interface with familiar workfl ow. The user interface is divided into four panels for simple use: (A) the Top panel uses ribbons and tabs for most functions (similar to Microsoft™ Offi ce™ products); (B) the Collection panel presents an easy setup window to acquire data; (C) the Experiment Workspace panel offers display of plots and statistics; and (D) the Experiment Explorer panel makes it easy to manage samples and data fi les.
A
C
B D
13
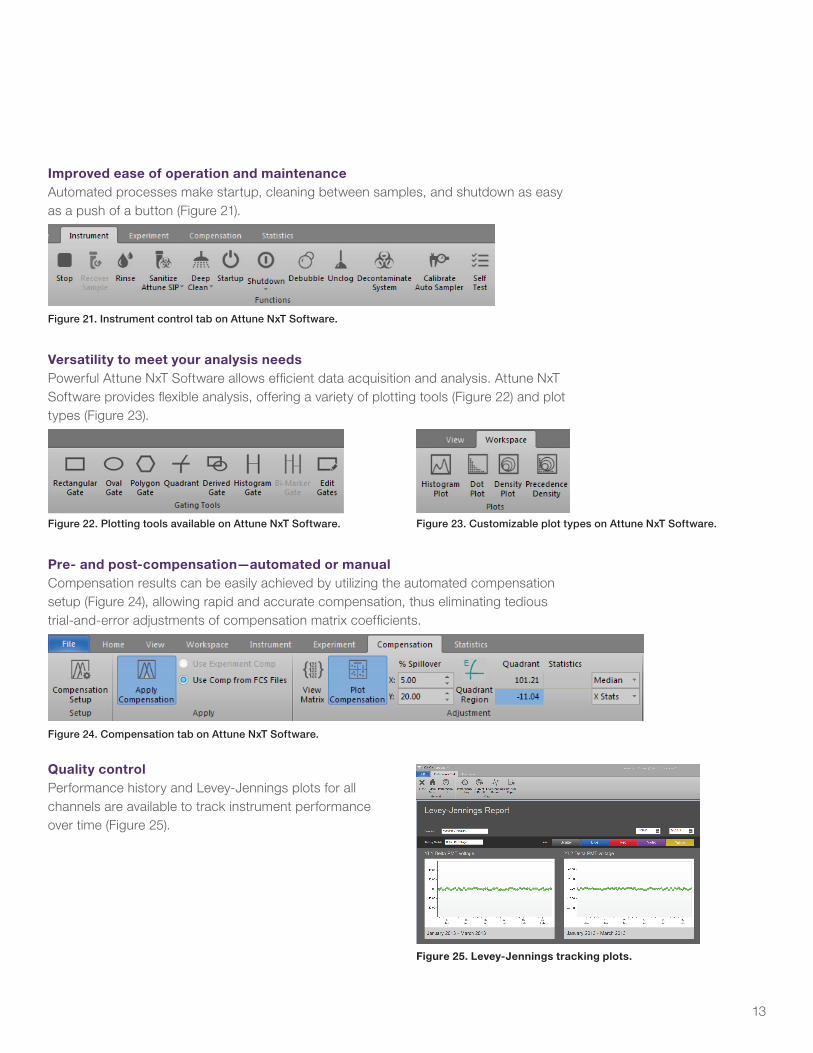
Improved ease of operation and maintenanceAutomated processes make startup, cleaning between samples, and shutdown as easy as a push of a button (Figure 21).
Pre- and post-compensation—automated or manualCompensation results can be easily achieved by utilizing the automated compensation setup (Figure 24), allowing rapid and accurate compensation, thus eliminating tedious trial-and-error adjustments of compensation matrix coeffi cients.
Figure 21. Instrument control tab on Attune NxT Software.
Figure 24. Compensation tab on Attune NxT Software.
Versatility to meet your analysis needsPowerful Attune NxT Software allows effi cient data acquisition and analysis. Attune NxT Software provides fl exible analysis, offering a variety of plotting tools (Figure 22) and plot types (Figure 23).
Quality controlPerformance history and Levey-Jennings plots for all channels are available to track instrument performance over time (Figure 25).
Figure 22. Plotting tools available on Attune NxT Software. Figure 23. Customizable plot types on Attune NxT Software.
Figure 25. Levey-Jennings tracking plots.
14
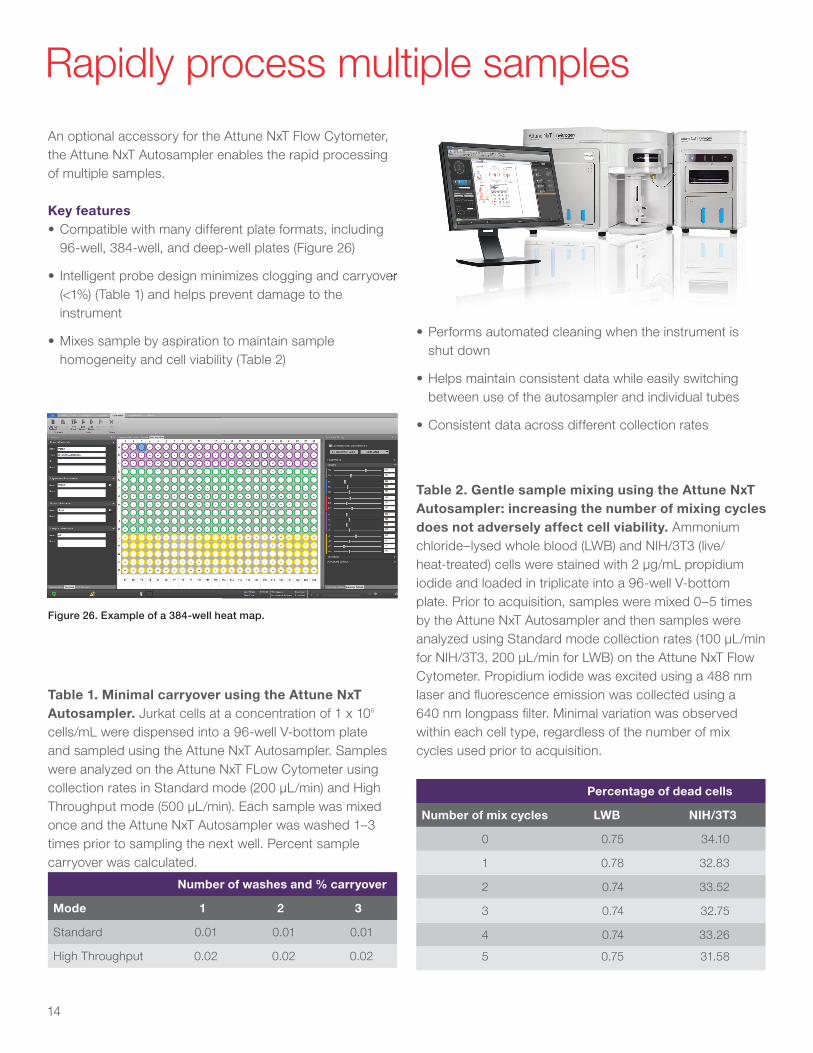
An optional accessory for the Attune NxT Flow Cytometer, the Attune NxT Autosampler enables the rapid processing of multiple samples.
Key features• Compatible with many different plate formats, including
96-well, 384-well, and deep-well plates (Figure 26)
• Intelligent probe design minimizes clogging and carryover (<1%) (Table 1) and helps prevent damage to the instrument
• Mixes sample by aspiration to maintain sample homogeneity and cell viability (Table 2)
Rapidly process multiple samples
Intelligent probe design minimizes clogging and carryover
Figure 26. Example of a 384-well heat map.
Table 1. Minimal carryover using the Attune NxT Autosampler. Jurkat cells at a concentration of 1 x 10⁶
cells/mL were dispensed into a 96-well V-bottom plate and sampled using the Attune NxT Autosampler. Samples were analyzed on the Attune NxT FLow Cytometer using collection rates in Standard mode (200 µL/min) and High Throughput mode (500 µL/min). Each sample was mixed once and the Attune NxT Autosampler was washed 1–3 times prior to sampling the next well. Percent sample carryover was calculated.
Number of washes and % carryover
Mode 1 2 3
Standard 0.01 0.01 0.01
High Throughput 0.02 0.02 0.02
Table 2. Gentle sample mixing using the Attune NxT Autosampler: increasing the number of mixing cycles does not adversely affect cell viability. Ammonium chloride–lysed whole blood (LWB) and NIH/3T3 (live/heat-treated) cells were stained with 2 µg/mL propidium iodide and loaded in triplicate into a 96-well V-bottom plate. Prior to acquisition, samples were mixed 0–5 times by the Attune NxT Autosampler and then samples were analyzed using Standard mode collection rates (100 µL/min for NIH/3T3, 200 µL/min for LWB) on the Attune NxT Flow Cytometer. Propidium iodide was excited using a 488 nm laser and fl uorescence emission was collected using a 640 nm longpass fi lter. Minimal variation was observed within each cell type, regardless of the number of mix cycles used prior to acquisition.
Percentage of dead cells
Number of mix cycles LWB NIH/3T3
0 0.75 34.10
1 0.78 32.83
2 0.74 33.52
3 0.74 32.75
4 0.74 33.26
5 0.75 31.58
• Performs automated cleaning when the instrument is shut down
• Helps maintain consistent data while easily switching between use of the autosampler and individual tubes
• Consistent data across different collection rates

15
We have been at the forefront of expanding cellular analysis with the continued invention and development of fl uorescent detection molecules and probes for nearly 40 years. This enabled a new, expanded world of fl ow cytometry. From conjugated antibodies through functional dyes to cell function assays, look to Invitrogen™ fl ow cytometry products to elucidate your research.
Invitrogen flow cytometry reagents
Go to thermofi sher.com/fl ow-cytometry for more information on Invitrogen fl ow cytometry products and resources.
Sample preparationQuality data require quality starting material. Invitrogen™ sample preparation reagents, which include reagents for blood cell preservation, red blood cell lysis, and sample fi xation and permeabilization, are designed to help you achieve the best possible results. Learn more about these products and get protocols at thermofi sher.com/fl ow-sample
Instrument setup and calibrationFlow cytometers are designed to perform quantitative measurements on individual cells and other particles with high precision, speed, and accuracy. As with all high-performance instrumentation, fl ow cytometers must be calibrated regularly to ensure accuracy and reliability. The stability, uniformity, and reproducibility of Invitrogen™ microsphere products make them excellent tools for fl ow cytometer instrument setup and calibration. Learn more about all of these products at thermofi sher.com/fl ow-standards
Antigen detection—primary antibodiesWe offer a diverse array of highly specifi c RUO, ASR, and IVD primary antibodies. From immunophenotyping to rare-event detection, Invitrogen™
multicolor fl uorescently conjugated primary antibodies for fl ow cytometry can help answer complex cell biology questions. Search for primary antibody conjugates atthermofi sher.com/fl ow-searchantibodies
Cell analysis—functional dyesAn extensive array of Invitrogen™
stains and kits have been developed to assess cell function, health, and viability (Figure 27). Whether the health of cells is your primary question or simply a critical factor in getting the right answers to other questions, we have a solution for you. For more information and more products, go to thermofi sher.com/fl ow-cellhealth
Molecular Probes flow cytometryProducts and resource guide
Figure 27. Retention of Invitrogen™ LIVE/DEAD™ Fixable Dead Cell Stains after formaldehyde fi xation. The LIVE/DEAD Fixable Aqua Dead Cell Stain Kit (Cat. No. L34957) was used to differentially stain a mixture of live (left peak) and heat-treated (right peak) Jurkat cells. (A) Unfi xed cells. (B) Cells fi xed in 3.7% formaldehyde following staining. Samples were analyzed by fl ow cytometry using 405 nm excitation and ~525 nm emission.
102 103 104 105
102 103 104 105
25
0
50
75
100
125
0
50
100
150
Live
Live
Dead
Dead
LIVE/DEAD Fixable Aqua fluorescence
LIVE/DEAD Fixable Aqua fluorescence
Unfixed
After fixation
Num
ber
of c
ells
Num
ber
of c
ells
102 103 104 105
102 103 104 105
25
0
50
75
100
125
0
50
100
150
Live
Live
Dead
Dead
LIVE/DEAD Fixable Aqua fluorescence
LIVE/DEAD Fixable Aqua fluorescence
Unfixed
After fixation
Num
ber
of c
ells
Num
ber
of c
ells
A
B

16
Table 3. Fluorophore selection guide for the Attune NxT Flow Cytometer.
Exc
itat
ion
lase
r Emission filter (nm)
ChannelRecommended labeling dyes
Viability dyes (compatible with fixation)
Viability dyes (nonfixed cells)
DNA content/cell cycle dyes (live cells)
DNA content/cell cycle dyes
(fixed cells)Apoptosis dyes
Cell proliferation dyes
ROS detection dyes
Phagocytosis dyes Fluorescent proteins Other dyes
Vio
let
(405
nm
)
440/50
VL1Alexa Fluor™ 405
Pacific Blue™LIVE/DEAD™ Fixable Violet
DAPI
SYTOX™ Blue
Vybrant™ DyeCycle™ Violet
FxCycle™ VioletAnnexin V Pacific Blue™
PO-PRO™-1
CellTrace™ Violet
Click-iT™ Plus EdU Pacific Blue™
Azurite
Cerulean
eBFP
eCFP
mTurquoise
Sirius
BV421
eFluor™ 450
Horizon™ V450
VioBlue™
512/25
VL2 Pacific Green™ LIVE/DEAD™ Fixable AquaViolet Ratiometric Probe
(F2N12S)vGFP
AmCyan
BV510
Horizon™ V500
VioGreen™
603/48
VL3Pacific Orange™
Qdot™ 605LIVE/DEAD™ Fixable Yellow
Violet Ratiometric Probe (F2N12S)
BV570
BV605
BV650
eFluor™ 605NC
710/50
VL4 Qdot™ 705BV650
BV711
Blu
e (4
88 n
m)
530/30
BL1Alexa Fluor™ 488
FITCLIVE/DEAD™ Fixable Green SYTOX™ Green
Vybrant™ DyeCycle™ Green
Annexin V–Alexa Fluor™ 488
Annexin V–FITC
Anti-PARP–FITC
APO-BrdU TUNEL–Alexa Fluor™ 488
CellEvent™ Caspase-3/7 Green
MitoProbe™ DiOC2(3)
MitoProbe™ JC-1
YO-PRO™-1 Iodide
CellTrace™ CFSE
Click-iT™ Plus EdU Alexa Fluor™ 488
CellROX™ Green
pHrodo™ Green E. coli BioParticles™ conjugate
pHrodo™ Green S. aureus BioParticles™ conjugate
eGFP
Emerald
eYFP
BB515
574/26BL2
(without yellow laser present)
PEPI
SYTOX™ Orange
Vybrant™ DyeCycle™ Orange
Annexin V PE
MitoProbe™ JC-1
TMRE
TMRM
pHrodo™ Red E. coli BioParticles™ conjugate
pHrodo™ Red Phagocytosis Kit
eYFP
mCitrine
Venus
590/40BL2
(with yellow laser present)
PE
PE–Alexa Fluor™ 610
PE–Texas Red™
LIVE/DEAD™ Fixable Red
7-AAD
PI
SYTOX™ AADvanced™
SYTOX™ Orange
FxCycle™ PI/RNase
Annexin V PE
TMRE
TMRM
PE-eFluor™ 610
695/40
BL3
PE–Alexa Fluor™ 700
PE-Cy®5.5
PerCP
PerCP-Cy®5.5
Qdot™ 705
TRI-COLOR™
7-AAD
PI
SYTOX™ AADvanced™
PE-CF594
PE/Dazzle™ 594
PerCP-eFluor™ 710
PerCP-Vio700™
VioGreen™
Vio770™
780/60
BL4PE-Cy®7
Qdot™ 800
Vybrant™ DyeCycle™ Ruby
PE-Vio770™
VioGreen™
Fluorophore selection guide for the Attune NxT Flow CytometerThe Attune NxT Flow Cytometer is designed to accommodate the most common fluorophores and fluorescent proteins used in flow cytometry, to match the panels you are currently running. Multiple fluorescent proteins can be interrogated with the 4-laser version of the Attune NxT Flow Cytometer.

17
500400300 600
IRUV
800700
Exc
itat
ion
lase
r Emission filter (nm)
ChannelRecommended labeling dyes
Viability dyes (compatible with fixation)
Viability dyes (nonfixed cells)
DNA content/cell cycle dyes (live cells)
DNA content/cell cycle dyes
(fixed cells)Apoptosis dyes
Cell proliferation dyes
ROS detection dyes
Phagocytosis dyes Fluorescent proteins Other dyes
Vio
let
(405
nm
)
440/50
VL1Alexa Fluor™ 405
Pacific Blue™LIVE/DEAD™ Fixable Violet
DAPI
SYTOX™ Blue
Vybrant™ DyeCycle™ Violet
FxCycle™ VioletAnnexin V Pacific Blue™
PO-PRO™-1
CellTrace™ Violet
Click-iT™ Plus EdU Pacific Blue™
Azurite
Cerulean
eBFP
eCFP
mTurquoise
Sirius
BV421
eFluor™ 450
Horizon™ V450
VioBlue™
512/25
VL2 Pacific Green™ LIVE/DEAD™ Fixable AquaViolet Ratiometric Probe
(F2N12S)vGFP
AmCyan
BV510
Horizon™ V500
VioGreen™
603/48
VL3Pacific Orange™
Qdot™ 605LIVE/DEAD™ Fixable Yellow
Violet Ratiometric Probe (F2N12S)
BV570
BV605
BV650
eFluor™ 605NC
710/50
VL4 Qdot™ 705BV650
BV711
Blu
e (4
88 n
m)
530/30
BL1Alexa Fluor™ 488
FITCLIVE/DEAD™ Fixable Green SYTOX™ Green
Vybrant™ DyeCycle™ Green
Annexin V–Alexa Fluor™ 488
Annexin V–FITC
Anti-PARP–FITC
APO-BrdU TUNEL–Alexa Fluor™ 488
CellEvent™ Caspase-3/7 Green
MitoProbe™ DiOC2(3)
MitoProbe™ JC-1
YO-PRO™-1 Iodide
CellTrace™ CFSE
Click-iT™ Plus EdU Alexa Fluor™ 488
CellROX™ Green
pHrodo™ Green E. coli BioParticles™ conjugate
pHrodo™ Green S. aureus BioParticles™ conjugate
eGFP
Emerald
eYFP
BB515
574/26BL2
(without yellow laser present)
PEPI
SYTOX™ Orange
Vybrant™ DyeCycle™ Orange
Annexin V PE
MitoProbe™ JC-1
TMRE
TMRM
pHrodo™ Red E. coli BioParticles™ conjugate
pHrodo™ Red Phagocytosis Kit
eYFP
mCitrine
Venus
590/40BL2
(with yellow laser present)
PE
PE–Alexa Fluor™ 610
PE–Texas Red™
LIVE/DEAD™ Fixable Red
7-AAD
PI
SYTOX™ AADvanced™
SYTOX™ Orange
FxCycle™ PI/RNase
Annexin V PE
TMRE
TMRM
PE-eFluor™ 610
695/40
BL3
PE–Alexa Fluor™ 700
PE-Cy®5.5
PerCP
PerCP-Cy®5.5
Qdot™ 705
TRI-COLOR™
7-AAD
PI
SYTOX™ AADvanced™
PE-CF594
PE/Dazzle™ 594
PerCP-eFluor™ 710
PerCP-Vio700™
VioGreen™
Vio770™
780/60
BL4PE-Cy®7
Qdot™ 800
Vybrant™ DyeCycle™ Ruby
PE-Vio770™
VioGreen™

18
Yello
w (5
61 n
m)
585/16
YL1 PEPI
SYTOX™ Orange
Vybrant™ DyeCycle™ Orange
Annexin V Alexa Fluor™ 568
Annexin V Alexa Fluor™ 594
MitoTracker™ Orange CMTMRos
MitoTracker™ Red CMXRos
TMRE
TMRM
CellROX™ Orange
dTomato
mOrange
RFP
620/15
YL2PE–Alexa Fluor™ 610
PE–Texas Red™
7-AAD
PI
SYTOX™ AADvanced™
SYTOX™ Orange
FxCycle™ PI/RNase
DsRed
mCherry
mKate
mStrawberry
ECD
PE-CF594
PE-Dazzle™ 594
PE-eFluor™ 610
PE-Vio™ 610
Texas Red™
695/40
YL3
PE–Alexa Fluor™ 700
PE-Cy®5.5
Qdot™ 705
TRI-COLOR™
7-AAD
PI
SYTOX™ AADvanced™
780/60
YL4PE-Cy®7
Qdot™ 800
Vybrant™ DyeCycle™ Ruby
PE-Vio770™
Red
(638
nm
)
670/14
RL1
Alexa Fluor™ 647
APC
Qdot™ 655
LIVE/DEAD™ Fixable Far Red SYTOX™ Red FxCycle™ Far Red
Annexin V Alexa Fluor™ 647
Annexin V Alexa Fluor™ 680
Annexin V APC
MitoProbe™ DilC1(5)
TO-PRO™-3
CellTrace™ Far Red
Click-iT™ Plus EdU Alexa Fluor™ 647
CellROX™ Deep Red eFluor™ 660
720/30
RL2
Alexa Fluor™ 680
Alexa Fluor™ 700
APC–Alexa Fluor™ 700
Qdot™ 705
780/60
RL3APC-Alexa Fluor™ 750
APC-Cy®7LIVE/DEAD™ Fixable Near-IR
Vybrant™ DyeCycle™ Ruby
APC-H7
APC-eFluor™ 750
APC-eFluor™ 780
APC-Vio770™
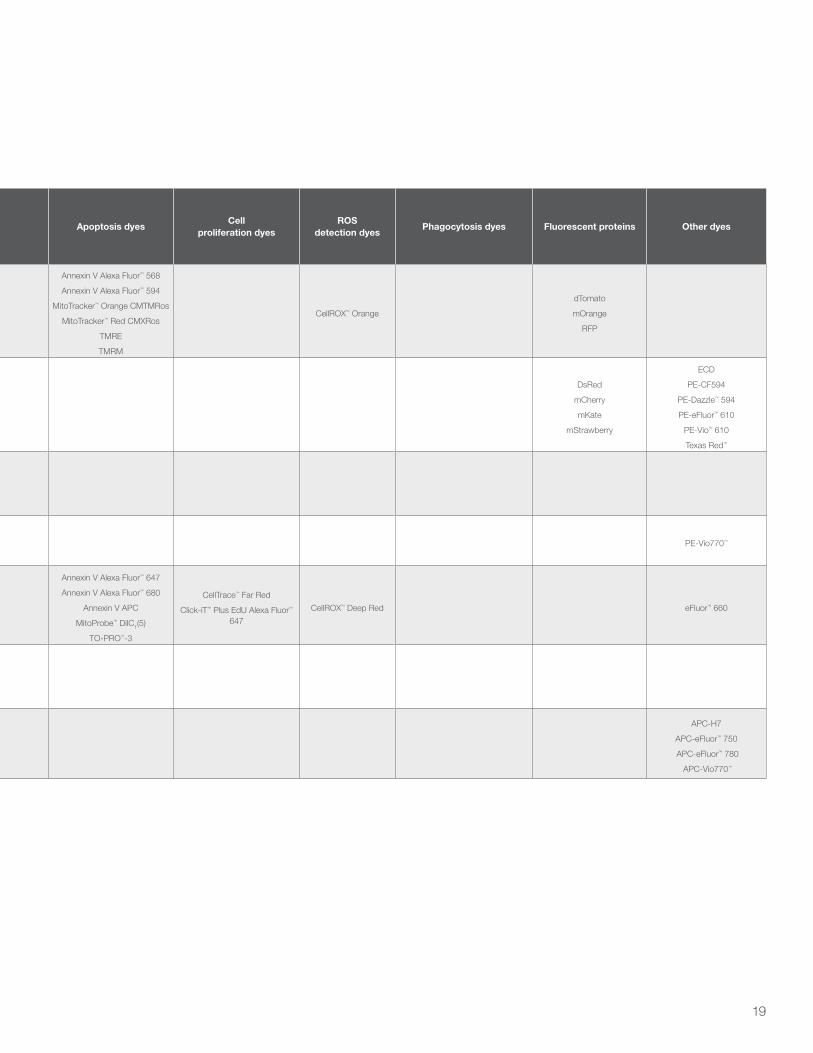
Table 3. Fluorophore selection guide for the Attune NxT Flow Cytometer. (continued)
Exc
itat
ion
lase
r Emission filter (nm)
ChannelRecommended labeling dyes
Viability dyes (compatible with fixation)
Viability dyes (nonfixed cells)
DNA content/cell cycle dyes (live cells)
DNA content/cell cycle dyes (fixed cells)
Apoptosis dyesCell
proliferation dyesROS
detection dyesPhagocytosis dyes Fluorescent proteins Other dyes
19
Yello
w (5
61 n
m)
585/16
YL1 PEPI
SYTOX™ Orange
Vybrant™ DyeCycle™ Orange
Annexin V Alexa Fluor™ 568
Annexin V Alexa Fluor™ 594
MitoTracker™ Orange CMTMRos
MitoTracker™ Red CMXRos
TMRE
TMRM
CellROX™ Orange
dTomato
mOrange
RFP
620/15
YL2PE–Alexa Fluor™ 610
PE–Texas Red™
7-AAD
PI
SYTOX™ AADvanced™
SYTOX™ Orange
FxCycle™ PI/RNase
DsRed
mCherry
mKate
mStrawberry
ECD
PE-CF594
PE-Dazzle™ 594
PE-eFluor™ 610
PE-Vio™ 610
Texas Red™
695/40
YL3
PE–Alexa Fluor™ 700
PE-Cy®5.5
Qdot™ 705
TRI-COLOR™
7-AAD
PI
SYTOX™ AADvanced™
780/60
YL4PE-Cy®7
Qdot™ 800
Vybrant™ DyeCycle™ Ruby
PE-Vio770™
Red
(638
nm
)
670/14
RL1
Alexa Fluor™ 647
APC
Qdot™ 655
LIVE/DEAD™ Fixable Far Red SYTOX™ Red FxCycle™ Far Red
Annexin V Alexa Fluor™ 647
Annexin V Alexa Fluor™ 680
Annexin V APC
MitoProbe™ DilC1(5)
TO-PRO™-3
CellTrace™ Far Red
Click-iT™ Plus EdU Alexa Fluor™ 647
CellROX™ Deep Red eFluor™ 660
720/30
RL2
Alexa Fluor™ 680
Alexa Fluor™ 700
APC–Alexa Fluor™ 700
Qdot™ 705
780/60
RL3APC-Alexa Fluor™ 750
APC-Cy®7LIVE/DEAD™ Fixable Near-IR
Vybrant™ DyeCycle™ Ruby
APC-H7
APC-eFluor™ 750
APC-eFluor™ 780
APC-Vio770™
Exc
itat
ion
lase
r Emission filter (nm)
ChannelRecommended labeling dyes
Viability dyes (compatible with fixation)
Viability dyes (nonfixed cells)
DNA content/cell cycle dyes (live cells)
DNA content/cell cycle dyes (fixed cells)
Apoptosis dyesCell
proliferation dyesROS
detection dyesPhagocytosis dyes Fluorescent proteins Other dyes
20
Beyond repair to proactive care• Gain peace of mind during every stage of ownership:
instrument install, repair, and maintenance
• Over 1,000 technical specialists delivering on flexible and reliable service options
• 30 years of servicing life sciences instrumentation
• Concierge and excellent escalation process to help get you up and running faster
• Wide range of flexible service plans to help realize savings in instrument care
AB Assurance Plan*This is our premium repair plan designed to help maximize instrument performance and help ensure availability of critical systems. The plan can help you keep your lab running smoothly with preventive maintenance, proactive instrument monitoring, and fast response should an instrument require repair. Our Uptime option provides guaranteed next–business day, on-site response.
The AB Assurance Plan features:• Guaranteed 2-business day response time*
• All-inclusive contract price—all labor, parts, and engineer travel included: no caps or hidden fees
• Complete computer coverage
• Consumables used for troubleshooting included
• Remote monitoring and diagnostics
• Phone and email access to technical support
• Proactive planned maintenance and Pure Dye Calibration Service scheduling
• Experienced, certified engineers
• Certified parts and consumables
• Proactive software updates
AB Maintenance Plan*Ideal for labs that don’t have critical availability needs, this plan is designed to help you maximize instrument performance, even on a limited budget. This plan is also an ideal fit for those with internal resources and expertise to maintain instrumentation on an ongoing basis.
Features:• Planned maintenance visit(s)—includes engineer labor
and travel
• Phone and email access to application technical support
• Discount on labor and parts for each service call (Plus option)
A la carte servicesMany of the value-added services are available on an a la carte basis, allowing you to supplement your in-house abilities or mix and match services based on your needs and budget.
These services include:• Qualification service
• Smart services
• On-site application consulting
• Professional services
• Time and materials service
Choose a service plan that is right for you—whatever your priorities
*Availability limited in some geographic areas.

21
Smart Monitor Service is a remote monitoring and diagnostics service used to help improve instrument uptime by enabling service personnel to proactively respond to and remotely diagnose instrument issues. We use a proprietary software application that provides instrument and instrument computer performance data on a periodic basis to a secure, centrally located server and database. Smart Monitor Service monitors the instrument’s critical operating parameters and provides peace of mind, during unattended operation, that your unit is functioning as designed.*
• Helps improve uptime
• Remote monitoring and diagnostics from anywhere in the world where instrument is able to be networked
• Helps decrease total cost of product ownership
• Telephone access to Remote Service Engineers
• Historic performance data and reporting
Smart Monitor Service: remote monitor and diagnostics
Regulatory complianceIf your laboratory operates in a regulated environment, you may be required to qualify and validate your systems according to vendor specifications and your internal requirements. Global standards and country-specific regulations require documented verification that your system is doing the job correctly as intended. Complex, time-consuming, and costly, this process can be overwhelming. We can help.
SolutionsInstallation Qualification (IQ) verifies that, at the time of testing, your system was received as ordered and installed according to the manufacturer’s specifications. It also establishes that your laboratory environment is suitable for operation of the system.
Operational Qualification (OQ) verifies that, at the time of testing, your system functions according to operational specifications per the manufacturer. It also verifies that the equipment operates consistently within established limits and tolerances over the defined operating ranges per the manufacturer’s specifications.
IQ/OQ is an integral part of a validation process for compliance with Good Laboratory Practices (GLP), ISO 9000, and other standards.
* Instrument needs to be networked.

22
Resources Reference guides
Stay in the know—news and updates
Mobile apps for research on the go
Antibody selection toolExplore our extensive portfolio of high-quality primary and secondary antibody conjugates with the easy-to-use selection tool. thermofi sher.com/antibodies
Fluorescence SpectraViewerPlot up to 14 fl uorophores on a single graph that you can then print or save for later. thermofi sher.com/spectraviewer
Flow cytometry resources centerSearch for protocols, tutorials, application notes, fl uorophore and product selection guides, literature, and many other technical resources in a single place. thermofi sher.com/fl owresources
BioProbes™ Journal and Molecular Probes™ eNewsletterOur award-winning print and online magazine, BioProbes Journal, highlights the latest breakthroughs from our scientists, featuring new technologies and products.
The Molecular Probes eNewsletter keeps you informed about new products that have just been released.
To access current and past issues of the BioProbes Journal, go to thermofi sher.com/bioprobes
To receive the BioProbes Journal and the Molecular Probes eNewsletter, subscribe at thermofi sher.com/subscribeprobes
Interactive instrument 3D explorer demoExplore the features of the Attune NxT Flow Cytometer with the virtual demo. Spin the unit around and interact with key features. thermofi sher.com/attune
Flow cytometry guide and protocolsGet access to our reagent selection guides for selected applications and protocols and troubleshoot on the go. Also enjoy a built-in protocol timer and alarm for timed steps.
Fluorescence SpectraViewerPlot and compare spectra, check spectral compatibility for fl uorophores, and email the confi guration to yourself in a clear, printable format.
DailyCalcs science calculatorEasily calculate molarity, dilution, molecular weight, and more.
The artis mobile appThis app brings together scientifi c content—including how-to videos, on-demand webinars, application notes, and white papers—in one convenient, mobile-friendly location.
Molecular Probes webinar seriesOur scientists share various techniques and provide tips and tricks.
View the recorded webinars or sign up for future live webinars at thermofi sher.com/probeswebinars
All the mobile apps are available free of charge and can be downloaded at thermofi sher.com/apps
Molecular Probes flow cytometryProducts and resource guide
BIOPROBES 71MOLECULAR PROBES™ JOURNAL OF CELL BIOLOGY APPLICATIONS
A sensitive flow cytometry assay for hyperploidy and cell death
in the Drosophila brain
PLUSFlow cytometry panel designTools and strategies for rare-event detectionMultiparameter detection of early apoptosis markersInstrument specifications for the Attune™ NxT cytometer
JUNE 2015
SPECIAL FLOW CYTOMETRY ISSUE
@twitter.com/[email protected]/[email protected]/molprobes
@facebook.com/[email protected]/[email protected]/molecularprobes
BioProbes 71: Special Flow Cytometry Issue Our award-winning print and digital magazine highlights the latest breakthroughs in cell biology, featuring new technologies and products. Read the latest issue at thermofi sher.com/bioprobes
Online tools
Learn and connect
*Not available in all countries.
Molecular Probes™ Flow Cytometry Panel Design ToolChoose fl uorescent antibody conjugates: pick the antibody species reactivity, select up to 14 targets of interest (choices include viability dyes), and choose the lasers or fl uorophores you want to view. Print or email your list.
@linkedin.com/thermo-fi sher-scientifi c
Molecular Probes™ Flow Cytometry Resource GuideOur fl ow cytometry products and resource guide presents an overview of primary antibody conjugates, cell analysis reagents, and other tools optimized for fl ow cytometry. Access your free copy* at thermofi sher.com/fl owguide
The Molecular Probes™ Handbook, 11th EditionThe most complete reference on fl uorescent labeling and detection available, this resource features extensive references and technical notes and contains over 3,000 technology solutions representing a wide range of biomolecular labeling and detection reagents. See the online version of The Molecular Probes Handbook and request your free copy* at thermofi sher.com/handbook
23
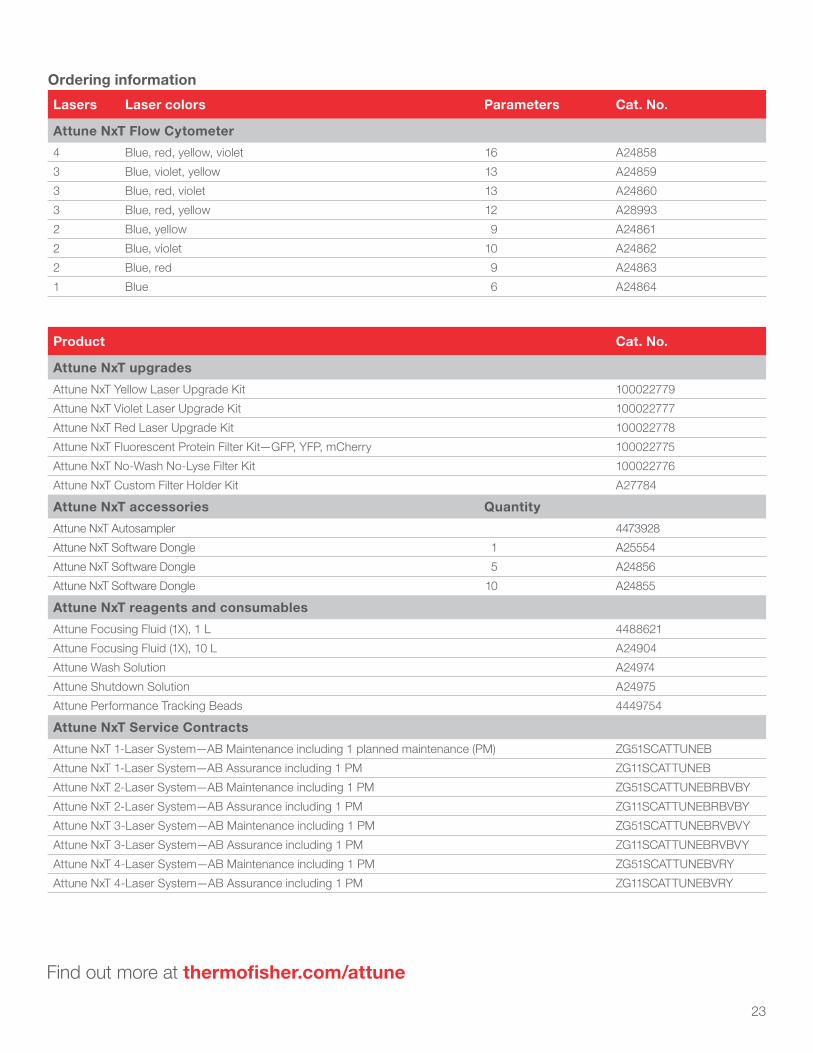
Ordering information
Lasers Laser colors Parameters Cat. No.
Attune NxT Flow Cytometer
4 Blue, red, yellow, violet 16 A24858
3 Blue, violet, yellow 13 A24859
3 Blue, red, violet 13 A24860
3 Blue, red, yellow 12 A28993
2 Blue, yellow 9 A24861
2 Blue, violet 10 A24862
2 Blue, red 9 A24863
1 Blue 6 A24864
Find out more at thermofisher.com/attune
Product Cat. No.
Attune NxT upgrades
Attune NxT Yellow Laser Upgrade Kit 100022779
Attune NxT Violet Laser Upgrade Kit 100022777
Attune NxT Red Laser Upgrade Kit 100022778
Attune NxT Fluorescent Protein Filter Kit—GFP, YFP, mCherry 100022775
Attune NxT No-Wash No-Lyse Filter Kit 100022776
Attune NxT Custom Filter Holder Kit A27784
Attune NxT accessories Quantity
Attune NxT Autosampler 4473928
Attune NxT Software Dongle 1 A25554
Attune NxT Software Dongle 5 A24856
Attune NxT Software Dongle 10 A24855
Attune NxT reagents and consumables
Attune Focusing Fluid (1X), 1 L 4488621
Attune Focusing Fluid (1X), 10 L A24904
Attune Wash Solution A24974
Attune Shutdown Solution A24975
Attune Performance Tracking Beads 4449754
Attune NxT Service Contracts
Attune NxT 1-Laser System—AB Maintenance including 1 planned maintenance (PM) ZG51SCATTUNEB
Attune NxT 1-Laser System—AB Assurance including 1 PM ZG11SCATTUNEB
Attune NxT 2-Laser System—AB Maintenance including 1 PM ZG51SCATTUNEBRBVBY
Attune NxT 2-Laser System—AB Assurance including 1 PM ZG11SCATTUNEBRBVBY
Attune NxT 3-Laser System—AB Maintenance including 1 PM ZG51SCATTUNEBRVBVY
Attune NxT 3-Laser System—AB Assurance including 1 PM ZG11SCATTUNEBRVBVY
Attune NxT 4-Laser System—AB Maintenance including 1 PM ZG51SCATTUNEBVRY
Attune NxT 4-Laser System—AB Assurance including 1 PM ZG11SCATTUNEBVRY
For Research Use Only. Not for use in diagnostic procedures. © 2016 Thermo Fisher Scientific Inc. All rights reserved. All trademarks are the property of Thermo Fisher Scientific and its subsidiaries unless otherwise specified. Microsoft and Office are trademarks of Microsoft Corporation. Cy is a registered trademark of GE Healthcare. Spherotech is a trademark of Spherotech, Inc. COL21198 0616
Go to thermofisher.com/flowguide
Get your free copy of the Molecular Probes Flow Cytometry Products and Resource Guide
Beautiful data again and again