the new normal? hardwood exports in a changed world
TRANSCRIPT

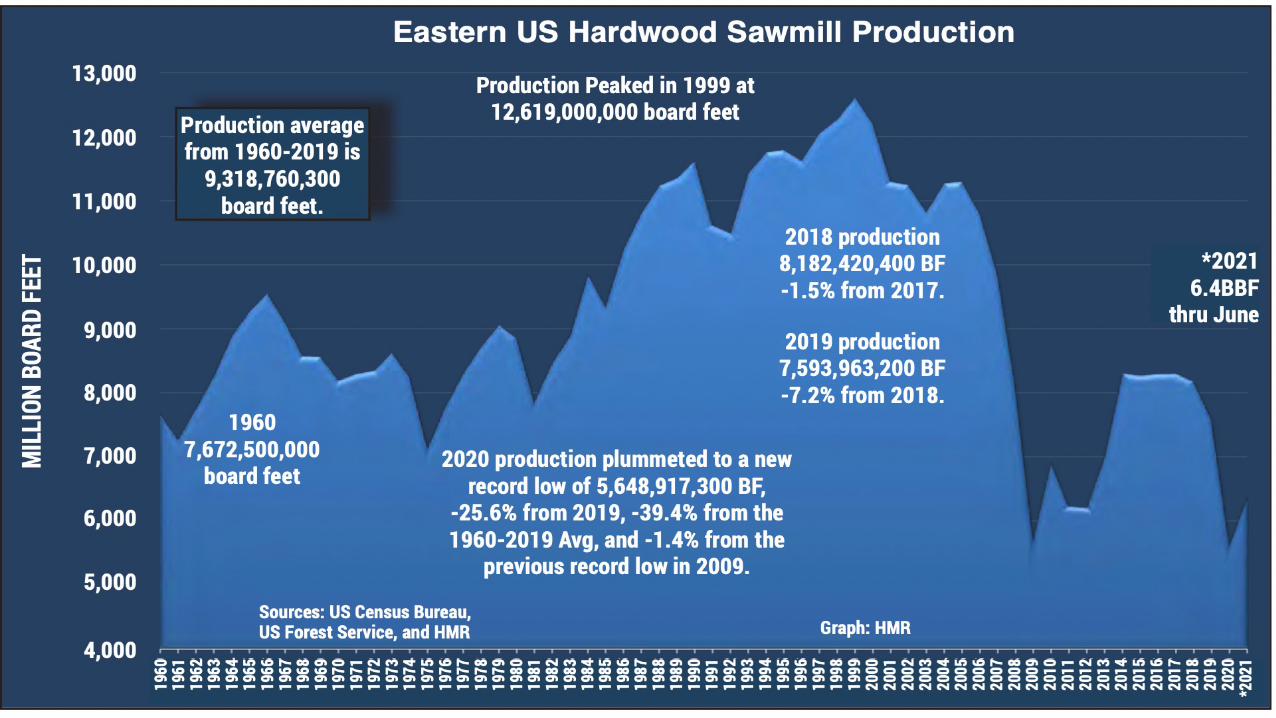
The New Normal? Hardwood Exports in a Changed World
Mike SnowAmerican Hardwood Export Council
September 2021

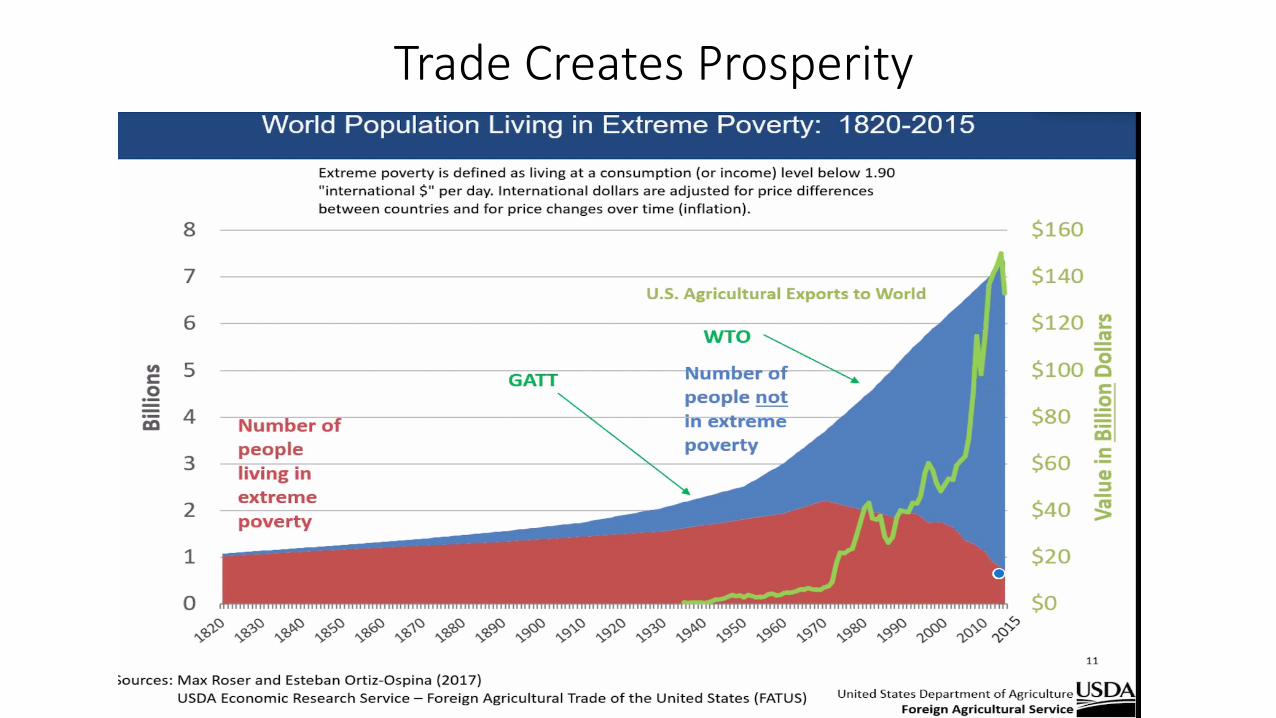
Trade Creates Prosperity
$-
$500
$1,000
$1,500
$2,000
$2,500
$3,000
1979
1980
1981
1982
1983
1984
1985
1986
1987
1988
1989
1990
1991
1992
1993
1994
1995
1996
1997
1998
1999
2000
2001
2002
2003
2004
2005
2006
2007
2008
2009
2010 20
1120
1220
1320
1420
1520
1620
1720
1820
1920
20
Milli
ons
($U
SD)
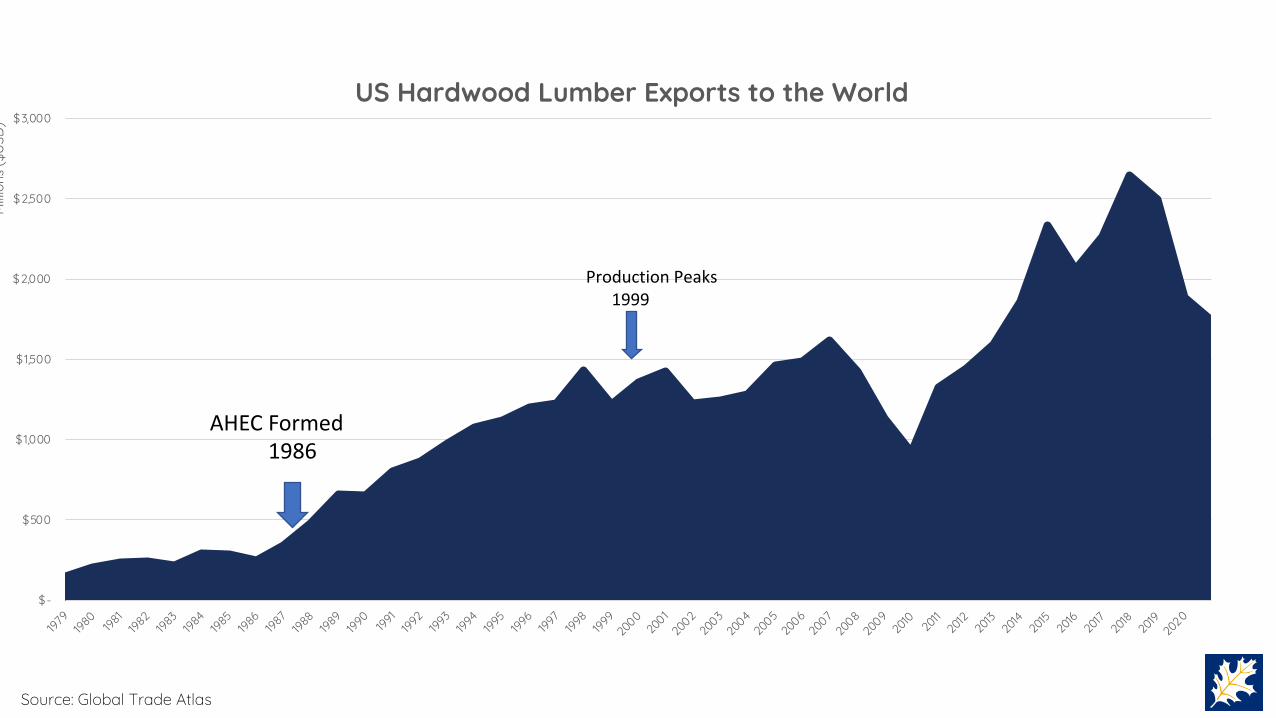
US Hardwood Lumber Exports to the World
Production Peaks1999
Source: Global Trade Atlas
AHEC Formed1986

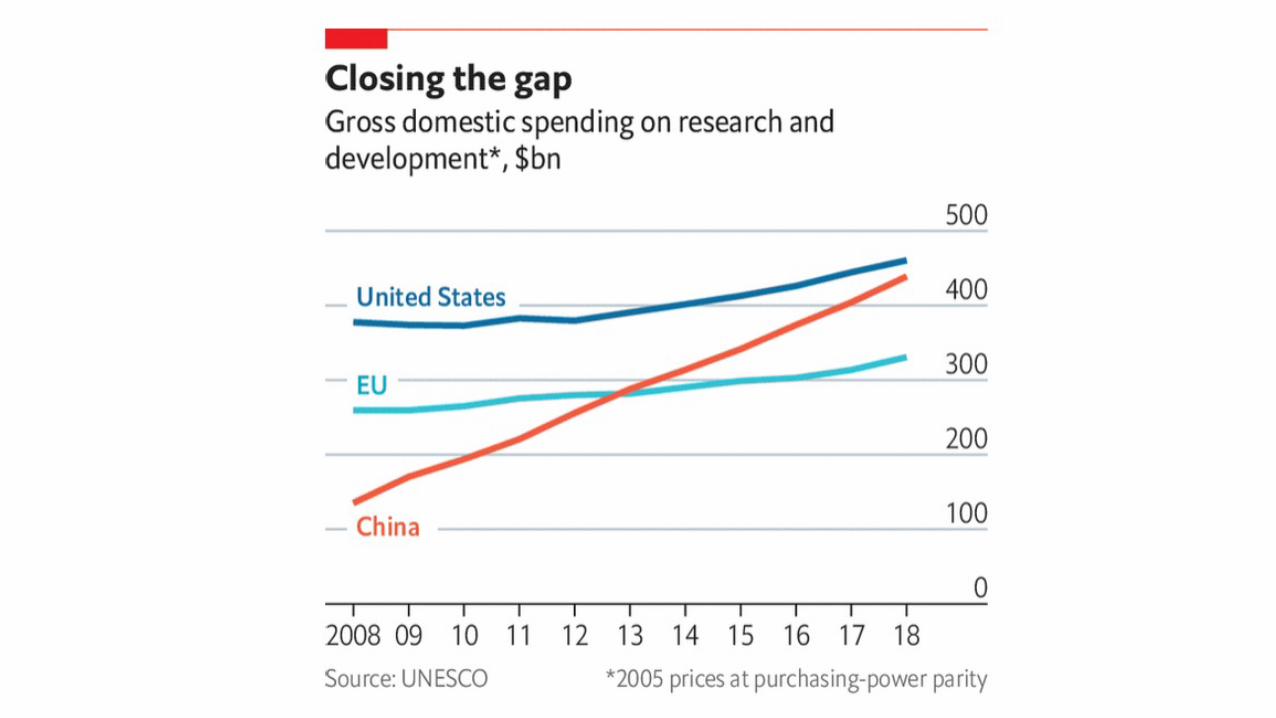
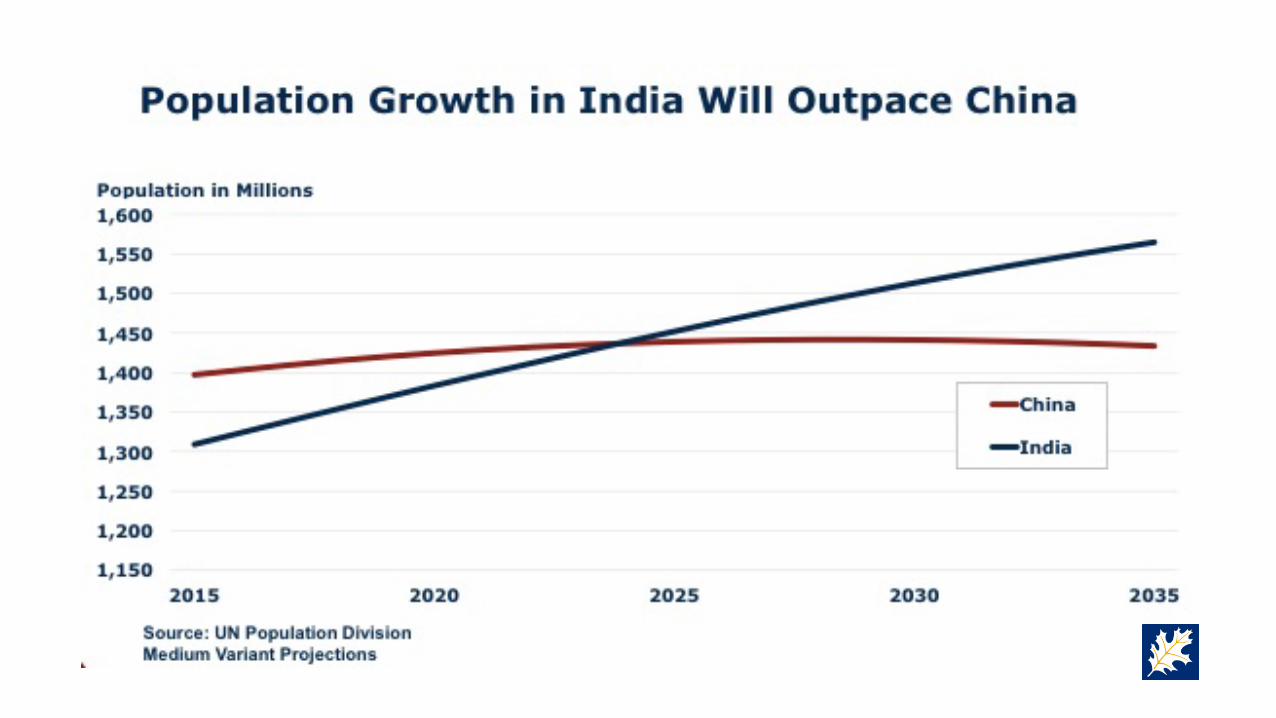
Global Middle Class will be Dominant by 2030
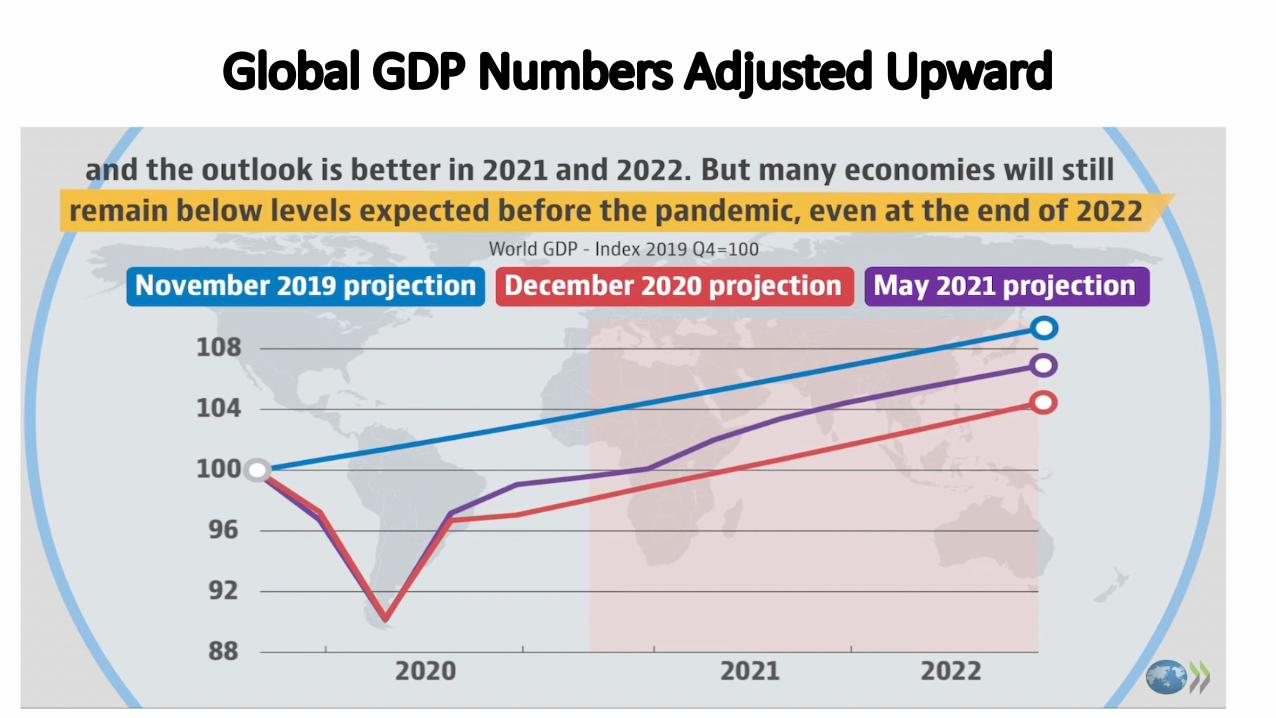
Global GDP Numbers Adjusted Upward


$-
$500
$1,000
$1,500
$2,000
$2,500
$3,000
$3,500
$4,000
2016 2017 2018 2019 2020 2021
Milli
ons
($U
SD)
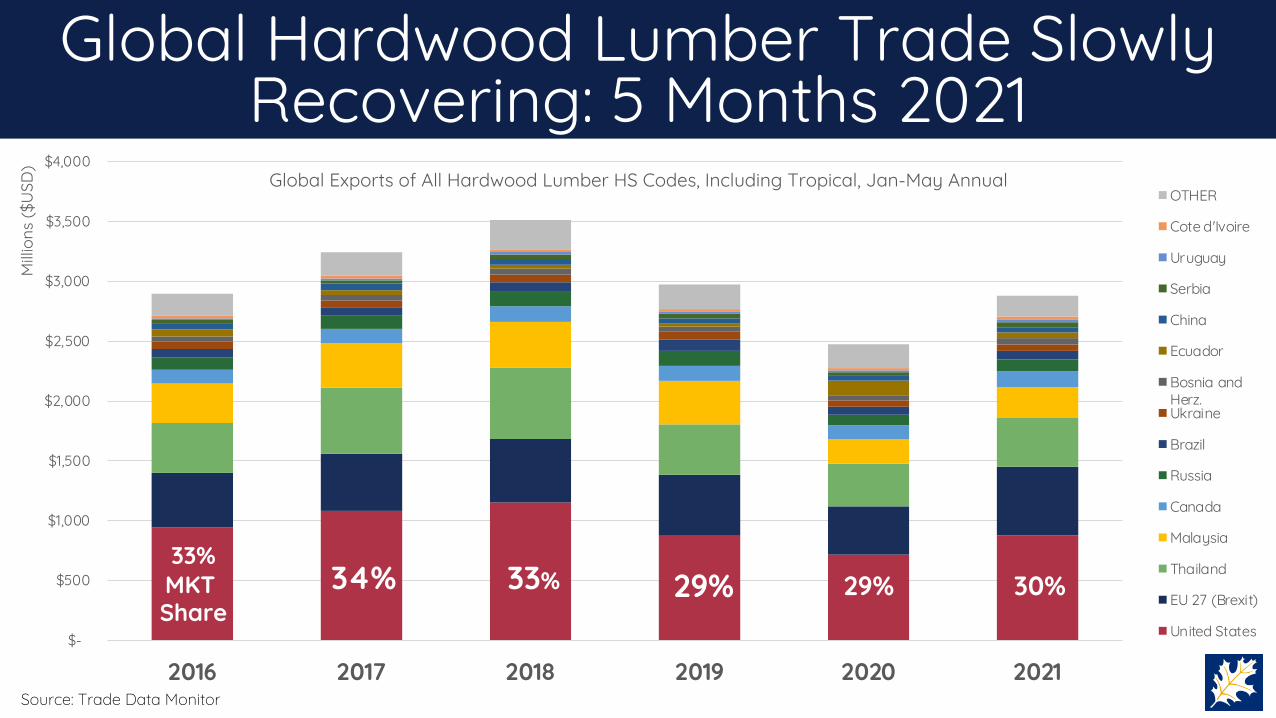
Global Exports of All Hardwood Lumber HS Codes, Including Tropical, Jan-May AnnualOTHER
Cote d'Ivoire
Uruguay
Serbia
China
Ecuador
Bosnia andHerz.Ukraine
Brazil
Russia
Canada
Malaysia
Thailand
EU 27 (Brexit)
United States
Global Hardwood Lumber Trade Slowly Recovering: 5 Months 2021
33%MKT Share
33% 29% 30%34% 29%
Source: Trade Data Monitor

$-
$200
$400
$600
$800
$1,000
$1,200
$1,400
2016 2017 2018 2019 2020 2021
Milli
ons
($U
SD)
US Hardwood Lumber Exports to Main Regions (Jan-June)
Middle East & North AfricaOceania, Korea, JapanLatin AmericaEuropean Union-28Southeast AsiaChina and Hong Kong
Source: Global Trade Atlas, all data for Jan-June
$-
$100
$200
$300
$400
$500
$600
$700
$800
$900
China Canada Vietnam Mexico UnitedKingdom
Japan Germany Italy Indonesia Korea,South
Spain Malaysia Australia
Milli
ons
($U
SD)
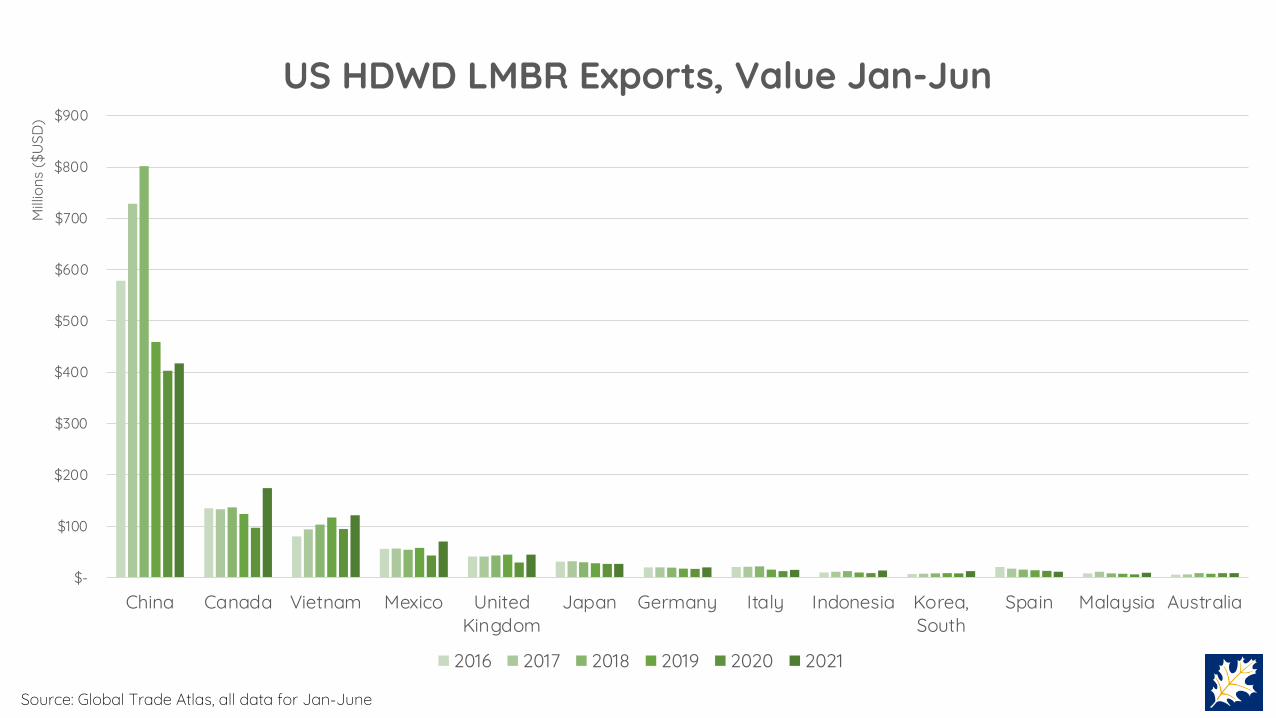
US HDWD LMBR Exports, Value Jan-Jun
2016 2017 2018 2019 2020 2021
Source: Global Trade Atlas, all data for Jan-June

0
200,000
400,000
600,000
800,000
1,000,000
1,200,000
1,400,000
2016 2017 2018 2019 2020 2021
US Hardwood Log Exports, m3 (Jan-Jun)
Other Europe
Middle East
South Asia
Caribbean
European Union-27
Southeast Asia
North America
East Asia
0
100,000
200,000
300,000
400,000
500,000
600,000
700,000
800,000
China Canada Vietnam Italy Japan Korea,South
Cambodia Bahamas,The
Taiwan
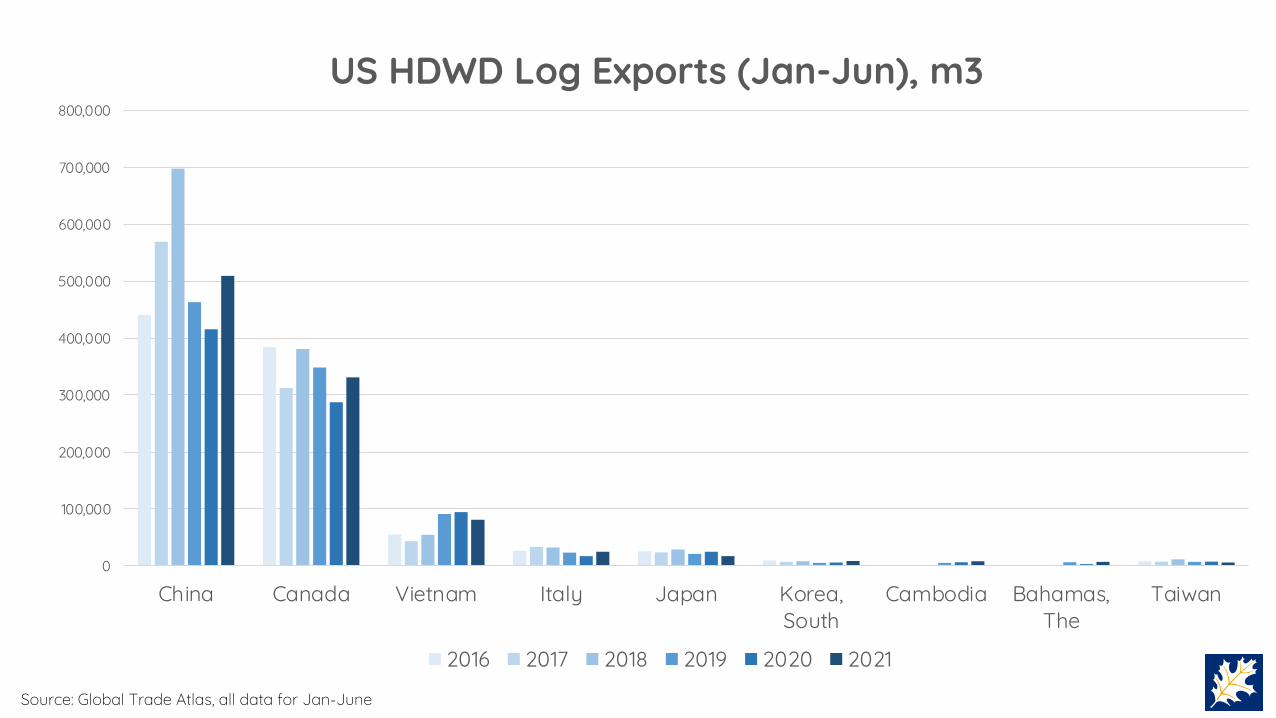
US HDWD Log Exports (Jan-Jun), m3
2016 2017 2018 2019 2020 2021
Source: Global Trade Atlas, all data for Jan-June
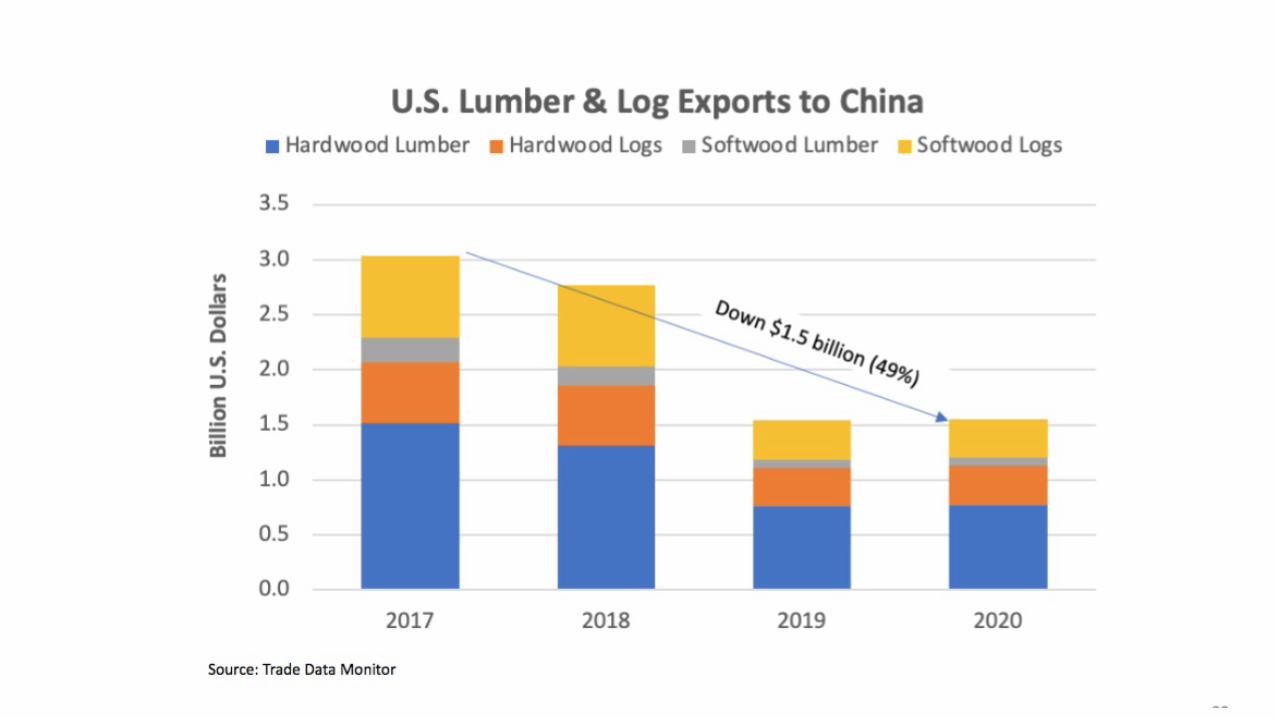
$-
$0.5
$1.0
$1.5
$2.0
$2.5
$3.0
$3.5
2018 2019 2020
Billio
ns ($
USD
)
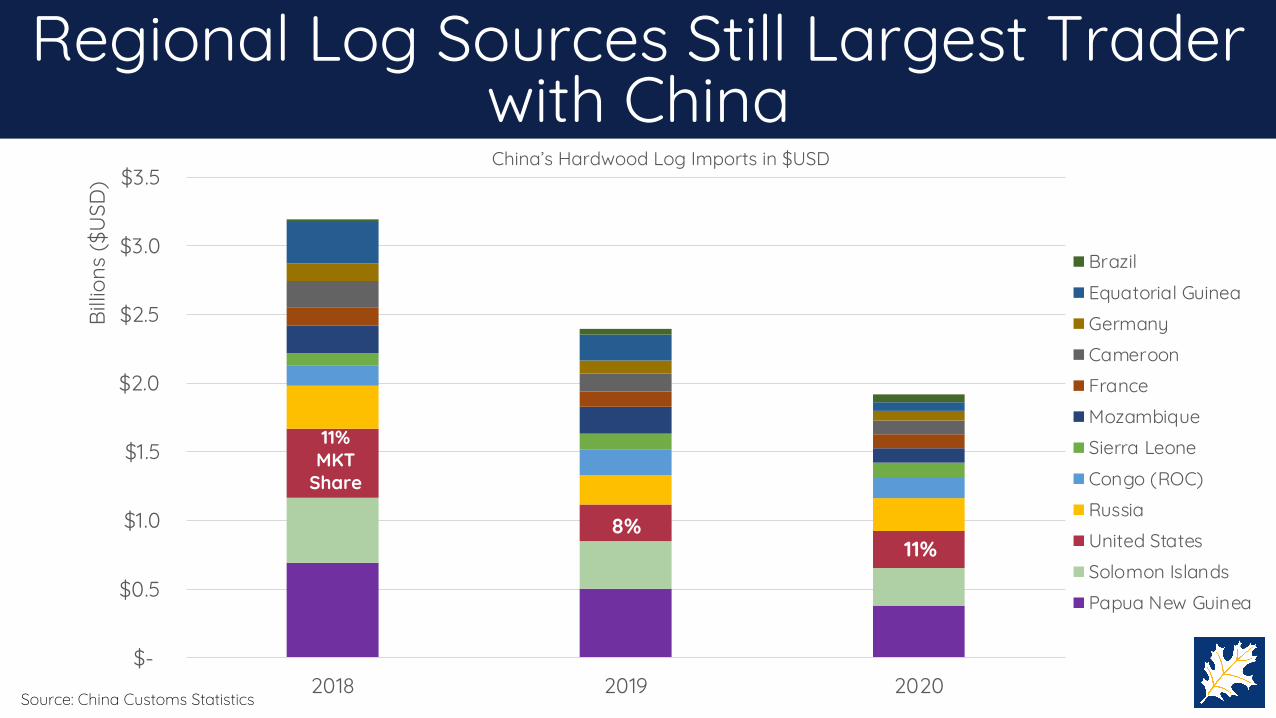
China’s Hardwood Log Imports in $USD
BrazilEquatorial GuineaGermanyCameroonFranceMozambiqueSierra LeoneCongo (ROC)RussiaUnited StatesSolomon IslandsPapua New Guinea
Source: China Customs Statistics
Regional Log Sources Still Largest Trader with China
11%MKT
Share
8%11%
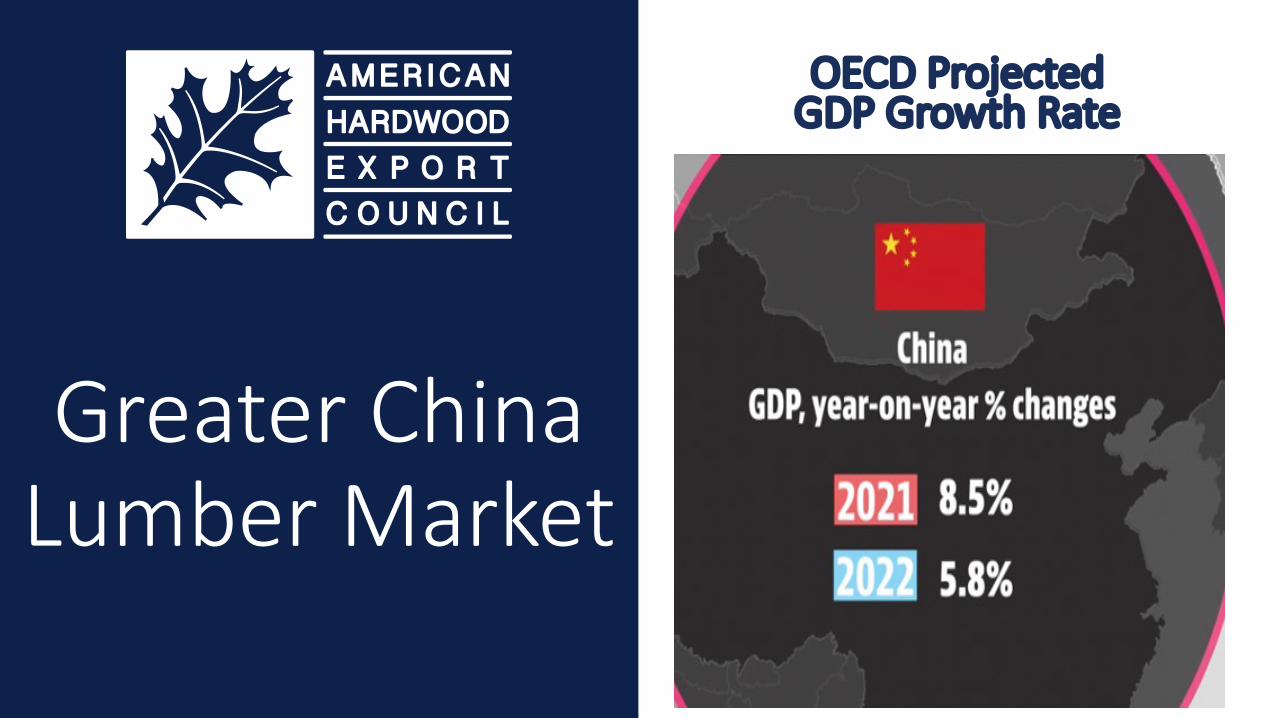
Greater China Lumber Market
OECD Projected GDP Growth Rate


0
50,000
100,000
150,000
200,000
250,000Ja
n '17
Feb
'17
Mar
'17
Apr '
17
May
'17
Jun
'17
July
'17
Aug
'17
Sept
'17
Oct
'17
Nov
'17
Dec
'17
Jan
'18
Feb
'18
Mar
'18
Apr '
18
May
'18
Jun
'18
July
'18
Aug
'18
Sept
'18
Oct
'18
Nov
'18
Dec
'18
Jan
'19
Feb
'19
Mar
'19
Apr '
19
May
'19
Jun
'19
July
'19
Aug
'19
Sept
'19
Oct
'19
Nov
'19
Dec
'19
Jan
'20
Feb
'20
Mar
'20
Apr '
20
May
'20
Jun
'20
July
'20
Aug
'20
Sept
'20
Oct
'20
Nov
'20
Dec
'20
Jan
'21
Feb
'21
Mar
'21
Apr '
21
May
'21
Jun
'21
US HDWD Lumber Exports to China (m3)
Source: U.S. Census Bureau Trade Data
Blue – Before Tariffs Yellow – Initial Tariffs Red- Full Tariffs Green – Tariffs Removed
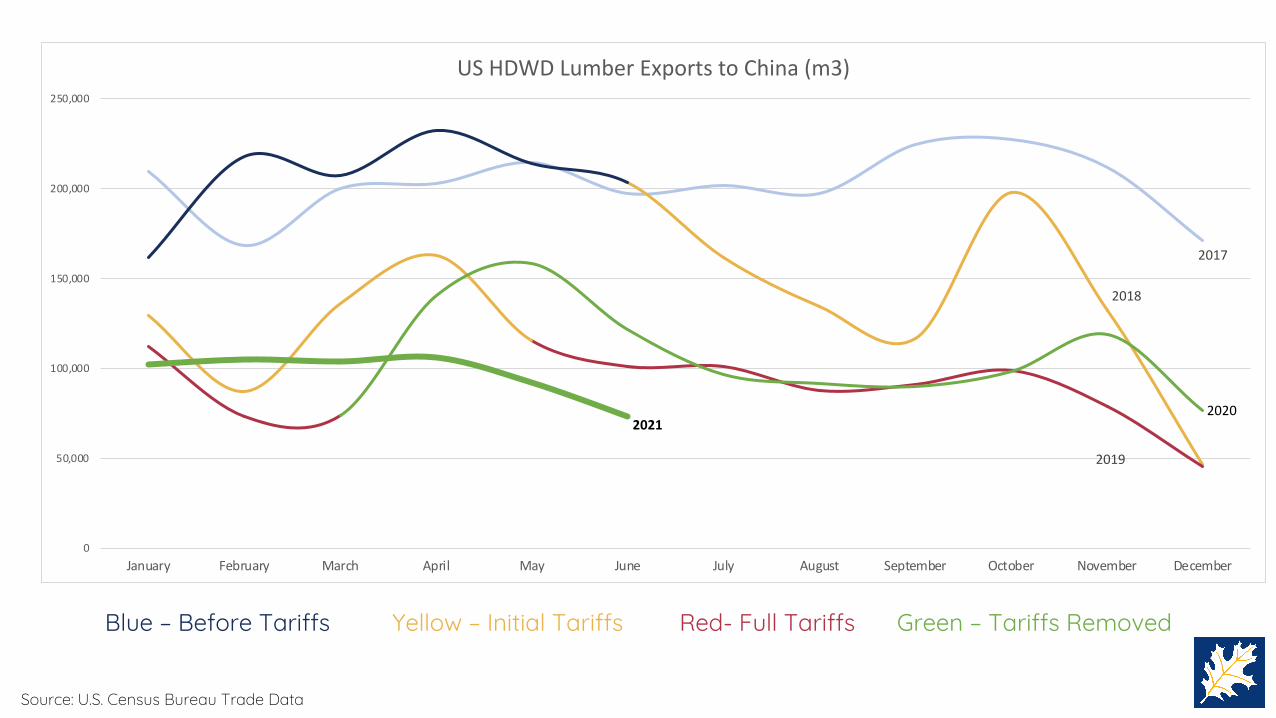
2017
2018
2019
0
50,000
100,000
150,000
200,000
250,000
January February March April May June July August September October November December
US HDWD Lumber Exports to China (m3)
Source: U.S. Census Bureau Trade Data
Blue – Before Tariffs Yellow – Initial Tariffs Red- Full Tariffs Green – Tariffs Removed
20202021

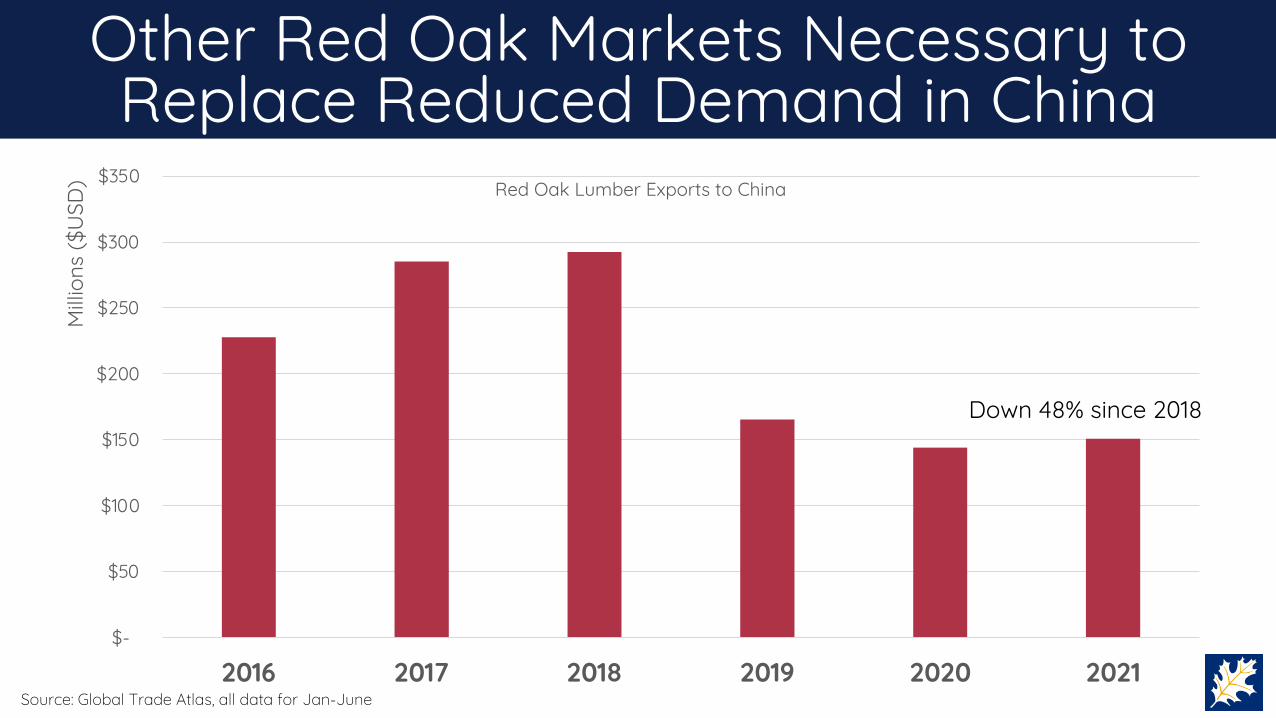
$-
$50
$100
$150
$200
$250
$300
$350
2016 2017 2018 2019 2020 2021
Milli
ons
($U
SD) Red Oak Lumber Exports to China
Down 48% since 2018
Other Red Oak Markets Necessary to Replace Reduced Demand in China
Source: Global Trade Atlas, all data for Jan-June
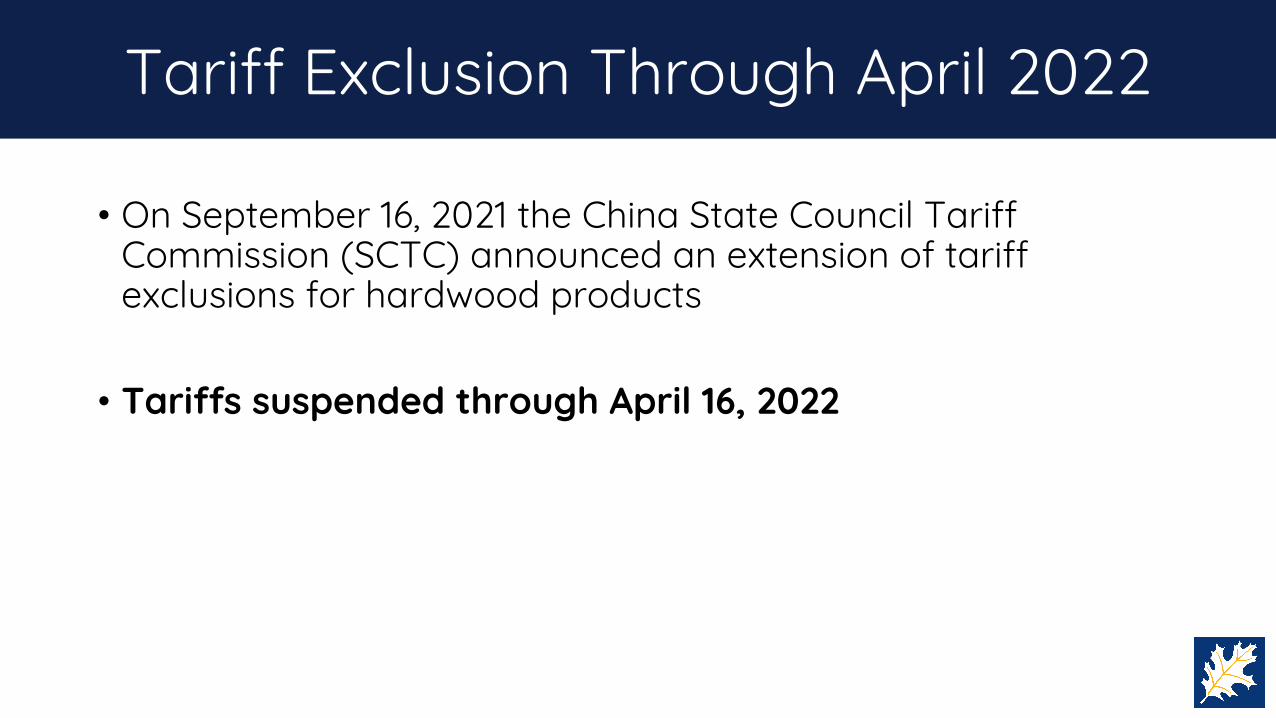
Tariff Exclusion Through April 2022
• On September 16, 2021 the China State Council Tariff Commission (SCTC) announced an extension of tariff exclusions for hardwood products
• Tariffs suspended through April 16, 2022
Source: China Customs Statistics
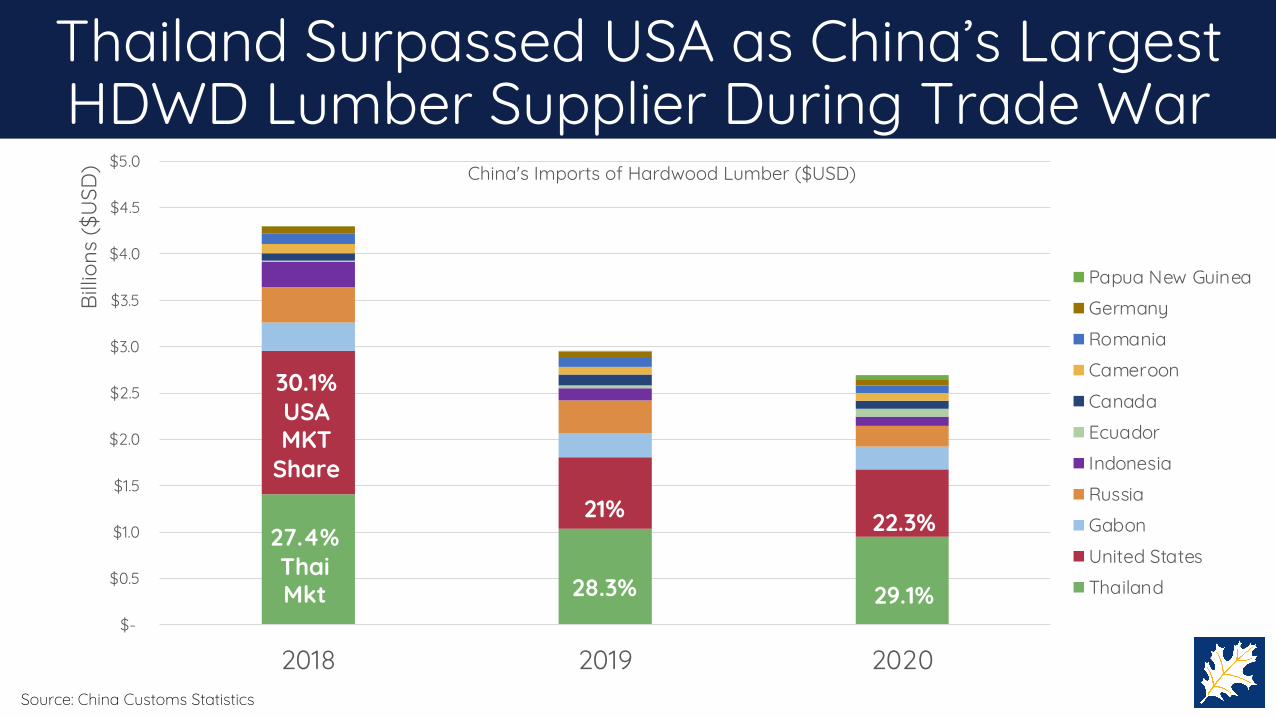
Thailand Surpassed USA as China’s Largest HDWD Lumber Supplier During Trade War
30%USAMKT
Share
27.8%ThaiMkt 29.2%
22.2%21.3%
28.6% $-
$0.5
$1.0
$1.5
$2.0
$2.5
$3.0
$3.5
$4.0
$4.5
$5.0
2018 2019 2020
Billio
ns ($
USD
) China's Imports of Hardwood Lumber ($USD)
Papua New GuineaGermanyRomaniaCameroonCanadaEcuadorIndonesiaRussiaGabonUnited StatesThailand
30.1%USAMKT
Share
27.4%ThaiMkt 29.1%
22.3%21%
28.3%
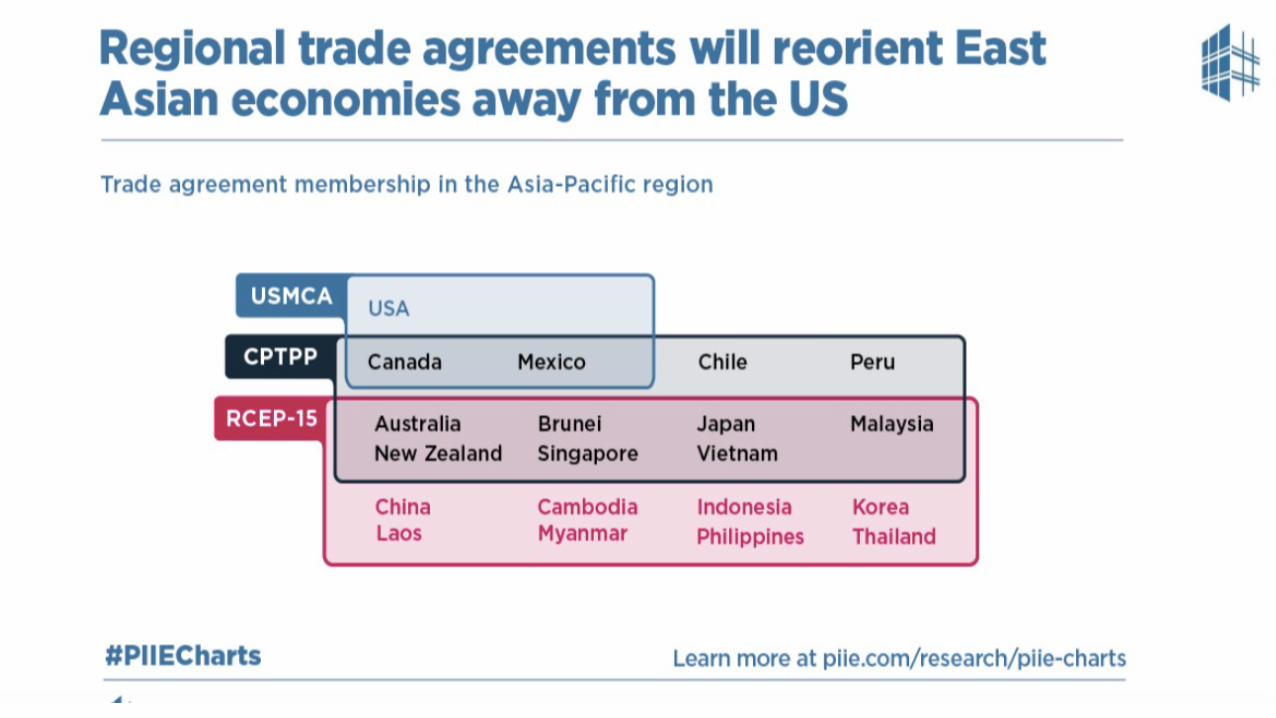
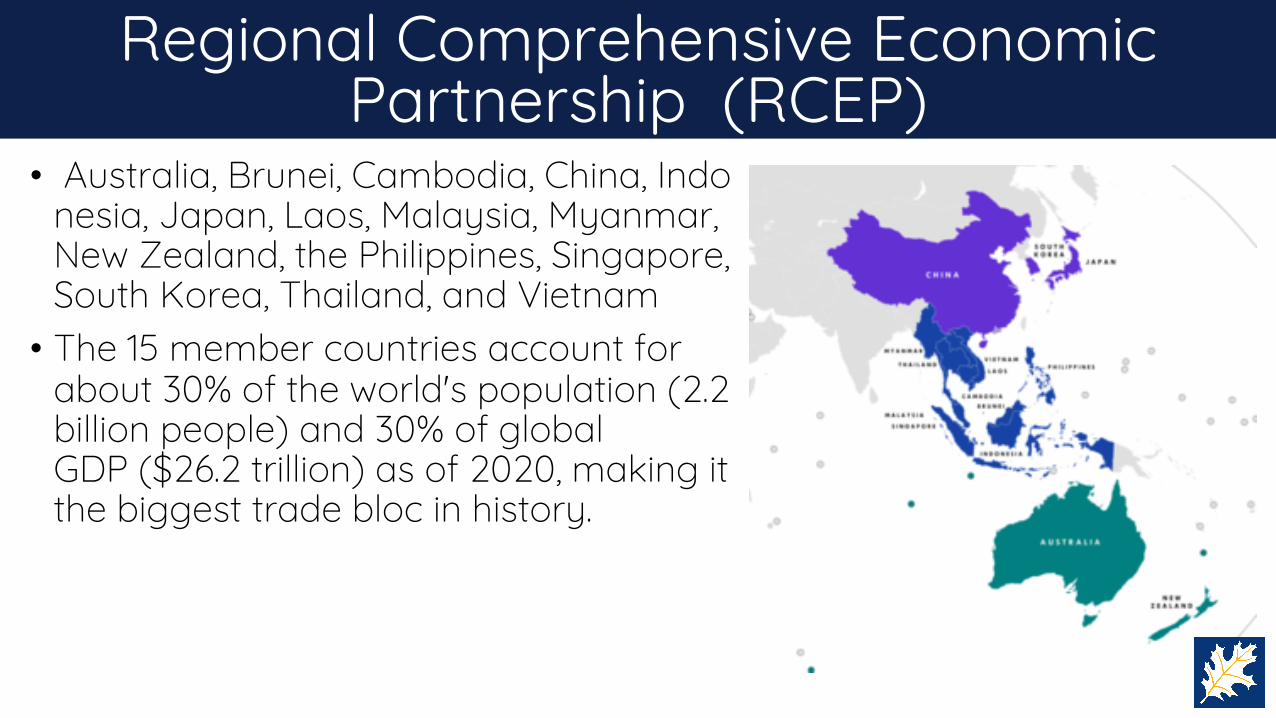
• Australia, Brunei, Cambodia, China, Indonesia, Japan, Laos, Malaysia, Myanmar,New Zealand, the Philippines, Singapore, South Korea, Thailand, and Vietnam• The 15 member countries account for
about 30% of the world's population (2.2 billion people) and 30% of global GDP ($26.2 trillion) as of 2020, making it the biggest trade bloc in history.
Regional Comprehensive Economic Partnership (RCEP)

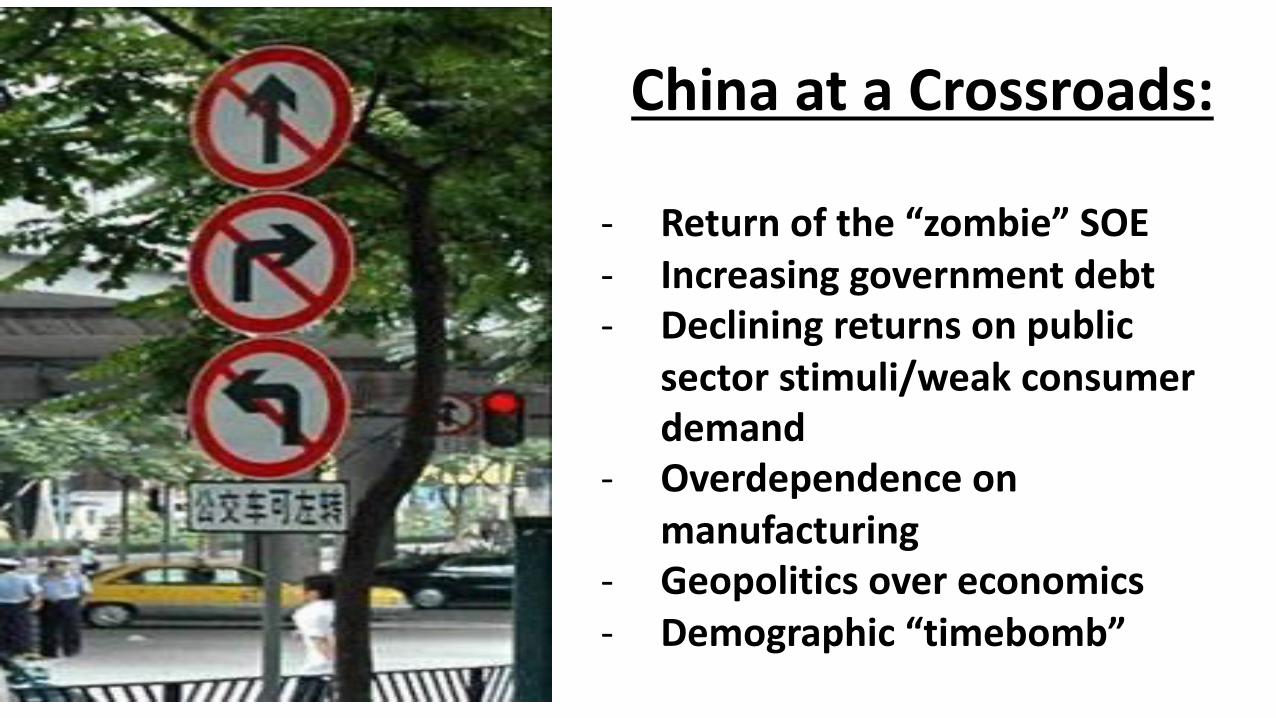
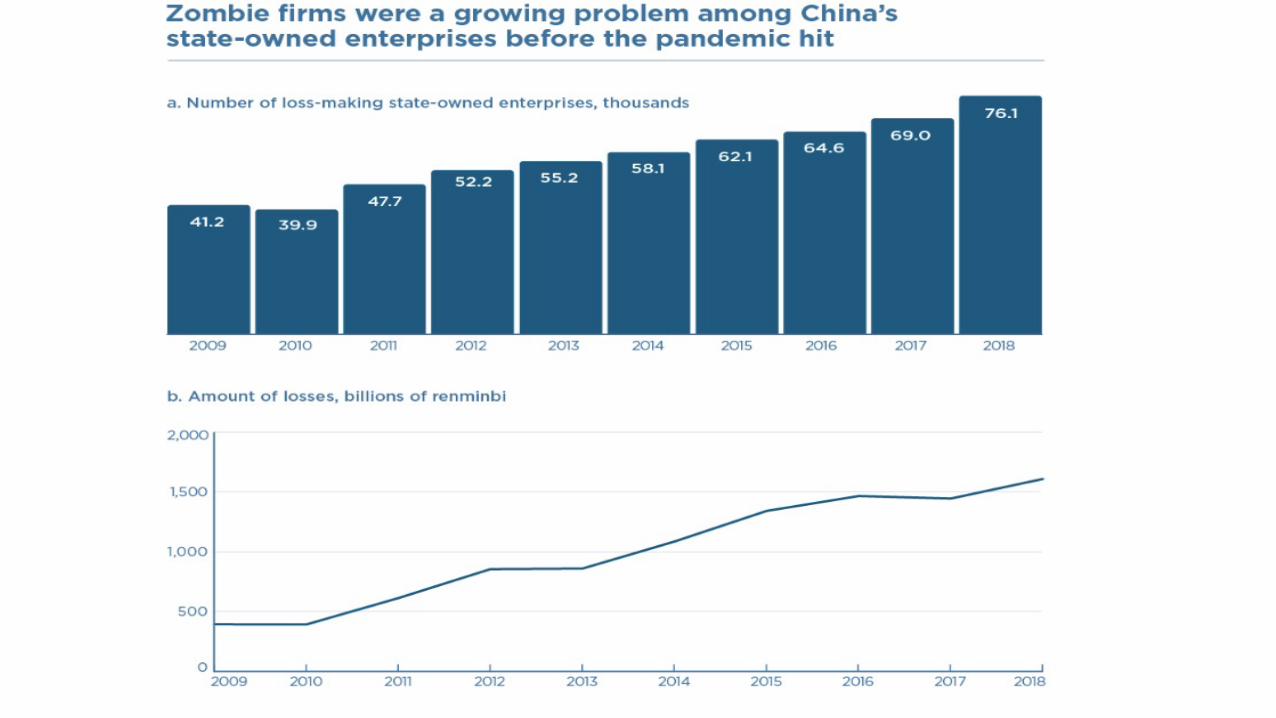
China at a Crossroads:
- Return of the “zombie” SOE- Increasing government debt- Declining returns on public
sector stimuli/weak consumer demand
- Overdependence on manufacturing
- Geopolitics over economics- Demographic “timebomb”


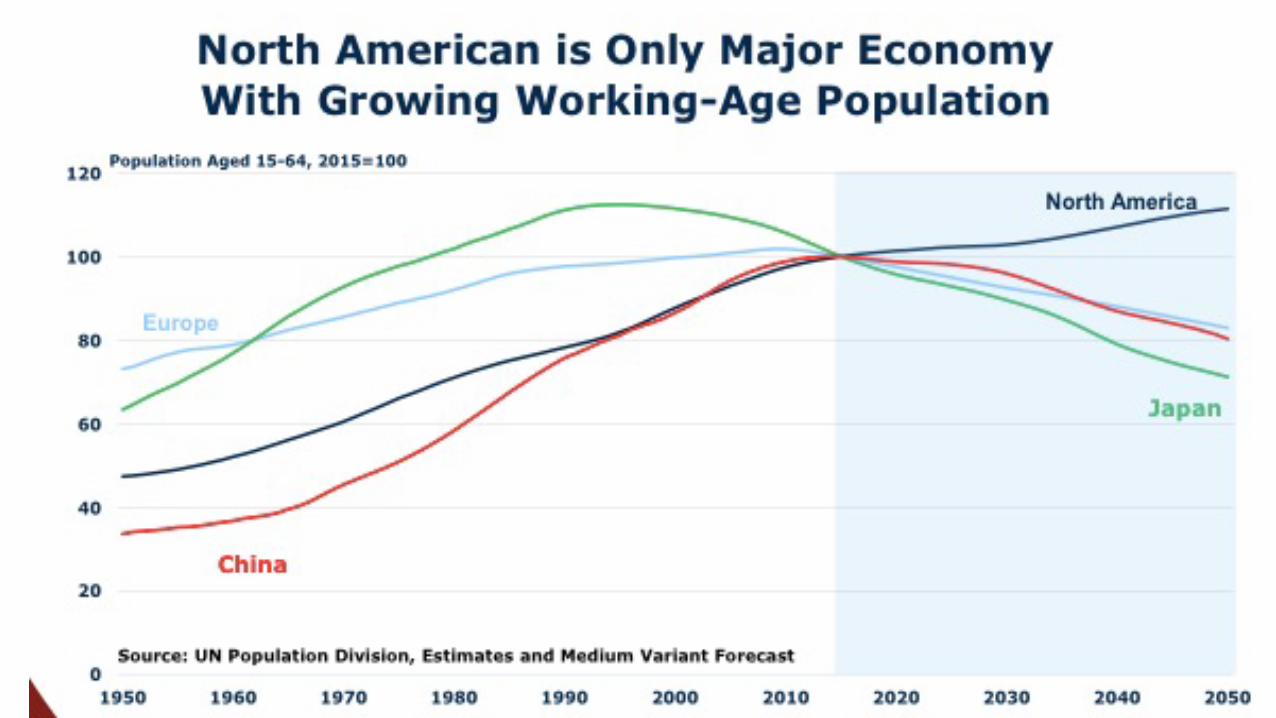
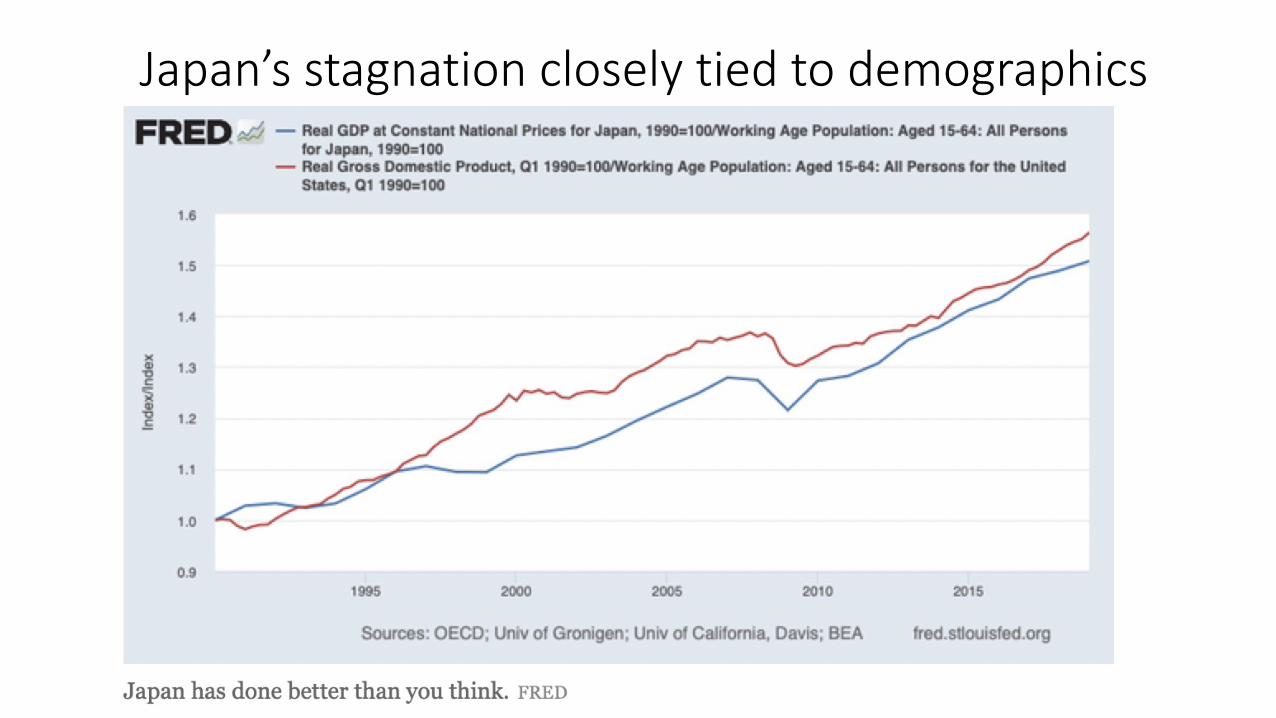
Japan’s stagnation closely tied to demographics

After China, Who’s Next?
Mike SnowAmerican Hardwood Export Council
September, 2021
$-
$20
$40
$60
$80
$100
$120
$140
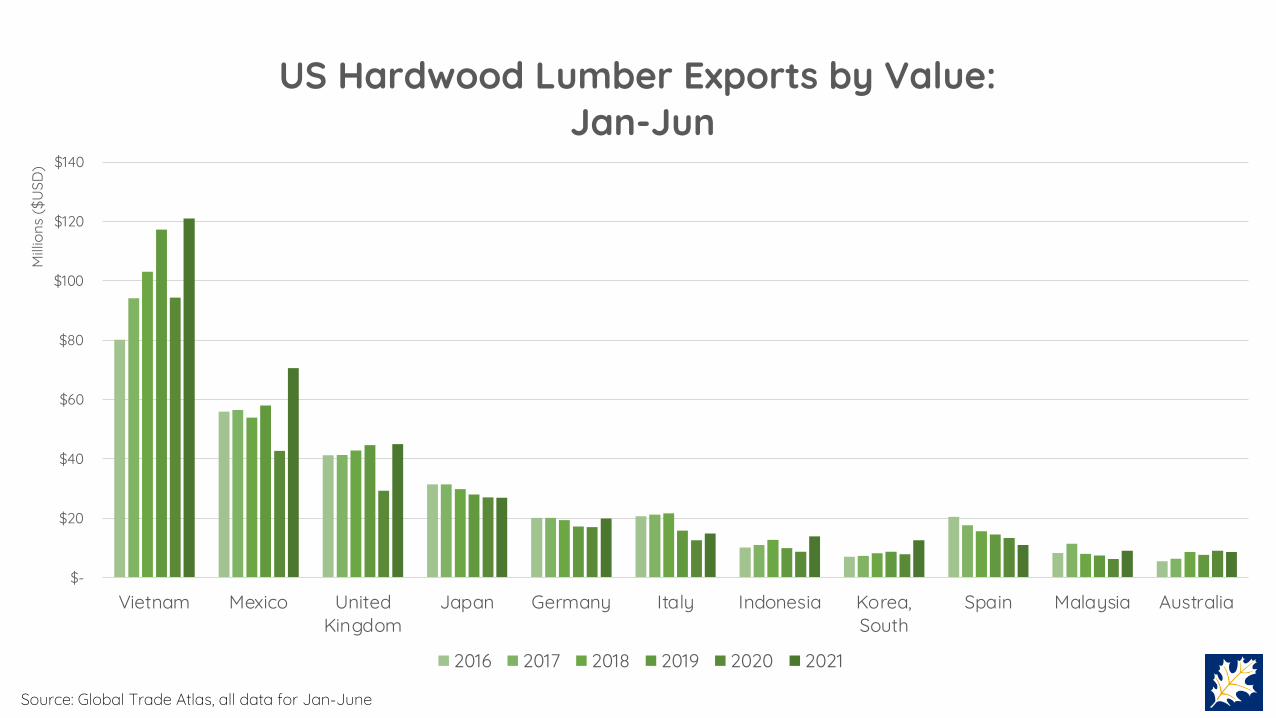
Vietnam Mexico UnitedKingdom
Japan Germany Italy Indonesia Korea,South
Spain Malaysia Australia
Milli
ons
($U
SD)
US Hardwood Lumber Exports by Value:Jan-Jun
2016 2017 2018 2019 2020 2021
Source: Global Trade Atlas, all data for Jan-June


$-
$20
$40
$60
$80
$100
$120
$140
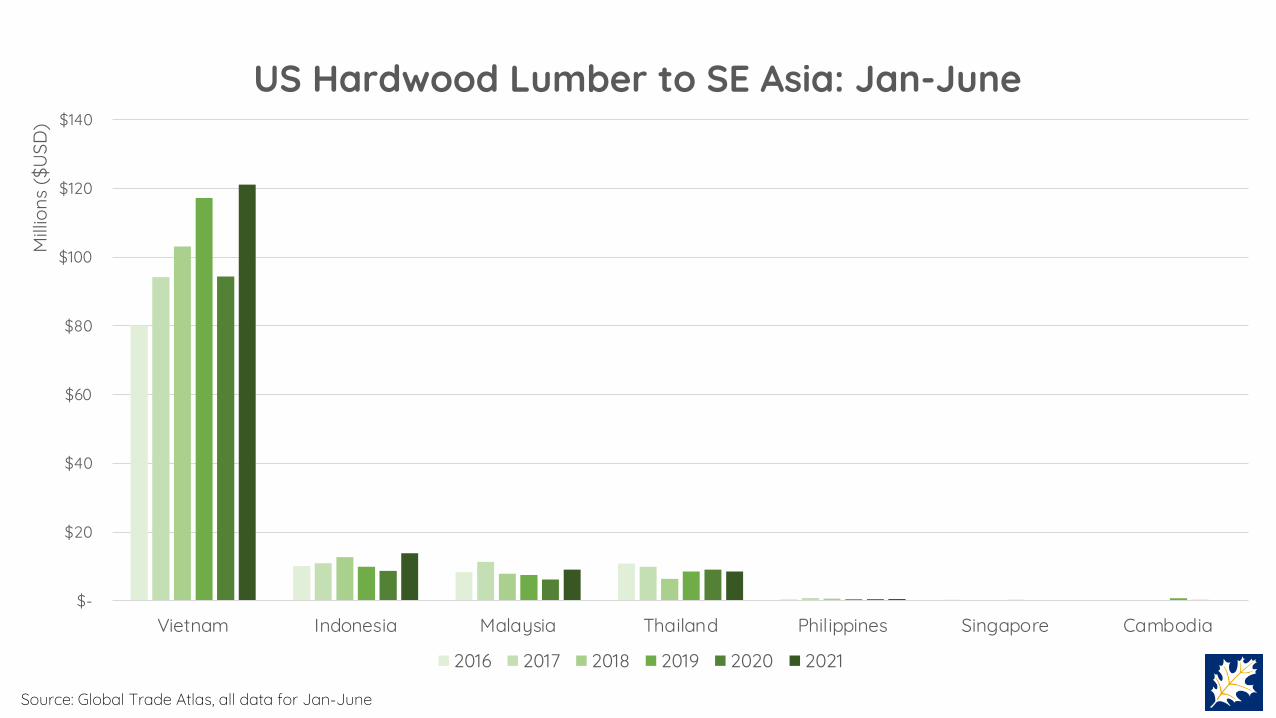
Vietnam Indonesia Malaysia Thailand Philippines Singapore Cambodia
Milli
ons
($U
SD)
US Hardwood Lumber to SE Asia: Jan-June
2016 2017 2018 2019 2020 2021
Source: Global Trade Atlas, all data for Jan-June

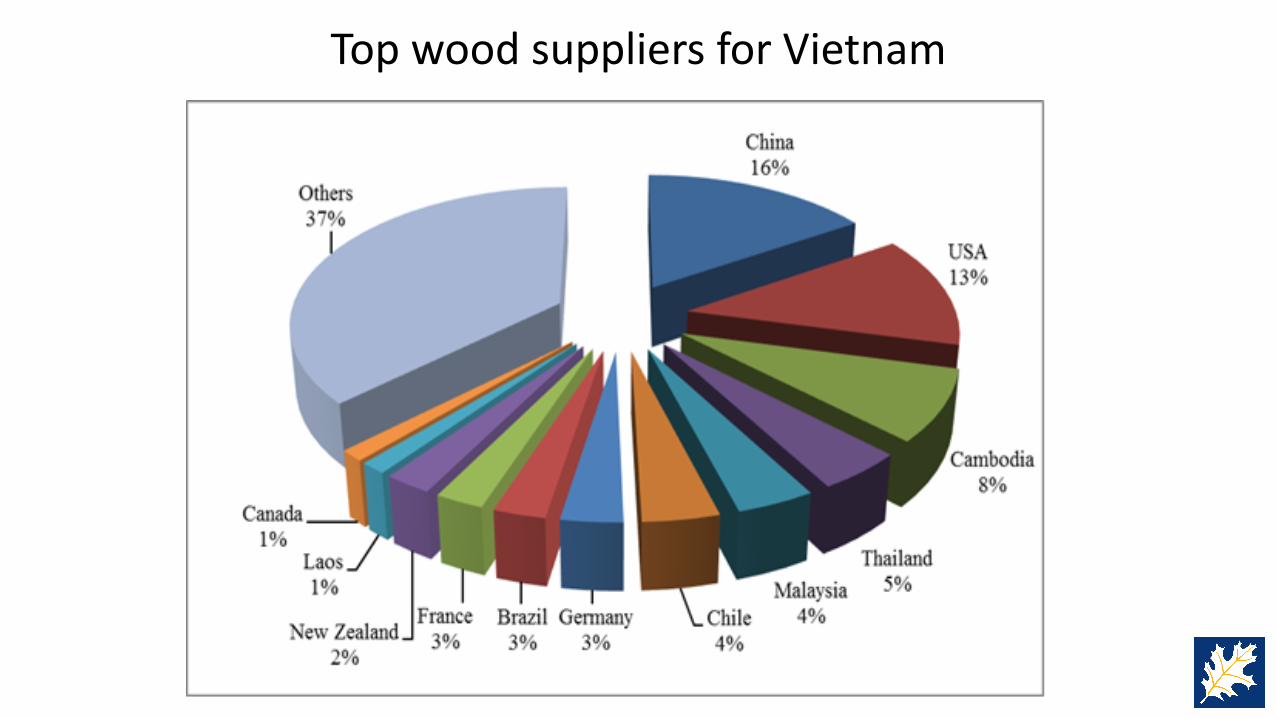
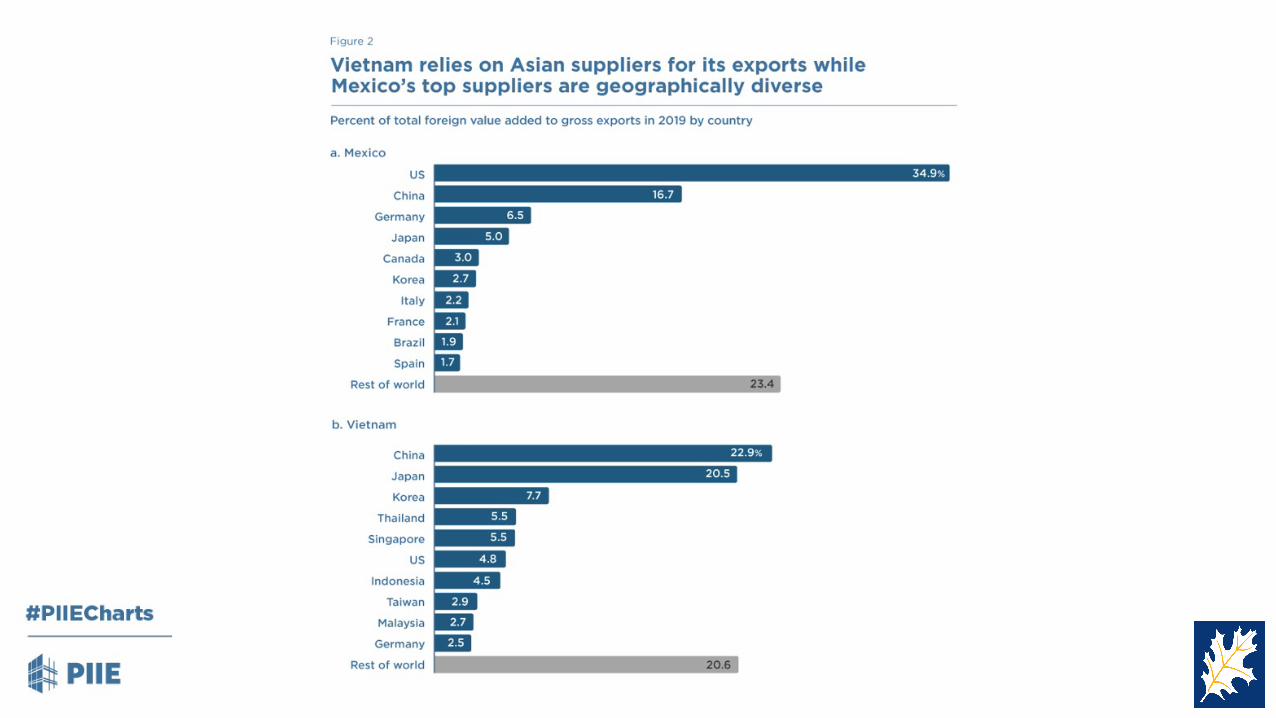
Top wood suppliers for Vietnam

Vietnam Sawn Hardwood Imports from Temperate Regions:2013 to 2019

Mexico/ Latin America
Mike SnowAmerican Hardwood Export Council
September, 2021
$-
$10
$20
$30
$40
$50
$60
$70
$80
2016 2017 2018 2019 2020 2021
Milli
ons
($U
SD)
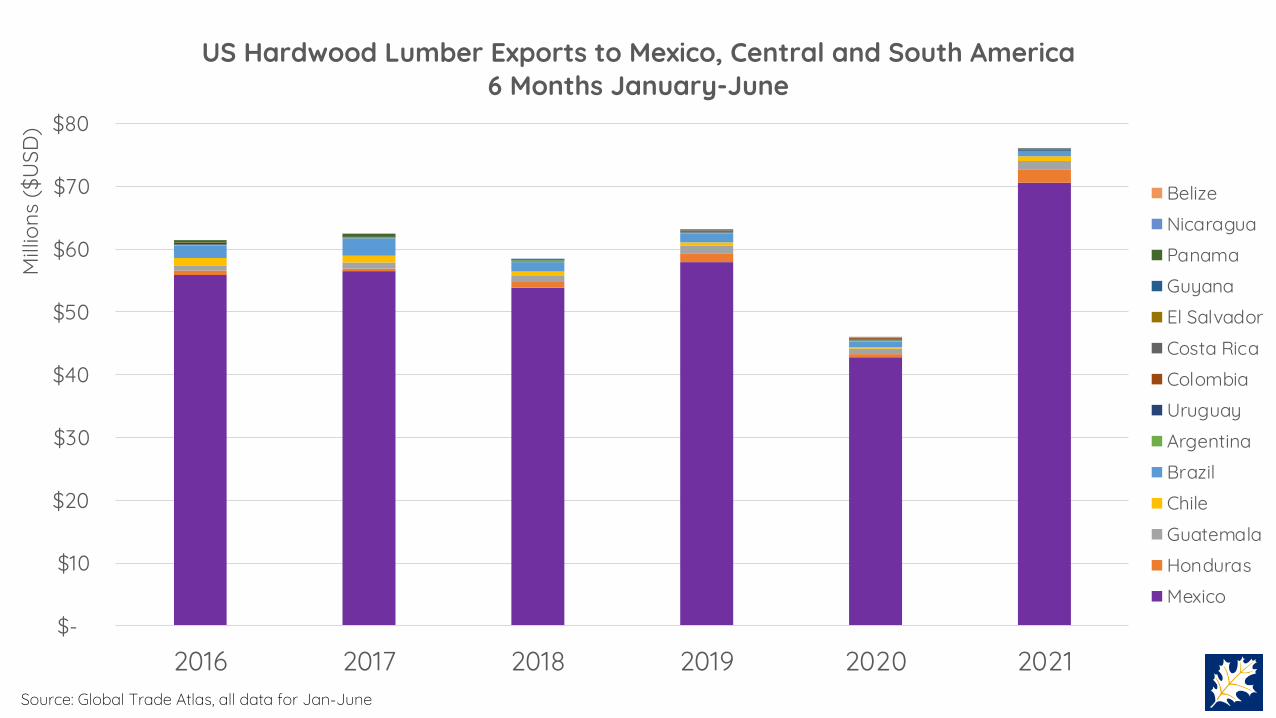
US Hardwood Lumber Exports to Mexico, Central and South America6 Months January-June
BelizeNicaraguaPanamaGuyanaEl SalvadorCosta RicaColombiaUruguayArgentinaBrazilChileGuatemalaHondurasMexico
Source: Global Trade Atlas, all data for Jan-June
0
20,000
40,000
60,000
80,000
100,000
120,000
140,000
160,000
180,000
2016 2017 2018 2019 2020 2021
Volu
me,
m3
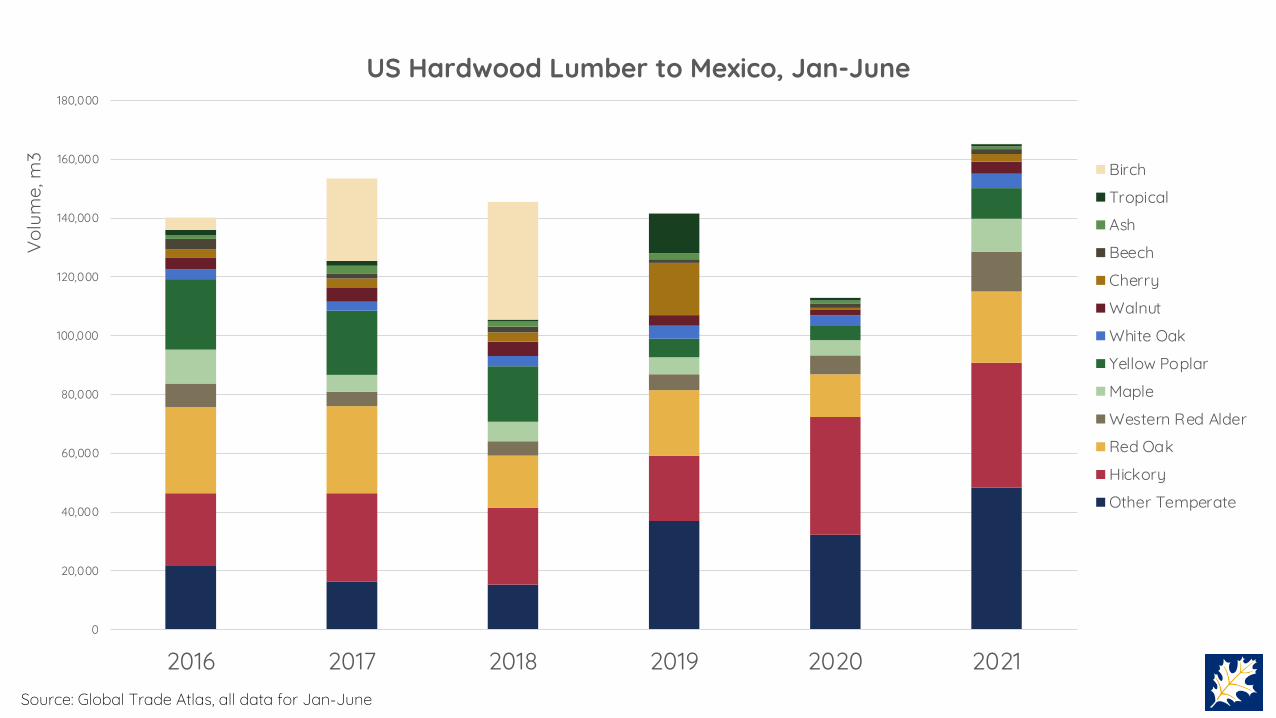
US Hardwood Lumber to Mexico, Jan-June
Birch
Tropical
Ash
Beech
Cherry
Walnut
White Oak
Yellow Poplar
Maple
Western Red Alder
Red Oak
Hickory
Other Temperate
Source: Global Trade Atlas, all data for Jan-June

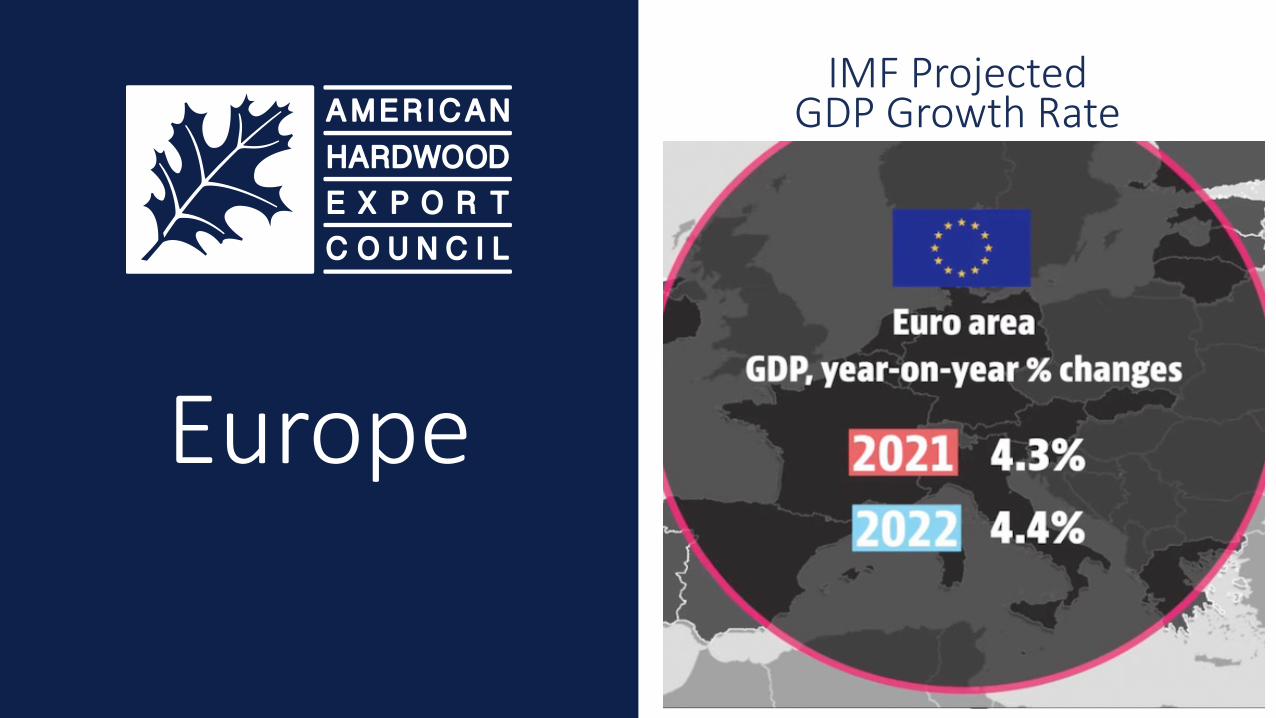
Europe
IMF Projected GDP Growth Rate

Pandemic Recovery Stimulus Spending to Drive Construction Industry:
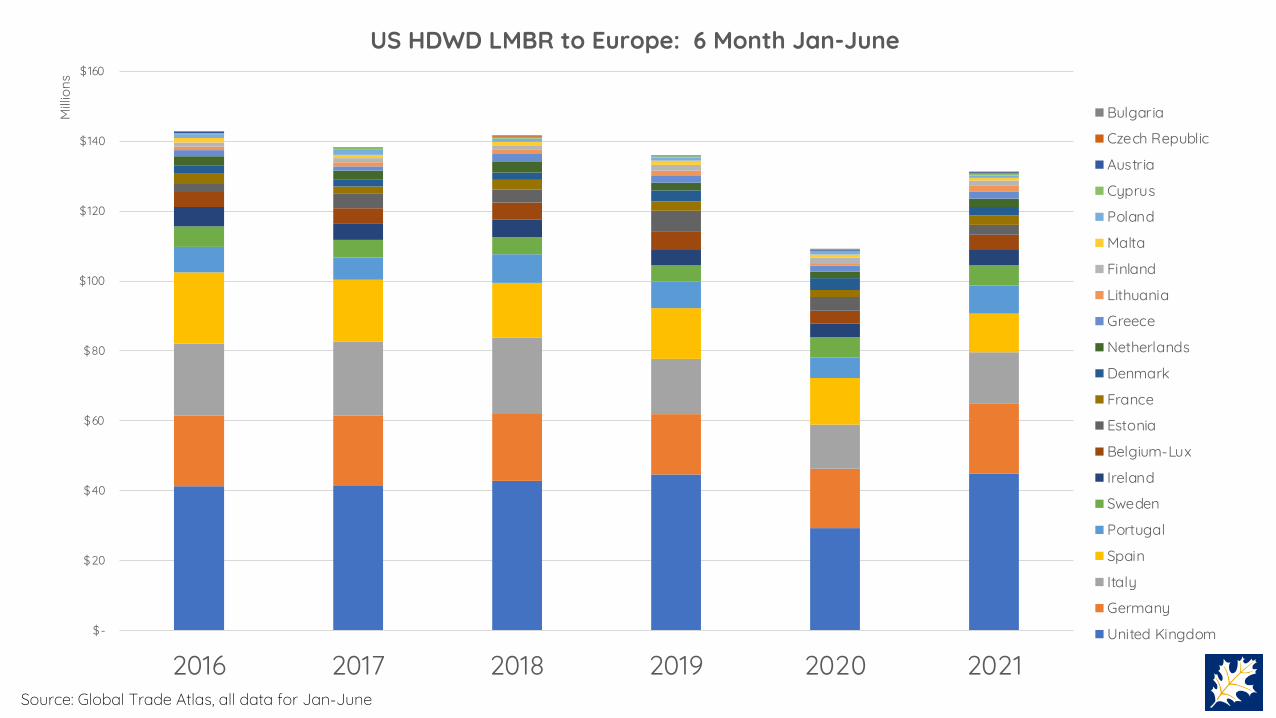
$-
$20
$40
$60
$80
$100
$120
$140
$160
2016 2017 2018 2019 2020 2021
Milli
ons
US HDWD LMBR to Europe: 6 Month Jan-June
Bulgaria
Czech Republic
Austria
Cyprus
Poland
Malta
Finland
Lithuania
Greece
Netherlands
Denmark
France
Estonia
Belgium-Lux
Ireland
Sweden
Portugal
Spain
Italy
Germany
United Kingdom
Source: Global Trade Atlas, all data for Jan-June
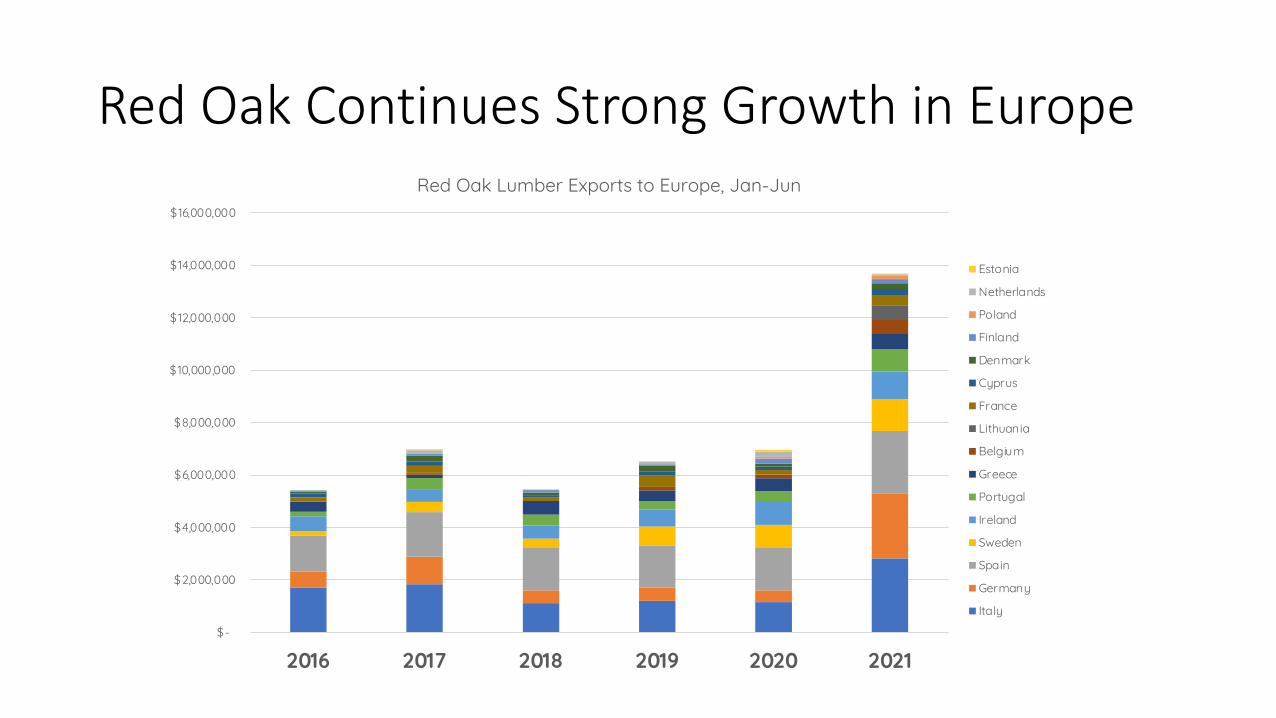
$-
$2,000,000
$4,000,000
$6,000,000
$8,000,000
$10,000,000
$12,000,000
$14,000,000
$16,000,000
2016 2017 2018 2019 2020 2021
Red Oak Lumber Exports to Europe, Jan-Jun
Estonia
Netherlands
Poland
Finland
Denmark
Cyprus
France
Lithuania
Belgium
Greece
Portugal
Ireland
Sweden
Spain
Germany
Italy
Red Oak Continues Strong Growth in Europe

$-
$500,000
$1,000,000
$1,500,000
$2,000,000
$2,500,000
$3,000,000
Italy UnitedKingdom
Germany Spain Sweden Ireland Portugal Greece Belgium Lithuania
Annual Jan-June Red Oak Lumber Exports to EUR Markets
2016 2017 2018 2019 2020 2021
Red Oak Continues Strong Growth in Europe
Source: Global Trade Atlas
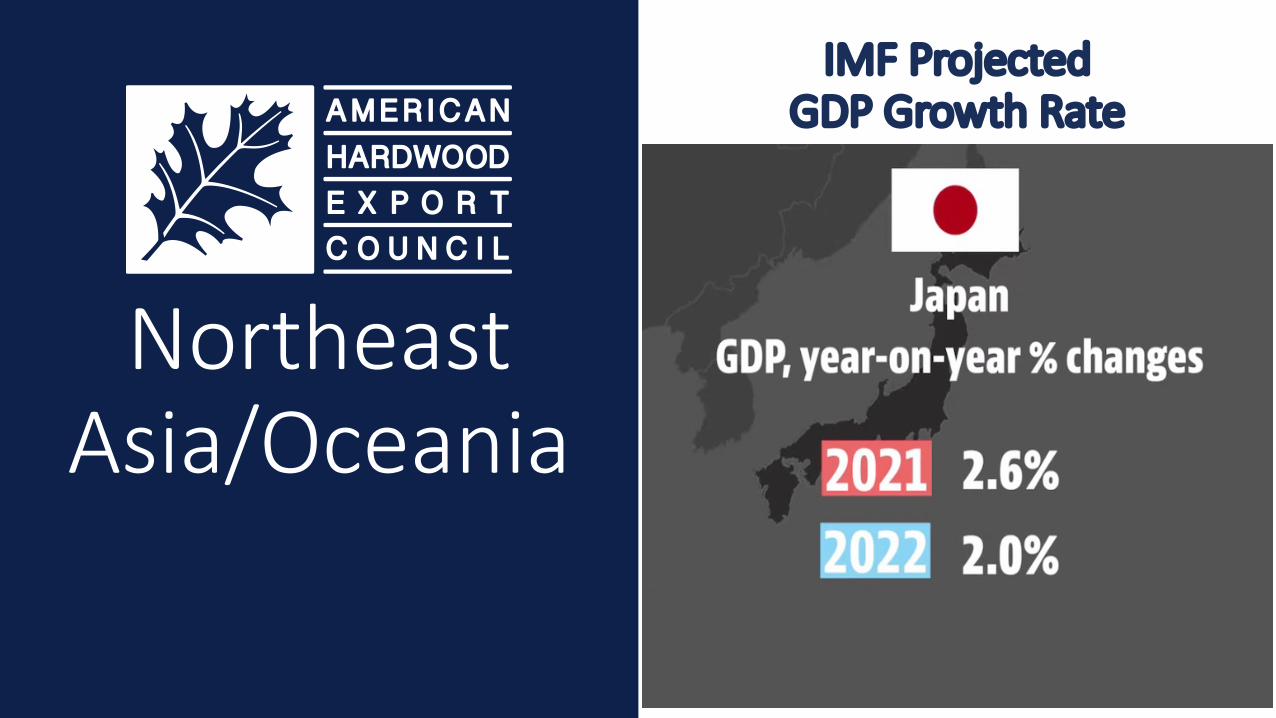
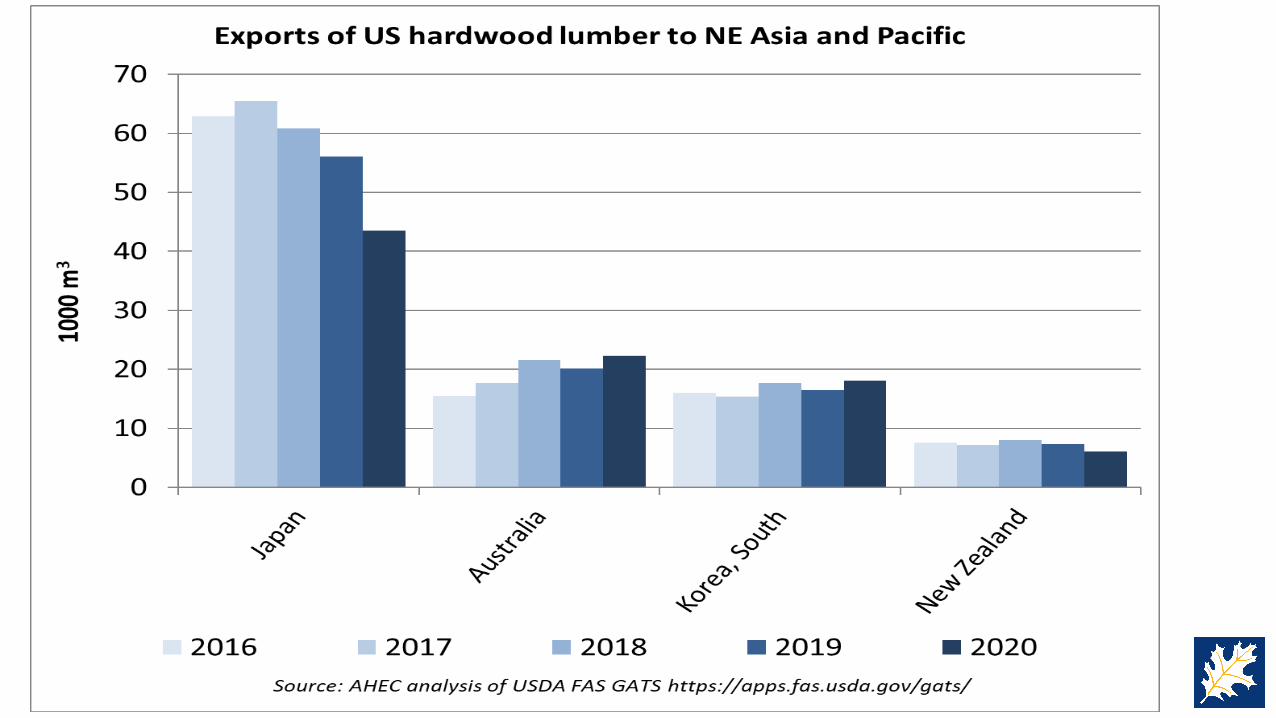
Northeast Asia/Oceania
IMF Projected GDP Growth Rate
$-
$5,000,000
$10,000,000
$15,000,000
$20,000,000
$25,000,000
$30,000,000
$35,000,000
2016 2017 2018 2019 2020 2021
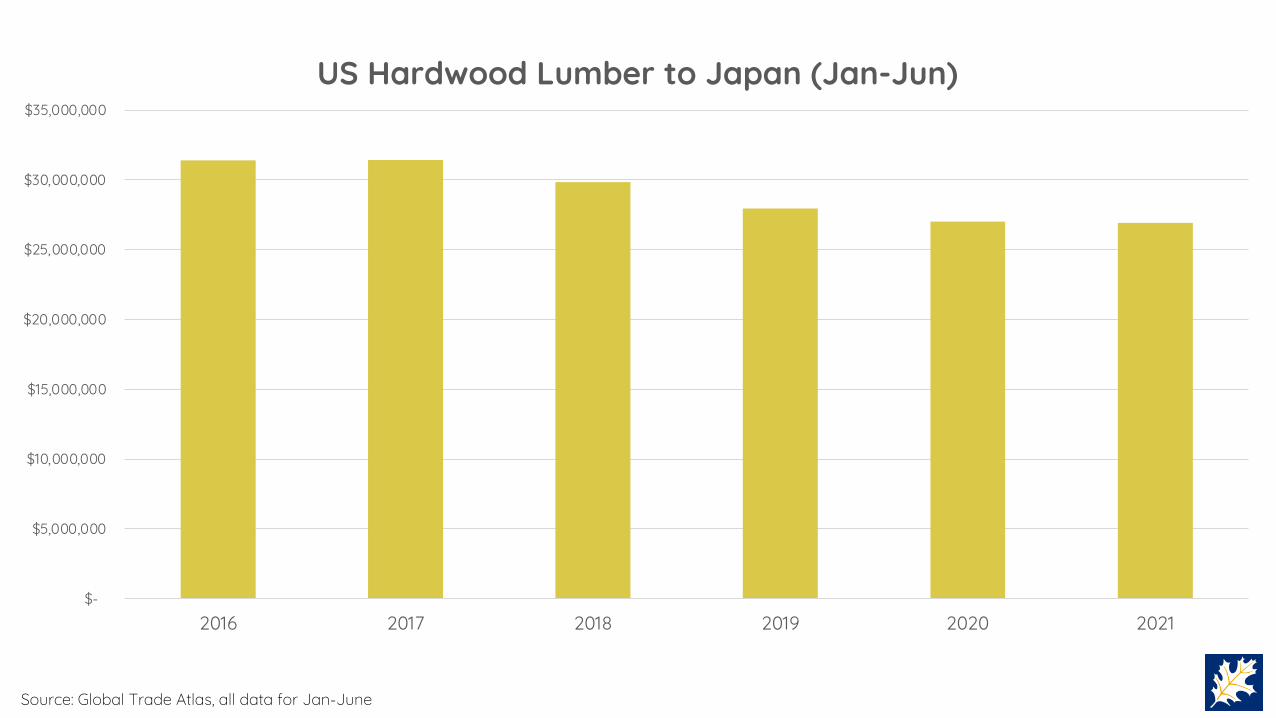
US Hardwood Lumber to Japan (Jan-Jun)
Source: Global Trade Atlas, all data for Jan-June

$-
$200
$400
$600
$800
$1,000
$1,200
Japan EU27+UK China WorldAverage
Vietnam
Average Value per m3 of Lumber in 2020
Source: U.S. Census Bureau Trade Data
Japan is a Premium Market

AMERICAN HARDWOOD EXPORT COUNCIL
JAN-JUN 2021 U.S. HARDWOOD LUMBER EXPORTS – AUSTRALIA & NEW ZEALAND
Jan-Jun 2021 saw an 4% decrease in the volume of US hardwood lumber shipped to Australia and a 98% increase in shipments to New Zealand.
US hardwood veneer exports to Oceania increased by 13% in value to USD 777,000, with the very significant increase in direct shipments to New Zealand.
0
5,000
10,000
15,000
20,000
25,000
30,000
35,000
40,000
45,000
2016 2017 2018 2019 2020 Jan-Jun2020
Jan-Jun2021
New Zealand
Australia
Source: USDA Foreign Agricultural Servicem3
01,0002,0003,0004,0005,0006,0007,0008,0009,000
10,00011,00012,00013,00014,00015,00016,00017,00018,00019,00020,00021,00022,00023,000
2016 2017 2018 2019 2020 Jan-Jun2020
Jan-Jun2021
Others
Tulipwood
Cherry
Hickory
Maple
Ash
Walnut
Red oak
White oak
AMERICAN HARDWOOD EXPORT COUNCIL
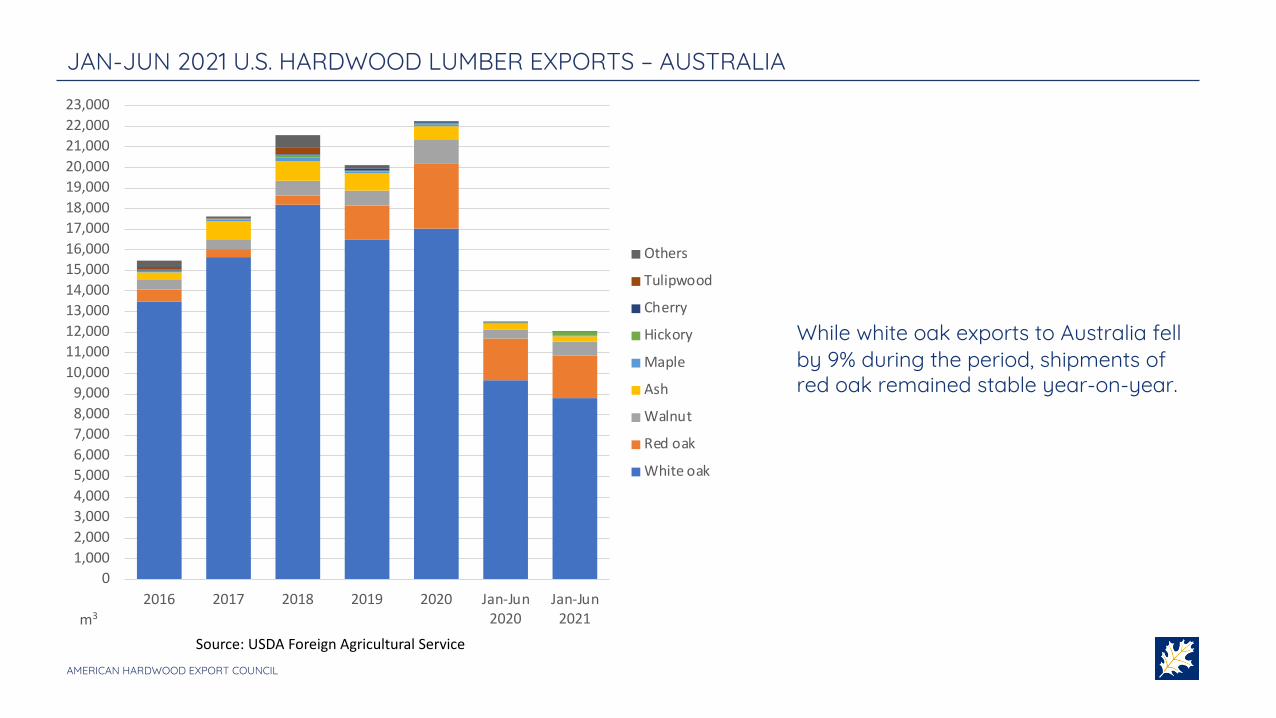
JAN-JUN 2021 U.S. HARDWOOD LUMBER EXPORTS – AUSTRALIA
Source: USDA Foreign Agricultural Servicem3
While white oak exports to Australia fell by 9% during the period, shipments of red oak remained stable year-on-year.

The Middle East, North Africa and
India
OECD Projected GDP Growth Rate
AMERICAN HARDWOOD EXPORT COUNCIL
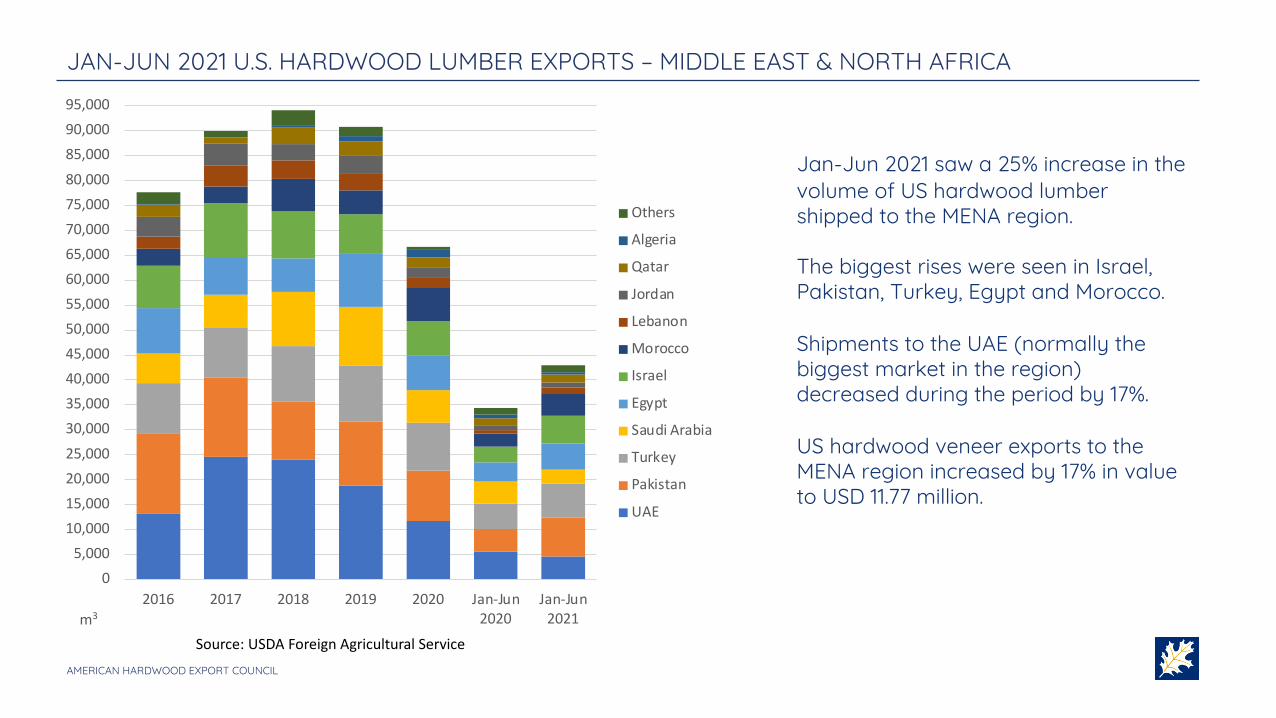
JAN-JUN 2021 U.S. HARDWOOD LUMBER EXPORTS – MIDDLE EAST & NORTH AFRICA
Jan-Jun 2021 saw a 25% increase in the volume of US hardwood lumber shipped to the MENA region.
The biggest rises were seen in Israel, Pakistan, Turkey, Egypt and Morocco.
Shipments to the UAE (normally the biggest market in the region) decreased during the period by 17%.
US hardwood veneer exports to the MENA region increased by 17% in value to USD 11.77 million.
05,000
10,00015,00020,00025,00030,00035,00040,00045,00050,00055,00060,00065,00070,00075,00080,00085,00090,00095,000
2016 2017 2018 2019 2020 Jan-Jun2020
Jan-Jun2021
Others
Algeria
Qatar
Jordan
Lebanon
Morocco
Israel
Egypt
Saudi Arabia
Turkey
Pakistan
UAE
Source: USDA Foreign Agricultural Servicem3

0
5,000
10,000
15,000
20,000
25,000
30,000
35,000
40,000
45,000
50,000
55,000
60,000
65,000
70,000
75,000
80,000
85,000
2016 2017 2018 2019 2020 Jan-Jun2020
Jan-Jun2021
Others
Cherry
Maple
Tulipwood
White oak
Walnut
Ash
Red oak
AMERICAN HARDWOOD EXPORT COUNCIL
JAN-JUN 2021 U.S. HARDWOOD LUMBER EXPORTS – MIDDLE EAST & NORTH AFRICA
Source: USDA Foreign Agricultural Servicem3
Tulipwood – 37% increase in exports -main importers were Israel and Turkey.
White oak – 11% increase in exports -main importers were Turkey and Israel.
Walnut – 170% increase in exports –main importers were Pakistan, Turkey and Israel.
Ash – 15% increase in exports - main importers were Pakistan, Turkey (for TMT) and the UAE.
Red oak - 17% increase in exports -main importers were Saudi Arabia, Morocco, UAE and Egypt, but in demand in all markets in the region.
AMERICAN HARDWOOD EXPORT COUNCIL
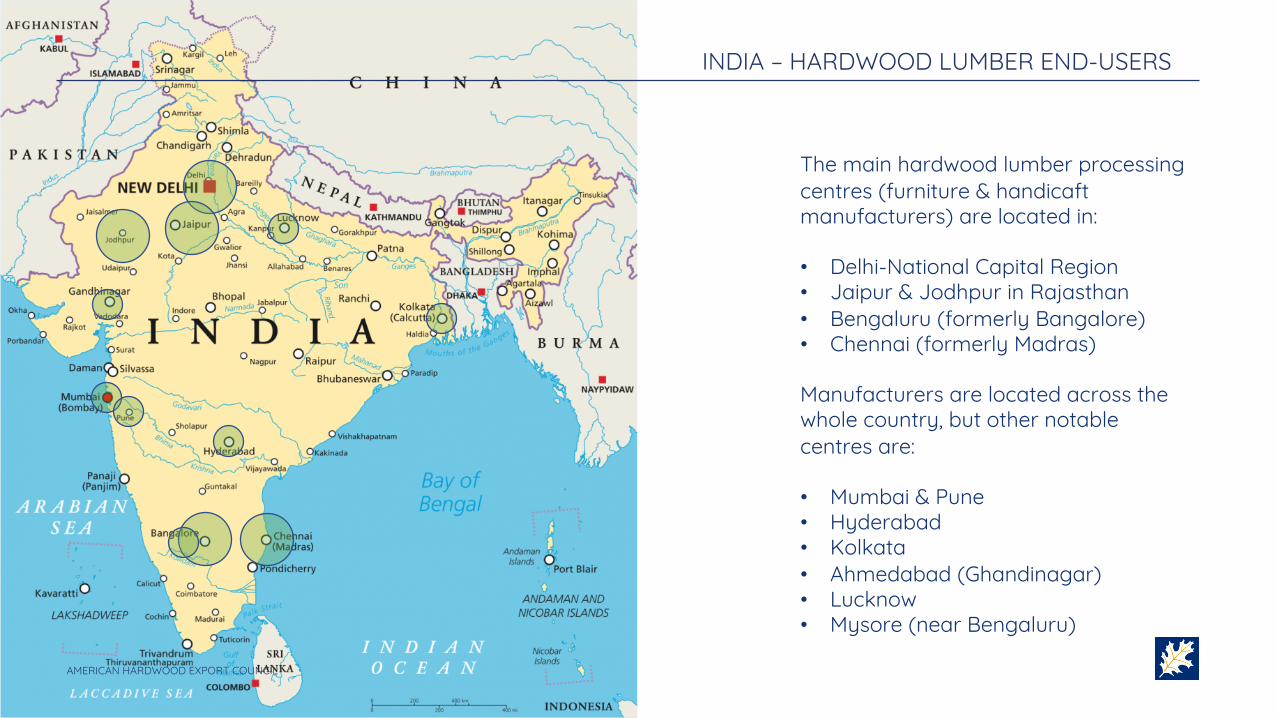
INDIA – HARDWOOD LUMBER END-USERS
The main hardwood lumber processing centres (furniture & handicaftmanufacturers) are located in:
• Delhi-National Capital Region• Jaipur & Jodhpur in Rajasthan• Bengaluru (formerly Bangalore)• Chennai (formerly Madras)
Manufacturers are located across the whole country, but other notable centres are:
• Mumbai & Pune• Hyderabad• Kolkata• Ahmedabad (Ghandinagar)• Lucknow• Mysore (near Bengaluru)
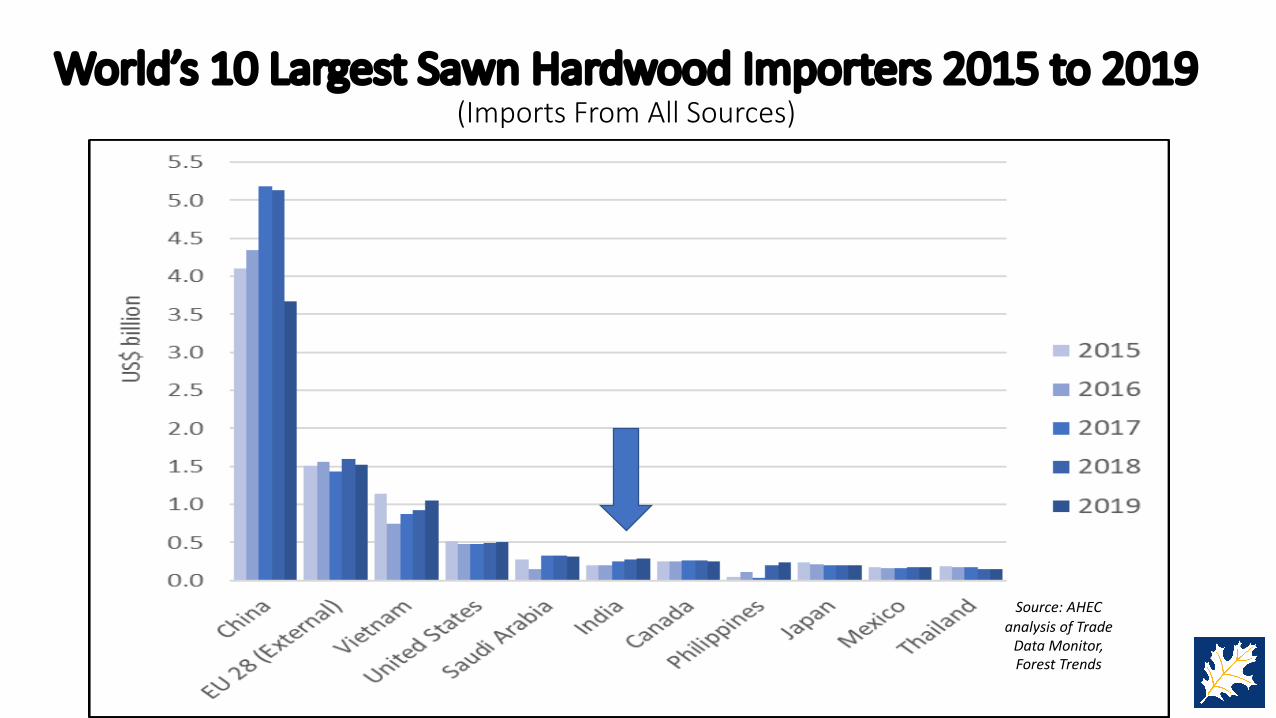
World’s 10 Largest Sawn Hardwood Importers 2015 to 2019(Imports From All Sources)
Source: AHEC analysis of Trade
Data Monitor, Forest Trends
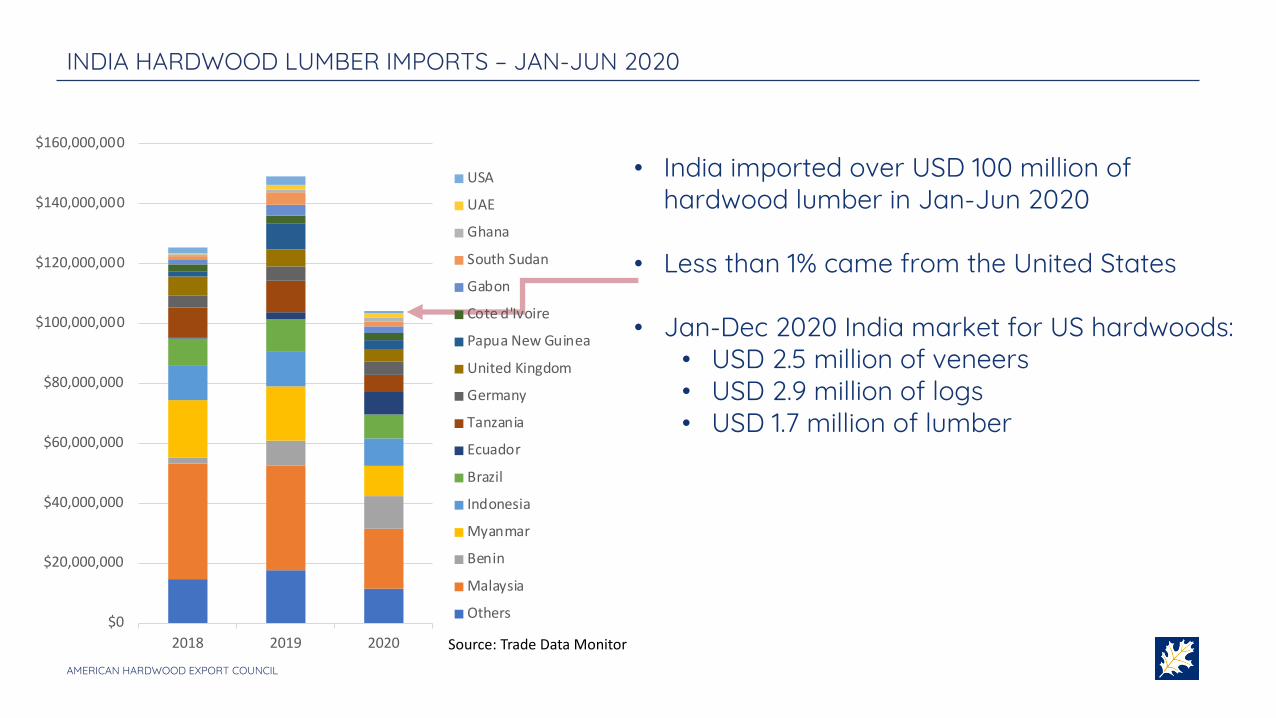
• India imported over USD 100 million of hardwood lumber in Jan-Jun 2020
• Less than 1% came from the United States
• Jan-Dec 2020 India market for US hardwoods:• USD 2.5 million of veneers• USD 2.9 million of logs• USD 1.7 million of lumber
Source: Trade Data Monitor$0
$20,000,000
$40,000,000
$60,000,000
$80,000,000
$100,000,000
$120,000,000
$140,000,000
$160,000,000
2018 2019 2020
USA
UAE
Ghana
South Sudan
Gabon
Cote d'Ivoire
Papua New Guinea
United Kingdom
Germany
Tanzania
Ecuador
Brazil
Indonesia
Myanmar
Benin
Malaysia
Others
AMERICAN HARDWOOD EXPORT COUNCIL
INDIA HARDWOOD LUMBER IMPORTS – JAN-JUN 2020
0
500
1,000
1,500
2,000
2,500
3,000
3,500
4,000
2016 2017 2018 2019 2020 Jan-Jun2020
Jan-Jun2021
Birch
Tulipwood
Cherry
Maple
Western red alder
Walnut
Other Temperate
Red oak
Tropical
Ash
White oak
Hickory
AMERICAN HARDWOOD EXPORT COUNCIL
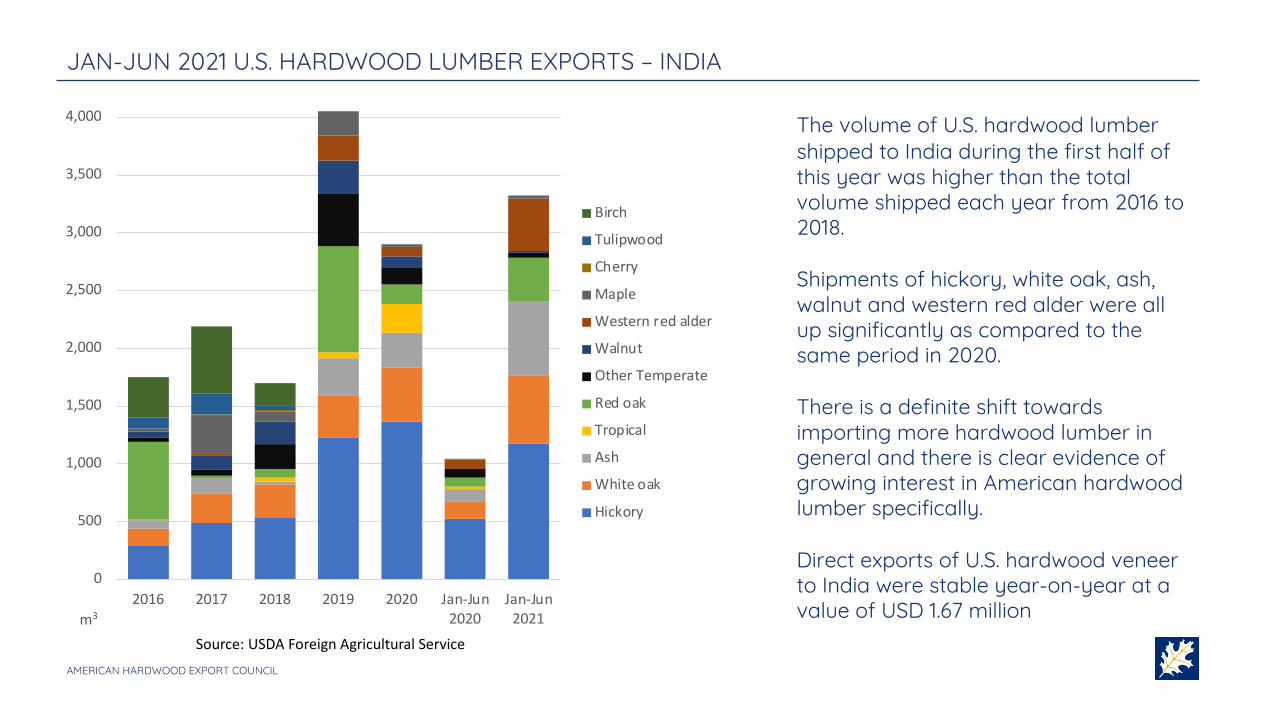
JAN-JUN 2021 U.S. HARDWOOD LUMBER EXPORTS – INDIA
The volume of U.S. hardwood lumber shipped to India during the first half of this year was higher than the total volume shipped each year from 2016 to 2018.
Shipments of hickory, white oak, ash, walnut and western red alder were all up significantly as compared to the same period in 2020.
There is a definite shift towards importing more hardwood lumber in general and there is clear evidence of growing interest in American hardwood lumber specifically.
Direct exports of U.S. hardwood veneer to India were stable year-on-year at a value of USD 1.67 million
Source: USDA Foreign Agricultural Servicem3
AMERICAN HARDWOOD EXPORT COUNCIL
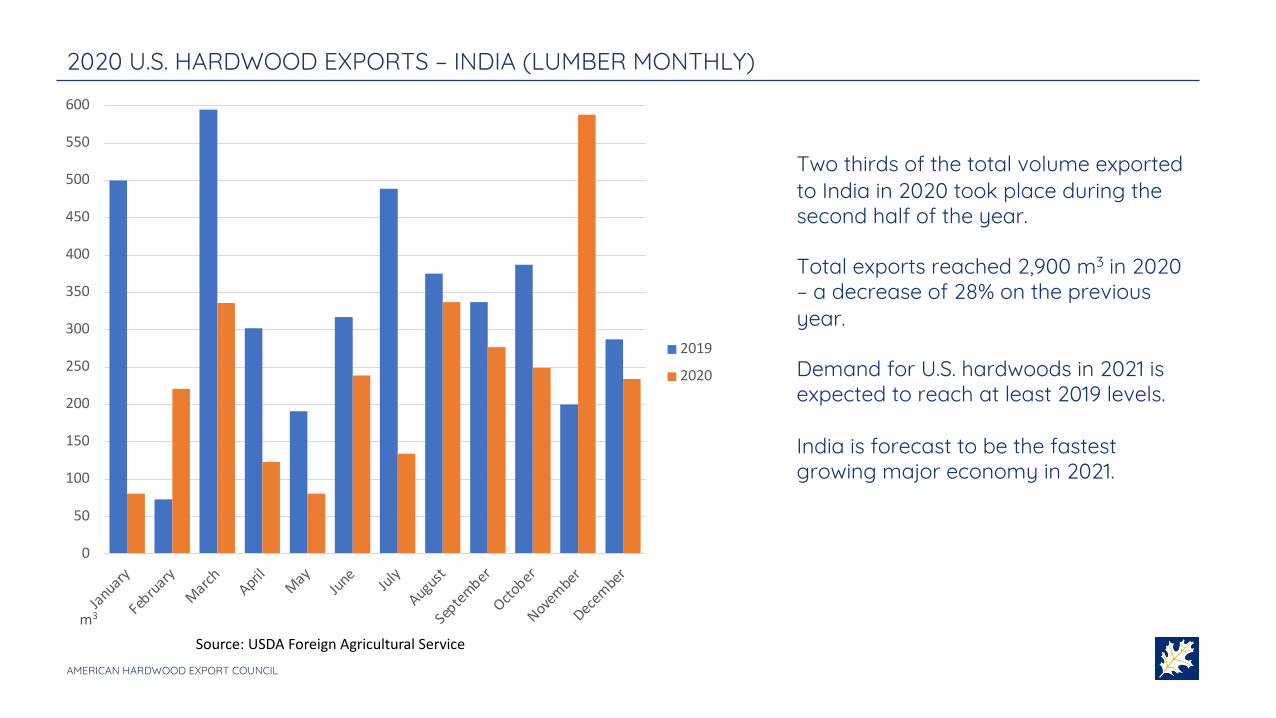
2020 U.S. HARDWOOD EXPORTS – INDIA (LUMBER MONTHLY)
Two thirds of the total volume exported to India in 2020 took place during the second half of the year.
Total exports reached 2,900 m3 in 2020 – a decrease of 28% on the previous year.
Demand for U.S. hardwoods in 2021 is expected to reach at least 2019 levels.
India is forecast to be the fastest growing major economy in 2021.
Source: USDA Foreign Agricultural Servicem3
0
50
100
150
200
250
300
350
400
450
500
550
600
January
February
March AprilMay
JuneJuly
August
September
October
November
December
2019
2020


Thank you. [email protected]