the new nhs and the children’s strategic clinical network tracy parr scn lead children and...
TRANSCRIPT

The new NHS and the Children’s Strategic Clinical Network
Tracy Parr
SCN Lead Children and Maternity
Leaders for London
January 28th 2014
London Strategic Clinical Networks

2
Structure of Presentation
• Overview of new NHS structures• National initiatives
• General• Children-specific
• Strategic Clinical Networks – overview• Children’s health in London• Children's strategic clinical network London

3
The NHS in England structure and responsibilities
Health and Social Care act 2012 changed• Structure• Accountabilities• Funding arrangements• Working arrangements

Health and Social Care Bill 2010
4

Health and Social Care from April 2013
2013
5

6
7
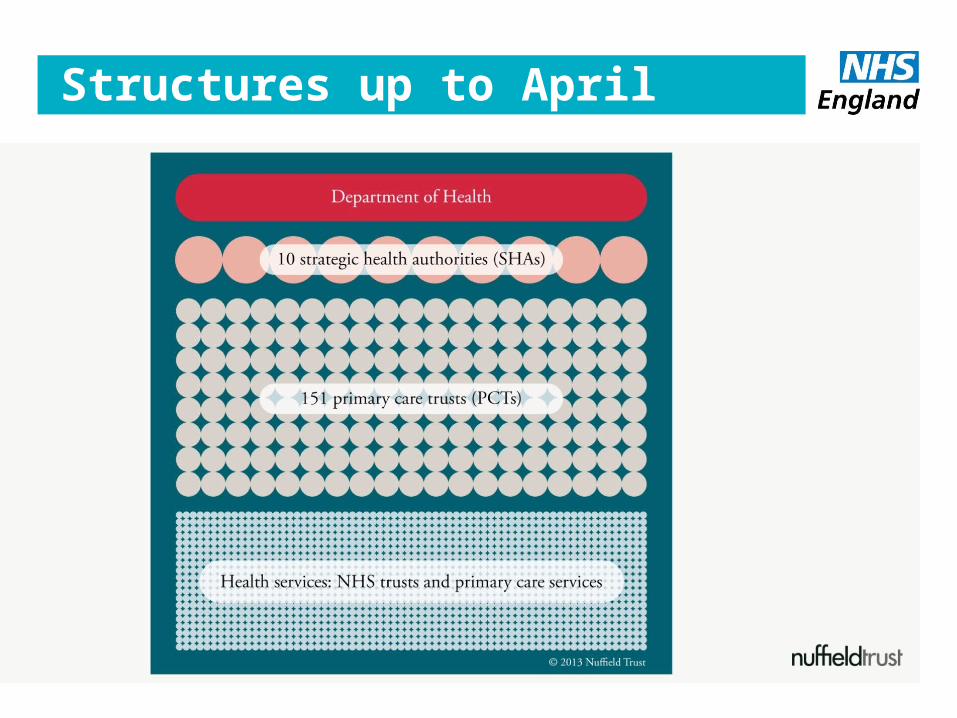
Structures up to April 20013

8
NHS in England Apirl 2013

9
New funding Arrangements

10
Regulation and Accountability - providers

11
Commissioners – performance management and guidance

12
Patient and public involvement

13
Expectations of how £95billion will be spent

Children in the UK
14

Word acquisition - inequalities
15 Hart and Risley 1995

C and YP Health Outcome Forum
16

17

NHS Outcomes Framework
18

Outcomes for Children
Domain One – Preventing people from dying prematurely
Reducing deaths in babies and young children
• Infant mortality
• Neonatal mortality and stillbirths
• Five year survival from all cancers in children
Domain Two – Enhancing quality of life for people with long
term conditions
Reducing time spent in hospital with long term conditions
• Unplanned hospital admissions for asthma diabetes and epilepsy in
under 19s19

Outcomes for Children
Domain Three – Helping people to recover from episodes of ill health or
following injury
Preventing lower respiratory tract infections (LRTI) in chidlren from becoming serious
• Emergency admissions for children with LRTI
Domain Four – Ensuring people have a positive experience of care
Improving C and YP experience of healthcare
• C and YP experience of outpatient services
20

Outcomes for Children
Domain Five – Treating and caring for people in a safe environment and
protecting them from avoidable harm
Delivering safe care to chidlrne in acute settings
• Incidence of harm to chidlren due to “failure to monitor”
21

Adult Social Care Outcomes Framework
22

Public Health Outcomes Framework
23

Public Health Outcomes Framework
24

25
London’s Children
• Population of London 7.8 million (ONS 2011)
• 2,049,576 children aged 0 – 19 in London
• Approx 1.7 million children in Kent Surrey
Sussex, and East of England many of whom
access tertiary services in London
• 134,186 live births in London 2012 (ONS)

26
Why a Children’s SCN?
UK has a higher all-cause childhood
mortality rate compared with Sweden,
France, Italy, Germany and Netherlands

London has higher than expected mortality for 1 – 19 year olds
27Data courtesy of London Health Programmes

Hospital mortality for children in London is rising compared to other areas of UK
28

There are low rates of consultant review of paediatric emergency admissions within 12 hours
29

78% of London trusts undertake elective surgery on less than two children per week
30

Most surgery on children is being undertaken by adult surgeons
31

32
What is a Strategic Clinical Network (SCN)?
• Area requiring large scale change
• Resistant to previous attempts at improvement
(or not examined holistically)
• Strategic pan-London approach
• Provide expert advice to commissioners
• Contrast with Operational Delivery Networks

Over 50% of hospitals do not have a paediatric anaesthetist available
33

Attendance at A & E by children is very high in London
34
ACCIDENT & EMERGENCY attendances, ages 0-17, London 2010-11
Source: PHE ChiMat using HES Data
0 100 200 300 400 500 600
BarnetHavering
HarrowCity of London
Richmond upon ThamesRedbridge
Barking and DagenhamBexley
Waltham ForestBromley
Kingston upon ThamesCamden
HillingdonLONDON
SuttonLambeth
Kensington and ChelseaCroydon
Hammersmith and FulhamIslington
EalingNewham
SouthwarkTower Hamlets
MertonBrent
HounslowEnfield
LewishamGreenwich
Westminster, City ofHackneyHaringey
WandsworthEngland
Accident & Emergency attendances, rate per 100,000 population aged 0-17
Accident & Emergency attendances, rate per 100,000 population aged 0-17, England LAs, 2010-11
96.6 - 243.9
244.0 - 301.9
302.0 - 336.9
337.0 - 413.9
414.0 - 880.6
National quintilesrate per 100,000
0
100
200
300
400
500
600
700
800
900
London - lowest
London average
England average
London - highest
26 London boroughs have A and E attendance higher than the national average for children
Data courtesy of ChiMat

Some boroughs have high rates of admission to hospital for asthma
35
ASTHMA Emergency hospital admissions, ages 0-18, London 2011/12
Source: DMIT using HES Data
0 50 100 150 200 250 300 350 400 450
WestminsterWandsworth
Richmond and TwickenhamHavering
EnfieldBarnet
KingstonGreenwich
Kensington and ChelseaHillingdon
Tower HamletsHounslow
BromleySutton and Merton
HaringeyBexley
CamdenHammersmith and Fulham
LONDONNewham
BrentCity and Hackney
SouthwarkHarrow
RedbridgeEaling
LewishamBarking and Dagenham
LambethIslingtonCroydon
Waltham ForestEngland
Emergency hospital admission rate per 100,000 population aged 0-18
Emergency hospital admission rate per 100,000 population aged 0-18, England PCTs, 2011/12
74.8 - 142.0
142.1 - 162.0
162.1 - 210.0
210.1 - 262.0
262.1 - 495.7
National quintilesrate per 100,000
0
50
100
150
200
250
300
350
400
450
500
London - lowest
London average
England average
London - highest

Thematic examination of SUIs involving children in London
36
Aim To identify themes and learning from Serious Untoward Incidents (SUIs) to help inform the work of the Children’s SCN
Methodology
• SUIs involving children requested from STEIS 2008 - 2013
• Those indicating system failure identified n = 86
• Full report requested from Trusts/PCT/CCG
• 59 responses received from 29 organisations
• Common themes identified and collated

Thematic examination of SUIs involving children in London
37
Lack of recognition of sick child
Inexperience/lack of expertise
Worlklaod
Communication
Failure to escalate to consultant/senior review
Documentation
Transfer to tertiary centre

Failures of Care
38
• Half of all children subsequently found to have meningococcal infection are sent home from the first primary care consultation
• Approximately 75% of admissions of children with asthma could have been prevented with better primary care
• Over a third of short stay admissions in infants are for minor illnesses that could have been better managed in the community

39
Clinical areas covered by SCNs

SCN core elementsComprehensive
networks of clinical
expertise
Leadership for
accelerated change at
pace
Agreed priorities for improvement
Holistic view of health
and social care
Widespread engagement
Meaningful and effective
patient involvement
41
What is a Strategic Clinical Network (SCN)?
• Area requiring large scale change
• Resistant to previous attempts at improvement
(or not examined holistically)
• Strategic pan-London approach
• Provide expert advice to commissioners
• Contrast with Operational Delivery Networks

42
London’s Children
• Population of London 7.8 million (ONS 2011)
• 2,049,576 children aged 0 – 19 in London
• Approx 1.7 million children in Kent Surrey
Sussex, and East of England many of whom
access tertiary services in London
• 134,186 live births in London 2012 (ONS)

43
Why a Children’s SCN?
UK has a higher all-cause childhood
mortality rate compared with Sweden,
France, Italy, Germany and Netherlands

London has higher than expected mortality for 1 – 19 year olds
44Data courtesy of London Health Programmes

Hospital mortality for children in London is rising compared to other areas of UK
45

There are low rates of consultant review of paediatric emergency admissions within 12 hours
46

78% of London trusts undertake elective surgery on less than two children per week
47

Most surgery on children is being undertaken by adult surgeons
48

Nearly half of children are not reviewed by a consultant surgeon within 12 hrs of admission
49

Over 50% of hospitals do not have a paediatric anaesthetist available
50

Attendance at A & E by children is very high in London
51
ACCIDENT & EMERGENCY attendances, ages 0-17, London 2010-11
Source: PHE ChiMat using HES Data
0 100 200 300 400 500 600
BarnetHavering
HarrowCity of London
Richmond upon ThamesRedbridge
Barking and DagenhamBexley
Waltham ForestBromley
Kingston upon ThamesCamden
HillingdonLONDON
SuttonLambeth
Kensington and ChelseaCroydon
Hammersmith and FulhamIslington
EalingNewham
SouthwarkTower Hamlets
MertonBrent
HounslowEnfield
LewishamGreenwich
Westminster, City ofHackneyHaringey
WandsworthEngland
Accident & Emergency attendances, rate per 100,000 population aged 0-17
Accident & Emergency attendances, rate per 100,000 population aged 0-17, England LAs, 2010-11
96.6 - 243.9
244.0 - 301.9
302.0 - 336.9
337.0 - 413.9
414.0 - 880.6
National quintilesrate per 100,000
0
100
200
300
400
500
600
700
800
900
London - lowest
London average
England average
London - highest
26 London boroughs have A and E attendance higher than the national average for children
Data courtesy of ChiMat

Some boroughs have high rates of admission to hospital for asthma
52
ASTHMA Emergency hospital admissions, ages 0-18, London 2011/12
Source: DMIT using HES Data
0 50 100 150 200 250 300 350 400 450
WestminsterWandsworth
Richmond and TwickenhamHavering
EnfieldBarnet
KingstonGreenwich
Kensington and ChelseaHillingdon
Tower HamletsHounslow
BromleySutton and Merton
HaringeyBexley
CamdenHammersmith and Fulham
LONDONNewham
BrentCity and Hackney
SouthwarkHarrow
RedbridgeEaling
LewishamBarking and Dagenham
LambethIslingtonCroydon
Waltham ForestEngland
Emergency hospital admission rate per 100,000 population aged 0-18
Emergency hospital admission rate per 100,000 population aged 0-18, England PCTs, 2011/12
74.8 - 142.0
142.1 - 162.0
162.1 - 210.0
210.1 - 262.0
262.1 - 495.7
National quintilesrate per 100,000
0
50
100
150
200
250
300
350
400
450
500
London - lowest
London average
England average
London - highest

Thematic examination of SUIs involving children in London
53
Aim To identify themes and learning from Serious Untoward Incidents (SUIs) to help inform the work of the Children’s SCN
Methodology
• SUIs involving children requested from STEIS 2008 - 2013
• Those indicating system failure identified n = 86
• Full report requested from Trusts/PCT/CCG
• 59 responses received from 29 organisations
• Common themes identified and collated

Solutions to the care of children
54
“Children’s services should be seen as a whole system,
designed within a framework of pathways and networks
which enable the right things to be done, at the right time
and place, using teams that work together within a
managed network.”
RCPCH 2013

Issues across healthcare systems
55
“It is clear that in relation to service failure, problems
often occur at the borders between one organisation or
team and another”
Learning from Investigations
Healthcare Commission
February 2008

PA
TH
WA
YS
London Strategic Clinical NetworksDecember 2013
Children’s Strategic Clinical NetworkChildren’s Commissioning Group
Strategic Clinical Leadership Group
Patients and public
SCN Oversight Group
GovernanceClinical Senate
Assurance
Children’s Network Children’s Network
Children’s Network Children’s NetworkSTA
ND
AR
DSS
TAN
DA
RD
S
Primary care
Tertiary care
Secondary care
Cardiology Pathway GroupChair: Owen MillerSCN Lead: Andy Martin
Neuroscience Pathway GroupChair: TBCSCN Lead: Andy Martin
Diabetes Pathway GroupChair: Peter Hindmarsh/Martha Ford-AdamsSCN Lead: Sara Nelson
Nephrology Pathway GroupChair: Lesley ReesSCN Lead: Sara Nelson
Surgery Pathway GroupChair: Simon EcclesSCN Lead: Suzanne Sweeney
Critical Care Pathway GroupChair: Duncan MaCraeSCN Lead: Andy Martin
Oncology Pathway GroupChair: Julia Chisholm/Darren HargraveSCN Lead: Caroline Moren
Asthma Pathway GroupChair: John MoreiraSCN Lead: Sara Nelson
Gastrointestinal Pathway GroupChair: Ian SandersonSCN Lead: Suzanne Sweeney
Neonates Pathway GroupChair: Sandy CalvertSCN Lead: Suzanne Sweeney
Patient and Public Involvement (PPI)SCN Lead: Andy Martin
Mental HealthSCN Lead: Andy Martin
Health in the Justice SystemSCN Lead: Sara Nelson
CommissioningSCN Lead: Sara Nelson
Immunisation, Healthy Child and SafeguardingSCN Lead: Suzanne Sweeney
Data and InformationSCN Lead: Andy Martin
Programme ManagementSCN Lead: Andy Martin
Information TechnologySCN Lead: Sara Nelson
Education & Workforce SCN Lead: Sara Nelson
CommunicationsSCN Lead: Suzanne Sweeney
Community care
Collaborating with:
► Academic Health Science Networks► Clinical Commissioning Groups (CCGs)
► Health and Wellbeing Board► Local Education and Training Boards
►Public Health England► Regulatory bodies
► Royal Colleges► Voluntary sector
PA
TH
WA
YS
ENABLERS EN
ABLE
RS

Initial work programme - Networks
57
• Subgroup of SCLG developing network model
• Chaired by Professor Russell Viner, UCL/ICH
• Networks of care across all children's providers
• Currently considering 3 based on AHSNs, LETBs, LATs,
• Population based view of children’s health
• Linkage with public health
• Governance pathway through commissioners linked into commissioners
• Funding identified to establish networks

Initial work programme - Standards
58
• Subgroup of SCLG chaired by Tina Sajjanhar, Paediatric ED Consultant, Lewisham Hospital
• Identify standards of care within the networks collating existing standards:
• Service specifications for specialised services
• All existing standards for children in-hospital care (eg RCPCH, London Health Programmes, RCA, RCS)
• General practice outcome standards

Initial work programme - pathways
59
• A number of pathway groups
• Some illustrative of issues in primary secondary and tertiary care settings
• High volume
