the new middle class data and perceptions income as the most vital consumer market of the future....
TRANSCRIPT

The New Middle ClassData and Perceptions


1D e v e s h K a p u r , N e e l a N j a N s i r c a r
and M i l a N va i s h N a v
The Importance of Being Middle Class in India1
Introduction
Whether you follow developments in india closely or not, you have likely heard about the emergence of the ‘indian middle class.’ The private sector, especially large multinational corporations, view the emergence of a large pool of indians with increasing disposable income as the most vital consumer market of the future. The McKinsey Global institute (2007) refers to india’s expanding consumer market as the country’s “bird of gold”, a phrase merchants used thousands of years ago to describe its vast economic potential. The growth of a middle class is expected to play a transformative role in modernising the indian economy, create new pressure points on the government to tackle the vestiges of the license raj, and enable a more propitious environment for private entrepreneurship and job creation (Fernandes 2006). and those who are frustrated with the corruption and cronyism that has characterised indian politics for decades view the rise of the middle class as a force for positive change, a palliative to the twin vices of identity and patronage politics (Das 2012).
1. The authors are grateful for comments received on a preliminary version of this chapter presented at the “Green perspectives on the New Middle classes” conference hosted by heinrich Böll Foundation (hBF) and the 2015 american political science association meetings. We would like to acknowledge the assistance of Megan reed in carrying out the research on which this chapter is based and saksham Khosla and aidan Milliff for research assistance. all errors are our own.
40 . . . . . . . . . . . . . . . . . . . . . . . . . . . . . . . . . . . . . . . . . . . . . . . . . . . . . . . . . . . . . . . . . . T he New Middle Cl a ss iN iNdia aNd Br azil
Despite these tall claims, the research on the middle class globally is quite divided on its social and political impact. On the one hand, one strand of the literature argues that middle class can be a dynamic force for change (lash and urry 1987) while on the other hand, some scholars have argued that they can often a powerful votary of the status quo and traditional social and economic structures (erikson and Goldthorpe 1992). For instance, while the middle class might desire a reduced role of the state in the economy and a corresponding greater role for the private sector, it also wants better safety and environmental standards across a diverse array of sectors which, ironically, bring the state back in—this time in its regulatory capacity. This is one reason why—as far as india is concerned—the ‘inspector raj’ has replaced the ‘license raj’ (chandra 2015, indian express 2016).
But leaving this debate aside, there is an even more fundamental problem with making statements about, or on behalf of, the middle class; there is no commonly accepted definition of what it means to be ‘middle class.’ To the contrary, there is a wide-ranging debate among analysts and scholars over various conceptualisations of the middle class (Kapur 2010). some prefer an income or wealth-based measure that may either be relative or absolute, while others prefer to focus on aspects of human development, while still others argue in favour of behavioural measures.
in this chapter, we argue in favour of a distinct measurement strategy: self-identification. Given the inconclusive debate over the use (and abuse) of objective measures of class belonging, we argue that there are pay-offs to resorting to more subjective measures. after all, if what we care about from a political economy standpoint is class consciousness, self-identification presents a useful metric. For the working classes (as Georg lukács famously argued a century ago), class-consciousness was not inherent—it was achieved through constant struggle against the owners of capital. in the 21st century, do media and consumption habits shape middle class consciousness, as some have argued (Marsh and li 2015)?
in a national survey carried out in 2014, we asked a sample of indians from across the country whether or not they would classify

41T he ImporTance of BeIng . . . • K apur , SIrc ar and VaI ShnaV
. . . . . . . . . . . . . . . . . . . . . . . . . . . . . . . . . . . . . . . . . . . . . . . . . . . . . . . . . . . . . . . . . .
themselves as ‘middle class.’ We draw on this data to examine how self-identification maps onto objective measures based on income or education. We then test whether individuals who self-identify as middle class hold distinct views when it comes to economic and social mobility in india. regardless of how one interprets its broader impacts, we argue that the notion of ‘middle class’ can be understood as a cognitive identity with some degree of class-consciousness or feeling of belongingness. in turn, this cognition should result in certain distinct views about the world, compared to other social classes. For instance, if the middle class is supposed to be ‘aspirational’, then being middle class should result in greater optimism about the future.
To preview our findings, we find that almost half of all respondents we surveyed across india identified themselves as part of the middle class. While there is substantial variation across states, which is not altogether surprising, identification is stronger in urban areas when compared to rural ones. however, middle class identification is broad-based, spanning all income groups and educational strata. While there is an almost linear correspondence between income/education and middle class affinity, what is striking is not necessarily the difference between groups but the consistency across them. When it comes to social aspiration and economic optimism, there is a distinct middle class positivity on both counts. statistical analyses suggest that middle class self-identification accounts for a good deal of the variation in economic optimism and social aspiration that is not attributable to either income or education.
The rest of this chapter proceeds as follows. We first briefly discuss the debate on measuring the middle class in india. Next, we describe the methodology behind our new, subjective measure of middle class. Following this, we present descriptive data on middle class self-identification. We then look at the association between subjective middle class identity and aspirational views on the economy and social mobility—first with descriptive data and then in a simple, regression-based framework. The final section outlines some likely implications of the impact of the growing middle class on indian politics.

42 . . . . . . . . . . . . . . . . . . . . . . . . . . . . . . . . . . . . . . . . . . . . . . . . . . . . . . . . . . . . . . . . . . T he New Middle Cl a ss iN iNdia aNd Br azil
Defining the Indian Middle Class
Given the attention the emergence of the indian middle class has received, it is perhaps not surprising that there is much debate over how to measure membership in this category. Table 1.1 presents a list of metrics that have been offered in recent years. The list is not exhaustive, but it does amply illustrate the traditional reliance on subjective indicators. it also demonstrates that small differences in definition can lead to wildly divergent estimates about the overall size of the middle class.
Table 1.1
Various Definitions of the ‘Indian Middle Class’
Source Size Year Definition
Beinhocker et al. (2007)
50 million 2005 households with disposable income between `200,000-`1,000,000 per year (approx. $11-$55/day and $4,200-$21,000/year)
McKinsey Global institute (2010)
32 million (households)
2008 households with disposable income between `200,000 - `1,000,000 per year
singh (2005) 113 million 1992-93 Broadest middle class: household income greater than `35,000 per year (in 1998-9 rupees)
250 million 1998-99
sridharan (2004)
55-248 million
1998-99 By household income
- elite: > `140,000/yr.
- expanded: > `105,001/yr.
- Broadest: > `70,001/yr.
Desai (2008) 7 per cent of all households 1983 proportion of households with consumption expenditure above `60,000 (in 1999 rupees)
11 per cent of all households 1999-2000
Government of india (2012)
28.7 million 2011-12 Number of people filing tax returns.
shukla (2010) 4.5 million households 1995-96 income between `0.2-`1.0 million10.7 million households 2001-02
28.4 million households 2009-10

43T he ImporTance of BeIng . . . • K apur , SIrc ar and VaI ShnaV
. . . . . . . . . . . . . . . . . . . . . . . . . . . . . . . . . . . . . . . . . . . . . . . . . . . . . . . . . . . . . . . . . .
asian Development Bank (2010)
224 million (lower middle class)
2005 $2-$4 (ppp)
45 million (middle-middle class)
$4-$10 (ppp)
5 million (upper middle class)
$10-$20 (ppp)
Kharas (2010) 5-10 per cent of all households 2010 $10-$100
Birdsall and Meyer (2012)
70 million 2012 income between $10-$50
india human Development survey (ihDs), 2011-12 round
40 per cent of all households 2014 income between `55,000-`88,000
Birdsall (2015) 2.6 per cent of all households 2015 income between $10-$50
pew research center (2015)
3 per cent of all households 2015 income between $10.01-$20 (2011 ppp)
Overall, we can classify existing measures into three categories. The most popular approach relies on income-based thresholds.2 For instance, Birdsall (2015) argues in favour of $10 or above (ppp, 2005, in $2010 $usD) as the threshold for what she describes as an ‘income-secure’ middle class. some studies, like one conducted by the asian Development Bank (2010), present different ‘bands’ or ‘strata’ of the middle class. For instance, individuals with an income of between $2-4 (ppp) per day are classified as lower-middle class, while those making between $4-10 (ppp) and $10-20 (ppp) are classified as middle middle-class and upper middle-class, respectively. Birdsall’s rejoinder to such a definition is that individuals making below the $10 cut-off are vulnerable to economic shocks, especially in an increasingly globalised world. it is for this reason that she terms people belonging to the $4-10 category as ‘strugglers’, or those who are upwardly mobile but susceptible to falling back below the poverty
2. some scholars prefer a relative, rather than absolute, definition of well-being that is built around the income distribution. a cross-national analysis by easterly (2001), for instance, defined the middle class as those individuals who were living between the 20th and 80th
percentiles on the consumption distribution. The problem with this approach stems from the variation in relative income and income inequality across countries (Wietzke and sumner 2014). To the best of our knowledge, scholars in the indian context have not focused on measures based on overall income distribution, primarily because of the absence of good household income data.
44 . . . . . . . . . . . . . . . . . . . . . . . . . . . . . . . . . . . . . . . . . . . . . . . . . . . . . . . . . . . . . . . . . . T he New Middle Cl a ss iN iNdia aNd Br azil
line. similarly, a measure developed by the McKinsey Global institute (2007) defines middle class as households with a disposable income between `200,000-1,000,000 per annum. research by scholars behind the ihDs has proposed a definition that encompasses households making between `55,000 and `88,000 (rukmini 2014). although this approach focuses on ‘income’, it more often than not relies on consumption measures, which are more readily available in the indian context (typically, large sample surveys do not capture reliable information about income). Moreover, absolute numbers should be tethered to the year of the survey since, given india’s relatively high inflation, the real value of these numbers falls rapidly with time.
some scholars believe income-based measures are too restrictive because they do not fully capture non-monetary dimensions of well-being, and prefer a definition that incorporates broader measures.
For instance, Kapur (2010) proposes two alternative definitions that do not use income (consumption) as the principal building block. The first is the number of income tax payers in india. This reflects the number of individuals who earn a salaried income in the formal sector and who also demonstrate a willingness to pay taxes. The most recent government data, covering the financial year 2011-12, shows that 28.7 million indians (2.3% of the population) filed income tax but 16.2 million were exempt from making tax payments. This means that the effective number of taxpayers was around 12.5 million. assuming there are approximately 1.1 taxpayers per taxpaying household and roughly 200 million households in india, the total number of taxpaying households in india were about 5-6 per cent at the time.3
The second measure proposed by Kapur is the share of indians who have a college degree, which he estimates to be approximately 50 million in 2010. Obviously, education is highly correlated with, but not a perfect substitute for income. The choice of higher education, as Kapur notes, is more reflective of the notion that middle class
3. Given that more than a quarter of india’s population is below the age of 20, we should not expect this segment to be paying taxes in any case. Therefore, the number of households is a better denominator.

45T he ImporTance of BeIng . . . • K apur , SIrc ar and VaI ShnaV
. . . . . . . . . . . . . . . . . . . . . . . . . . . . . . . . . . . . . . . . . . . . . . . . . . . . . . . . . . . . . . . . . .
individuals share a common value orientation—one likely facilitated by a certain degree of formal schooling.
a third category, espoused by scholars such as Fernandes (2006), consists of behavioural measures that take into account the role of social, cultural, and economic forces in the construction of class identity.
a fourth category is the nature of employment. historically, in countries with large public sectors, government employees dominated the ranks of the middle class. The hallmarks of such employment were lifetime job security, steady albeit modest growth in incomes, and post-retirement pensions and healthcare safety nets. Today’s middle class has a much larger share of private sector workers, and many are self-employed with incomes that are higher (albeit more volatile) and safety nets that are largely self-constructed. The economic interests of these two middle-classes are rooted in distinctive economic models.
as the preceding paragraphs reveal, it can be difficult to measure middle class by relying on the conventional metrics. Our strategy is to shift from an objective to a subjective measure of middle class. Objective measures rely on some form of the statement that ‘X person is in the middle class,’ where X’s inclusion is based on meeting some arbitrarily determined threshold. subjective measures rely on personal statements such as: ‘i am in the middle class.’ This form of self-identification is a distinctive way to define an amorphous group where there is little agreement on objective measures.
Methodology
Between january and May 2014, the lok Foundation sponsored a survey of the social attitudes of a broad cross-section of indians. The survey piggybacked on a standing quarterly panel consumer survey of more than 150,000 households conducted by the centre for Monitoring indian economy (cMie).4 Working with the lok Foundation and cMie, a research team consisting of the authors designed the survey instrument and analysed the data.
4. a brief description of the cMie consumer pyramids survey can be found here: http://www.cmie.com/kommon/bin/sr.php?kall=wcontact&page=consumer_pyramids.

46 . . . . . . . . . . . . . . . . . . . . . . . . . . . . . . . . . . . . . . . . . . . . . . . . . . . . . . . . . . . . . . . . . . T he New Middle Cl a ss iN iNdia aNd Br azil
The total sample size of this survey was 68,516 respondents across 24 states and union territories in india. although respondents were randomly selected within each locality, the sampling frame itself is not statistically representative of india due to the goals of the aforementioned consumer survey. The sample includes data from each city that had at least 200,000 inhabitants as of the 2001 census of india as well as a smaller rural sample. as such, the data are skewed towards larger cities in india and the data are biased towards urban respondents. india is 32 per cent urban and 68 per cent rural according to the 2011 indian census; using the same classifications, the lok sample is 62 per cent urban and 38 per cent rural.5 To address this mismatch, urban and rural estimates are population-weighted by size of city/local rural population within state and adjusted by rural/urban percentage at the state level for all-india estimates.
The sample was drawn as a cluster random sample in the following way. The 24 states and union territories under study were broken into 98 ‘homogeneous regions’. a homogeneous region is a set of contiguous districts (the largest administrative unit inside a state) that possess similar agro-climatic conditions. Within each homogeneous region, at least 1 city (and often multiple cities) and a set of villages was selected. To select households in villages, cMie chose a random position in each village and selected every nth household in a randomly chosen direction. cities, in contrast, were broken into wards, which were further subdivided into ceBs (census enumeration blocks). The wards in the city were stratified by average asset wealth (as determined by the 2001 indian census) and selected randomly. ceBs (which are of roughly equal population) were selected randomly from each selected ward. Within each ceB, cMie selected households starting from a randomly selected position and selecting every nth household from a randomly selected direction. Within each household, it randomly selected an individual over the age of 18 to interview.
5. as an aside, it is worth pointing out that the actual urban population of india is much larger than what the official statistics report, due to the idiosyncrasies of census definitions. For instance, if the census defined urban according to standard population thresholds, as much as 50 per cent of india would be classified as urban (jana et al. 2014).

47T he ImporTance of BeIng . . . • K apur , SIrc ar and VaI ShnaV
. . . . . . . . . . . . . . . . . . . . . . . . . . . . . . . . . . . . . . . . . . . . . . . . . . . . . . . . . . . . . . . . . .
Middle Class Self-Identification
To measure middle class identification, the survey asked respondents: ‘Do you consider your family to be a middle class family’ (in hindi: Kya aap ke vichar se apka parivaar ek madhyam varga parivaar hai)? The survey results reveal that nearly 1 in two respondents (49%) answered in the affirmative (Figure 1.1). as befits a country as diverse as india’s federation, there was a significant degree of variation across states. Whereas 68 per cent, or more than two-thirds of respondents in the southern state of Karnataka believed they belonged to the middle class, just 29 per cent of respondents in the hindi heartland state of Madhya pradesh (Mp) did so. The states with the highest proportion of self-identified ‘middle class’ respondents are not far out of line with what one would expect. in addition to Karnataka, the urban city-state of Delhi and Gujarat are placed on the upper end of the spectrum. On the opposite end, following Mp, sit Odisha and Maharashtra.
Figure 1.1
Middle Class Self-Identification, by State
Note: authors’ analysis based on data collected by the lok Foundation.
2933
39 4043 45 47 47 47 49 49 51 52 53 53 54
5864
68
0
10
20
30
40
50
60
70
80
Per
cent
(%)
Mad
hya
Prad
esh
Odi
sha
Mah
aras
htra
Ker
ala
Raj
asth
an
Tela
ngan
a
And
hra
Prad
esh
Biha
r
Jhar
khan
d
Ass
am
All-
Indi
a
Wes
t Ben
gal
Har
yana
Punj
ab
Utt
ar P
rade
sh
Tam
il N
adu
Guj
arat
Del
hi
Kar
nata
ka

48 . . . . . . . . . . . . . . . . . . . . . . . . . . . . . . . . . . . . . . . . . . . . . . . . . . . . . . . . . . . . . . . . . . T he New Middle Cl a ss iN iNdia aNd Br azil
Most conventional descriptions of the middle class focus on urban dwellers. Our results reveal a 10 percentage point difference between urban and rural residents (56% versus 46%, respectively) when it comes to middle class identification (Figure 1.2). While this is not an insignificant difference, the proportion of residents in both places claiming middle class status is still quite large.
Figure 1.2
Middle Class Self-Identification, by Rural/Urban Status
Note: authors’ analysis based on data collected by the lok Foundation.
Where this is brought into starker relief is when one contrasts self-identification with objective income and education-based criteria. We divided up our sample into 5 income categories, based on self-reported annual income data collected by cMie, as well as by geography (urban/rural). The contrast between respondents’ self-perception and objective reality is marked. as one would expect, there is a near-monotonic relationship between subjective middle class identification and annual income. Forty-seven (47) per cent of lower middle-income respondents self-identified as ‘middle class’, while half of middle income and 54 per cent of upper middle-income respondents did so (Figure 1.3). somewhat expectedly, this declined to 48 per cent for those in the highest income bracket.
0%
10%
20%
30%
40%
50%
60%
Rural Urban All India
Per
cent
(%)

49T he ImporTance of BeIng . . . • K apur , SIrc ar and VaI ShnaV
. . . . . . . . . . . . . . . . . . . . . . . . . . . . . . . . . . . . . . . . . . . . . . . . . . . . . . . . . . . . . . . . . .
Figure 1.3
Middle Class Self-Identification, by Income and Education
Note: authors’ analysis based on data collected by the lok Foundation.
a second takeaway is the difference between urban and rural respondents, even within income categories. For every category of income, the share of urban respondents who self-identify as middle class is noticeably larger when compared to their rural counterparts. The lone exception is the poorest category (lower) where the differences are very small. Furthermore, even among respondents in the lowest income bracket, 45 per cent self-identify as middle class—just 3 per cent less than the richest income group. The fact that nearly half of respondents belonging to the lowest income group self-identified as middle class, not to mention the modest difference between them and upper middle-income respondents (only 9%), raises several questions. is ‘middle class,’ a status marker that the poor aspire to in a status-conscious society? Or, is middle class affinity about an emerging sense of agency as age-old social hierarchies begin to fray? Or, perhaps, is the validity of the measure itself an issue since respondents across language groups might have interpreted the question in different ways?
45%48%
44% 45%48%
51%
43%
51%
59%
46%50%
55%60% 59%
0
10
20
30
40
50
60
70
Less �an 10th Standard
At Least 10th Standard
Lower Lower Middle
UpperMiddle
UpperMiddle
Education
Per
cent
(%)
Annual Income
Rural Urban

50 . . . . . . . . . . . . . . . . . . . . . . . . . . . . . . . . . . . . . . . . . . . . . . . . . . . . . . . . . . . . . . . . . . T he New Middle Cl a ss iN iNdia aNd Br azil
as we described in Kapur and vaishnav (2014), there are several potential explanations for this. First, the income data we employ compares nominal incomes and not real incomes, which does not factor in the higher cost of living in urban areas. second, and this is debatable, it is quite possible that ethnic (especially caste-based) identities are more salient in rural relative to urban india (chhibber and varshney 2013).
Turning to education, we find that middle class identification tends to increase with educational attainment. We use a simple, but rather blunt, dividing line to categorise respondents: whether or not they have a 10th standard education. On balance, those who clear this minimum threshold are more likely to believe they are middle class, especially in urban areas. however, 47 per cent of individuals with less than a 10th standard education still claim such an affiliation.
Aspiration and Optimism
The large share of respondents who identify as middle class begs the question as to whether these ‘middle class’ indians hold distinct world views. Do they have coherent views on the state of the country and the direction in which it is travelling? are they more aspirational and optimistic about the future or fearful and pessimistic? Members of a first generation middle class, whose parents were poor but whose income has been buoyed by a rapidly growing economy, are likely to be optimistic about the future. But a second (or later) generation middle class whose income has stagnated or declined because of structural changes in labour markets and an anaemic economy is likely to be more pessimistic and fearful about the future. The middle classes in emerging markets are of recent vintage and the product of upward mobility stemming from rapid economic growth (as in china or india), while those in advanced industrialised economies such as the united states (us) have experienced downward mobility. consequently, it is not middle class identification per se, but the direction of socio-economic mobility (upward or downward), that is likely to determine their views of the future.
To answer these queries, the lok survey posed five questions regarding respondents’ social attitudes. These questions concerned
51T he ImporTance of BeIng . . . • K apur , SIrc ar and VaI ShnaV
. . . . . . . . . . . . . . . . . . . . . . . . . . . . . . . . . . . . . . . . . . . . . . . . . . . . . . . . . . . . . . . . . .
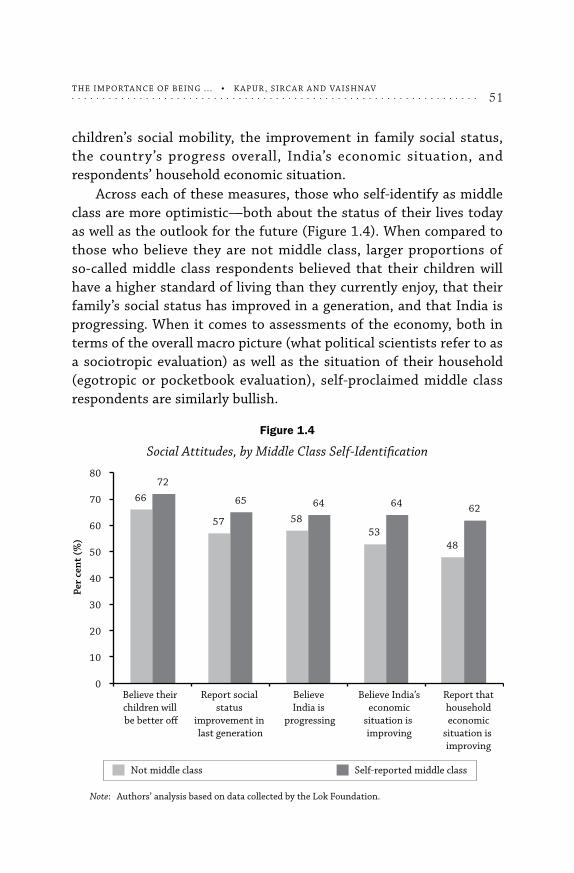
children’s social mobility, the improvement in family social status, the country’s progress overall, india’s economic situation, and respondents’ household economic situation.
across each of these measures, those who self-identify as middle class are more optimistic—both about the status of their lives today as well as the outlook for the future (Figure 1.4). When compared to those who believe they are not middle class, larger proportions of so-called middle class respondents believed that their children will have a higher standard of living than they currently enjoy, that their family’s social status has improved in a generation, and that india is progressing. When it comes to assessments of the economy, both in terms of the overall macro picture (what political scientists refer to as a sociotropic evaluation) as well as the situation of their household (egotropic or pocketbook evaluation), self-proclaimed middle class respondents are similarly bullish.
Figure 1.4
Social Attitudes, by Middle Class Self-Identification
Note: authors’ analysis based on data collected by the lok Foundation.
66
57 5853
48
72
65 64 64 62
0
10
20
30
40
50
60
70
80
Per
cent
(%)
Believe their children will be better o�
Report social status
improvement in last generation
Believe India is
progressing
Believe India’seconomic
situation is improving
Report thathouseholdeconomic
situation is improving
Not middle class Self-reported middle class

52 . . . . . . . . . . . . . . . . . . . . . . . . . . . . . . . . . . . . . . . . . . . . . . . . . . . . . . . . . . . . . . . . . . T he New Middle Cl a ss iN iNdia aNd Br azil
The numbers break on similar lines when we add a rural/urban location filter (Figure 1.5). Three things are worth noting. We saw above that middle class respondents are uniformly more optimistic in their evaluations about their current state of affairs as well as their future outlook. When we disaggregate responses by location, this remains the case among both rural and urban sub-populations. second, urban middle class respondents are the most optimistic in their responses. however, rural self-identified middle class respondents, though they are less positive than their urban middle class peers, are marginally more optimistic than urban residents who do not believe they belong to the middle class.
Figure 1.5
Social Attitudes, by Urban/Rural Status and Middle Class Self-Identification
Note: authors’ analysis based on data collected by the lok Foundation.
Finally, given the urbanising nature of indian society, we decided to further unpack our ‘urban’ category into three groups: those living in megacities, larger cities, and smaller cities. We find that, in each sub-category, middle class respondents are more optimistic. Those
70
6157 59 57
7871
66 68 7064
55 5851
44
6963 63 62 59
0
10
20
30
40
50
60
70
80
90
Urban not middle class Urban self-reported middle class
Rural not middle class Rural self-reported middle class
Per
cent
(%)
Believe their children will be better o�
Report social status
improvement in last generation
Believe India is
progressing
Believe India’seconomic
situation is improving
Report thathouseholdeconomic
situation is improving

53T he ImporTance of BeIng . . . • K apur , SIrc ar and VaI ShnaV
. . . . . . . . . . . . . . . . . . . . . . . . . . . . . . . . . . . . . . . . . . . . . . . . . . . . . . . . . . . . . . . . . .
that reside in megacities are slightly more bullish than residents living in other urban locales (Figure 1.6).
Figure 1.6
Middle Class Self-Identification and Economic Optimism
Note: authors’ analysis based on data collected by the lok Foundation.
Statistical Analysis
The previous section supports the contention that middle class self-identification is a good predictor of aspirational and optimistic views about the future. To assess this association more systematically, we set up a simple regression looking at two, distinct outcomes: beliefs about children’s well-being and the condition of the indian economy. The former is a commentary on social aspiration, while the latter relates to economic optimism.
as predictors, we consider 4 variables: whether an individual is in the middle 60 per cent of the income distribution; whether he or she is ‘rich,’ defined by being in the top 20 per cent of the distribution; education, as denoted by passing 10th standard; and our measure of middle class self-identification. The baseline respondent, against which we are making comparisons, is a poor individual (located in the bottom 20%) who has not passed 10th standard, and does not identify as middle class. We run the model separately for urban and rural residents and include state fixed effects—which captures any
5458 60
65 6568
0
10
20
30
40
50
60
70
80
Smaller City Larger City Megacity
Per
cent
(%)
Not middle class Middle class

54 . . . . . . . . . . . . . . . . . . . . . . . . . . . . . . . . . . . . . . . . . . . . . . . . . . . . . . . . . . . . . . . . . . T he New Middle Cl a ss iN iNdia aNd Br azil
unobserved variation across indian states that is relatively time invariant, or ‘fixed’.
The results of both models are broadly similar. Beginning with the question of children’s well-being, middle class status—in both urban and rural areas—significantly corresponds to a more optimistic evaluation (Figure 1.7). urban, middle class respondents are nearly seven per cent more likely to believe their children will be better off in the future than the respondents are today. The effect is slightly smaller for rural respondents. The effects of education are positive and significant, though at a reduced level. respondents who are classified objectively as ‘rich’ are, on balance, more positive in their assessment, although the magnitudes are smaller. There is no statistically meaningful effect of belonging to the objectively determined ‘middle wealth’ category. in other words, the effect of subjective self-identification with the middle class is more impactful than belonging to the middle of the income distribution.
Figure 1.7
Impact of Middle Class Self-Identification on Social Aspiration and Economic Optimism
Note: authors’ analysis based on data collected by the lok Foundation.
Effect on believing children will be better off
Effect on believing Indian economic is getting better
Self-ID middle class
Middle wealth
Rich
At least 10th standard
Self-ID middle class
Middle wealth
Rich
At least 10th standard
0.00 0.05 0.10 0.15 0.200.00 0.05 0.10 0.15 0.20
0.076
0.064
0.087
0.114
0.019
0.048
0.068
0.0160.037
0.019
0.056
0.001
-0.001
0.053
0.0170.022
Urban Rural Urban Rural

55T he ImporTance of BeIng . . . • K apur , SIrc ar and VaI ShnaV
. . . . . . . . . . . . . . . . . . . . . . . . . . . . . . . . . . . . . . . . . . . . . . . . . . . . . . . . . . . . . . . . . .
These findings more or less remain when one considers the second outcome of interest: whether the indian economy is getting better. as with our measure of social aspiration, middle class self-identification is a strong predictor of economic optimism. Middle class respondents are more likely, in both urban and rural areas (though more so in the former), to have a favourable assessment of the indian economy. education plays a modest role while ‘middle income’ is significant and positive, but does not eliminate the independent impact of self-identification. interestingly, those who belong to the ‘rich’ category are much more optimistic about the country’s economic future. While this is not entirely surprising, we note the much larger effect on economic optimism as opposed to social aspiration. again, given the deeply stratified nature of indian society, economic change is relatively easier to achieve than social change. since the american civil War a century and half ago, incomes in the us have increased dramatically, but changes in race relations have lagged. We might similarly expect more rapid improvements in incomes in india, while social change related to caste, gender, religion, and region are likely to evolve much more gradually.
There are three principal takeaways from this brief analysis. First, middle class self-identification picks up a lot of the variation in economic optimism and social aspiration that is not picked up by either wealth or human capital. second, the association between middle class affinity and aspiration are comparatively larger in urban (than rural) parts of india. Finally, while income is positively linked with economic optimism, its impact is smaller on social aspiration.
Conclusion
The novel contribution of this chapter is to offer a new way of framing ‘middle class’ identity that relies not on income, distributional, or human capital measures, but on an individual’s subjective beliefs. Drawing on findings from a large survey of indians across 2 dozen states, we find that middle class identification is large—between 40 and 60 per cent—for virtually all demographic groups in the country. it seems likely based on this initial evidence that india’s aspirational middle class may be less ideologically driven

56 . . . . . . . . . . . . . . . . . . . . . . . . . . . . . . . . . . . . . . . . . . . . . . . . . . . . . . . . . . . . . . . . . . T he New Middle Cl a ss iN iNdia aNd Br azil
and instead more focused on gaining social and economic status in a country where there is a tremendous amount of churn taking place. as urbanisation picks up pace and human capital levels continue to rise, we can expect the size of the aspirational middle class to continue to expand.
While this chapter has emphasised the importance of beliefs in the construction of a middle class identity, it does not provide answers on how these beliefs have been constructed. For the working classes, class struggle and unions played critical roles in developing such an identity. For the upper classes, these identities were constructed by attending specific schools and universities (as in the united Kingdom). Media, especially the electronic media, and the construction of a consumer society are factors that appear to be playing an important role in shaping middle class identities. But how and with what consequences remain open questions.
in india’s 2014 general election, research has found that the middle class (measured in more conventional terms) supported the opposition Bharatiya janata party (Bjp) and its leader, current prime Minister Narendra Modi, in large numbers (sridharan 2014). however, the government would be well advised not to take the support of the middle class for granted, as partisan identification could change rapidly if the aspirations of the middle class are thwarted. indeed, some research has shown that the middle class also backed the previous congress-led government, which had presided over the fastest economic growth rates in indian history (jaffrelot and verniers 2009). Once economic conditions began to deteriorate, particularly toward the final stage of their second term in office, the support of the middle class also began to falter. in other words, it seems logical that the ideological tether of the middle class to political parties will likely remain weak for the foreseeable future—not least because middle class identification cuts across most social groupings. however, while social bases will continue to matter for politics, as the importance of the aspirational middle class grows, one can expect a concomitant growth in economic voting—although it is as yet unclear whether this voting will take place on retrospective or prospective lines.

57T he ImporTance of BeIng . . . • K apur , SIrc ar and VaI ShnaV
. . . . . . . . . . . . . . . . . . . . . . . . . . . . . . . . . . . . . . . . . . . . . . . . . . . . . . . . . . . . . . . . . .
Referencesasian Development Bank (2010). “part i—special chapter: The rise of asia’s Middle class”, in Key
Indicators for Asia and the Pacific 2010. Manila.
Beinhocker, eric D., Diana Farrell and adil s. Zainulbhai (2007). “Tracking the Growth of india’s Middle class”, The McKinsey Quarterly 3: 51–61.
Birdsall, Nancy (2015) “Does the rise of the Middle class lock in Good Government in the Developing World?”, European Journal of Development Research 27(2): 217-29 (april).
Birdsall, Nancy and christian Meyer (2012). “is india’s Middle class Big enough For…?”, Center for Global Development (blog). 26 November. http://www.cgdev.org/blog/india%E2%80%99s-middle-class-big-enough
chandra, Kanchan (2015). “The New indian state: The relocation of patronage in the post- liberalisation economy”, Economic and Political Weekly 50(41): 46-58 (October).
chhibber, pradeep and ashutosh varshney (2013). “citizens of Tomorrow”, Indian Express, October 31, 2013.
Das, Gurchuran (2012). India Grows At Night: A Liberal Case for A Strong State. london: penguin.
Desai, sonalde (2007). “indian Middle class”, in Kaushi Basu (ed.), Oxford Companion to Economics. New Delhi: Oxford university press.
easterly, William (2001). “The Middle class consensus and economic Development”, Journal of Economic Growth 6(4): 317-35 (December).
erikson, robert and john h. Goldthorpe (1992). The Constant Flux: A Study of Class Mobility in Industrial Societies . Oxford: clarendon press.
Fernandes, leela (2006). India’s New Middle Class: Democratic Politics in an Era of Economic Reform. Minneapolis: university of Minnesota press.
indian express (2016). “Keep inspectors away”, Indian Express, 26 May.
jaffrelot, christophe and Gilles verniers (2009). “india’s 2009 elections: The resilience of regionalism and ethnicity”, South Asia Multidisciplinary Academic Journal (online). 23 December. http://samaj.revues.org/2787
jana, arindam, Neha sami, and jessica seddon (n.d.). How ‘Urban’ is India?. presentation prepared for the international Growth centre, http://www.theigc.org/wp-content/uploads/2014/08/Arindam-Jana.pdf
Kapur, Devesh (2010). “The Middle class in india: a social Formation or political actor?” in julian Go (ed.), Political Power and Social Theory. vol. 21. Bingley, uK: emerald Group publishing limited. pp.143-69.
Kapur, Devesh and Milan vaishnav (2014). “Being Middle class in india”, Hindu, 9 December.
Kharas, homi (2010). “The emerging Middle class in Developing countries”, OECD Working Paper 285, january.
lash, scott and john urry (1987). The End of Organized Capitalism. Madison: university of Wisconsin press.
Marsh, leslie l. and hongmei li (eds.) (2015). The Middle Class in Emerging Societies: Consumers, Lifestyles and Markets. abingdon, uK: routledge.
McKinsey Global institute (2007). The ‘Bird of Gold’: The Rise of India’s Consumer Market. san Francisco.
————. (2010). India’s Urban Awakening: Building Inclusive Cities, Sustaining Economic Growth.london.
pew research center (2015). A Global Middle Class Is More Promise than Reality. Washington, D.c.

58 . . . . . . . . . . . . . . . . . . . . . . . . . . . . . . . . . . . . . . . . . . . . . . . . . . . . . . . . . . . . . . . . . . T he New Middle Cl a ss iN iNdia aNd Br azil
rukmini s. (2014). “Middle class Better Off, but Not Well Off”, Hindu, 5 april.
saxena, rachna (2010). “The Middle class in india: issues and Opportunities”, Deutsche Bank Research Note, 15 February.
shukla, rajesh (2010). How India Earns, Spends and Saves: Unmasking the Real India. New Delhi: institute for human Development.
singh, Nirvikar (2005). “The idea of south asia and the role of the Middle class”, Working Paper. Department of economics, university of california-santa cruz. 29 april.
sridharan, e. (2004). “The Growth and sectoral composition of india’s Middle class: its impact on the politics of economic liberalization”, India Review 3(4): 405-28.
————. (2014). “class voting in the 2014 lok sabha elections: The Growing size and importance of the Middle classes”, Economic and Political Weekly 49(39): 72-76 (27 september).
Wietzke, Frank-Borge and andy sumner, “What are the political and social implications of the ‘New Middle classes’ in Developing countries?”, Working Paper. london: King’s international Development institute, King’s college. 27 November.