the net effect of disclosure readability on analyst
TRANSCRIPT

Erasmus University Rotterdam
Erasmus School of Economics
MSc Thesis – Accounting, Auditing & Control
The net effect of disclosure readability on
analyst forecast dispersion
ABSTRACT
The purpose of this paper is to examine how managerial incentives and analyst behaviour affect the effectiveness of
disclosure readability in reducing information asymmetry. Three hypotheses test the intertwining relation between
disclosure readability, equity compensation, and analyst forecast dispersion. The first hypothesis results show that
equity compensation does not form an incentive to improve disclosure readability. The second hypothesis establishes
that equity compensation is significantly associated to analyst forecast dispersion. However, this relation is later put
to question when the third regression shows no significant relation between equity compensation and analyst forecast
dispersion. The last hypothesis finds that a significant relation exists between readability and analyst forecast
dispersion, but finds no moderating effect of equity compensation on the relation between readability and analyst
forecast dispersion. Findings confirm the importance of disclosure readability in reducing information asymmetry and
highlight the inefficiency of equity compensation in strengthening this relation.
Keywords: Disclosure Readability, Analyst Forecast Dispersion, Equity Compensation, Agency Theory
Student: P. Jimenez Ablanque
Studentnummer: 416860
Supervisor: Dr. L. Dal Maso
Second Assessor: Dr. R. Van der Wal
2
Table of Contents
1. INTRODUCTION ................................................................................................................................... 3
2. LITERATURE REVIEW ...................................................................................................................... 6 2.1 THEORETICAL BACKGROUND .......................................................................................................... 6
2.1.1 Agency Theory ............................................................................................................................ 6 2.1.2 Contracting Theory .................................................................................................................... 8
2.2 LITERATURE REVIEW ....................................................................................................................... 9 2.2.1 Corporate Disclosure .................................................................................................................. 9 2.2.2 CEO Compensation .................................................................................................................. 11 2.2.3 Disclosure Readability & Analysts Forecasts .......................................................................... 12
3. HYPOTHESIS DEVELOPMENT ...................................................................................................... 13
4. METHODOLOGY ............................................................................................................................... 15 4.1 VARIABLES OF INTEREST ................................................................................................................ 15
4.1.1 CEO compensation ................................................................................................................... 15 4.1.2 Forecast Dispersion .................................................................................................................. 16 4.1.2 Readability ................................................................................................................................ 16
4.2 CONTROL VARIABLES ..................................................................................................................... 17 4.2.1 Control Variables H1 ............................................................................................................... 17 4.2.2 Control Variables H2, H3 ........................................................................................................ 18
5. RESULTS .............................................................................................................................................. 20 5.1 SAMPLE SELECTION ........................................................................................................................ 20 5.2 EMPIRICAL MODEL ......................................................................................................................... 20 5.3 SUMMARY STATISTICS .................................................................................................................... 20 5.4 HYPOTHESES .................................................................................................................................... 23
5.4.1 Hypothesis 1 ................................................................................ Error! Bookmark not defined. 5.4.2 Hypothesis 2 ................................................................................ Error! Bookmark not defined. 5.4.3 Hypothesis 3 ................................................................................ Error! Bookmark not defined.
6. ROBUSTNESS TESTS ......................................................................................................................... 27
7. CONCLUSION ..................................................................................................................................... 28
BIBLIOGRAPHY ..................................................................................................................................... 30
APPENDIX A PEARSON & SPEARMAN CORRELATION ............................................................. 43
APPENDIX B MULTICOLLINEARITY .............................................................................................. 44
APPENDIX C PLOT MARGIN .............................................................................................................. 45
APPENDIX D VARIABLE LIST ............................................................................................................ 46

3
1. Introduction
Many agree that financial reporting needs to expand to serve the changing information
needs of the market and provide information that enhances corporate transparency and
accountability. This has triggered accounting researchers to focus their efforts on investigating
disclosure and now recognize narrative disclosures as a key step for achieving the desired change
in the quality of corporate reporting (Core , 2001). Demand for disclosures arises from information
asymmetry and agency conflicts between managers, investors, and analysts. As a result,
management uses disclosures to inform investors about current and future firm performance.
Nonetheless, these disclosures are subject to managements´ discretion seeing managers can choose
what information and how much information to disclose. Sell-side analysts play an important role
lessening the information asymmetry between firms and other market participants. The skills and
insights of analysts ensure a more efficient market that improves market liquidity and investor
confidence (Beyer , Cohen , Lys, & Walther , 2010). Nevertheless, analysts’ forecasts can be
subject to manipulation.
Despite disclosure readability having been shown to be beneficial. There are several
reasons why managers may be reluctant to increase readability. Readability can be interchangeably
used with transparency. Managers are likely to be less transparent about negative information
because negative information can adversely affect their career. Furthermore, managers may
consider that the proprietary and informational costs associated with disclosure do not outweigh
the benefits of non-disclosure. (Ledoux, Cormier, & Houle, 2014). Managerial obfuscation can
occur for all the above-mentioned reasons.
As a result, agency theory proposes equity compensation as an incentive to mitigate
managerial interests that do not coincide with shareholder interests (Verecchia, 2001). An
alternative view suggests that equity compensation does not provide an efficient incentive, and
instead rewards manager´s rent-seeking behavior (Blanchard, Lopez-de-Silanes and Shleifer,
1994; Yermack, 1997; Bertrand and Mullainathan, 2001). However, recent research findings
support agency theory´s view on equity compensation and find a positive relation between
disclosure activity and stock-price based incentives. Further suggesting that stock price incentives
motivate managers to make more informative disclosures (Nagar, Nanda, & Wysocki, 2003; Baik
Brockman, Farber, & Lee, 2017). Therefore the first hypothesis is as follows:

4
H1:CEO stock-based compensation positively affects the readability of 10-K disclosures.
According to agency theory equity compensation is supposed to motivate managers to
increase shareholder value by improving market liquidity. Therefore, I examine whether equity
compensation is associated to analyst forecast dispersion. Two theoretical views exist on how
executive compensation and firm performance are associated. The optimal contracting approach
argues that managers have little influence over their pay (Dong, Wang, & Xie, 2010; Borisova
Brockman, Salas, & Zagorchev, 2012) and thus argues that managerial compensation effectively
aligns managerial interests and shareholder interests (Jensen & Murphy, 1990; Liu, Uchida &
Yang, 2012). In this case, equity compensation should be significantly related with forecast
dispersion.
H2: CEO stock-price compensation affects analysts forecast dispersion.
Literature argues that more readable disclosures increase the proportion of public to private
information by signaling one interpretation that sets a stronger consensus, and thus decrease
forecast dispersion. On the other hand, some argue that more readable disclosures drive analysts
to conduct extensive research due to lower processing costs which in turn shift dynamic of private
and public information. In this scenario, analyst place more emphasis on privately obtained
information which results in an increase in forecast dispersion. Therefore, one part of this last
regression examines the relation between the main effect readability and analysts forecast
dispersion.
The last hypothesis examines the overall efficiency of these intertwining mechanisms
against agency problems by looking at whether an interaction effect exists between readability and
equity compensation on analyst forecast dispersion.
H3: Equity compensation affects the effectiveness of readability in reducing information
asymmetries among analysts.

5
This study employs OLS regression to tests the hypotheses. Results from the first
regression show a significant and negative association between readability and equity
compensation. Therefore, I accept H1. Results from the second regression show a significant and
positive association between equity compensation and analyst forecast dispersion thus confirming
H2. However, results from the third regression show an insignificant association between equity
compensation and forecast dispersion. This change in significance may be due to the addition of
the residuals from the first regression in the third regression, which would absorb variation
explained residuals. This contradicts prior theory which states equity compensation is linked to
measures of market liquidity. Lastly, the third regression finds no significant interaction effect of
readability and equity compensation on analyst forecast dispersion. Thus, suggesting equity
compensation does not provide an incentive for managers to improve readability.
Results highlight an inefficiency in both equity compensation and analyst behavior. On one
side, the negative association between equity compensation and readability shows that equity
compensation does not improve readability. However, the fact that analysts are affected by
readability confirms the importance of readable disclosures. On the other hand, this significant and
positive association between analyst forecast dispersion and readability indicates analysts are not
perfect information intermediaries. These findings should be of interest to policymakers and
regulators aiming to understand the net effectiveness of disclosure readability in mitigating agency
conflicts by looking beyond a one-on-one association and examining disclosure readability in
conjunction with other mechanisms that fight agency problems.
The remainder of this paper proceeds as follows. Section II provides a literature review and
hypothesis development. Section III outlines the methodology. Section V discusses sample
selection and summary statistics. Section IV summarizes the empirical results from tests of
hypotheses. Section V provides robustness tests. Lastly, Section VI concludes.

6
2. Literature Review
2.1 Theoretical Background
2.1.1 Agency Theory
Agency theory is one of the oldest theories in management and economics (Daily, Dalton,
& Rajagopalan, 2003; Wasserman, 2006). Agency theory discusses the conflicts that arises
between shareholders and managers.
Managers are well-aware of a firm´s strengths and weaknesses regarding its internal
processes and corporate policy, and the risks associated with current and future projects (Hofer &
Oehler, 2013). However, managers may be reluctant to disclose this information to shareholders
for several reasons. First, managers may want only to present a certain image of the firm to create
positive earnings surprises (Bissessur & Veenman, 2016). Second, managers consider that costs
associated with disclosure, such as proprietary costs and informational costs, do not outweigh the
benefits (Ledoux, Cormier, & Houle, 2014). Lastly, self-interested managers may obfuscate
information to weaken investors’ ability to discipline them. Managers tend to disclose less because
they do not want investors to see the bets that they are taking (Stewart, 2001). As a result, an
agency problem arises known as the disclosure agency problem (Nagar et al., 2003).
There are several ways of solving this agency conflict. One way is by linking managers´
compensation directly to disclosure activity. Unfortunately, the subjective nature of disclosures
makes it difficult to specify in a contract. A more effective alternative is equity-based
compensation, which ties managerial compensation to stock price. Assuming investors take into
account the quality and quantity of the information disclosed, and react immediately to disclosures,
stock price impounds disclosed information completely and in time (Nagar et al., 2003). Another
approach to mitigate agency conflicts is to assign two expert groups to monitor executives: board
of directors and analysts. Agency theory licensed analysts to actively monitor. Hence, analyst’s
role is to provide information to investors that would help investors reward profit-oriented firms
and punish self-dealing executives.
Analysts are viewed as important market participants, whose primary role is to collect,
process and disseminate financial information quickly to investors (Barth, Beaver, & Landsman,
1998; Palepu & Khanna, 2010). Additionally, the presence of analysts in the capital market reduces
the costs of accessing information and thus stimulate market efficiency (Kim, Lin, & Slovin, 1997;

7
Womack, 1996). Most prior studies suggest that analyst research stimulates market efficiency by
helping investors to better evaluate companies (Schipper, 1991; Brown L. D., 2000).
However, recent evidence has shown analysts do not behave in accordance with agency
theory. Schantl (2018) examines whether analyst´s behavior is substitutive or complementary to
corporate disclosure. The study finds analyst behavior to be dominated by the information costs
associated with acquiring the information. Only when it is cost efficient will an analyst have a
substitutive role. Therefore, suggesting that analysts are indeed responsive to managerial
incentives and opportunism. Chan et al (2007) assesses whether analyst favorably bias their
forecast to meet or surpass managers´ expectation. Results indicate that over time analyst
estimates tend to generate positive earnings surprises. This optimistic bias can be traced back to
managers who are pressured to meet earnings benchmarks and as a result limit or eliminate
information flow to analyst that make unfavorable forecasts.
Analysts´ forecasting accuracy is used as a control mechanism to ensure analysts’
monitoring role prevails in the presence of other interests. Inaccurate forecasts means analysts risk
losing their job and are less likely to be promoted (Hong & Kubik, 2003; Loh & Mian, 2006).
Despite such mechanisms analysts are often compensated for undermining their objectivity.
Analyst compensation is based on their ability to bring money in the company which involves
publishing favorable recommendations for IPOs (Michaely &Womack, 2005; Dechow & Sloan;
1997; Lin & McNichols, 1998; Reingold & Reingold, 2006). Despite the decrease in commission
revenue due to the elimination of fixed commissions, the investing banking revenues have
increased by fifty percent in the last twenty-five years (Fisch & Sale, 2003; Groysberg, Healy, &
Maber, 2008). This trend raises serious concerns about analyst´s objectivity given that their job
security relies on the firm´s financial standing. Matolcsy & Watt (2006) find supporting evidence
that analysts follow “good” firms to generate underwriting business for investment bankers.
Further observations display analysts’ preference for stock with high trading volumes such as
growth stock. As previously mentioned, analyst incentives are closely tied to banker´s objectives.
Thus, an increase in trading volume results in money for investment bankers and a reward for
analysts in the form of compensation (Jegadeesh N. , Kim, Krische, & Lee, 2005). One stream of
behavioral finance literature argues that sell-side analysts identify more as “trend chasers” than
“trend setters” (Hong, Harrison, & Stein, 1999). The job incentives that analyst currently have
weakens analyst´s role as a predicator of subsequent earnings (Jegadeesh et al., 2005).

8
2.1.2 Contracting Theory
Agency theory depicts stock-based compensation as a double-edged sword. Much of prior
research has focused on using executive compensation to alleviate the agency problem in publicly
traded companies. This approach recognizes an agency problem and seeks to provide an effective
incentive that will maximize shareholder value. However, an alternative view suggests that the
compensation scheme itself partly produces this agency problem. Contracting theory argues
agency problems cannot be eliminated due to contracting costs (Jensen et al., 1976). Several
researchers have acknowledged that some features of the compensation scheme do not provide an
efficient incentive, and instead reward manager´s rent-seeking behavior (Blanchard, Lopez-de-
Silanes and Shleifer, 1994; Yermack, 1997; Bertrand and Mullainathan, 2001). Nevertheless,
Bebchuk and Fried (2003 & 2004) argue that managerial power and rent extraction are key
determinants on the design of the compensation package. Both approaches agree that
compensation is arranged by market forces that push towards value-maximizing results, and
managers´ influence which pushes towards outcomes that deliver more personal gains. However,
the latter approach claims that the deviations from the value-maximizing outcomes are substantial
(Bebchuk et al., 2003).
Shareholders and regulators have determined that stock price-based compensation provides
the desired link between managerial interests and shareholder value. Unfortunately, suboptimal
pay structures exist due to unduly managerial influence. These suboptimal pay arrangements allow
for deviations from value-maximizing outcomes. Managers are interested in designing
compensation schemes that hide the extent of their rent extraction or lessen the pressure to
outperform. Similarly, such managers have the incentive to manage earnings and hide bad news.
A reduction in shareholder value caused by contractual inefficiencies, rather than excess
managerial gain, could be the biggest cost stemming from managerial influence on compensation
(Bar-Gill & Bebchuk, 2003).

9
2.2 Literature Review
2.2.1 Corporate Disclosure
During the 1990s and beginning of 21st century economists, public authorities and media
believed that the solution to the high information asymmetry between principals and agents was
corporate disclosure (Farvaque et al., 2011). Corporate disclosures is seen as a one-step solution
in reducing information asymmetry, establishing good governance, and allowing effective control
of managers (Farvaque et al., 2011). Disclosures are meant to inform investors about the share
value and how the firm creates value. The real objective is to provide information that is useful for
the individual reader in their daily decision making (Fagotto, Fung, Graham, & Weil, 2006).
Unfortunately, there are several ways in which disclosures deviate from this objective.
Studies show that high-quality disclosures reduce managers´ ability to profit by
manipulating information disclosed (Aboody & Kasznik, 2000; Bartov & Mohanram, 2004).
Improved disclosure quality mitigates managers’ rent extraction (Hui & Matsunaga, 2015). One
stream of literature insists that managers´ private benefits should fluctuate parallel with the firm´s
cost of capital (Lambert, Leuz, & Verrecchia, 2007). Yet another stream emphasizes the
importance of the board in overseeing managers´ decisions (Hermalin & Weisbach (2007). At the
same time the board is also responsible of setting an effective managerial incentive plan.
Empirical studies often resort to proxies or indirect methods to test agency costs. Khurana
Pereira, and Martin (2006) find a positive association between the transparency of corporate
disclosures and the firm´s growth, which is leads to the conclusion that more transparent firms
have easier access to external financing which lowers cost of capital. However, the fall in the costs
of capital can also due to increased share liquidity. In other words, disclosure attracts investors to
the market. Another mechanism that explains increased liquidity is namely the role played by
confidence (Coates, 2007). If disclosure reduces fraud, investors have more confidence in the
market and which results in a greater number of market participants. As the market becomes more
liquid, the market depth deepens and the bid-ask spread shrinks (Leuz & Verrecchia, 2000; Heflin,
Shaw, & Wild, 2005).
The informing nature of disclosures enhances the information in the financial market which
allows investors to have more accurate expectations. Firms that make more transparent disclosures
reduce investors uncertainty regarding that firms stock and as a result reduce stock price variation.

10
A reduction in stock price variation is associated with a lower cost of capital (Patel & Dallas,
2002). Ferrel (2007) and Lambert et al. (2007) provide supporting evidence that disclosures lead
to less volatility in returns. Akhigbe and Martin (2006) find that a reduction in returns volatility
only exists in the long-term, and that actually total risk, firm specific risk and systematic risk, all
increases in the short term. Are disclosures as beneficial as they are claim to be?
Corporate disclosures provide analysts with relevant information that leads to fast and precise
earnings forecasts (Lang & Lundholm, 1996). Lang and Lundholm (1996) find a negative
association disclosure rating and forecast dispersion. Another study finds that higher levels of
nonfinancial disclosures are associated with lower dispersion among analyst forecasts
(Vanstraelen, Zarzeski, & Robb, 2003). Nevertheless, some studies believe that more disclosure
could lead to either an increase or decrease in forecast dispersion (Harris & Raviv, 1993). Chemla
and Hennessy (2011) show that disclosure increases the informational asymmetries among
analysts as informational costs increase in cases where the firm frequently discloses complex
information, and uninformed investors have little interest in understanding the information. The
harder a disclosure is to read the higher the informational costs, and the less profitable the
informational investment in the disclosure becomes. Poorly informed agents and the heterogeneity
in an individual´s ability to process information increase the information asymmetries among
users. This argument is weaker when firms release clear and understandable disclosures to a large
public.
One type of corporate disclosure which is required by the SEC for publicly traded U.S.
firms is the 10-K Form. This is an annual report that communicates the firm´s economic activities
and financial condition. About 80% of the disclosure is textual narrative. Therefore, it is crucial
that the disclosure is clearly presented as it will impact how well users understand the information
being disclosed. In recent years 10-K reports have become longer and more complex (Bloomfield
, 2012).The SEC believes that this upward trend in hard-to-read disclosures is attributed to lawyers
protecting the issuer from potential liabilities (SEC, 2007). However, the SEC is determined to
make 10-K disclosures more readable for users (SEC, 2016). They argue that increased disclosure
grants investors better access to information. Fisch et al., (2003) show that with today´s
information technology disclosing information should be easy and cost-effective for firms.
Considering the increase in regulatory efforts, the complexity of disclosures is likely to be rooted
in the issuer (Dyer et al. 2017). Hence this paper looks beyond the legal environment and examines

11
the lack of clarity in disclosures stemming from managerial incentives (Lo, Ramos, & Rogo,
2017).
2.2.2 CEO Compensation
The use of stock price-based CEO compensation schemes has become extremely popular
over the last decade (Murphy, 1999). Although the goal of such compensation schemes is to align
managers´ and shareholders´ interests, there is empirical evidence that shows how stock-price
compensation can form an incentive for managers to manipulate information at a cost to
shareholders. Stock-based incentives can encourage managers to disclose favorable information
and obfuscate unfavorable information to increase their firms’ stock price and inflate their wealth.
For example, Aboody and Kasznik (2000) observe that managers strategically time the release
voluntary disclosures to increase their stock options. Richard, Teoh & Wysocki (2001) and Skinner
and Sloan (2001) find that indeed managers with higher levels of stock compensation are more
likely to manipulate a stock price increase. Meanwhile, Call, Kedia, and Rajgopal (2016) find that
firms use stock options to reward employees who are engaged in misreporting with the intention
to discourage whistle-blowing. Not surprisingly, Kim, Li and Zhang (2011) find that firms with
higher levels of managerial ownership pose a higher risk of future stock price crashes. They argue
that stock-priced incentives encourage managers to hide unfavorable news to prevent a stock price
decrease. Armstrong, Larcker, Ormazabal, and Taylor (2013) show that manager whose
managerial compensation is more closely tied to stock price volatility are more likely to misreport.
These studies associate firm disclosure with managers´ rent extraction.
Other research, however, suggests managers engage in more transparent behavior to reduce
cost of capital (Botosan 1997 ; Francis, Olsson, & Nanda, 2008 ; Easley & O’Hara 2004). Diamond
& Verrecchia (1991) show that increased disclosure in annual reports is linked to a decrease in
cost of capital. More recently, Bushman and Smith (2001) and Biddle and Hilary (2006), provide
empirical evidence that higher quality disclosures are also associated with increased cash flows
due to increased investment efficiency.
This study adds to this literature by examining the association between stock-based
managerial compensation and disclosure readability. The following questions arise; Do managers
have an incentive to effectively communicate information? Does the complexity of the written
document affect their efforts? Are analysts affected by the complexity of the written document?

12
Do analysts take a complementary or a substitutive role? I attempt to answer these questions by
examining whether the incentive exists for CEOs to manipulate the readability of disclosures, and
whether this effort affects sell-side analyst behavior.
2.2.3 Disclosure Readability & Analysts Forecasts
Prior research shows that disclosure format can affect the weight put on private information
(Maines and McDaniel 2000; Hodge, Kennedy, & Maines 2004; Elliott 2006 ; Elliott, Hodge,
Kennedy, & Pronk 2007 ). Li (2008) provides evidence that increased disclosure readability
improves the processing fluency and reduces analysts´ incentive to search for private information.
Asay, Elliot, & Rennekamp (2017) provide supporting evidence that analysts rely more on private
information when disclosures are less readable. Change in the proportion of private information to
public information changes the information asymmetry among analysts. Information asymmetry
among analysts is often measured by forecast dispersion. Lehavy, Li and Merkley (2011)
measures the readability of 10-K filing using Fog index and finds that less readable disclosures are
associated with higher analyst following, and greater analyst forecast dispersion. Authors argue
that less readable texts make it harder for investors to process the information themselves causing
demand for analysts´ work to rise. This results in a greater collective effort by analysts, and lower
forecast dispersion. A more recent study, confirms that less readable disclosures increase the
information asymmetry among investors (Lee ,2012). Interestingly, research conducted by
Loughran and McDonald in 2014 shows no significant relationship between readability and
forecast dispersion when using a longer time frame (Loughran & McDonald, 2014).

13
3. Hypothesis Development
Prior research assumes that managerial disclosure choices are aligned with investors´
interest, and explains any non-disclosure with proprietary costs (Verrecchia, 2001). Nagar et al.,
(2003) study how equity compensation can mitigate the agency conflict that may exist in
managerial disclosures. They find a positive relation between disclosure activity and stock-price
based incentives. Their results suggest that stock price incentives motivate managers to make more
informative disclosures. Another study, Baik et al., (2017) finds that indeed more equity
compensation leads to improved information environment but only when coupled with superior
manager ability. If equity incentives drive managers´ disclosure choices, then I expect a positive
relation between CEO stock-based compensation and readability of 10-K.
H1: CEO stock-based compensation positively affects the readability of 10-K disclosures.
Literature approaches executive compensation and firm performance from two theoretical
standpoints, the optimal contracting approach and the managerial power approach (Bebchuk et al.,
2003). Under the optimal contracting approach, executives are viewed as having less influence
over their pay (Dong et al; 2010; Borisova et al, 2012). This results in a compensation package
that better aligns managerial incentives with shareholder interests (Jensen and Murphy, 1990; Liu
et al, 2012). In contrast, the managerial power approach suggest that executives can significantly
influence the design of the compensation package through managerial power. Managerial power
is often associated with abuse of power and managerial entrenchment. Managerial autonomy
increases the likelihood of optimistically biased disclosures which prior research has found to
significantly reduce analysts´ forecast dispersion (Lim, 2001). A differing perspective argues that
analysts view more powerful managers as less reliable, and naturally future earnings as more
uncertain (Bebchuck et al., 2004; Chen, Liu, and Li, 2010). As previously mentioned, an increase
uncertainty equals an increase in forecast dispersion. Therefore, I expect CEO stock-price based
compensation to affect analysts forecast dispersion, but cannot determine the directionality of the
relation.
H2: CEO stock-price compensation affects analysts forecast dispersion.

14
The last hypothesis examines whether equity compensation affects the effectiveness of
readability in reducing information asymmetries and whether analysts are affected by such efforts.
The first two hypotheses test whether an association exists between equity compensation and
readability, and whether equity compensation is associated to analyst forecast dispersion.
However, are analysts affected by readability? Some argue that a more readable disclosure can
increase the proportion of public to private information, and thus decrease forecast dispersion.
Disclosures with higher readability can also decrease forecast dispersion by signaling one
interpretation that sets a stronger consensus. Considering this, analysts may take a complementary
role and display herding behavior. The efficient market hypothesis supports this view by
suggesting analysts’ research does not add value to the market because investors already know all
publicly available information. The underwriting and bribery hypothesis also supports this
accommodating role of analysts. Current studies provide evidence of analysts being optimistically
biased displays a conformity with managers´ interests. On the other hand, analysts can take a
substitutive role. More readable disclosures can increase the incremental value of analysts’ reports.
As disclosures become more readable, costs of processing the information lower, and thus
analysts´ reports become more profitable reports. This view on analysts suggests analysts´
behavior is dominated by the information costs associated with acquiring the information. Analysts
are more likely to conduct extensive research when processing costs are low. As a result, they put
more weight on this privately obtained information, changing the proportion of public to private
information, and therefore increasing forecast dispersion.
Based on H1, H2, and literature on readability and analyst behavior, I expect equity
compensation to affect the relation between readability and analysts forecast dispersion.
H3: Equity compensation affects the effectiveness of readability in reducing information
asymmetries among analysts.
15
4. Methodology
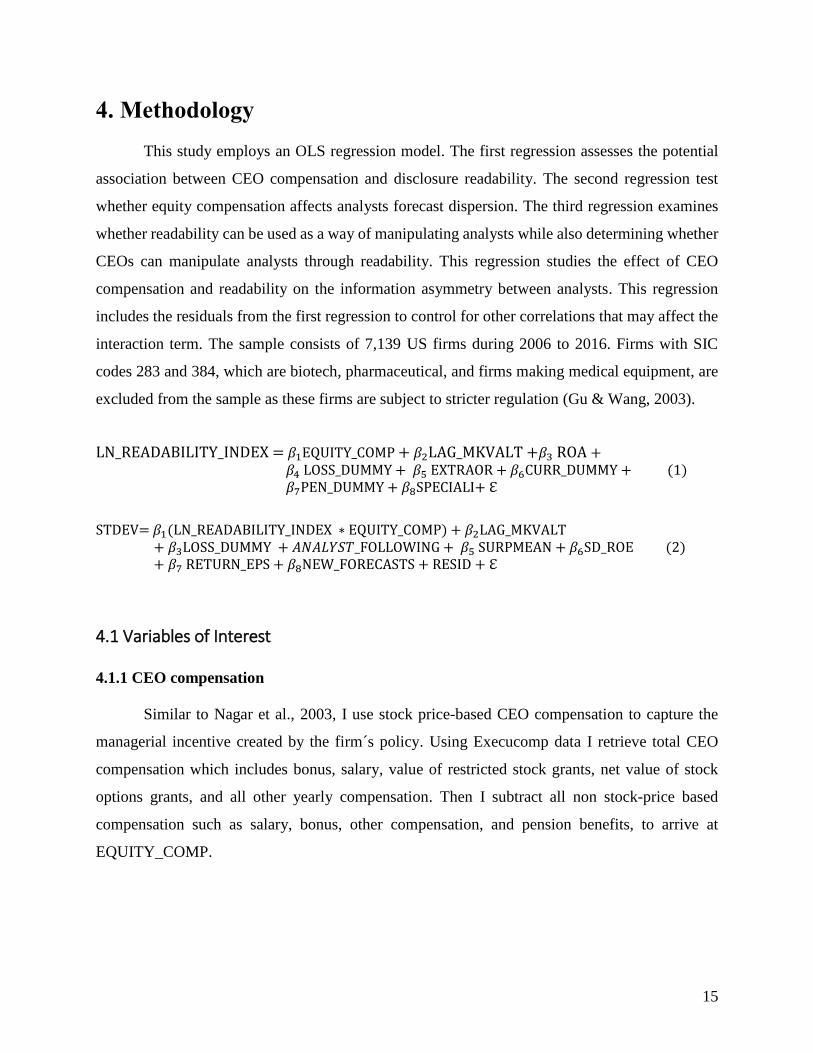
This study employs an OLS regression model. The first regression assesses the potential
association between CEO compensation and disclosure readability. The second regression test
whether equity compensation affects analysts forecast dispersion. The third regression examines
whether readability can be used as a way of manipulating analysts while also determining whether
CEOs can manipulate analysts through readability. This regression studies the effect of CEO
compensation and readability on the information asymmetry between analysts. This regression
includes the residuals from the first regression to control for other correlations that may affect the
interaction term. The sample consists of 7,139 US firms during 2006 to 2016. Firms with SIC
codes 283 and 384, which are biotech, pharmaceutical, and firms making medical equipment, are
excluded from the sample as these firms are subject to stricter regulation (Gu & Wang, 2003).
LN_READABILITY_INDEX = 𝛽1EQUITY_COMP + 𝛽2LAG_MKVALT +𝛽3 ROA + 𝛽4 LOSS_DUMMY + 𝛽5 EXTRAOR + 𝛽6CURR_DUMMY + (1) 𝛽7PEN_DUMMY + 𝛽8SPECIALI+ ℇ
STDEV= 𝛽1(LN_READABILITY_INDEX ∗ EQUITY_COMP) + 𝛽2LAG_MKVALT + 𝛽3LOSS_DUMMY + 𝐴𝑁𝐴𝐿𝑌𝑆𝑇_FOLLOWING + 𝛽5 SURPMEAN + 𝛽6SD_ROE (2) + 𝛽7 RETURN_EPS + 𝛽8NEW_FORECASTS + RESID + ℇ
4.1 Variables of Interest
4.1.1 CEO compensation
Similar to Nagar et al., 2003, I use stock price-based CEO compensation to capture the
managerial incentive created by the firm´s policy. Using Execucomp data I retrieve total CEO
compensation which includes bonus, salary, value of restricted stock grants, net value of stock
options grants, and all other yearly compensation. Then I subtract all non stock-price based
compensation such as salary, bonus, other compensation, and pension benefits, to arrive at
EQUITY_COMP.

16
4.1.2 Forecast Dispersion
This study uses forecast dispersion as a proxy for the information asymmetries among
analysts. Two theoretical constructs exist to explain how common and private information
influence forecast dispersion and error differently; consensus and uncertainty (Barron et al., 2010).
Consensus refers the ratio of common uncertainty to overall uncertainty. Uncertainty, on the other
hand, refers to the expected squared error in individual forecasts averaged across analysts. The
more uncertainty the greater the forecast dispersion, and the more consensus the lesser the forecast
dispersion. Forecast dispersion, STDEV, is measured as standard deviation of forecasts in first
quarter of the year following the fiscal year of a 10-K report scaled by beginning stock price of the
following year (Hope, 2010). Standard deviation of forecasts and stock price are obtained from
IBES database and CRSP respectively. At least two or more analyst forecasts are required from
I/B/E/S in the period between the 10-K filing date and the firm’s next quarterly earnings
announcement.
4.1.2 Readability
Extant research adopts a variety of approaches to analyze the narratives in annual reports.
Even though each approach varies in what it measures, the implicit underlying construct across all
approaches is quality of disclosure. Disclosure quality will be evaluated by how easy or difficult a
text is to read. Examining this aspect of narrative disclosures is more representative of manager´s
discretion, given that requirements often determine the content (Guay, Samuels, & Taylor, 2016;
Dyer, Lang, & Stice-Lawrence, 2017). One of the best-known readability measures is the Fog
index.
This study, however, will use net file length as proxy for readability. Laughron and
McDonald, (2014) recommend using file size of 10-K disclosures as measure for readability as it
is less prone to measurement error than other traditional measures like the FOG index, it is easily
calculated and is strongly correlated to other readability measures. Net file size better fits this study
because by nature business related disclosures are prone to contain many highly complex words.
As seen in the equation above, the number of complex words forms one of the components of the
Fog index. Even when business files use multi-syllable words to describe operations they are
easily understood by investors. For example, words like agreement, management, and operations,
17
which occur regularly in 10-Ks, are categorized as complex words though most investors
comprehend them. Furthermore, a very small number of words will lead the word count for
complex words. Around 52 complex words will account for 25% or more of the total complex
word count. Secondly, results show that the second component of the Fog index, average number
of words per sentence, provides a weak estimate of readability in financial documents (Loughran
et al., 2014).
Data is extracted from Loughran and McDonald 10X File Summaries. Loughran-
McDonald measure net file size as the total number of characters in the filing after the Stage One
Parse. The study measures all SEC EDGAR filings by type and year from 1993 until 2017. This
study, as previously mentioned, only focuses on 10-K filings.
4.2 Control Variables
The first part of this section discusses the control variables used when studying the relation
between CEO stock price-based compensation and disclosure quality. While the second part
discusses the variables which are likely to be highly correlated to analyst´ forecasts and disclosure
quality.
4.2.1 Control Variables H1
Firm size has been shown to be reflective of proprietary costs which are known to affect
disclosure choice (Verrecchia, 1990). Firm size, MKVALT, is measured as the market value of
the firm´s equity at the beginning of the fiscal and is obtained from CRSP database. It may be that
the degree of complexity in 10-Ks is related to a firm’s operation. Therefore, the following control
variables control for disclosure complexity. ROA proxies for firm performance and is return on
total assets. SPECIALI is special items lagged by total assets. Special items include write-downs,
goodwill impairment charges, and other restructuring charges. LOSS_DUMMY indicates whether
net income is negative. Doyle, Ge, and McVay (2007) find that international transfers add legal
burdens and complexity to financial reporting. Thus, I also control for accounting complexity using
foreign currency translation adjustment, CURR_DUMMY, which is 1 if the value is non-zero and
zero otherwise. Rees and Shane (2012) show that pension related adjustments increase the
informational costs of disclosures. In addition, they find that these pension related adjustments are

18
of interest to the market. On the other hand, Bebchuk and Fried (2003) document that less
transparent firms are associated with executive compensation which is more decoupled from
managerial performance. Firms often use pension plans, deferred compensation, postretirement
perks and consulting contracts to hide the amount of the compensation and insensitivity of the
compensation with performance (Bebchuk at al., 2003). Furthermore, such deferred benefits are
often accompanied with additional taxes, which in this case are paid by the firm, instead of the
beneficiary (Bebchuk et al., 2003). Another issue is the lack of clarity surrounding the efficiency
of postretirement perks and postretirement consulting fees. All in all, such arrangements make
CEO pay less lucid. Therefore, such pension benefits are controlled for with PENN_DUMMY,
which equals 1 if the value of pension related adjustments is non-zero. EXTRAOR controls
additional accounting complexity by scaling extraordinary items and discontinued operations with
total assets.
4.2.2 Control Variables H2, H3
The directionality of news content is likely to influence uncertainty. That is good news is more
likely to reduce uncertainty due to analysts´ strong incentive to optimistically skew disclosures.
While bad news is expected to increase uncertainty because this news is inconsistent with
investors’ prior beliefs. In other words, favorable disclosures significantly reduce analysts´
forecast dispersion, while unfavorable disclosures significantly increase analysts´ forecast
dispersion. LOSS_DUMMY controls for the directionality in disclosure content, which equals 1
if there is a net loss and zero otherwise. This data is obtained from Compustat. SURPMEAN is
found in IBES database and it controls for the magnitude in earnings information being disclosed.
Consider that information regarding the launch of a new product is disclosed. Such information is
likely to increase earnings surprise and lower consensus among analysts. SUPRMEAN will be
measured as the absolute value of the difference between the current year´s earnings per share and
last year´s earnings per share, divided by the price at the beginning of the fiscal year (Lang et al.,
1996). Another control variable is firm size which has been shown to affect analyst following and
disclosure quality. Firm size, MKVALT, is measured as the market value of the firm´s equity at
the beginning of the fiscal and is obtained from CRSP database. Furthermore, I control for analyst
following as higher analyst following enables herding behavior. All these factors affect analysts´
incentive to collect information and consequently their forecasts (Lang et al., 1996). Analyst

19
following is measured as the count of analyst codes in the first quarter of the year following 10-K
fiscal year. I also control for return-earnings correlation which is likely to be positively correlated
to analyst following considering that a higher return-earnings correlation makes predicting future
earnings easier (King, Pownall, & Waymire, 1990). Return-earnings correlation is calculated as
the historical correlation between annual returns and earnings computed over the preceding year.
Another factor to consider is standard deviation of ROE, which is measured as the historical
standard deviation of return on equity computed over the preceding three years. A higher standard
deviation of ROE is likely to make it more difficult for analyst to predict future earnings.
Furthermore, I control for analyst following as higher analyst following enables herding behavior.
All these factors affect analysts´ incentive to collect information and consequently their forecasts
(Lang et al., 1996). Return-earnings correlation, standard deviation of ROE, and analyst following
are all extracted from IBES database. Moreover, since IBES database does not recognize stale
forecasts including the percent of new forecasts should reduce any systematic variation due to
differences in the proportion of recently revised forecasts. Lang and Lundholm (1993) find a strong
positive relation between disclosure quality, firm performance, and return variability. Therefore, I
control for the level of firm performance using yearly average CRSP stock returns and return
variability, RETURN_EPS, which is calculated as the historical correlation between annual and
earnings computed over the preceding year. The percent of new forecasts, NEW_FORECASTS,
will be measured as the number of forecasts at the month-end minus the number of first-time
forecasts issued during the month divided by the number of forecasts at the month-end.

20
5. Results
5.1 Sample Selection
A sample of 7,139 observations was formed after merging the available data from
Compustat, CRSP, I/B/E/S and Laughron & McDonald. Data was merged using the official ticker
and year. After merging Compustat and I/B/E/S, 206,573 observations were dropped. Subsequent
merging with CRSP, led to 36,087 observations being dropped. Final merger with Laughron &
McDonald resulted in 54,271 observations being dropped.
5.2 Empirical Model
The merged data results in an unbalanced panel data. Therefore, the OLS regression
command used is areg which accommodates for heteroscedasticity, autocorrelation, as well as
varying degrees of freedom. Areg reports robust standard errors that adjust for change in degrees
of freedom by lowering the degrees of freedom with the number of fixed effects swept away in
within-group variation (Wooldridge, 2010).
5.3 Summary Statistics
The summary statistics are reported in Table 1. LN_ READABILITY_INDEX has a mean
and median of 13 and 13 respectively and a standard deviation of 0.45. The mean and median of
EQUITY_COMP is 3,611 and 1,952 respectively, with a standard deviation of 13,825. Analyst
forecast dispersion, measured by STDEV, has a mean median of 0.2 and 0, with a standard
deviation of 16. The sample firms vary in size, with mean and median of LAG_MKVALT of
$12204 million and $3045 million. ROA has a mean and median of 0.05 and 0.05 and standard
deviation of 0.1. The interquartile range is 0.01 and 0.09. SPECIALI has mean and median, -0.01
and 0, with standard deviation of 0.06. The respective interquartile range is -0.01 and 0. The mean
and median for ANALYST_FOLLOWING is 26 and 16, with a standard deviation of 34 and an
interquartile range of 9 and 28. SUPRMEAN has mean and median of -3 and 2, with a standard
deviation of 989 and an interquartile range of 0.64 and 2.7. While mean and median of SD_ROE is
16 and 4. This variable has a standard deviation of 124 and an interquartile range of 2 and 7.
RETURN_EPS, displays a mean and median of 5 and 4 respectively, with a standard deviation of

21
21 and interquartile range from 0.72 to 3. NEW_FORECASTS has a mean and median of 0.11 and
0.07, standard deviation of 0.5 and interquartile range between -0.15 and 0.25. Considering that
spread of normal data is within 3 standard deviations of the mean and the significant difference
between mean and median, the observations of some variables are not symmetrically distributed.
Hence, I winsorize all variables, excluding dummy variables, at the 1st and 99th percentile.

TABLE 1
Summary Statistics
Variable n Mean S.D. Min. 0.25 Mdn 0.75 Max
LN_READABILITY_INDEX 7139 13 0.45 11.69 13 13 13 15
LN_LAG_READABILITY_INDEX 7139 13 0 12 12.61 12.87 13.19 15.44
EQUITY_COMP 7139 3611.07 13825.16 -99000 0 1952.34 5715.33 290000
STDEV 7139 0.20 15.85 0 0 0 1338 0.85
LAG_MKVALT 7139 12203.84 33360.7 19.8 1167 3045.19 9220.95 630000
LOSS_DUMMY 7139 0.13 0.33 0 0 0 0 1
ROA 7139 0.05 0.10 -2 0.01 0.05 0.09 0.76
EXTRAOR 7139 0 0.01 -0.89 0 0 0 0.23
CURR_DUMMY 7139 0.67 0.47 0 0 1 1 1
PEN_DUMMY 7139 0.57 0.50 0 0 1 1 1
SPECIALI 7139 -0.01 0.06 -1.54 -0.01 0 0 0.50
ANALYST_FOLLOWING 7139 25.67 34.29 1 9 16 28 548
SURPMEAN 7139 -2.64 988.95 -80000 0.72 1.57 2.86 20694.01
SD_ROE 7139 15.78 123.87 0.08 1.91 3.63 7.27 7118.77
RETURN_EPS 7139 5.49 21.07 -353.09 1.81 3.58 6.86 420.78
NEW_FORECASTS 7139 0.11 0.50 -0.88 -0.15 0.07 0.25 11
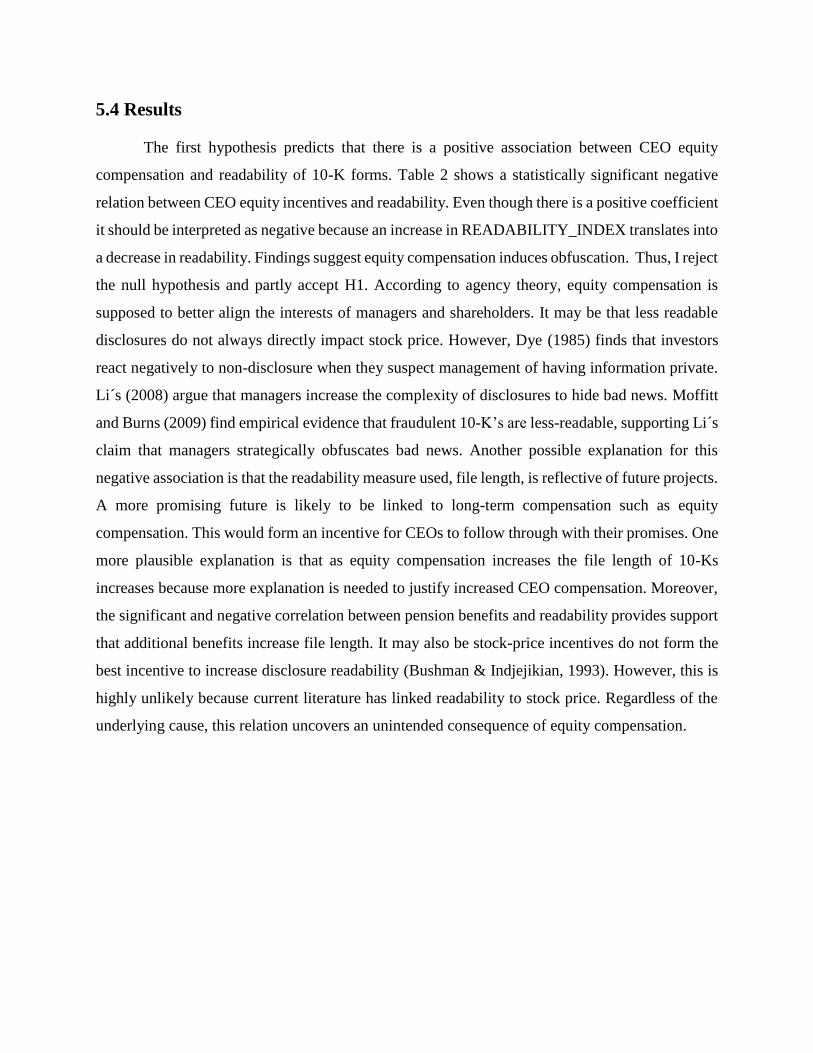
5.4 Results
The first hypothesis predicts that there is a positive association between CEO equity
compensation and readability of 10-K forms. Table 2 shows a statistically significant negative
relation between CEO equity incentives and readability. Even though there is a positive coefficient
it should be interpreted as negative because an increase in READABILITY_INDEX translates into
a decrease in readability. Findings suggest equity compensation induces obfuscation. Thus, I reject
the null hypothesis and partly accept H1. According to agency theory, equity compensation is
supposed to better align the interests of managers and shareholders. It may be that less readable
disclosures do not always directly impact stock price. However, Dye (1985) finds that investors
react negatively to non-disclosure when they suspect management of having information private.
Li´s (2008) argue that managers increase the complexity of disclosures to hide bad news. Moffitt
and Burns (2009) find empirical evidence that fraudulent 10-K’s are less-readable, supporting Li´s
claim that managers strategically obfuscates bad news. Another possible explanation for this
negative association is that the readability measure used, file length, is reflective of future projects.
A more promising future is likely to be linked to long-term compensation such as equity
compensation. This would form an incentive for CEOs to follow through with their promises. One
more plausible explanation is that as equity compensation increases the file length of 10-Ks
increases because more explanation is needed to justify increased CEO compensation. Moreover,
the significant and negative correlation between pension benefits and readability provides support
that additional benefits increase file length. It may also be stock-price incentives do not form the
best incentive to increase disclosure readability (Bushman & Indjejikian, 1993). However, this is
highly unlikely because current literature has linked readability to stock price. Regardless of the
underlying cause, this relation uncovers an unintended consequence of equity compensation.

24
TABLE 2
Effect of Equity Compensation on Readability (n= 7139)
Term Estimate Std. Error t-statistic p-value
EQUITY_COMP 0.000 0.000 3.470 0.001
LAG_MKVALT 0.000 0.000 12.000 0.000
ROA -1.061 0.094 -11.270 0.000
LOSS_DUMMY 0.03 0.020 1.520 0.121
EXTRAOR -0.502 1.810 -0.280 0.915
CURR_DUMMY 0.112 0.013 8.340 0.000
PEN_DUMMY 0.098 0.011 8.870 0.000
SPECIALI 0.543 0.203 2.680 0.006
Constant 12.822 0.013 979.630 0.000
Adj-R2 0.261
______________________
This table presents the test for H1 for whether equity compensation is linked to readability. The dependent variable is file length
of 10-K form in year t. EQUITY_COMP is CEO equity compensation for year t. Industry and year fixed effects are included, but
not reported. Robust standard errors are clustered at the firm level. All other variables are defined in Appendix D.
The second hypothesis predicts that CEO equity compensation affects forecast dispersion. Table
3 shows that equity compensation is significantly associated with forecast dispersion. Therefore, I
reject null hypothesis and accept H2. This provides supporting evidence that equity compensation
is tied to measures of market liquidity.
TABLE 3
Effect of Equity Compensation on Analyst Forecast Dispersion (n= 7139)
Term Estimate Std. Error t-statistic p-value
EQUITY_COMP -0.000 0.000 -3.89 0.000
LAG_MKVALT -0.000 0.000 -4.93 0.000
LOSS_DUMMY 0.005 0.000 13.29 0.000
ANALYST_FOLLOWING -0.000 0.000 -1.33 0.182
SURPMEAN 0.000 0.000 2.78 0.005
SD_ROE 0.000 0.000 6.33 0.000
RETURN_EPS 0.000 0.000 0.14 0.889
NEW_FORECASTS -0.000 0.000 -0.39 0.700
Constant 0.001 0.000 10.37 0.000
Adj-R2 0.211
______________________ This table provides results that test H2. The dependent variable is STDEV_W which is calculated as the standard deviation of forecasts in the first quarter of year t+1 scaled by stock price at beginning of year t+1. EQUITY_COMP is ratio of equity compensation over total compensation at end
of year t. Industry and year fixed effects are included, but not reported. Robust standard errors are clustered at the firm level. All other variables are
defined in Appendix D.

25
The third hypothesis predicts equity compensation influences the relation between
readability and analyst forecast dispersion. Results in Table 4, however, show otherwise. As seen
from Table 4, the interaction effect of READABILITY_INDEX and EQUITY_COMP is not
statistically significant. Figure 1 (See Appendix C) plots readability at different values of equity
compensation. The parallel lines depicted show that effect of readability on forecast dispersion
does not differ at different values of equity compensation. In addition, it is notable from the main
effects that readability is significantly correlated with analyst forecast dispersion confirming prior
empirical evidence. As previously mentioned, a positive coefficient for READABILITY_INDEX
should be interpreted as a negative coefficient because an increase in READABILITY_INDEX
translates into a decrease in readability. However, this is not the case with equity compensation.
While the correlation between equity compensation and analyst forecast dispersion proves that
equity incentives successfully links managers´ interest with shareholders´ interests, the main
effects in this regression show otherwise. Results from Table 4 displays an insignificant relation
between equity compensation and analyst forecast dispersion. This change in significance may be
due to the addition of residuals from the first regression as control variable. Further suggesting that
the significant in H2 exists due to the omission of other correlated variables. In conclusion, equity
compensation fails to create an incentive to increase readability. Lastly, the positive coefficient, in
this case negative coefficient, between readability and forecast dispersion suggests analysts take
an accommodating role. This indicates that analysts do not function as perfect information
intermediaries.

26
TABLE 4
Moderating Effect of Equity Compensation on the Relation Between Readability and Analyst
Forecast Dispersion (n= 7139)
Term Estimate Std. Error t-statistic p-value
LAG_READABILITY_INDEX 0.001 0.000 3.29 0.001
EQUITY_COMP 0.000 0.000 0.52 0.606
LAG_READABILITY_INDEX*EQUITY COMP -0.000 0.000 -0.65 0.516
LAG_MKVALT -0.000 0.000 -5.31 0.000
LOSS_DUMMY 0.005 0.000 13.16 0.000
ANALYST_FOLLOWING -0.000 0.000 -1.64 0.100
SURPMEAN 0.000 0.000 2.73 0.006
SD_ROE 0.000 0.000 6.27 0.000
RETURN_EPS 0.000 0.000 0.13 0.896
NEW_FORECASTS -0.000 0.000 -0.19 0.852
RESID 0.001 0.000 2.26 0.024
Constant -0.008 0.003 -2.81 0.005
Adj-R2 0.216 _____________________ This table displays the results of H3. The dependent variable is STDEV_W which is calculated as the standard deviation of forecasts in the first
quarter of year t+1 scaled by stock price at beginning of year t+1. LAG_READABILITY_INDEX#EQUITY_COMP is the interaction term of the
file length of 10-K report corresponding to fiscal year t and equity compensation scaled by total compensation at end of year t. Industry and year fixed effects are included, but not reported. Robust standard errors are clustered at the firm level. All other variables are defined in Appendix D.

6. Robustness Check
Table 5 (See appendix A) presents the Pearson/Spearman correlation matrix. Pearson´s
bivariate correlation assumes the variables tested are normality distributed. However, as previously
mentioned most variables are slightly to moderately skewed. Therefore, in this case, a Spearman
correlation, which also tests the null hypothesis of independence between two variables, is most
suitable. Results show significant correlation between the variables.
From Table 5 (See appendix A) the following correlations are noteworthy.
LOSS_DUMMY and ROA have the largest correlation of -0.58. While ROA and
READABILITY_INDEX have a -0.30 correlation. It is expected that READABILITY_INDEX
and LAG_MKVALT also be correlated at larger companies are likely to have more projects and
business segments compared to smaller companies and therefore require more disclosure.
Moreover, PENN_DUMMY and LAG_MKVALT are correlated at 0.29. Lastly, SPECIALI and
LOSS_DUMMY are also significantly correlated at -0.30. The extent of other correlations with
READABILITY_INDEX are rather small and may be due to the nature of readability. The
variation in readability, unlike content, may be less easily explained by firm characteristics (Li,
2008). ANALYST_FOLLOWING and LAG_MKVALT are highly correlated at 0.48 .
SURPMEAN and LAG_MKVALT are also strongly correlated at 0.37. LOSS_DUMMY and
SUPRMEAN have a negative correlation of 0.25. SURPMEAN and STDEV are also substantially
negatively correlated 0.24. In addition, RETURN_EPS and STDEV are significantly correlated at -0.38 and
RETURN_EPS and ANALYST_FOLLOWING at -0.32. Lastly, NEW_FORECASTS and
ANALYST_FOLLOWING are also correlated at 0.28.
Table 6 (See appendix B) display the multicollinearity of the independent variables. VIFs
between 1 and 5 have a moderate correlation, and do not warrant corrective measures. Results
show moderate collinearity for all variables. Thus, dismissing the need to take corrective action.
It should be noted that the readability measure used in this study is based on a lesser used
method of readability; length of file. This more simplistic approach was introduced by Laughron
and McDonald (2014) as a proxy for disclosure complexity. Several studies have found significant
results by using file length as readability measure (You & Zhang, 2009; Loughran & McDonald,
2010; Miller 2010). This readability measure is may be representative of more content specific
characteristics, such as more promising projects, and not exactly readability (Li et al., 2011).

28
7. Conclusion
Results from H1 show that there is a significant association between equity compensation
and readability. However, this relation does not behave as predicted, instead it shows that equity
compensation decreases readability. This would imply that managers profit from less readable 10-
K Forms, which contradicts evidence that less readable disclosures decrease stock price/liquidity.
It may be that the readability measure used, file length, is reflective of future investments. An
increase in investments calls for an explanation and thus an increase in file length. Furthermore, a
promising future is likely to be linked to long-term compensation, such as equity compensation,
to form an incentive for CEOs to follow through with their promises. Another possible explanation
for why equity compensation increases file length is that more explanation is necessary to justify
increased CEO compensation. The significant and negative correlation between pension benefits
and readability supports the latter argument that additional benefits increase file length. It would
be interesting to see if the directionality of this relation changes when another readability measure
is used. Findings for H2 show equity compensation is significantly linked to analyst forecast
dispersion. Results also show a negative and significant correlation between equity compensation
and forecast dispersion which suggests equity compensation creates an incentive to reduce forecast
dispersion. This finding leads the way for H3 which predicts that managers use readability to affect
analyst forecasts. Results indicate that analysts are significantly affected by readability. Thus,
crushing agency theory´s expectation of analysts as perfect information intermediaries. The
negative relation between analyst forecast dispersion and readability depicts analyst as biased and
as a result highlights the important role of equity compensation in alleviating agency conflicts.
Furthermore, the fourth regression results show that equity compensation has no moderating effect
on readability when the response variable is analyst forecast dispersion. Why is readability not
directly linked to equity compensation? Results from H3 show that equity compensation is
ineffective at reducing the information asymmetry among analysts. This finding would explain
why equity compensation has no moderating effect on the relation between readability and analyst
forecast dispersion. The unconventional negative association between equity compensation and
readability, and the insignificant relation between equity compensation and analyst forecast
dispersion provide support for the managerial power approach, which suggests managerial power
results in a CEO compensation package that is poorly aligned with shareholder interests.

29
To conclude, equity compensation is ineffective at reducing information asymmetries
among analysts and ineffective at incentivizing CEOs to be transparent. This provides support for
previous literature which argues that pay-for-performance compensation can itself be a factor of
the agency problem. Most importantly, it provides insightful evidence that current executive
compensation schemes lack direct linkage to other important measures such as transparency.
Maybe alleviating the agency problem in publicly traded companies should start by rewarding
more sustainable qualities such as transparency rather than performance.

30
Bibliography
Aboody, D., & Kasznik, R. (2000). CEO stock option awards and the timing of corporate voluntary
disclosures . Journal of Accounting and Economics, 29(1), 73-100.
Akhigbe, A., & Martin, A. (2006). Valuation impact of Sarbanes-Oxley: Evidence from disclosure
and governance within the financial services industry. Journal of Banking and Finance,
30, 989-1006.
Arand, D., & Kerl, A. G. (2015). Sell-side analyst research and reported conflicts of interest.
European Financial Management, 21, 20-51.
Armstrong, C., Larcker, D., Ormazabal , G., & Taylor , D. (2013). The relation between equity
incentives and misreporting : The role of risk-taking incentives. Journal of Financial
Economics, 109, 327-350.
Asay, H. S., Elliott, W. B., & Rennekamp, K. (2017). Disclosure readability and the sensitivity of
investors´ valuation judgements to outside information. The Accounting Review , 1-25.
Baik, B., Brockman, P. A., Farber, D. B., & Lee, S. (2017). Managerial Ability and the Quality of
Firms´ Information Environment . Journal of Accounting, Auditing & Finance, 1-33.
Bar-Gill, O., & Bebchuk, L. A. (2003). Corporate transparency and managerial incentives.
Harvard Law School .
Barney, J. (1991). Firm resources and sustained competitive advantage. Journal of Management,
99-120.
Barron, J., & Miranti, P. J. (1999). A History of Corporate Finance. New York : Cambridge
University Press.
Barron, O. E., Byard, D., Kile, C., & Riedl, E. J. (2002). High-Technology Intangibles and
Analysts´ Forecasts. Journal of Accounting Research, 289-312.
Barron, O. E., Kile, C. O., & Okeefe, T. B. (2010). MD&A quality as measured by the SEC and
analysts´ earnings forecasts. Contemporary Accounting Research, 75-109.
Barron, O. E., Kim, O., Lim, S. C., & Stevens, D. E. (1998). Using Analysts´Forecasts to Measure
Properties of Analysts´ Information Environment. The Accounting Review, 73(4), 421-433.
Barron, O., & Stuerke, P. (1998). Dispersion in analysts´s earnings forecasts as a measure of
uncertainty. Journal of Accounting, Auditing, and Finance, 243-268.

31
Barth, M. E., Beaver, W. H., & Landsman, W. R. (1998). Relative valuation roles of equity book
value and net income as a function of financial health . Journal of Accounting and
Economics, 25(1), 1-34.
Barth, M. E., Kasznik, R., & McNicholas, M. F. (2001). Analyst coverage and intangible assets.
Journal of Accounting Research, 1-34.
Bartov, E., & Mohanram, P. (2004). Private information, earnings manipulations, and executive
stock-option excercises . The Accounting Review , 79(4), 889-920.
Bebchuk, L. A., & Fried, J. M. (2003). Executive Compensation as an Agency Problem. Journal
of Economic Perspectives , 17(3), 71-92.
Bebchuk, L. A., & Fried, J. M. (2004). Pay without Performance. Harvard University Press.
Bernhardt, D., Campello, M., & Kutsoati, E. (2006). Who herds? Journal of Financial Economics,
80(3), 657-675.
Bertrand, M., & Mullainathan, S. (2001). Are CEOs Rewarded for Luck? The Ones Without
Principles Are. Quarterly Journal of Economics, 901-932.
Beyer , A., Cohen , D. A., Lys, T. Z., & Walther , B. R. (2010). The financial reporting
environment: Review of the recent literature. Journal of Accounting and Economics, 50(2-
3), 269-343.
Bhushan, R. (1989). Firm characteristics and analyst following. Journal of Accounting and
Economics, 255-274.
Biddle, G., & Hilary, G. (2006). Accounting quality and firm-level capital investment. The
Accounting Review, 81(5), 963-982.
Bissessur, S. W., & Veenman, D. (2016). Analyst information precision and small earnings
surprises. Review of Accounting Studies, 21(4).
Blanchard , O., Lopez-de-Silanes, F., & Shleifer, A. (1994). What do Firms do with Cash
Windfalls? Journal of Financial Economics , 337-360.
Bloomfield , R. (2012). A pragmatic approach to more efficient corporate disclosure . Accounting
Horizons, 26, 357-370.
Bodie, Z., Marcus, A., & Kane, A. (2014). Investments Global Edition. McGraw-Hill Higher
Education.
Boot, A. W., & Thakor, A. V. (2001). The many faces of information disclosure. Review of
Financial Studies, 1021-1057.

32
Borisova, G., Brockman, P., Salas, J., & Zagorchev, A. (2012). Government ownership and
corporate governance: evidence from the EU . Journal of Banking and Finance, 36, 2917-
2934.
Bose, R., & Luo, X. (2012). Green IT adoption: a process management approach. International
Journal of Accounting & Information Management, 20(1), 63-77.
Botosan, C. A. (1997). Disclosure level and the cost of equity capital . The Accounting Review,
72(3), 323-349.
Bozzolan, S., Favotto, S., & Ricceri, R. (2002). Narrative reporting on intangibles: an analysis of
Italian listed companies. The Transparent Enterprise (pp. 25-26). The Value of Intangibles.
Bradshaw, T. M., Miller, G. S., & Serafeim, G. (2008). Accounting method heterogeneity and
analysts´ forecasts. Harvard University and University of Michigan.
Brown, L. D. (2000). I/B/E/S Research Bibliography. I/B/E/S International Incorporated.
Brown, L., Call, A., Clement, M., & Sharp, N. (2013). Inside the Black Box of Sell Side Financial
Analysts. Temple University .
Brown, S., & Hillegeist, S. A. (2003). Disclosure quality and information asymmetry. Kellogg
School of Management.
Bushman, R., & Indjejikian, R. (1993). Accounting income, stock price and managerial
compensation. Journal of Accounting and Economics, 16, 3-23.
Bushman, R., & Smith, A. (2001). Financial accounting information and corporate governance.
Journal of Accounting and Economics, 32(1/3), 237-333.
Call, A., Kedia, S., & Rajgopal, S. (2016). Rank and File Employees and the Discovery of
Misreporting: The Role of Stock Options. Journal of Accounting and Economics, 62, 277-
300.
Cañibano Calvo, L., Sanchez Muñoz, P., Garcia-Ayuso Covarsi, M., & Chaminade Olea, C.
(2002). Meritum: Guidelines for Managing and Reporting on Intangibles. Madrid:
Fundacion Airtel Movil.
Chan, L. K., Karceski, J., & Lakonishok, J. (2007). Analysts´ Conflict of Interest and Biases in
Earnings Forecasts. The Journal of Financial and Quantitative Analysis, 42(4), 893-913.
Chen, J., Liu, X., & Li, W. (2010). The effect of insider control and global benchmarks on Chinese
executive compensation. Corporate Governance: An International Review , 18(2), 107-
123.

33
Chen, S., & Matsumoto, D. (2006). Favorable Versus Unfavorable Recommendations: The Impact
on Analyst Access to Management-Provided Information. Journal of Accounting
Research, 657-89.
Chen, T., Harford, J., & Lin, C. (2012). Do financial analysts play a monitoring role? Evidence
from natural experiments. The Chinese University of Hong Kong.
Chen, X., Wright, S., & Wu, H. (2018). Exploration intensity, analyst´ private information
development and their forecast performance. Accounting and Business Research.
Chung, K. H., & Charoenwong, C. (1991). Investment options, assets in place and the risk of
stocks. Financial Management, 21-33.
Clarkson, P. M., Kao, J. L., & Richardson, G. D. (1994). The voluntary inclusion of forecasts in
the MD&A section of annual reports. Contemporary Accounting Research, 423-450.
Clatworthy, M., & Lee, E. (2018). Financial analysts´ role in valuation and stewardship.
Accounting and Business Research.
Clement, M. (1999). Analyst forecast accuracy: do ability, resources, and portfolio complexity
matter? Journal of Accounting and Economics, 27(3), 285-303.
Coates, J. I. (2007). The goals and promise of the Sarbanes-Oxley Act. Journal of Economic
Perspectives , 21(1), 91-116.
Core , J. E. (2001). A review of the empirical disclosure literature . Journal of Accounting and
Economics, 31(3), 441-456.
Daily, C. M., Dalton, D. R., & Rajagopalan, N. (n.d.). Governance through ownership: Centuries
of practice, decades of research. Academy of Management Journal , 151-158.
Daley, L. A., Senkow, D. W., & Vigeland, R. L. (1988). Analysts´ forecasts, earnings variability,
and option pricing. The Accounting Review, 563-585.
Dechow, P. M., & Sloan, R. G. (1997). Returns to Contrarian Investment Strategies: Tests of Naive
Expectations Hypotheses. Journal of Financial Economics, 3-27.
Depoers, F. (2000). A cost-benefit study of voluntary disclosure: some empirical evidence from
French listed companies. European Accounting Review, 9(2), 246-274.
Diamond, D. W. (1985). Optimal Release of Information by Firms. 828-862.
Diamond, D., & Verrecchia, R. (1991). Dsiclosure, liquidity, and the cost of capital . The Journal
of Finance , 46(4), 1325-1359.

34
Ding, D. K., Charoenwong, C., & Seetoh, R. (2004). Prospect Thoery, Analyst Forecast, and Stock
Returns. Journal of Multinational Financial Management, 14, 425-422.
Dong, Z., Wang , C., & Xie , F. (2010). Do executive stock options induce excessive risk taking?
Journal of Banking and Finance, 34, 2518-2529.
Doyle, J., McVay, S., & Ge, W. (2007). Determinants of weaknesses in internal control over
financial reporting. Journal of Accounting and Economics, 44, 193-223.
Dye, R. (1985). Disclosure of nonproprietary information. Journal of Accounting Research, 23,
123-145.
Dyer , T., Lang , M., & Stice-Lawrence, L. (2017a). The evolution of 10-K textual disclosure:
evidence from latent dirichlet allocation. Journal of Accounting and Economics, 221-245.
Easley, D., & O´Hara, M. (2004). Information and the cost of capital. The Journal of Finance,
59(4), 1553-1583.
Eccles, R. G., Herz, R. H., Keegan, E. M., & Phillips, D. M. (2001). The Value Reporting
Revolution: Moving Beyond the Earnings Game. New York: John Wiley & Sons.
Elliott, W. (2006). Are investors infleunced by pro forma emphasis and reconciliations in earnings
annoucements? The Accounting Review , 81(1), 113-133.
Elliott, W. B. (2006). Are investors influenced by pro forma emphasis and reconciliations in
earnings annoucements? The Accounting Review, 113-133.
Elliott, W. B., Hodge, F. D., Kennedy, J. J., & Pronk, M. (2007). Are M.B.A students a good proxy
for nonprofessional investors? The Accounting Review, 139-168.
Elliott, W., Kennedy , J., Hodge , D., & Pronk, M. (2007). Are M.B.A. students a good proxy for
nonprofessional investors? The Accounting Review , 92(1), 93-114.
Fagotto, E., Fung, A., Graham, M., & Weil, D. (2006). The effectiveness of regulatory disclosure
policies. Journal of Policy Analysis and Management, 25(1), 155-181.
Fama, E. F. (1970). Efficient Capital Markets: A Review of Theory and Empirical Work. The
Journal of Finance, 383-417.
Farvaque, E., Refait-Alexandre, C., & Saidane, D. (2011). Corporate Disclosure: A review of its
(direct and indirect) benefits and costs. Economie Internationale, 5-31.
Ferrel, A. (2007). Mandatory disclosure and stock returns: Evidence from the over-the-counter
market . The Journal of Legal Studies , 213-253.

35
Fisch, J. E., & Sale, H. A. (2003). The Securities Analyst as Agent: Rethinking the Regulation of
Analysts. Penn Law: Legal Scholarship Repository.
Francis, J. R., Olsson, P. M., & Nanda, D. (2008). Voluntary disclosure, earnings quality, and cost
of capital . Journal of Accounting Research, 46(1), 53-99.
Frankel, R., Kothari, S. P., & Weber, J. (2006). Determinants of informativeness of analyst
research. Journal of Accounting and Economics, 29-54.
Goshen, Z., & Parchomovsky, G. (2006). Legal Scholarship Repository. Retrieved from
University of Pennsylvania Law School:
https://scholarship.law.upenn.edu/faculty_scholarship/549
Groysberg, B., & Healy, P. (2013). Wall Street Research: Past, Present, and Future. Stanford
University Press.
Groysberg, B., Healy, P., & Maber, D. (2008). What drives sell-side analyst compensation at high-
status banks? Harvard Business School.
Gu, F., & Wang, W. (2003). Intangible assets and analysts´ earnings forecast. Boston: Boston
University .
Guay, W., Samuels, D., & Taylor, D. (2016). Guiding through the fog: financial statement
complexity and voluntary disclosure . Journal of Accounting and Economics, 234-269.
Hakansson, N. (1977). Accounting Review.
Harris, M., & Raviv, A. (1993). Differences of Opinion Make a Horse Race. Review of Financial
Studies, 6(3), 473-506.
Heflin, F., Shaw, K., & Wild, J. (2005). Disclosure quality and market liquidity: Impact of depth
quotes and order sizes . Contemporary Accounting Research , 22(4), 829-865.
Hennessy, C., & Chemla, G. (2011). Private versus publicly optimal skin in the game: optimal
mechanism and security design. CEPR Discussion Paper.
Hermalin, B., & Weisbach, M. (2007). Transparency and corporate governance . NBER Working
paper No. W12875.
Hermalin, B., & Weisbach, M. (2012). Information disclosure and corporate governance. The
Journal of Finance, 67(1), 195-233.
Ho, T., Strong, N., & Walker, M. (2018). Modelling analysts´target price revisions following good
and bad news? . Accounting and Business Research.
36
Hodge, F. D., Kennedy, J. J., & Maines, L. A. (2004). Does search-facilitating technology improve
the transparency of financial reporting? The Acoounting Review, 687-703.
Hodge, F., Kennedy, J., & Maines, L. (2004). Does search-facilitating technology improve the
transparency of financial reporting? The Accounting Review , 79(3), 687-703.
Hofer, A., & Oehler, A. (2013). Sell-side security analysts in the nexus of principal-agent relations:
An information economics perspective. Corporate Ownership & Control, 10(2).
Hong, H., & Kubik, J. (2003). Analyzing the analysts: Career concerns and biased forecasts.
Journal of Finance, 58, 313-352.
Hong, H., & Kubik, J. D. (2003). Analyzing the Analysts: Career Concerns and Biased Earnings
Forecasts. The Journal of Finance.
Hong, H., Lim, T., & Stein, J. C. (2000). Bad news travels slowly: Size, analyst coverage, and the
profitability of momentum strategies. The Journal of Finance, 265-295.
Hong, Harrison, & Stein, J. C. (1999). A unified theory of underreaction, momentum trading and
overreaction in asset markets. Journal of Finance, 2143-2184.
Hope , O.-K. (2010). Accounting Policy Disclosures and Analysts´ Forecasts. Contemporary
Accounting Research.
Hope, O.-K., Vyas, D., Zhou, Y., & De Franco, G. (2013). Analyst report reability. Contemporary
Accounting Research.
Hui, K. W., & Matsunaga, S. R. (2015). Are CEOs and CFOs rewarded for disclosure quality? The
Accounting Review , 90(3), 1013-1047.
Hussainey, K., & Athanasakou, V. E. (2014). The perceived credibility of forward-looking
performance disclosures. Accounting and Business Research, 227-259.
Imhoff, E., & Lobo, G. (1992). The effect of ex ante earnings uncertainty on earnings response
coefficients. The Accounting Review, 427-439.
Jegadeesh, N., Kim, J., Krische, S. D., & Lee, C. M. (2005). Analyzing the Analysts: When Do
Recommendations Add Value? The Journal of Finance.
Jegadeesh, N., Kim, J., Krische, S., & Lee, C. (2004). Analyzing the analysts: when do
recommendations add value? Journal of Finance, 1083-1124.
Jensen, M., & Meckling, W. (1976). Theory of the firm: Management behaviour, agency costs,
and ownership structure . Journal of Financial Economics, 3(4), 305-360.

37
Jensen, M., & Murphy, K. (1990). How do powerful CEOs affect analyts´ coverage . European
Financial Manangement , 1-24.
Kadan, O., Madureira, L., Wang, R., & Zach, T. (2009). Conflicts of interest and stock
recommendations: the effects of the global settlement and related regulations. The Review
of Financial Studies, 22, 4189-4217.
Khurana, I., Pereira, R., & Martin, X. (2006). Firm growth and disclosure: An empirical analysis
. Journal of Financial and Quantitative Analysis, 41(2), 357-380.
Kim, J., Li, Y., & Zhang, L. (2011). CFOs versus CEOs: equity incentives and crashes. Journal of
Financial Economics, 101, 713-730.
Kim, S. T., Lin, J.-C., & Slovin, M. B. (1997). Market Structure, Informed Trading, and Analysts´
Recommendations. The Journal of Financial and Quantitative Analysis, 32(4), 507-524.
King, R., Pownall, G., & Waymire, G. (1990). Expectations adjustment via timely earnings
forecast disclosure: review, synthesis, and suggestions for future research. Journal of
Accounting Literature , 9, 113-144.
Knill, A., Minnick, K., & Nejadmalayeri, A. (2012). Experience, information asymmetry, and
rational forecast bias. Review of Quantitative Finance and Accounting, 241-272.
Kohlbeck, M. J., & Warfield, T. (2002). The role of unrecorded intangoble assets in residual
income valuation: the case of banks. Madison: University of Wisconsin-Madison.
Lambert, R., Leuz, C., & Verrecchia, R. (2007). Accounting information, disclosure, and the cost
of capital. Journal of Accounting Research, 45(2), 385-420.
Lang , M. H., & Lundholm, R. J. (1996). Corporate Disclosure Policy and Analyst Behavior . The
Accounting Review .
Ledoux, M. J., Cormier, D., & Houle, S. (2014). Customer value disclosure and analyst forecasts:
the influence of environmental dynamism. Management Decision, 460-481.
Lee, Y. (2012). The Effect of Quarterly Report Readability on Information Efficiency of Stock
Prices. Contemporary Accounting Research, 29, 1137-1170.
Leuz, C., & Verrecchia, R. (2000). The economic consequences of increased disclosures. Journal
of Accounting Research , 31-40.
Lev, B. (2001). Intangibles: Management, Measurement, and Reporting. Washington DC:
Brookings Institution Press.

38
Lev, B., & Gu, F. (2002). Intangible Assets: Concepts and Measurements. New York: New York
University.
Li, F. (2008). Annual report readability, current earnings, and earnings persistence. Journal of
accounting and economics, 221-247.
Li, F. (2010). The information content of forward-looking statements in corporate filings-A naive
bayesian machine learning approach. Journal of Accounting Research, 48, 1049-1102.
Li, F., Lehavy , R., & Merkley, K. (2011). The effect of annual report readability on analyst
following and the properties of their earnings forecasts. The Acocunting Review, 1087-
1115.
Lim, T. (2001). Rationality and Analysts´ Forecast Bias . The Journal of Finance, 396-385.
Lin, H.-w., & McNichols, M. F. (1998). Underwriting relationships, analysts´earnings forecats and
investment recommendations. Journal of Accounting and Economics, 101-127.
Liu , C., Uchida, K., & Yang, Y. (2012). Corporate governance and firm value during the global
financial crisis: evidence from china. International Review of Financial Analysis , 21, 70-
80.
Lo, K., Ramos, F., & Rogo, R. (2017). Earnings management and annual report readability .
Journal of Accounting and Economics, 1-25.
Loh, R. K., & Mian, G. M. (2006). Do accurate earnings forecasts facilitate superior investment
recommendations? Journal of Financial Economics, 455-483.
Loh, R., & Mian, G. (2006). Do accurate earnings forecasts facilitate superior investment
recommendations? Journal of Financial Economics, 455-483.
Loughran, T., & McDonald, B. (2010). Measuring readability in financial text. University of Notre
Dame.
Loughran, T., & Mcdonald, B. (2014). Measuring readability in financial disclosures . Journal of
Finance.
Loughran, T., & McDonald, B. (2014). Measuring Readability in Financial Disclosures . Journal
of Finance(69), 1643-1671.
Maines , L., & McDaniel, L. (2000). Effects of comprehensive-income characteritics on
nonprofessional investors´ judgements: The role of financial-statement presentation format
. The Accounting Review , 75(2), 179-207.

39
Maines, L. A., & McDaniel, L. S. (2000). Effects of comprehensive-income characteristics on
nonprofessional investors´ judgements: The role of financial-statement presentation
format. The Accounting Review, 179-207.
Martinez, A. L. (2004). Analisando os analistas: estudo empirico das projecoes de lucros e das
recomendacoes dos analistas do mercado de capitais para as empresas brasileiras de
capital aberto. FGV.
Matolcsy, Z., & Wyatt, A. (2006). Capitalized intangibles and financial analysts. Accounting and
Finance.
Mayo, M. (2011). Exile on Wall Street: One Analyst´s Fight to Save the Big Banks from
Themselves. Hoboken: John Wiley & Sons.
Michaely, R., & Womack, K. L. (2005). Market Efficiency and Biases in Brokerage
Recommendations. In Advances in Behavioral Finance.
Mikhail, M. B., Walther, B. R., & Willis, R. H. (1999). Does forecast accuracy matter to security
analysts? The Accounting Review, 185-200.
Mikhail, M., Walther, B., & Willis, R. (1997). Do Security Analysts Improve Their Performance
with Experience? Journal of Accounting Research , 35, 131-157.
Miller, P. B. (2010). The effects of reporting complexity on small and large investor trading . The
Accounting Review , 2107-2143.
Moffitt, K., & Burns, M. (2009). What does that mean? Investigating obfuscation and readability
cues as indicators of deception in fraudulent financial reports. AMCIS 2009 Proceedings
(p. 399). http://aisel.aisnet.org/amcis2009/399. Retrieved from AIS Electronic Library:
http://aisel.aisnet.org/amcis2009/399
Murphy , K. (1999). Executive compensation. Handbook of Labor Economics, 3.
Nagar, V., Nanda , D., & Wysocki, P. (2003). Discretionary disclosure and stock-based incentives.
Journal of Accounting and Economics, 283-309.
Owusu-Ansah, S., & Yeoh, J. (2005). The efect of legislation on corporate disclosure practices. A
Journal of Accounting, Finance and Business Studies, 92-109.
Palepu, K. G., & Healy, P. M. (1993, March). The Effect of Firms´ Financial Disclosure Strategies
on Stock Prices. Accounting Horizon, 7, 1-11.
Palepu, K. G., & Khanna, T. (2010). Winning in Emerging Markets-A Road Map For Strategy &
Execution. Indian Journal of Industrial Relations, 46(2), 360-362.

40
Patel, S., & Dallas, G. (2002, October ). Transparency and disclosure; overview of methodology
and study results. New York: Standard & Poor´s .
Rees, L., & Shane, P. (2012). Academic research and standard-setting: The case of other
comprehensive income. Accounting Horizons, 26(4), 789-881.
Reingold, J., & Reingold, D. (2006). Confessions of a Wall Street Analyst: A True Story of Inside
Information and Corruption in the Stock Market. HarperCollins.
Richardson, S., Teoh, S., & Wysocki, P. (2001). The walkdown to beatable analyst forecasts: the
roles of equity issuance and insider trading incentives. University of Michigan, Ohio State
University, and MIT Sloan School of Management.
Salzedo, C., Young, S., & El-Haj, M. (2018). Does equity analyst research lack riguor and
objectivity? Evidence from conference calls questions and research notes. Accounting and
Business Research.
Schantl, S. (2018). Analyst information acquisition and the relative informativeness of analysts
and managed earnings. Accounting and Business Research.
Schipper, K. (1991). Analysts´ forecasts. Accounting Horizons, 5, 105-121.
SEC. (2002). SEC Interpretation: Management´s Discussion and Analysis of Financial Condition
and Results of Operations; Certain Investment Company Disclosures. U.S. Securities and
Exchange Commision.
SEC. (2010). Analyzing Analyst Recommendations. Retrieved from U.S. Securities and Exchange
Commission: https://www.sec.gov/tm/reportspubs/investor-
publications/investorpubsanalystshtm.html
Securities and Exchange Commission (SEC). (2016). Moving forward with the Commission´s
Disclosure Effectiveness Initiative . Washington, D.C.: U.S. Securities and Exchange
Commission.
Skinner, D., & Sloan, R. (2001). Earnings surprises, growth expectations, and stock returns or
don´t let an earnings torpedo sink your portfolio. University of Michigan Business School
.
Soltes, E. (2014). Private interaction between firm management and sell-side analysts. Journal of
Accounting Research, 245-272.
Stewart, S. (2001). Stern Stewart roundtable on capital structure and stock repurchase . Journal of
Applied Corporate Finance, 8-41.
41
Sunder, S. V., Partha, & Mohanram. (2006). How has regulation FD affected the operations of
financial analysts? Contemporary Accounting Research, 491-525.
Tong, H. (2007). Disclosure standards and market efficiency: Evidence from analysts´ forecasts.
Journal of International Economics, 222-241.
van der Meer-Kooistra, J., & Zijlstra, S. M. (2001). Reporting on intellectual capital. Accounting,
Auditing & Accountability Journal, 14(4), 456-476.
Vanstraelen, A., Zarzeski, M. T., & Robb, S. W. (2003). Corporate Nonfinancial Disclosure
Practices and Financial Analyst Forecast Ability Across Three European Countries.
Journal of International Financial Management & Accounting, 14(3), 249-278.
Vergauwen, P., & van Alem, F. (2005). Annual report IC disclosures in the Netherlands, France
and Germany. Journal of Intellectual Capital, 89-104.
Verrecchia, R. E. (1982). The Use of Mathematical Models in Financial Accounting/Discussions.
Journal of Accounting Research.
Verrecchia, R. E. (2001). Essay on disclosure. Journal of Accounting and Economics, 91-180.
Wasserman, N. (2006). Stewards, agents, and the founder discount: Executive compensation in
new ventures. Academy of Management Journal , 960-976.
Williams, S. M. (2001). Is intellectual capital performance and disclosure practices related?
Journal of Intellectual Capital, 192-203.
Womack, K. (1996). Do Brokerage analysts´ recommendations have investment values? . Journal
of Finance, 5(1), 137-167.
Wooldridge, J. M. (2010). Econometric Analysis of Cross Section and Panel Data. Cambridge,
Massachusetts: The MIT Press.
Wyatt, A. (2005). Accounting recognition of intangible assets: theory and evidence on economic
determinants. The Accounting Review, 967-1003.
Yermack, D. (1997). Good tming: CEO stock option awards and company news annoucements.
Journal of Finance, 449-476.
Yin, H., & Zhang, H. (2014). Tournaments of financial analysts. Review of Accounting Studies,
573-605.
You, H., & Zhang, X. (2009). Financial reporting complexity and investor underreaction to 10-K
information. Review of Accounting Studies, 14(4), 559-586.

42
Yu, F. (2008). Analyst coverage and earnings managment. Journal of Financial Economics, 245-
271.
Zhang, X.-j., & You, H. (2009). Financial reporting complexity and investor underreaction to 10-
K information. Review of Accounting Studies, 559-586.
Ziebart , D. (1990). The association between concensus of beliefs and trading activity surrounding
earnings announcements. The Accounting Review, 477-488.

APPENDIX A Pearson & Spearman Correlation
TABLE 7
LN_READA
BILITY_IND
EX
EQUITY_CO
MPSTDEV
LAG_MKVA
LTROA
LOSS_DUM
MYEXTRAOR
CURR_DUM
MY
PEN_DUMM
YSPECIALI
ANALYST_
FOLLOWIN
G
SURPMEAN SD_ROERETURN_EP
S
NEW_FORE
CASTS
LN_READABILITY
_INDEX 1 -0.0128 0.2179 0.2186 -0.2951 0.101 -0.0031 -0.0227 0.1959 -0.0652 0.1151 0.0443 0.0119 -0.1035 0.0125
EQUITY_COMP -0.0217 1 -0.1575 0.1934 0.209 -0.073 -0.0213 0.1412 -0.1833 -0.0497 0.1951 0.0475 0.0855 -0.0369 -0.0087
STDEV 0.1284 -0.0634 1 -0.2984 -0.3994 0.3036 0.0001 -0.185 0.0328 -0.0446 -0.0136 -0.1302 0.2361 -0.0183 -0.001
LAG_MKVALT 0.1742 0.0717 -0.0818 1 0.2547 -0.2012 0.0254 0.2338 0.2872 0.0124 0.4837 0.368 -0.0513 -0.3104 -0.0152
ROA -0.2209 0.1317 -0.2686 0.1325 1 -0.5802 -0.0032 0.1926 -0.0427 0.2074 0.1447 0.2733 0.0586 -0.0731 -0.0103
LOSS_DUMMY 0.0925 -0.0588 0.3224 -0.097 -0.6364 1 -0.0228 -0.0057 -0.0614 -0.2956 -0.0276 -0.2585 0.1424 -0.1016 -0.0032
EXTRAOR 0.002 -0.0176 -0.0432 0.0339 0.0434 -0.0506 1 -0.0414 -0.0357 0.023 -0.0081 -0.0075 -0.0069 0.023 -0.0119
CURR_DUMMY -0.0139 0.1018 -0.1007 0.17 0.1052 -0.0063 -0.0181 1 0.158 -0.2334 0.1415 0.097 0.0352 -0.1009 0.0103
PEN_DUMMY 0.1948 -0.1572 -0.0172 0.1424 -0.0174 -0.0629 0.001 0.1604 1 -0.1011 0.1147 0.2232 -0.0643 -0.1889 0.0312
SPECIALI -0.038 0.0075 -0.0632 0.0415 0.5085 -0.4789 0.0356 -0.1039 -0.015 1 -0.0196 0.0235 -0.0489 0.0311 0.0206
ANALYST_FOLLO
WING 0.0385 0.1534 -0.0077 0.2442 0.062 -0.0003 0.013 0.0878 0.0719 -0.0031 1 0.225 0.1227 -0.3153 0.2837
SURPMEAN 0.0221 -0.0079 0.0403 0.128 0.1306 -0.1216 -0.0023 0.0296 0.1277 0.0309 0.1071 1 -0.1121 -0.4192 0.0159
SD_ROE 0.0209 0.0077 0.151 -0.0126 0.024 0.0584 0.0027 0.0203 -0.0159 0.0025 -0.0122 -0.0353 1 -0.0471 -0.0046
RETURN_EPS -0.0541 -0.0133 -0.0029 -0.0828 0.006 -0.0539 0.0204 -0.0413 -0.0955 0.0282 -0.1246 -0.0989 0.0224 1 -0.1013
NEW_FORECASTS -0.0135 -0.0203 -0.005 -0.0491 -0.0204 0.0006 -0.0111 -0.0113 0.0049 0 0.199 -0.0195 -0.0216 -0.0082 1

APPENDIX B Multicollinearity
TABLE 8
Variable VIF SQRT VIF Tolerance R-Squared
LN_READABILITY_INDEX 1.16 1.08 0.8624 0.1376
EQUITY_COMP 1.09 1.05 0.9155 0.0845
STDEV 1.21 1.10 0.8291 0.1709
LAG_MKVALT 1.18 1.09 0.8451 0.1549
ROA 2.13 1.46 0.4704 0.5296
LOSS_DUMMY 1.94 1.39 0.5144 0.4856
EXTRAOR 1.01 1.00 0.9934 0.0066
CURR_DUMMY 1.12 1.06 0.8968 0.1032
PEN_DUMMY 1.15 1.07 0.8727 0.1273
SPECIALI 1.51 1.23 0.6609 0.3391
ANALYST_FOLLOWING 1.17 1.08 0.8518 0.1482
SURPMEAN 1.08 1.04 0.9288 0.0712
SD_ROE 1.04 1.02 0.9639 0.0361
RETURN_EPS 1.04 1.02 0.9622 0.0378
NEW_FORECASTS 1.06 1.03 0.9417 0.0583
Mean VIF 1.26

APPENDIX C Plot Margin

APPENDIX D Variable List
READABILITY_INDEX the total number of characters in the filing after the Stage One Parse.
STDEV measured as standard deviation of forecasts in first quarter of the year following the fiscal year of a 10-K report scaled by beginning stock price of the following year.
EQUITY_COMP total CEO compensation minus all non stock-price based compensation such as salary, bonus, other compensation, and pension benefits.
MKVALT market value of the firm´s equity at the beginning of the fiscal.
ROA proxies for firm performance and is return on total assets.
SPECIALI special items lagged by total assets. Special items include write-downs, goodwill impairment charges, and other restructuring charges.
LOSS_DUMMY which equals 1 if there is a net loss and zero otherwise.
CURR_DUMMY which is 1 if the value of foreign currency translation adjustment is non-zero and zero otherwise.
PENN_DUMMY wich equals 1 if the value of pension related adjustments is non-zero
ANALYST_FOLLOWING measured as the count of analyst codes in the first quarter of the year following 10-K fiscal year.
EXTRAOR extraordinary items and discontinued operations scaled by total assets.
RETURN_EPS calculated as the historical correlation between annual returns and earnings computed over the preceding year.
SURPMEANmeasured as the absolute value of the difference between the current year´s earnings per share and last year´s earnings per share, divided by the price at the beginning of the fiscal
year.
SD_ ROE measured as the historical standard deviation of return on equity computed over the preceding 3 years.
NEW_FORECASTS measured as the number of forecasts at the month-end minus the number of first-time forecasts issued during the month divided by the number of forecasts at the month-end.