the nested game of authoritarian elections
TRANSCRIPT

Patterns of Repression and Manipulation Towards a Topography of Authoritarian Elections, 1980–2002
Andreas Schedler
CIDE Centro de Investigación y Docencia Económicas Department of Political Studies Carretera México-Toluca 3655 Col. Lomas de Santa Fe CP 01210 Mexico City Mexico
E-mail: [email protected] Phone: +52/55/5727-9828 Web page: www.cide.edu
Paper prepared for delivery at the 20th World Congress of the International Political Science Association (IPSA), Fukuoka, Japan, 9–13 July 2006.
Draft 1.0.
Please, do not cite without author’s permission. Comments highly welcome.

Abstract
Electoral authoritarian regimes represent the modal type of political regimes in the developing world. To control electoral outcomes, such regimes may deploy a broad variety of repressive and manipulative measures. Despite their empirical as well as normative relevance, we possess little systematic comparative knowledge about the strategies of electoral control these regimes pursue. Do electoral authoritarian rulers strive to maximize control by cumulating repressive and manipulative strategies? Or do they try to optimize control by carefully selecting and targeting their strategies? This paper explores empirical configurations of authoritarian strategies on the basis of existing data on human rights violations, media restrictions, and legislative ineffectiveness as well as new data on vote-seat disproportionality, electoral fraud, and opposition exclusion.
2

At present, electoral authoritarian regimes represent the modal type of political regimes in the developing world. Such regimes are Potemkin villages, elaborate exercises in simulation. On paper, they look like democracies. They display the whole institutional infrastructure of constitutional democracy, from regular elections, parties, parliaments, and election commissions to court systems, subnational governments, civic associations, and private media. In practice, however, they subvert democratic minimum norms in systematic and profound ways, turning multiparty elections into instruments of authoritarianism, rather than “instruments of democracy” (Powell 2000).
The incipient literature on these new forms of authoritarianism in the contemporary world has been much concerned with establishing the external boundaries of electoral autocracies, with identifying their defining attributes that distinguish them from electoral democracies on the one side and from the residual category of non-electoral autocracies on the other (Diamond 2002, Schedler 2002 and 2006). It is quite evident, however, that the broad category of electoral authoritarianism masks significant within-regime variation. Electoral autocracies form an extensive family of regimes that show significant variance on at least two key dimensions: (a) the degree and patterns of inter-party competitiveness and (b) the degree and patterns of authoritarian control. While I examined variations in competitiveness in an earlier paper (Schedler 2004), in the subsequent pages I explore variations in authoritarian control.
To reconstruct empirical configurations of incumbent strategies under electoral authoritarianism, I shall combine original data with existing datasets from various sources. After outlining the menu of authoritarian control rulers have at their disposition, I shall describe (quite extensively, despite my aspiration to synthetic brevity) my set of cases and variables. My cases comprise the universe of authoritarian elections worldwide from 1980 to 2002 almost in its entirety. While unavoidably incomplete, my variables cover a broad set of strategies of authoritarian control. They include infringements of human rights (violations of physical integrity), the denial of civil liberties (media restrictions), gradations in horizontal violence (societal war), the disempowerment of legislative assemblies (legislative ineffectiveness), the exclusion of opposition parties and candidates, and the commission of electoral fraud (in both legislative and presidential elections). I examine patterns of association between these strategies through a variety of simple statistical techniques, such as correlation analysis, principal component analysis, and comparisons of means. In my conclusion, I highlight the principal findings and sketch some issues for future research.
The Chain of Democratic Choice
If we wish to survey the multiple ways in which electoral authoritarian rulers violate normative minimum standards of democratic elections, we have to establish these democratic minima in the first place.1
3

Democratic elections are mechanisms of social choice under conditions of freedom and equality. They offer effective choice of political authorities among a community of free and equal citizens. In his classic Polyarchy, Robert Dahl held that the democratic ideal requires all citizens to enjoy “unimpaired opportunities” to “formulate” their political preferences, to “signify” them to each other, and to have them “weighed equally” in public decision making (Dahl 1971: 2). Building upon Dahl, we may postulate seven more precise normative conditions regular elections must fulfill if they are to offer effective opportunities of democratic choice (for an overview, see Table 1).
(1) Empowerment. Political elections are exercises of power. Voters do not take part in beauty contests or market surveys but in the binding selection of the “most powerful collective decision makers” (Huntington 1991: 7) in the political system.
(2) Free supply. The notion of electing involves the availability of alternatives. Elections “without choice” (Hermet, Rouquié, and Linz 1978) do not qualify as democratic, nor do elections with choice confined to a narrow menu of state licensed options.
(3) Free demand. Democratic elections presuppose the free formation of voter preferences. Citizens who vote on the basis of induced preferences are no less constrained than those choosing from a manipulated set of alternatives. Unless parties and candidates enjoy free and fair access to the public space, the will of the people as expressed at the ballot box will mirror their structurally induced ignorance.
(4) Inclusion. In the contemporary world, democracy demands universal suffrage. The modern demos includes everybody, except those who are assumed to lack minimal capacities of rational decision making (children and the mentally ill).
(5) Insulation. Once citizens have formed their preferences freely, they must be able to express them freely. The secrecy of the voting both is designed to shield them from undue outside pressures. It pretends to insulate voters from the distorting force of violence, money, and social control.
(6) Integrity. Once citizens have given free expression to their will at the polls, competent and neutral election management must have their votes weighed equally and counted honestly.
(7) Decisiveness. As elections without choice, elections without consequences are not democratic either. Elected candidates must be able to assume office, exercise power, and conclude their terms in accordance with constitutional rules.
4

These minima moralia of democratic elections comprise the entire sequence of electoral choice, from its objects to its consequences. The chain of democratic choice is complete. No links are to be added, none to be taken away. Elections may be considered democratic if and only if they fulfill each of our these seven requisites of effective popular choice. Gross violation of any invalidates compliance with all others. If the chain of democratic choice breaks at one link, elections do not turn less democratic, but undemocratic.
The Menu of Repression and Manipulation
Authoritarian rulers may break any link in the chain of democratic choice in multiple ways. The limits to authoritarian imagination are not logical, but empirical. Authoritarian rulers, like successful enterprises, survive by innovation. The catalogue of democratic norm violations I wish to lay out in this section is therefore less than complete. Nevertheless, it contains the main tricks contemporary authoritarians perform to pull authoritarian rabbits out of the hat of multiparty elections (see also Table 1).
(1) Authoritarian rulers may preempt potential threats emanating from popular elections by circumscribing either the scope or the jurisdiction of elective office. In the case of reserved positions, they allow voters to fill subordinate positions of public authority, while keeping the “high center” of power shut off from electoral pressures. In the case of reserved domains (Valenzuela 1992: 64–66), authoritarian rulers keep elected officials from acquiring real power by removing crucial policy areas from their jurisdiction.
(2) Most transitional regimes do not count with anything resembling a consolidated party systems. Authoritarian rulers may take opportunity of such fluid situations by manipulating the number and nature of nascent opposition actors. They may restrict the free formation of electoral alternatives by either excluding or fragmenting opposition parties.
(3) To prevent voters from acquiring fair knowledge about available choices, incumbent parties may strive to prevent opposition forces from disseminating their campaign messages. They may try to shut them out of the public space by either denying them freedom of speech, assembly, and movement (repression) or by denying them reasonable access to media and campaign resources (unfairness).
(4) Since the invention of representative governance, political actors have been tempted to control electoral outcomes by controlling the composition of the electorate, either by legal means or informal practice.
(5) A regime that unleashes electoral competition and public debate may wish to put voters on chains the moment they express their preferences at the polls. Violence (voter intimidation) and money
5

(vote buying) are common means to prevent citizens from voting their genuine preferences.
(6) Once voters have deposited their will in the ballot box, undemocratic distortions may result either from “redistributive” practices (vote rigging) or from “redistributive” rules of aggregation (self-serving institutions).
(7) As stipulated above, elections are meaningful exercises of democratic governance only they endow elected officials with real power. However, even if elections are decisive ex ante, with elected representatives enjoying full constitutional authority, they may still fail to be decisive ex post. They may turn inconsequential, too, when undemocratic actors tie the hands of elected officials (authoritarian tutelage) or simply remove them from their positions, thus terminating the electoral regime (authoritarian abortion).
I my conceptual piece referred to above, I described the set of authoritarian strategies as “the menu of manipulation” (Schedler 2002). In this paper, I shall except political repression (conceptualized above as a denial of free demand) from the notion of electoral manipulation. Repressive regimes that violate basic human rights and civil liberties carry their efforts of distorting and controlling the political game well beyond the electoral arena. Its scope as well as its gravity set repression apart from other authoritarian strategies that focus more narrowly at the electoral game and its key actors: parties, candidates, voters, legislators, and elected officials. Thus distinguishing between repression and electoral manipulation, I will use the notion of authoritarian control as the overarching category encompassing both.
Cumulative versus Selective Strategies
Given the authoritarian toolbox they have at their disposal, how do rulers pick their instruments of control? Do they chose as from a menu in the restaurant of authoritarian delicatessen, with choices being a matter of personal taste? Do their choices restrain each other, as with certain dishes and drinks that do not combine well? Inversely, are some choices natural companions to others, as with dishes and drinks that combine nicely? Finally, do electoral authoritarian rulers behave like gourmands, more attentive to the quantity of food they consume than to its quality? Or do they rather act as gourmets, selecting carefully (and enjoying deeply) a few exquisite dishes?
If authoritarian rulers count with just eight strategies of authoritarian control (the number of strategies measured in my dataset, to be explained below, excluding societal war and disregarding all other tools in their kit), they may combine them in 58 ways (without taking into account different sequences). As a typology spreading over several dozens of categories would be less than parsimonious, it seems useful to ask whether, by the way of induction, we may uncover some
6

empirical order in this dizzying field of possibilities. Does each case present a singular combination of authoritarian strategies or can we detect certain commonalities across cases? In very general terms, authoritarian rulers face the choice between two broad strategic alternatives: the mutually reinforcing combination of strategies (cumulative control) and the mutually substitutive selection of strategies (selective control).
Cumulative strategies. Electoral authoritarian rulers may try to hit the opposition by all means at their disposition. They may weaken parliament, censure the media, repress their adversaries, ban them from electoral participation, design discriminatory election systems, frighten voters, falsify elections. In such scenarios of cumulative control, all bad things go together. In their quest for electoral security, rulers pile up authoritarian measures of control, each reinforcing the other.
Selective strategies. Rather than maximizing electoral security by establishing a comprehensive system of control, authoritarian rulers may optimize electoral security by selecting specific measures of control. Instead of demolishing the entire chain of democratic choice with a sledging hammer, they may sever specific links with a sharp surgical cut. Such strategic fine-tuning seeks to avoid the accumulation of authoritarian measures. Rather than sweeping the playing grounds of the opposition with a broad brush, selective authoritarians target their blows well. Their measures of control are not designed to reinforce each other, but to substitute each other. For instance, if they send opposition actors into exile, they need not bar them from electoral competition; if they kick them out of the electoral arena, they need not tamper with electoral results.
The notion of cumulative strategies describes a positive linear association between strategies, while the idea of selective strategies points to a negative linear relationship. In generic terms, we would expect electoral authoritarian regimes to lean towards the selective side. Electoral autocracies have to balance the conflicting imperatives of electoral control and electoral credibility (Schedler 2006). To ensure their continuing hold on power, they have to control the substantive outcomes of elections without inflicting excessive damage on their procedural legitimacy. As a result of such cross-cutting pressures, we may expect them to refrain from simple cumulative strategies of control. Rather than doing everything to keep opposition parties from winning elections, they should try to do just the necessary. Given the conflicting imperatives they face, they should strive to control the electoral game by stealth, in subtle and skillful ways, thus deploying selective rather than comprehensive strategies of control.
As even a cursory revision reveals, the universe of contemporary electoral authoritarian regimes contains numerous exemplifications of both possibilities. Egypt under Mubarak exemplifies the repressive
7

rigor of comprehensive strategies of control, including arbitrary arrests, party bans, voter intimidation, and ballot rigging, all of them embedded in decades of coercive emergency rule. By contrast, Singapore under the PAS illustrates the silent efficacy of selective strategies of control, in which the suffocation of free speech and association, a lame parliament, and discriminatory electoral rules coexist with respect for human rights, due process, and electoral integrity. Mapping electoral authoritarian regimes would be an easy task, though, if they would all cluster at either the cumulative or the selective pole of authoritarian control. If some would choose to overrun the opposition with all means at their disposition, while others would strive to neutralize it through surgical, finely targeted violations of democratic norms, we could sort EA regimes neatly into two discrete boxes: harsh regimes that behave as cumulative maximizers of electoral control versus light regimes that act as selective optimizers of electoral control.
Things are more complicated, though. From a bird’s view, the binary logic of accumulation versus selection applies to regimes as a whole. From the perspective of political actors, however, it applies to individual strategies. Rather than facing one big choice of pursuing either the cumulative or the selective road to authoritarian control, regimes face multiple choices of whether to introduce or renounce specific measures of control, and whether to reinforce or to substitute them by other measures. They may easily implement some authoritarian measures that reinforce each other (partial cumulative control) at the same time that they obviate the need for deploying additional means of repression or manipulation (partial substitutive control).
With respect to the fine-tuning of specific strategies there is little systematic empirical knowledge we could build on. To what extent are rulers free to pick from the menu of authoritarian strategies at their pleasure, or inversely, to what extent are they constrained by the internal logic of the various authoritarian measures? In case of full authoritarian discretion, we would expect to find something close to a random variation of non-democratic strategies (dispersion). In case of internal constraints, we might find that certain strategies go together in bundles, grounded in elective affinities (clustering). Alternatively, we might find that harsh strategies tend to come hand in hand with light strategies, but not necessarily the other way round (hierarchical ordering).Which one prevails? We shall have to find out.
In sum, all other things being equal (which are never equal), electoral authoritarian ruler should prefer substitutive over cumulative strategies of control. Numerous empirical cases seem to contradict this generic expectation, though. Besides, I have no specific predictions to offer on the use of individual strategies or bundles of strategies. Thus the task of this paper: to explore, by the way of induction, empirical configurations of electoral authoritarian strategies worldwide between 1980 and 2002.
8

The Universe of Cases
The present paper pretends to cover all electoral authoritarian regimes worldwide between 1980 and 2002. To delimitate the universe of cases, I proceeded in two steps. In a first step, I used Freedom House (FH) data (www.freedomhouse.org) to delineate a broad pool of candidates for inclusion (among countries with population > 1 million).2 In order to remove from the outset those regimes that are either too democratic or too dictatorial to be included in the intermediate category of electoral autocracies, I chose all countries that received FH political rights scores between 4 and 6 during at least four consecutive years between 1980 and 2002 (a criterion of minimum stability intended to filter out short-term fluctuations of countries into the relevant range of Freedom House scores).
While this first delimitation of candidate countries relies on the criterion of political freedom, in a second step I employed institutional criteria, with a narrow focus on the electoral arena, to demarcate my universe of cases. Among the countries located at the intermediate levels of political freedom, only those qualify as electoral authoritarian that held at least one full set of multiparty elections with universal suffrage for the chief executive as well as the national legislature.3 This set of institutional requirements excludes non-party regimes, de jure as well as de facto one-party regimes, military regimes, competitive oligarchies, and traditional monarchies. It also excludes incomplete election cycles in which a single presidential or legislative election is followed by regime breakdown (through military coup, executive coup, armed insurrection, or external occupation).
As the idea of authoritarian regimes presupposes the presence of governments endowed with a minimum of external and internal sovereignty, I also exclude non-sovereign protectorates, like Lebanon and Bosnia-Herzegovina, as well as cases of state collapse that fail to maintain political structures we could recognize as political regimes. The resulting universe of authoritarian elections includes 122 legislative and 78 presidential elections that were held in 57 countries in six world regions. Table 2 in Appendix A gives the full list of cases.
Table 3 (in the appendix) shows their distribution across world regions: Reflecting the subcontinent’s turn from one-party rule to electoral authoritarianism in the last decade of the 20th century, Sub-Saharan Africa concentrates the largest share of authoritarian election cycles (37.0 percent). Due to the peace transitions in Central America and the demise of hegemonic party rule in Mexico and Paraguay, Latin America and the Caribbean comes only second, contributing close to a fifth of cases to the database (19.5 percent). All other world regions hosted around a tenth of authoritarian elections each between 1980 and 2002. Due to my exclusion of traditional monarchies, the Middle East and Northern Africa lie somewhat below that marker (8.0 percent), while South and East Asia, “a great storehouse of historical
9

and contemporary electoral authoritarianism” (Case 2006: 95), lie somewhat higher (13.0 percent).
By combining these two pieces of information – annual Freedom House scores and the presence of multiparty elections – I am able to delimit the universe of authoritarian election cycles. Yet, as I wish to move beyond the identification of electoral authoritarian regimes (the classification of regimes) in order to reconstruct specific combinations of repressive and manipulative measures authoritarian regimes deploy (the analysis of within regime variance), I need additional data, most of which are not readily available.
The Data
As we have seen above, the menu of authoritarian strategies is extensive, variegated, and open-ended. Ideally, we would like to work with cross-national time series for the whole menu of authoritarian instruments of electoral control. Yet, unsurprisingly, for most strategies, existing cross-national databases do not contain reasonably proximate measures. Some strategies of authoritarian control – in particular, the unfairness of the electoral process, the intimidation of voters, vote buying, and informal voter disenfranchisement – pose methodological problems to cross-national measurement that seem almost insurmountable. Others are more amenable to quantification, though. The present study includes measures on several core strategies of electoral control. From existing data sources I include indicators of human rights violations, media restrictions, and legislative disempowerment. From my own database, I use vote-seat disproportionality, the exclusion of opposition actors, and electoral fraud. In the following, I will briefly discuss each variable. Table 4 offers summary descriptions, Table 5 frequency distributions (see Appendix A).
Measuring Repression
Fortunately, useable time series exist on the intensity of political repression and the strength of legislatures. In particular, to capture the intensity of political repression, I used the annual Cingranelli-Richards (CIRI) Physical Integrity Rights Index that measures the intensity of governmental violations of human rights on a 9-point scale for 195 countries since 1981. To measure at least one core dimension of governmental violations of civic liberties, I use the arithmetic mean of annual FH Press Freedom scores and (inverted) CIRI Freedom of Speech and Press scores (see also Table 4 in Appendix A).4
Table 5 shows the frequency distribution of our cases (regime-years) along the CIRI scale of violations of physical integrity rights.5 Unsurprisingly, most of our cases cluster around the middle of the scale. Only about a fifth earn rather benign scores (0–2), almost half are located at intermediate levels (3–5), while about a third cluster at
10

the higher end of physical repression (6–8). Violations of press freedom display a similar distribution. While very few authoritarian elections take place in a context of unambiguously free media, typically they do not involve the complete suppression of media freedom either. A free press (scores 1 or 1.5) exists in only 8.5 percent of our regime-years, while full media restrictions (score 3) exist in less than a fifth. Most authoritarian elections in our database (74.2 percent) took place at intermediate levels of media restrictions (scores 2 or 2.5).
Measuring Legislative Weakness
To measure the strength of national legislatures, I use the data on legislative effectiveness from the Tony Banks Cross-National Time-Series (CNTS) Data Archive (variable s22F4). The measure, inverted for the present purpose, is trichotomous. Scores of 0 indicate an effective legislature, scores of 1 a partially effective legislature, scores of 2 an ineffective “rubber stamp” legislature (and scores of 3 an inexistent legislature).6 As Table 5 shows, the cases in the dataset are almost evenly divided between partial legislative effectiveness (45.8 percent) and legislative ineffectiveness (46.5 percent).
Measuring Institutional Bias
Authoritarian rulers may enact a broad variety of discriminatory electoral rules in their drive to control electoral outcomes. Depending on how they read current and (more importantly) future correlations of force in the electoral arena, they may find it convenient to implement majoritarian winner-takes-all rules, gerrymander electoral districts, vary thresholds of representation under PR rules, or apportion legislative seats in distorted ways that ensure the under-representation of opposition strongholds (malapportionment). The basic trick is to decouple electoral support from electoral victory. Whatever the specific institutional device, though, in legislative elections the presence of discriminatory electoral institutions usually translates into high levels of vote-seat disproportionality. Thus, rather than classifying formal election rules (whose discriminatory force is context-dependent anyway) I look at substantive outcomes and use disproportionality figures as a proxy for the presence of “redistributive” election systems.
On the basis of my Database on Authoritarian Elections in the World (1980–2002), I calculate the Loosemore-Hanby Disproportionality Index for 88 authoritarian elections (as election data for 34 legislative elections in my database are not available). As Table 5 indicates, authoritarian elections display considerable variation in their levels of vote-seat disproportionality. While the arithmetic mean lies at a high 16.8 percent, the maximum value lies at 44.8 percent (Kazakhstan in 1995) and the minimum value at 1.58 percent (Indonesia in 1987).
11

Measuring Fraud
As no public databases exist that contain useable indicators that measure either the commission of electoral fraud or the exclusion of opposition actors, with respect to these two authoritarian strategies I had to take a ride into the desert and construct my own data. The World Bank Database on Political Institutions (DPI) includes a categorical measure that responds to the question of whether “vote fraud or candidate intimidation were serious enough to affect the outcome of elections.” Even if a growing number of comparative studies have been using this variable (Hyde and Beaulieu 2004, Simpser 2004), it does not resist closer examination. It seems to be deeply flawed both conceptually, methodologically, and empirically. Conceptually, it conflates two dimensions that should be kept apart (electoral fraud and candidate intimidation) without even defining them. Methodologically, it violates basic requirements of transparency, as it does not reveal neither its definitions nor its operational decisions, coding rules, coding procedures, or sources.
Empirically, the DPI variable contains innumerable entries that look questionable even at superficial inspection. It registers several instances of fraud or intimidation “serious enough to affect the outcome of elections” that do not coincide with election dates. In general, countries maintain their scores between elections; in some cases, scores change even if no national-level elections were held (as in Colombia in 1999); in others, registries of fraud and intimidation start one year after first elections took place (as in Nicaragua 1984, Ghana, Kenya, Senegal). Worse, even cursory knowledge of cases reveals that the database contains numerous false positives, that is, registries of decisive fraud and intimidation in cases that seemed fundamentally clean (like in Panama after 1990, Nicaragua after 1984, and Ghana in 1996). False negatives are almost ubiquitous in the DPI database, that is, registries of electoral integrity in cases that seemed heavily contaminated by fraud and/or intimidation. Glaring examples are Cuba between 1994 and 2000, Mexico in 1988, Peru in 2000, communist Poland and Romania, the Soviet Union, Iran, Iraq, Syria, Ghana and Kenya in 1992, Zimbabwe in the 1990s, Indonesia, Malaysia, Nepal, Pakistan, and Singapore.
All in all, the DPI data on fraud and intimidation are ill-conceived, methodologically opaque, and their erratic distribution seems inconsistent with basic facts. Accordingly, their level of face validity approximates zero. Other databases on the incidence of electoral fraud, while of better quality, are limited in geographic, temporal, and substantive coverage. Hartlyn, McCoy, and Mustillo (2003) assess presidential elections in Latin America in the 1990s. Bratton and van de Walle (1997) offer dichotomous evaluations of first or “founding” presidential elections in Sub-Saharan Africa. Bratton (1998) extends these assessment to second elections in the region. In a more comprehensive effort, Lindberg (2006) traces the democratic quality
12

of both presidential and legislative elections in Sub-Saharan Africa from 1989 through 2004.
Given the limitations of existing data sources, I felt obliged to construct my own database on electoral fraud. For that purpose, I tapped four main sources: the online Keesing’s Record of World Events (www.keesings.com), the historic archive of the Spanish newspaper El Pais (www.elpais.es), the Journal of Democracy section “Election Watch,” and individual country narratives from the annual Freedom House surveys of political rights and civil liberties. These primary sources were supplemented by election reports from international observers, in particular the Commonwealth Election Law and Observer Group (www.thecommonwealth.org), the OSCE Office for Democratic Institutions and Human Rights (www.osce.org/odihr), the Carter Center (www.cartercenter.org), the International Republican Institute (www.iri.org), the National Democratic Institute (www.ndi.org), the International Foundation for Election Systems (www.ifes.org), and the Organization of American States (www.oas.org).
For the purpose of data collection, I defined electoral fraud in a narrow manner as the manipulation of electoral administration for partisan advantage that may take place at any stage of the electoral process (before, during, and after election day). The measure I constructed is trichotomous. The category of “fraud” indicates partisan inference with the organization of election serious enough to affect outcomes. The intermediate category of “irregularities” denotes deviations from formal rules that are not systematic or serious enough to alter results. The final category of electoral integrity (“no fraud”) pertains to situations in which no more than minor irregularities are reported (for more detailed coding rules, see Appendix C).
The coding process was conceived as a mixture of content analysis and expert assessments. Content analysis assumes that coder identities do not matter. It conceives coding as a rule-guided process in which coders are exposed to identical pieces of information, apply identical rules of data processing, and therefore move in identical ways from concrete materials to abstract categories (be they numerical or linguistic). In accordance with the canons of quantitative content analysis, coding was carried out by two independent coders (the author and two trained graduate students, one for Latin America, the other for all other regions). Intercoder agreement lay at 75.9 percent for Latin America, and 65.9 percent for the rest of the world. As I am measuring electoral fraud as an ordinal variable, the percentage of agreement is a demanding criterion of reliability, as any divergence among coders counts as disagreement, regardless of the distance between their judgments,. Although it is “open to debate” what “constitutes an acceptable level of intercoder reliability” (Neuendorf 2002: 143), a reasonable rule of thumb establishes that coder agreement should be higher than 70 percent (ibid.). Our levels of
13

intercoder agreement hover around that threshold, which seems (close to) acceptable, but less than satisfactory.7
The main challenge to the reliable measurement of authoritarian strategies across a large number of electoral regimes worldwide does not lie in the design of workable coding rules, but in the access to factual information (within the constraints of time, resources, and language proficiency that limit any individual research project). Notoriously, news sources based in Western democracies, like the ones I relied upon for this study, provide highly unequal coverage of elections in developing countries. International observer reports allow to fill in some holes, but suffer from their own biases. Given the undeniable insufficiencies of my documentary base, I abandoned the standard operating procedures of content analysis after testing intercoder reliability, in order to introduce two elements of expert assessment: (a) Instead of arbitrating conflicting coder assessments by chance (through the random selection of scores from independent coders), I decided to trust my own coding decisions. (b) For the purpose of external validation, I asked regional experts to evaluate my data. Dialogue with comparative political scientist specialized in different world regions led to a handful of corrections (due to additional factual information), in particular with respect to elections in Sub-Saharan Africa.8
The final data obtained through this combination of impersonal coding and expert evaluation still carries the inherent limitations of measuring illicit activities like electoral fraud. After all, electoral fraud involves “clandestine efforts to shape election results” (Lehoucq 2003: 233) which by definition escape direct inspection. Given the fuzzy boundaries that delimit the intermediate category of “irregularities,” all cases except the most extreme ones are susceptible to produce controversy (a controversy that haunts the business of election monitoring since its inception in the late 1980s). Still, I am confident I succeeded avoiding the most egregious measurement error of classifying fraudulent elections as clean and vice versa. Arguably, my new dataset is more valid and reliable than existing global data from the World Bank as well as more comprehensive and more consistent in temporal and geographic coverage than existing regional data.
If we throw a quick glance at frequency distributions, we can see, again, that most cases in our dataset fall into the intermediate measurement category. Almost half of the 122 legislative elections (47.5 percent) and more than two fifths of the 78 presidential elections (42.3) in my dataset appear to be affected by “irregularities” that taint election processes but leave their outcomes essentially unaffected. Quite remarkably, within the universe of authoritarian elections, almost a third of legislative elections (30.3 percent) and almost a quarter of presidential contests (24.4 percent) show up as administratively clean. The incidence of incisive electoral fraud thus lies barely at about one fifth for legislative elections (22.1 percent), and one third of presidential elections (33.3 percent).9
14

Measuring Exclusion
Both Polity IV and the Banks CNTS dataset contain measures of political exclusion. Deriving its theoretical inspiration from Harry Eckstein’s work on authority patterns, the Polity dataset on “Political Regime Characteristics and Transitions” measures three complex dimensions of political systems: the access to executive power (institutionalization, competitiveness, and openness), the exercise of executive power (limitations on governmental decision-making), and the nature of political contestation (cleavage structures, the institutionalization and breadth of opposition). Data users tend to ignore their theoretical foundations and use either composite indicators of institutionalized democracy (DEMOC) and autocracy (AUTOC) or combined Polity scores (POLITY) as simple measures of democracy, although their component parts as well as their rules of aggregation have been subject to damaging methodological criticism (see especially Munck and Verkuilen 2002).
In my view, the only way of (eventually) rescuing the validity of Polity data leads through a careful analysis of its disaggregate measures. For the present purpose of determining the inclusiveness of political regimes, two of its variables deserve consideration: the regulation of participation (PARREG) and the competitiveness of participation (PARCOMP). Regulation of Participation, although treated by Polity authors as an ordinal variable, in fact represents a categorical variable that captures various dimensions of political contestation, such as the structure, stability, and depth of political cleavages. One of its categories denotes “restricted” participation, a situation in which “significant groups, issues, and/or types of conventional participation are regularly excluded from the political process” (Marshall and Jaggers 2002: 25).
In a similar manner, Competitiveness of Participation is a multi-dimensional categorical variable that combines information about the inclusiveness of political regimes with information about the nature of political competition. While its category of “repressed” competition denotes closed authoritarian regimes with a “demonstrated ability to repress oppositional competition” (ibid.), the category of “suppressed” competition refers to somewhat more open situations in which the regime allows for opposition activities, but “systematically and sharply limits its form, extent, or both in ways that exclude substantial groups (20% or more of the adult population) from participation.” Under suppressed competition, “large classes of people, groups, or types of peaceful political competition are continuously excluded from the political process.” The “banning of a political party which received more than 10% of the vote in a recent national election,” the prohibition of “some kinds of political organization [or] some kinds of political action,” and the systematic “harassment of political opposition” count as evidence of suppressed competition (Marshall and Jaggers 2002: 26).
15

Both the PARREG category of “restricted competition” and the PARCOMP category of “suppressed competition” suffer from the same problem: They are too broad and include too many items to serve our narrow purpose of measuring the either administrative or judicial exclusion of political parties and candidates from the electoral arena. Both categories go well beyond my focus on the electoral arena, as they register the exclusion not only of political parties, but of societal groups, political issues, and forms of protest as well. No less importantly, the PARCOMP category of suppressed competition conflates two basic strategies of electoral control: exclusion and repression.
By contrast, the CNTS variable “party legitimacy” (variable S19F6) centers on the exclusion of political parties (the legitimacy of multiparty competition). It adopts four values: Scores of 0 denote non-party or hegemonic party regimes in which either “no parties” exist or only a “dominant party” and its “satellites” are allowed to compete. Sores of 1 refer to authoritarian regimes that practice the “significant exclusion of parties (or groups).” Scores of 2 describe the democratically justifiable exclusion of “minor or ‘extremist’ parties.” Scores of 3, finally, refer to fully inclusionary regimes in which “no parties” are excluded (CNTS Codebook). Given its leaner conception, this measure seems more appropriate for my current purpose that the much broader Polity variables. Still, as CNTS does not reveal its definitions, coding rules, coding procedures, and sources, neither the reliability nor the replicability of its data can be taken for granted.
Again, the limitations of existing data sources led me to embark on the collection of my own data (employing CNTS and Polity data as posterior correctives). Relying on the same data sources and following the same coding procedures as described above, I constructed a dichotomous measure of opposition exclusion. I classify elections as exclusionary if state agencies (belonging to any branch of government) prevent active opposition parties or candidates from participating, be it through constitutional provisions, legal rules, executive decrees, judicial rulings, or administrative decisions. Clear examples would be the denial of registry to opposition parties on political or administrative grounds, or the enactment of ad hominem rules of candidacy that bar prominent opposition actors from electoral competition.
Note that my threshold for coding elections as exclusionary is rather low. I require excluded parties or candidates to be active at the time of the election (thus ignoring the exclusion of latent actors), but I do I do not limit my attention to major opposition actors. A presidential election counts as exclusionary if state authorities disqualify any presidential candidate, even a minor one. In legislative elections, my criterion is slightly more demanding. The widespread exclusion of “uncomfortable” individual candidates as well as the wholesale exclusion of opposition parties qualify as exclusion, while the
16

disqualification of candidates in a low number of districts does not (for more detailed coding rules, see Appendix C).10
As Table 5 shows, within the universe of legislative authoritarian elections, cases of inclusion (53.3 percent) and exclusion (46.7 percent) hold a rough balance. Among presidential authoritarian elections, the distribution is skewed towards the inclusionary side. In less than two fifths of presidential contests (38.5 percent), rulers strive to contain electoral uncertainty by excluding opposition candidates.
Measuring Societal Warfare
Up to this point, all our data collected or constructed for the purpose of mapping electoral authoritarian regimes pretend to capture purposeful strategies authoritarian incumbents deploy against their challengers in the electoral arena. Yet, it is not just by centralized Machiavellian design that elections may breach democratic minimum standards of political rights and civil liberties. Situations of societal warfare tend to produce similar non-democratic results through decentralized violence. Even without authoritarian master plans in the capital, they tend to provoke a profound erosion of fundamental rights that turns electoral contestation and participation into less than democratic exercises.
To capture such contexts of horizontal, rather than vertical, suppression of democratic liberties, I create a simple indicator of societal warfare by adding the average magnitudes of revolutionary and ethnic wars from the State Failure Dataset (for a brief variable description, see Table 4 in the appendix; for definitions and coding rules, see Marshall, Gurr, and Harff 2001). As Table 5 indicates, only a minority of authoritarian elections in my dataset took place under conditions of societal warfare. Three quarters register the complete absence of either revolutionary or ethnic violence (score 0). Another 7.6 percent accommodate low levels of societal warfare (scores 1 or 1.5). The remaining 17.4 percent of elections, however, have indeed taken place amidst moderate to high levels of societal warfare.
Syndromes of Authoritarian Control
As stated above, given the almost infinite mathematical possibilities of packaging authoritarian strategies, I wish to examine the range of empirical possibilities rulers put into practice in the real world. Inductive and explorative, and thus modest in design and pretension, the present paper pursues the venerable scientific project of uncovering empirical regularities where none are apparent at first sight. In this vein, after the obligatory, though inconclusive, immersion in the descriptive statistics of frequency distributions and contingency tables (which I will be citing occasionally), I calculated simple bivariate correlation coefficients for all strategies, except the exclusion of opposition actors (a binary variable not suitable for correlation analysis). Instead of reproducing the entire correlation
17
matrix, Figure 1 (in Appendix B) exclusively reports the statistically significant coefficients (at a probability level of .05 or lower). Underlying patterns of association may be more complex and non-linear. Still, it is striking how few pairs of strategies display significant levels of covariation. Basically, patterns of correlation reveal three strategic clusters: a syndrome of violence, a syndrome of fraud, and a syndrome of executive dominance.11
A Syndrome of Violence
The correlation between state violence (violations of physical integrity) and societal violence (ethnic or political warfare) lies at .53 (p ≤ .01). The close association between vertical and horizontal violence points to a classical circle of violence in which one form of violence feeds the other. Interestingly, the state violence correlates negatively with disproportionality (r = -.37, p ≤ .01), while societal violence correlates negatively with legislative weakness (r = -.2, p ≤ .05). Repressive states, it seems, can afford higher levels of institutional fairness, which speaks of a neat substitutive relationship. Governments that kill and imprison their opponents, it appears, more easily accede to granting fair chances to surviving actors who accept to enter the electoral the game. The association of societal war with legislative strength, by contrast, is more difficult to interpret. Perhaps, executives who are under siege from ethnic or political insurgencies are more willing to share power and responsibility with the legislative branch of government.
A Syndrome of Electoral Fraud
Predictably, vote rigging in presidential and legislative elections correlate highly (r= .91, p ≤ .01). The correlation coefficient should not be taken at face value, though. As it is based on concurrent elections only, it exaggerates the link between presidential and legislative arenas for substantive as well as methodological reasons. Substantively, elections held in different years may show larger differences in the levels of legislative and presidential fraud. Methodologically, for concurrent elections, my sources of information often do not allow to distinguish between fraudulent maneuvers targeted at the presidential poll and those directed at the legislative election. Overall, vote rigging seems to be a prototypical selective strategy rulers implement independently of their eventual reliance on other strategies of electoral control.
The only exception is the positive association (N = 32) between presidential fraud and institutional bias (disproportionality), which hints at an interesting link between concurrent elections. While legislative fraud is not systematically associated with disproportionality, presidential fraud is. In both cases, the relation between fraud and disproportionality is curvilinear. With respect to legislative elections, clean elections display the highest levels of seat-vote disproportionality (mean = 18.5 percent), while both irregular
18

elections (mean = 15.9 percent) and fraudulent elections (mean = 16.9 percent) show slightly lower levels. By contrast, with respect concurrent presidential elections, fraud goes hand in hand with the highest level of disproportionality (mean = 21.6 percent), irregularities with the lowest level (5.1 percent). Clean elections are situated at an intermediate level (mean = 11.4 percent). As it seems, in concurrent elections, rulers tend to employ discriminatory legislative election rules either to compensate for electoral integrity in the legislative arena or to reinforce electoral fraudulence in presidential arena.
Similar curvilinear relationships underlie non-significant correlations between legislative fraud and two other variables, repression and media restrictions. In both cases, the grossest violations of democratic norms occur in contexts of electoral integrity. Almost three fifths of clean legislative elections (58.4 percent) take place in a context of high repression (scores ≥ 5), a percentage that lies well above the corresponding shares for irregular elections (41.4 percent) and fraudulent elections (48.1 percent). Repressive regimes apparently have an easier time renouncing electoral fraud. Electoral integrity in the legislative arena also coincides with high levels of media controls. More than two thirds of clean legislative elections (67.5 percent) go hand in hand with high media restrictions (scores 2.5 or 3), while the same is true for “only” about half of irregular elections (51.7 percent) and fraudulent elections (55.5 percent). Again, this skewed distribution indicates that authoritarian rulers who renounce vote rigging tend to deploy alternative security measures instead.
A Syndrome of Weak Accountability
While the strength of legislatures is a key ingredient of horizontal accountability, the strength of mass media forms a core component of societal accountability. The covariation of legislative weakness and violations of media freedom (r = .25, p ≤ .01) points to situations of endemically weak political accountability. When legislatures act as rubberstamps of governmental initiatives and the media as their megaphones, executives are likely to dominate the political game, unencumbered by the nuisance of checks and balances. Facing feeble constraints from either state or societal agents, they hold a comfortable position for subverting electoral accountability, too.12 Underlying causal relations may reflect more than the sovereign decision by authoritarian rulers to fine-tune electoral controls. In all likelihood, legislative strength and media freedom influence each other.
The relative openness of the public space may well drive the relative strength of legislatures. If dissident voices find little resonance in the public space, before as well as after elections, legislatures are likely to work as mere echo chambers of official discourse. The other way round, relatively effective legislatures may well form an important bulwark against executive encroachments in the public sphere. Most elections in my database are congruent with this causal expectation.
19

More than a third combine ineffective legislatures and controlled media (35.9 percent). Inversely, more than a quarter combine at least partially effective legislatures and at least partially free media (28.3 percent). Still, more than a third belong to “incongruent” situations of at least mildly effective assemblies operating in a context of controlled media (13.1 percent), or inversely, of rubberstamp legislatures operating in a context of at least partially free media (22.7 percent). In the former cases, media controls might serve to domesticate legislative assertiveness, while in the latter cases, legislative weakness may serve to neutralize the subversive effects of free speech.
Neither the disempowerment of legislatures nor the control of the mass media covary systematically with other strategies of authoritarian control (except for the negative association between legislative weakness with societal war discussed above). This weakness of bivariate correlations speaks of an authoritarian syndrome rulers put into place with relative independence of the broader menu of strategies of control. In particular, the lack of association between the curtailment of public speech and violations of physical integrity confirm the theoretical intuition that restrictions on civil liberties and violations of human rights form dimensions of state repression that are conceptually as well as empirically distinct.
Reinforcing Electoral Fraud
Principal component analysis (PCA) basically confirms the patterns suggested by correlation analysis, albeit with some fresh strokes of brush that shed additional light on the strategic logic of electoral fraud. In order to prevent losing a high number of cases (and restricting the exercise to concurrent elections), I ran two separate factor analyses, one for legislative and another for presidential elections. The legislative PCA includes six variables: violations of physical integrity, media restrictions, societal war, legislative fraud, legislative weakness, and disproportionality. The presidential PCA includes the first three, plus one other, presidential fraud.
Double Disempowerment
With respect to strategies of legislative control, rotated principal component analysis (Varimax rotation with Kaiser Normalization) yields three factors with Eigenvalues above 1. Factor 1 contains high positive factor loadings for violations of physical integrity and societal war, and negative loadings for disproportionality. It closely corresponds to the syndrome of violence discussed above. Factor 3 carries high positive loadings for legislative weakness and violations of press freedom. It closely resembles the syndrome of executive dominance.
Factor 2, by contrast, hints at strategic configurations that were not obvious from correlation analysis. It contains high positive factor loadings for legislative fraud and legislative ineffectiveness as well as
20

negative loadings for disproportionality. It alludes to situations in which rulers compensate for the neutrality of electoral rules by meddling with the administration of elections and by keeping legislative assemblies ineffectual. The fair mapping of votes onto seats ensured by the electoral formula is subverted by the double disempowerment of voters (through fraud) and deputies (through structural weakness). Actually, within our dataset of authoritarian elections, it is over half of irregular elections (52.6 percent) and fraudulent elections (51.9 percent) that coincide with “rubberstamp” legislatures (legislative weakness score 2), while only a good third of clean elections do so (35.1 percent).
Covert Theft
With respect to strategies of presidential control, the same technique of principal component analysis yields two factors. Factor 1 loads high on state repression and societal war – our syndrome of violence, again. Factor 2 loads high on the two remaining variables, electoral fraud and media restrictions. Again, the commonalities between the two strategies remained hidden in correlation analysis. The strategic logic is easy to understand: you steal a presidential election, but let nobody know. The empirical distribution of cases is somewhat messy. In particular, clean presidential elections show an extraordinary affinity with media limitations. 61.1 percent display the second-highest level of media restrictions (media restriction score 2.5). Still, the worst violations of media freedom tend to coincide with the worst instances of vote rigging: no clean presidential election earns the top score of 3, while 15.2 percent of irregular elections (5 out of 33) and 26.9 percent of fraudulent elections (7 out of 26) do. While media restrictions may take the bite out of clean elections, they may also serve to keep the commission of fraud hidden from the public eye.
Reinforcing Electoral Exclusion
Up to now, I have not taken into account the categorical variable of opposition exclusion. In this section, I will explore its bivariate association with other strategies of authoritarian control through pairwise comparisons of means. Figure 2 in Appendix B shows the arithmetic means all other strategies of authoritarian control (including societal war) show in the categories of inclusionary and exclusionary elections. Its left-hand column of figures refers to legislative elections (“legislative exclusion”) (N = 122), its right-hand column to presidential contests (“presidential exclusion”) (N = 78). Confidence intervals, indicated by the vertical lines running through mean values, lie at the .95 level.
Even a cursory glance at the six pairs of graphics reproduced in Figure 2 suggests that authoritarian rulers determine their either inclusionary or exclusionary stances towards opposition actors in relative independence from other strategic choices they take. Most graphics indicate a cumulative pattern, in which exclusionary strategies go
21

hand in hand with higher levels of democratic norm violation, although some show substitutive patterns, in which the exclusion of opposition actors coincides with lower levels of non-democratic behavior. In most cases, however, differences in means lie within the respective confidence intervals.13 Let us briefly review the list of variables.
Violations of physical integrity: In the presidential arena, repression and exclusion are not systematically linked. Authoritarian rulers’ proclivity to keep opponents from contesting presidential elections does not vary with their readiness to violate the physical integrity of their opponents (N = 77). In the legislative arena, by contrast, repression seems to work as a substitute for exclusion. Authoritarian rulers who allow for inclusive elections, tend to recur to higher levels of repression (N = 121).
Societal war: Neither ethnic insurgents nor guerrilla fighters are regular participants in electoral contestation (unless they assume dual roles as combatant groups and political parties, see Weinberg and Pedahzur 2003). In the face of organized societal violence, governments may therefore be tempted either to act in inclusionary ways (to augment the integrative capacity of the electoral regime) or to practice exclusion (to keep at a distance the potential allies of violent actors). Neither one nor the other seem to happen systematically. Whether societies are torn by political or ethnic insurgencies and whether rulers ban opposition actors from the electoral arena, seem to be, as the metaphor has it, two different pairs of shoes.
Violations of press freedom: Legislative exclusion and violations of press freedom display a clear cumulative pattern (N = 122). If rulers restrict the access to the electoral arena, they tend to restrict the public space too. In terms of frequency distributions, over half of inclusionary legislative elections (55.4 percent) show “partially free” media (score ≤ 2), while the same is true for only a good quarter of exclusionary elections (28.1 percent). The cumulative relation of exclusion and media restrictions does not hold for presidential elections, in which the two strategies seem unrelated (N = 77).
Electoral fraud: As our simple comparison of means suggests, vote rigging and exclusion form a flexible pair of strategies. Regimes that exclude opposition actors from electoral competition have similar probabilities either to reinforce their exclusionary measures through electoral fraud or to trust the force of exclusion, relax administrative controls, and permit clean elections.
Legislative weakness: While legislative exclusion and legislative weakness seem only weakly related (N = 121), the exclusion of presidential candidates and the disempowerment of legislatures appear to form strongly complementary strategies (N = 77). By preventing legislatures from contesting presidential policies, and preventing
22

opposition candidates from contesting presidential elections, regimes may keep simultaneously both the presidential and the legislative arena safe from the corrosive influence of opposition politics.
Disproportionality: Deriving security from redundancy, electoral authoritarian regimes tend to complement their strategies of exclusion with strategies of institutional discrimination, as evidenced in high average levels of disproportionality. This is true for legislative exclusion (N = 87) as well as for presidential exclusion (N = 32). Inclusionary regimes then tend to be doubly inclusionary: As they refrain from barring opponents by legal, administrative or judicial fiat, they also tend to renounce the possibility of denying them representation by institutional design. Inversely, exclusionary regimes tend to doubly exclusionary: They strive to keep their adversaries of out of the electoral arena by erecting barriers to the formal registry of candidacies as well as to formal legislative representation.
Conclusion
The present paper stops short of fulfilling its promise (implicit in its title) of constructing a full topography, a comprehensive map, of electoral authoritarian strategies. Still, its simple statistical explorations of both available and original data yield intriguing empirical insights. In essence, the paper set out to explore linear associations between pairs of authoritarian strategies. Table 8 sums up the significant bivariate relations it uncovered. In these concluding lines, I wish to highlight five main points.
First, the core findings of the paper are negative. Of the (9 x 8) / 2 = 36 possible bivariate combinations of authoritarian strategies, almost two thirds do not show any significant linear relationship (23 cells or 63.9 percent of either half, below or above the diagonal, in Table 8). In all these cases, neither the cumulative logic of reinforcement nor the substitutive logic of selection holds consistently across my set of cases. Apparently, with respect to most pairs of strategies, rulers do not face compelling reasons to either combine them or to renounce one when implementing the other. The may go either way and they actually do so. Accordingly, the overall coherence between authoritarian strategies is quite low. Rather than constituting a coherent set of strategies that hang together in law-like fashion, they form an ensemble of options rulers are picking from with considerable discretion. The metaphor of the menu seems quite appropriate, after all, to describe the structure of choice electoral authoritarian rulers face.
Second, among the significant bivariate relations, only the “syndrome of violence,” characterized by the elective affinity of repression and societal warfare, shows negative lineal relationships with other items in the menu of manipulation (highlighted in bold in Table 8). In the presence of either vertical or horizontal violence, legislative elections seem to be more meaningful, more neutral, and more inclusive (as
23

indicated by lower levels of legislative ineffectiveness, vote-seat disproportionality, and legislative exclusion). As it appears, political repression in its harshest form (the violation of human rights) represents an authoritarian strategy that tends to go alone. Some forms of electoral manipulation seem to recede in the face of state-sponsored or societal violence, while others seem unaffected.
Third, among the remaining pairs of strategies, the cumulative logic of mutual reinforcement clearly prevails. All significant relationships others than the ones just reported are positive. Most of these strategic connections reach across the institutional arenas involved. The syndrome of weak accountability (linking ineffective legislatures and unfree media), the syndrome of concurrent fraud (carried out in legislative as well as presidential elections), and the syndrome of covert theft (of presidential fraud going hand in hand with media restrictions) couple the arenas of legislative elections, presidential elections, and public debate. By contrast, the “double disempowerment” of voters (legislative fraud) and deputies (legislative ineffectiveness) as well as the “double exclusion” of parties and candidates from competition (legislative exclusion) and representation (disproportionality) exclusively take place in the arena of legislative elections.
Fourth, authoritarian strategies differ slightly in their degree of connectivity. On one side, the disempowerment of legislatures and disproportionality constitute central nodes in a net of five strategies with strong bilateral connections. Both appear as embedded strategies authoritarian regimes tend to pursue in a cumulative fashion. On the other side, the exclusion of presidential candidates as well as electoral fraud in legislative contests show few systematic associations with other strategies of electoral control. They appear to represent rather isolated strategies regimes tend to employ in a selective manner.
Fifth, overall the scattered pattern of bivariate associations I found seems to confirm the theoretical intuition that electoral authoritarian rulers do not strive to maximize electoral security by accumulating authoritarian measures. Rather, they seem to aim at optimizing electoral security by combining selected strategies of control. Navigating between the risk averse pole of crushing opposition actors with all possible means and the risk tolerant pole of barely controlling them through one single measure, regimes select and combine authoritarian measures, creating focused strategic configurations to keep the electoral game under control without stripping it of all credibility.
Of course, these bivariate explorations of strategies of electoral control constitute no more than a tentative beginning in the comparative research on the internal logic of electoral authoritarian regimes. Three rather obvious tasks are to be tackled in subsequent steps: (a) the task of moving from a (largely) bivariate exploration to multivariate analyses of authoritarian configurations; (b) the task of
24

extending the scope of analysis from the clustering of variables to the clustering of cases; and (c) the challenge of advancing from a topographical analysis of static configurations to a chronological study of sequences of authoritarian measures. Business as usual: some things we have learned, while much research needs to be done still.
25

26
Notes
I thank Alejandro Villarino, Enrique Talavera, and Edgar Moreno for research assistance. Work on this paper was made possible by research grant 36970-D from the Mexican National Council for Science and Technology (Conacyt). The usual disclaimers apply.
1 The present as well as the subsequent section build on a previous piece
(Schedler 2002) that offers a more extensive discussion of both democratic norms and authoritarian norm violations, with illustrative examples from contemporary electoral authoritarian regimes.
2 Population figures are for 2002, the final year in my dataset (United Nations, Department of Economic and social Affairs, Population Division, “Population Estimates and Projections: 2002 Revision,” www.un.org/esa/population/publications/wpp2002/wpp2002annextables.pdf, accessed 13 July 2004).
3 I demand direct popular elections for the chief executive in presidential regimes. In case of parliamentary regimes, I demand direct elections for the legislature that selects and maintains the government. Borderline cases included in the database are Egypt, Pakistan, and Indonesia.
4 The CIRI dataset is similar in sources and coverage to the Political Terror Scale published by Mark Gibney (http://www.unca.edu/politicalscience/faculty-staff/gibney.html). However, thanks to its comprehensive coding book and its systematic tests of inter-coder reliability, CIRI fares better in terms of reliability and replicability. For my purpose, it must be regarded superior in terms of validity too, as it focuses on “vertical” violations of political rights and civil liberties by governmental agencies, excluding “horizontal” violations by societal agents (like insurgent groups). Skaaning (2006) offers a critical review of existing datasets on political rights and civil liberties. For earlier applications of CIRI data, see, among may others, Cingranelli and Richards (1999) and Richards, Gelleny, and Sacko (2001).
5 For most of this paper, my units of analysis are elections. However, whenever I examine the links between my electoral data and annual data from other sources, I accept regime-years as unit of analysis. As a consequences, my total number of observations decreases by the number of concurrent elections (N = 44), since concurrent legislative and presidential elections stop counting as two separate cases.
6 Within my basket of regime-years, CNTS registers nine years of “inexistent” legislatures. These indicate either cases where first legislative elections are held late in the calendar year, or cases where presidential contests inaugurate an electoral regime, with legislative elections following at some later point.
7 I calculated all measures of intercoder reliability reported in this paper with the Program for Reliability Assessment for Multiple Coders (PRAM), Version 0.45, written by Skeymeg Sofware (www.geocities.com/skymegsoftware).
8 I thank Judith Kelly (Eastern Europe), M. Steven Fish (former Soviet Union), Ellen Lust-Okar (Middle East and Northern Africa), Staffan I. Lindberg (Sub-Saharan Africa), and William Case (South and Southeast Asia) for their most valuable expert judgment. For Latin America, rather than exploiting the generosity of knowledgeable colleagues, I compared my scores on electoral fraud with very similar data generated by Jonathan Hartlyn, Jennifer McCoy, and Thomas Mustillo (2003) who study the legitimacy and quality of presidential elections in Latin America in the 1990s (N=25). To assess the democratic quality of elections, Hartlyn et al. evaluate international observer reports, asking whether observers “accept,” “criticize,” or “reject” an electoral process. Assuming their three categories to be roughly equivalent to mine (integrity, irregularities, and fraud), I found almost perfect agreement between our data (93 percent). Our only case of disagreement is the 1993

level of agreement with Staffan Lindberg s (2006) data on the democratic quality of election in Africa is very low (31.3 percent). His evaluations are consistently more critical than mine. Responding to the question whether elections were “essentially judged free and fair,” he registers no case of “entirely” democratic elections, while I classify 19 out of 64 African elections (with each the 14 concurrent elections counting as one) as fundamentally fraud-free (29.7 percent). At the other end, Lindberg finds that in 48 elections “irregularities affected the results” (75 percent), while I put only 14 cases into the analogous category of electoral fraud (21.9 percent).
9 Tellingly, the degree of correspondence between my measure of electoral fraud and the DPI dataset is very low. Within my universe of cases (regime-years), DPI registers 43 instances of fraud and intimidation “serious enough to affect the outcome of elections” while I register 42 instances of decisive fraud. We agree in only 12 of these cases, little more than one quarter of positive observations.
10 With a level of agreement of 81.5 percent, intercoder reliability again reached acceptable levels. Yet, after concluding the coding process, I double-checked my data with the Polity and CNTS measures discussed above. Understanding that my criteria for coding elections as exclusionary were more permissive (more sensitive) than those employed by Polity and CNTS, I left those cases without changes in which I observed the exclusion of opposition actors, while neither Polity nor CNTS did. By contrast, in those cases I had classified as inclusionary, while CNTS coded it otherwise, I adopted the CNTS scores if, and only if, at least one of the Polity categories PARREG and PARCOMP coincided with CNTS. Though this quasi-majoritarian rule of correction, I recoded twelve cases as exclusionary I had originally classified as inclusionary: Panama 1984, Belarus 2001, Kyrgyztan 1991 and 1995, Burkina Faso 1991, Gambia 2001 and 2002, Singapore, 1980, 1984, 1988, 1991, and 1997. Before this corrective step, the degree of agreement between my exclusion data and Polity PARREG, Polity PARCOMP, and CNTS Party Legitimacy lay at 67.8 percent, 60.9 percent, and 67.2 percent, respectively. After the correction, it lay slightly higher, at 71.1 percent, 67.6 percent, and 73.8 percent, respectively.
11 As my database is supposed to include (almost) the whole universe of electoral authoritarian elections, measures of statistical significance may be regarded of limited relevance. Yet, as my set of cases, temporarily circumscribed to the period from 1980 to 2002, still constitutes a small sample from the historical universe of (past and future) authoritarian elections, it seems sensible to follow conventions and weigh results according to their statistical significance.
12 On the notion of political accountability, see Schedler (1999). On horizontal accountability, see O’Donnell (1994 and 1999), on societal accountability, Smulovitz and Peruzzotti (2000), and on electoral accountability, Powell (2000).
13 Given the fact that my cases do not represent a sample, but the universe of authoritarian elections in the time span under review, I will interpret confidence intervals with a slight dose of generosity.

1998): 51–66.
Bratton, Michael and Nicolas van de Walle (1997), Democratic Experiments in Africa: Regime Transitions in Comparative Perspective (Cambridge, UK: Cambridge University Press).
Case, William (2006), “Manipulative Skills: How Do Rulers Control the Electoral Arena?” Electoral Authoritarianism: The Dynamics of Unfree Competition, ed. Andreas Schedler (Boulder and London: Lynne Rienner Publishers), pp. 95–112.
Cingranelli, David L. and David Richards (1999), “Measuring the Level, Pattern, and Sequence of Government Respect for Physical Integrity Rights,” International Studies Quarterly 43: 407–17.
Dahl Robert A. (1971), Polyarchy: Participation and Opposition (New Haven: Yale University Press).
Diamond, Larry (2002), “Elections without Democracy: Thinking About Hybrid Regimes,” Journal of Democracy 13/2 (April): 21–35.
Hartlyn, Jonathan, Jennifer McCoy, and Thomas J. Mustillo (2003), “The ‘Quality of Elections’ in Contemporary Latin America: Issues in Measurement and Explanation,” XXIV International Congress of the Latin American Studies Association (LASA), Dallas, Texas, 27–29 March.
Hermet, Guy, Alain Rouquié, and Juan J. Linz (1978), Elections Without Choice (New York: John Wiley & Sons).
Huntington, Samuel P. (1991), The Third Wave: Democratization in the Late Twentieth Century (Norman, OK: University of Oklahoma Press).
Hyde, Susan Dayton and Emily Beaulieu (2004), “Election Boycotts, Election Observers, and Competition: Do international election observers give parties an incentive to boycott elections?” 100th Annual Meeting of the American Political Science Association (APSA), Chicago, 2–5 September.
Lehoucq, Fabrice E. (2003), “Electoral Fraud: Causes, Types, and Consequences,” Annual Review of Political Science 6: 233–56.
Lindberg, Staffan I. (2006), Democracy and Elections in Africa (Baltimore and London: Johns Hopkins University Press).
Marshall, Monty G., Ted Robert Gurr, and Barbara Harff (2001), “State Failure Problem Set: Internal Wars and Failures of Governance, 1955–2000. Dataset and Coding Guidelines” (Fairfax, VA: George Mason University).
M k G d L d J V k il (2002) “C t li i d M i D

55–69.
–––– (1999), “Horizontal Accountability in New Democracies”, The Self-Restraining State: Power and Accountability in New Democracies, eds. Andreas Schedler, Larry Diamond and Marc F. Plattner (Boulder and London: Lynne Rienner Publishers), pp. 29–51.
Powell, Bingham G. (2000), Elections as Instruments of Democracy: Majoritarian and Proportional Visions (New Haven and London: Yale University Press).
Richards, David L., Ronald D. Gelleny, and David H. Sacko (2001), “Money with a Mean Streak? Foreign Economic Penetration and Government Respect for Human Rights in Developing Countries,” International Studies Quarterly 45: 219–39.
Schedler, Andreas (1999), “Conceptualizing Accountability,” The Self-Restraining State: Power and Accountability in New Democracies, eds. Andreas Schedler, Larry Diamond, and Marc F. Plattner (Boulder and London: Lynne Rienner Publishers, 1999), pp. 13–28.
––– (2002), Elections Without Democracy: The Menu of Manipulation,” Journal of Democracy 13/2 (April 2002): 36–50.
––– (2004), “Degrees and Patterns of Party Competition in Electoral Autocracies,” 100th Annual Meeting of the American Political Science Association (APSA), Chicago, 2–5 September.
––– (2006), “The Logic of Electoral Authoritarianism,” Electoral Authoritarianism: The Dynamics of Unfree Competition, ed. Andreas Schedler (Boulder and London: Lynne Rienner Publishers), pp. 1–23.
Skaaning, Svend-Erik (2006), “Measuring Civil Liberty,” Political Concepts 8 (Working Paper Series of the IPSA Committee on Concepts and Methods), www.concepts-methods.org.
Smulovitz, Catalina, and Enrique Peruzzotti (2000), “Societal Accountability in Latin America”, Journal of Democracy 11/4 (October): 147–58.
Weinberg, Leonard, and Ami Pedahzur (2003), Political Parties and Terrorist Groups (London and New York: Routledge), Routledge Studies in Extremism and Democracy 2.
Valenzuela, J. Samuel (1992), “Democratic Consolidation in Post-Transitional Settings: Notion, Process, and Facilitating Conditions,” in Scott Mainwaring, Guillermo O’Donnell, and J. Samuel Valenzuela, Issues in Democratic Consolidation: The New South American Democracies in Comparative Perspective (Notre Dame: University of Notre Dame Press), 57–104.

Breaking the Chain of Democratic Choice: The Menu of Electoral Control
Dimensions of choice
Normative premises of democratic choice
Strategies of norm violation
1 The object of choice
Empowerment: Democratic elections involve the delegation of decision-making authority.
– Reserved positions: limiting the scope of elective offices.
– Reserved domains: limiting the jurisdiction of elective offices.
2 The range of choice
Freedom of supply: Citizens must be free to form, join, and support conflicting parties, candidates, and policies.
– Exclusion of opposition actors: restricting access to electoral arena.
– Fragmentation of opposition actors: disorganizing electoral dissidence.
3 The formation of preferences
Freedom of demand: To learn about available alternatives, citizens need access to alternative sources of information.
– Repression: restricting political and civil liberties.
– Unfairness: restricting access to media and money.
4 The agents of choice
Inclusion: Democracy assigns equal rights of participation to all full members of the political community.
– Formal disenfranchisement: legal suffrage restrictions.
– Informal disenfranchisement: practical suffrage restrictions.
5 The expression of preferences
Insulation: Citizens must be free to express their electoral preferences.
– Coercion: voter intimidation. – Corruption: vote buying.
6 The aggregation of preferences
Integrity: One person, one vote. The democratic ideal of equality demands weighting votes equally.
– Electoral fraud: “redistributive” election management.
– Institutional bias: “redistributive” electoral rules.
7 The consequences of choice
Decisiveness: Elections without consequences do not qualify as democratic.
– Tutelage: preventing elected officers from exercising their constitutional powers.
– Reversion: preventing victors from taking office, or elected officers from concluding their constitutional terms.
Source: Schedler (2002), with light revisions.
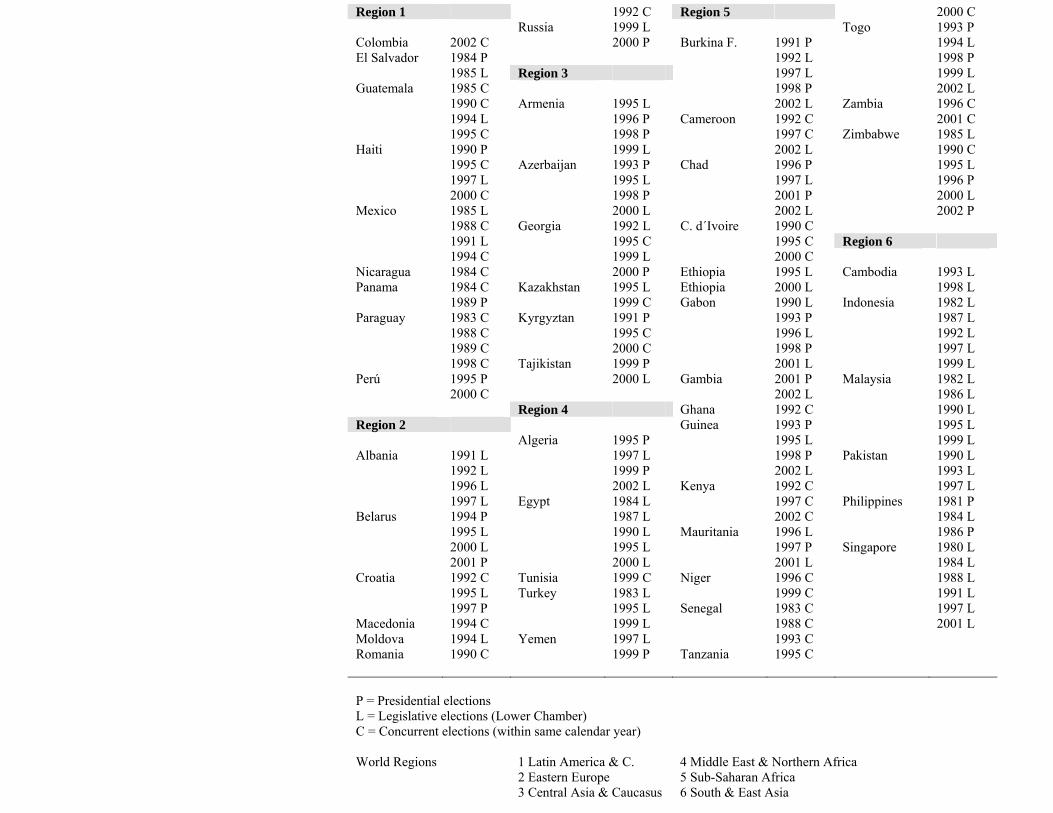
Region 1 1992 C Region 5 2000 C Russia 1999 L Togo 1993 P Colombia 2002 C 2000 P Burkina F. 1991 P 1994 L El Salvador 1984 P 1992 L 1998 P 1985 L Region 3 1997 L 1999 L Guatemala 1985 C 1998 P 2002 L 1990 C Armenia 1995 L 2002 L Zambia 1996 C 1994 L 1996 P Cameroon 1992 C 2001 C 1995 C 1998 P 1997 C Zimbabwe 1985 L Haiti 1990 P 1999 L 2002 L 1990 C 1995 C Azerbaijan 1993 P Chad 1996 P 1995 L 1997 L 1995 L 1997 L 1996 P 2000 C 1998 P 2001 P 2000 L Mexico 1985 L 2000 L 2002 L 2002 P 1988 C Georgia 1992 L C. d´Ivoire 1990 C 1991 L 1995 C 1995 C Region 6 1994 C 1999 L 2000 C Nicaragua 1984 C 2000 P Ethiopia 1995 L Cambodia 1993 L Panama 1984 C Kazakhstan 1995 L Ethiopia 2000 L 1998 L 1989 P 1999 C Gabon 1990 L Indonesia 1982 L Paraguay 1983 C Kyrgyztan 1991 P 1993 P 1987 L 1988 C 1995 C 1996 L 1992 L 1989 C 2000 C 1998 P 1997 L 1998 C Tajikistan 1999 P 2001 L 1999 L Perú 1995 P 2000 L Gambia 2001 P Malaysia 1982 L 2000 C 2002 L 1986 L Region 4 Ghana 1992 C 1990 L Region 2 Guinea 1993 P 1995 L Algeria 1995 P 1995 L 1999 L Albania 1991 L 1997 L 1998 P Pakistan 1990 L 1992 L 1999 P 2002 L 1993 L 1996 L 2002 L Kenya 1992 C 1997 L 1997 L Egypt 1984 L 1997 C Philippines 1981 P Belarus 1994 P 1987 L 2002 C 1984 L 1995 L 1990 L Mauritania 1996 L 1986 P 2000 L 1995 L 1997 P Singapore 1980 L 2001 P 2000 L 2001 L 1984 L Croatia 1992 C Tunisia 1999 C Niger 1996 C 1988 L 1995 L Turkey 1983 L 1999 C 1991 L 1997 P 1995 L Senegal 1983 C 1997 L Macedonia 1994 C 1999 L 1988 C 2001 L Moldova 1994 L Yemen 1997 L 1993 C Romania 1990 C 1999 P Tanzania 1995 C P = Presidential elections L = Legislative elections (Lower Chamber) C = Concurrent elections (within same calendar year) World Regions 1 Latin America & C. 4 Middle East & Northern Africa 2 Eastern Europe 5 Sub-Saharan Africa 3 Central Asia & Caucasus 6 South & East Asia

Legislative
Elections Presidential
Elections Total %
1 Latin America & Caribbean 20 19 39 19.5 2 Eastern Europe 13 8 21 10.5 3 Central Asia & Caucasus 12 11 23 11.5 4 Northern Africa & Middle East 12 4 16 8.0 5 Sub-Saharan Africa 42 33 74 37.0 6 South & East Asia 23 3 26 13.0 Total 122 78 200 100.0
Source: Author’s Database on Authoritarian Elections in the World.

Strategies of norm violation
Level of measurement
Categories Source Variable name
Repression
Violation of physical integrity (extrajudicial killings, disappearance, torture, and political imprisonment) (personal integrity)
Ordinal Range 0–8
0 = full respect for basic human rights8 = gross violation of basic human rights
Cingranelli-Richards (CIRI) Human Rights Data Project: Physical Integrity Rights Index (inverted)
http://ciri.binghampton.edu
VIOLINT
Restrictions on freedom of speech and mass media (civil liberties)
Ordinal Range 1–3
CIRI (recoded):
1 = No violations 2 = Some violations 3 = Frequent violations
FH:
1 = Free press 2 = Partly free 3 = Not free
Arithmetic mean of CIRI Freedom of Speech and Press (inverted) and FH Press Freedom (author calculation)
http://ciri.binghampton.edu www.freedomhouse.org
VIOLMED
Legislative weakness
Reserved domains: Limiting the jurisdiction of elective offices through weak legislatures (legislative disempowerment)
Ordinal 0 Effective legislature
1 Partially effective legislature
2 Ineffective (“rubber stamp”) legislature
Tony Banks Cross-National Time-Series (CNTS) Data Archive, Legislative Effectiveness, variable s22F4 (inverted scale)
http://www.databanks.sitehosting.net/
LEGWEAK
Institutional bias
Redistributive electoral rules: Vote-seat disproportionality (proxy)
Ratio Loosemore-Hanby Disproportionality Index: ∑|Vi – Si| / 2
Author’s Database on Authoritarian Elections in the World (1980–2002).
DISPRO

management (at either legislative or presidential elections)
1 Irregularities2 Fraud
Authoritarian Elections in the World (1980–2002).
Legislative fraud
FRAUDPRE: Presidential fraud
Exclusion
Exclusion of parties and candidates from electoral competition (at either legislative or presidential elections)
Nominal 0 Openness 1 Exclusion
Author’s Database on Authoritarian Elections in the World (1980–2002).
EXCLEG: Legislative Exclusion
EXCPRE: Presidential exclusion
Societal warfare
Magnitude of societal warfare
interval Range 0–4 (continuous) Sum of average magnitudes of revolutionary and ethnic wars (author calculation)
State Failure Dataset, Political Instability Task Force, Internal Wars and Failures of Governance, George Mason University (Marshall, Gurr, and Harff)
http://globalpolicy.gmu.edu/pitf/index.htm
CIVILWAR

Variables and categories Frequencies Percentages
Violations of Physical Integrity
0 2 1,3 1 11 7,1 2 17 11,0 3 24 15,6 4 32 20,8 5 16 10,4 6 24 15,6 7 18 11,7 8 10 6,5 Total 154 100,0 Violations of press freedom
1,0 1 0,6 1,5 11 7,1 2,0 51 32,9 2,5 64 41,3 3,0 28 18,1 Total 155 100,0 Legislative weakness
Effective legislature 3 1,9 Partially effective legislature 71 45,8 Ineffective legislature 72 46,5 Inexistent legislature 9 5,8 Total 155 100,0 Disproportionality (N = 88) Mean 16,81 Maximum 44,78 Minimum 1,58 Standard Deviation 9,27 Legislative fraud
No fraud 37 30,3 Irregularities 58 47,5 Fraud 27 22,1 Total 122 100,0

Irregularities 33 42,3Fraud 26 33,3 Total 78 100,0 Legislative exclusion
Inclusion 65 53,3 Exclusión 57 46,7 Total 122 100,0 Presidential exclusion
Inclusión 48 61,5 Exclusión 30 38,5 Total 78 100,0 Civil War
0 108 75,0 1 1 ,7 1,5 10 6,9 2 2 1,4 2,5 10 6,9 3 9 6,3 3,5 4 2,8 Total 144 100,0
Source: Author’s Database on Authoritarian Elections (1980–2002).

Variables / Components Factor 1 Factor 2 Factor 3
Legislative fraud -,066 ,792 -,141Legislative ineffectiveness -,085 ,607 ,622Violations of press freedom -,006 -,197 ,897Disproportionality -,579 -,528 ,025Violations of physical integrity ,871 ,091 -,021Societal war ,824 -,321 -,027
* Rotated principal component analysis with four iterations (Varimax rotation with Kaiser Normalization). Matrix shows factors with Eigenvalues > 1.
Source: Author’s Database on Authoritarian Elections (1980–2002).
Table 7 Underlying Factors to the Authoritarian Control of Presidential Elections*
Variables / Components Factor 1 Factor 2
Presidential fraud -,140 ,663Violations of press freedom ,177 ,785Violations of physical integrity ,887 ,181Societal war ,868 -,166
* Rotated principal component analysis with three iterations (Varimax rotation with Kaiser Normalization). Matrix shows factors with Eigenvalues > 1.
Source: Author’s Database on Authoritarian Elections (1980–2002).

Table 8 Summary of Linear Bivariate Associations among Strategies of Authoritarian Control
VIOLINT CIVILWAR LEGWEAK VIOLMED DISPRO EXCLEG EXCPRE FRAUDLEG FRAUDPRE
VIOLINT … positive negative negative
CIVILWAR positive … negative
LEGWEAK negative … positive positive positive
VIOLMED positive … positive positive
DISPRO negative … positive positive positive
EXCLEG negative positive positive …
EXCPRE positive positive …
FRAUDLEG positive … positive
FRAUDPRE positive positive positive …
VIOLINT Violations of physical integrity CIVILWAR Societal warfare LEGWEAK Legislative weakness VIOLMED Violations of media freedom DISPRO Vote-seat disproportionality EXCLEG Exclusion from legislative elections EXCPRE Exclusion from presidential elections FRAUDLEG Fraud in legislative elections FRAUDPRE Fraud in presidential elections

Appendix B: Figures
Figure 1 Patterns of association between strategies of authoritarian control
Vote -seat disproportionality
Violations of physical integrity
Presidential fraud
Societal war
Legislative weakness
Violations of media freedom
Legislative fraud
r = .53**N = 142
r = -.37**N = 87
r = .42*N = 32
r = .91**N = 44
r = -.2*N = 143
r = .25**N = 154
N Number of cases r Bivariate Pearson correlation coefficients * p ≤ .05 ** p ≤ .01
Source: Author’s Database on Authoritarian Elections (1980–2002).

Figure 2 The Menu of Authoritarian Strategies and the Exclusion of Opposition from Legislative and Presidential Elections:Comparisons of Means with Confidence Intervals at .95
Inclusion Exclusion
Legislative exclusion
3,5
4,0
4,5
5,0
Viol
atio
ns o
f phy
sica
l int
egrit
y
Inclusion Exclusion
Presidential exclusion
3,5
4,0
4,5
5,0
Viol
atio
ns o
f phy
sica
l int
egrit
y
Inclusion Exclusion
Legislative exclusion
0,4
0,6
0,8
Soci
etal
war
Inclusion Exclusion
Presidential exclusion
0,2
0,4
0,6
0,8
1,0
Soci
etal
war
Inclusion Exclusion
Legislative exclusion
2,1
2,2
2,3
2,4
2,5
2,6
Viol
atio
ns o
f pre
ss fr
eedo
m
Inclusion Exclusion
Presidential exclusion
2,1
2,2
2,3
2,4
2,5
Viol
atio
ns o
f pre
ss fr
eedo
m

Figure 2 continued:
Inclusion Exclusion
Legislative exclusion
0,7
0,8
0,9
1,0
1,1
Legi
slat
ive
frau
d
Inclusion Exclusion
Presidential exclusion
0,8
1,0
1,2
1,4
Pres
iden
tial f
raud
Inclusion Exclusion
Legislative exclusion
1,3
1,4
1,5
1,6
Legi
slat
ive
inef
fect
iven
ess
Inclusion Exclusion
Presidential exclusion
1,4
1,6
1,8
2,0
Legi
slat
ive
inef
fect
iven
ess
Inclusion Exclusion
Legislative exclusion
12,50
15,00
17,50
20,00
22,50
Dis
prop
ortio
nalit
y
Inclusion Exclusion
Presidential exclusion
10,00
20,00
30,00
Dis
prop
ortio
nalit
y
Source: Author’s Database on Authoritarian Elections (1980–2002).
41

Appendix C: Coding Rules
EXCLUSION OF OPPOSITION ACTORS
General definition
Exclusion is defined as formal exclusion from electoral participation (through constitutional provisions, legal rules, or administrative practices) of active parties and candidates.
Examples: Denial of registry on political or administrative grounds. Ad hominem rules of candidacy that exclude prominent opposition actors.
Rules of exclusion
Exclusion of latent actors ≠ exclusion: We register exclusion of actors who are already established and active on the political scene. Formal rules banning political parties that mobilize certain cleavages (like region, religion, or ethnicity) do not count as exclusion as long as they are successful in preventing the formation of such parties. Example: the constitutional ban on regional or religious parties in Mexico.
Exclusion of incumbents ≠ exclusion: Exclusion is assumed to be a strategy of ruling parties. Bans on sitting presidents from re-election thus do not count as exclusion (as in 1992 in Paraguay, when a fraction of the ruling Colorado party allied with the opposition to introduce a constitutional ban on re-election, to prevent President Andrés Rodríguez from running again).
Exclusion of violent actors ≠ exclusion: The exclusion of violent actors may be regarded legitimate from a democratic point of view. To register exclusionary strategies on behalf of authoritarian actors, bans on violent actors, like former coup mongers, guerrilla organizations, regional warlords, and violent secessionist movements, are not coded as exclusion. Example: In 1990 in Guatemala, neither the military veto to left-wing guerrilla participation, nor the legal barring of former dictator Rios Montt are counted as exclusion.
Exclusion of authoritarian predecessors = exclusion: By contrast, the exclusion of members of the former authoritarian regime is counted as exclusion, unless they openly resort to violence. Example: the banning members of the Duvalier regime in the 1990 elections in Haiti.
Exclusion by intimidation ≠ exclusion: The withdrawal of parties or their refusal to register candidacies because of intimidation and fear (deterrence) does not count as exclusion (if explicit, such “voluntary” non-participation counts as boycott; otherwise it should show up in repression data).
Exclusion (assassination) by violent actors ≠ exclusion: As our category of exclusion registers the exclusion of opposition actors by regime actors (or their agents), the assassination of presidential or legislative candidates by violent opposition actors does not count as exclusion. For example, the murder of presidential candidate Abdelmajid Benhadid by islamists in Algeria’s 1995 presidential election.
Open replacement ≠ exclusion
Bans on parties do not count as exclusion if successor parties take the place of excluded parties, under different names yet similar programs. The same holds for allied personalities taking the place of excluded candidates. Citizens recognize successors as reliable representatives of excluded actors.

Examples: Greek Albanians in 1992. Ghana in 1992: although pre-1981 parties are formally banned, their representatives nevertheless participate in the elections. Turkey between 1988 and 2001, going through a succession of moderate Islamic parties: Welfare Party banned in 1998, replaced by Virtue Party for 1999 elections; Virtue Party banned in 2001, replaced by Justice and Development Party for 2002 elections. Effraín Ríos Montt in Guatemala and Lino Oviedo in Paraguay: being banned from the presidential contests, both succeeded in placing allies in the presidency.
Ironic applications in 1990 Romania: Opposition parties demand that the communist party to be banned and that the ruling NSF to abstain from participating in the elections. The NSF, which is perceived as veiled communist continuity, bans communists. As the NSF may count as communist successor party, the (transient) ban on the PC is not counted as exclusion.
Similarly, banning some parties representing certain interests or constituencies, while admitting others representing the same interests or constituencies, does not count as exclusion. Example: Turkey 1999: the Supreme Court dissolves the Democratic Party of the Masses, a moderate pro-Kurdish party, while the pro-Kurdish People's Democracy Party was able to take part in the election.
Note, however, that this rule of exception does not apply to candidates (or potential candidates) in presidential contests. Persons are taken to be irreplaceable. For example: The assassination of Georgian opposition leader Gula Chanturia in 1994 counts as exclusion (for the 1995 concurrent elections), even if his wife succeeded him in the presidency of his National Democratic Party.
Exclusion from legislative elections: The binary category fits presidential elections better than legislative elections. In legislative elections, the widespread exclusion of “uncomfortable” individual candidates as well as the wholesale exclusion of parties qualify as exclusion. Barring party leaders from legislative contests is not coded as exclusion, as in Cote d’Ivoire 1995.
ELECTORAL FRAUD
General definition
We define electoral fraud in a narrow manner as the manipulation of electoral administration for partisan advantage. It may take place at any stage of the electoral process (pre-electoral fraud, election-day fraud, and post-electoral fraud):
– Voter registration and voter identification. – Preparation: distribution and location of polling places, appointment of
polling station personnel, design, procurement and distribution of polling material.
– Polling: Access to polling stations, voting procedures, secrecy and integrity, polling observation.
– Counting and vote tabulation.
No fraud: No reports on irregularities or fraud. The occurrence of just “minor irregularities,” inevitable in any electoral process, is discounted, too, and coded as absence of fraud.
Irregularities: Sporadic and unsystematic, yet not irrelevant, irregularities, be they administrative or partisan in origin.
Fraud: Widespread and systematic partisan interference with the organization of elections, which may or may not affect electoral results.
43

Specific coding rules
The scale and impact of fraud
The category of fraud involves all instances in which election fraud is reported to be widespread and systematic. Large-scale fraud counts as fraud, even if it did not affect outcomes. Small-scale fraud counts as fraud if it may have affected outcomes in close races. Thus, the category of “fraud” includes big fraud regardless of impact as well as decisive fraud regardless of scale.
Descriptions of election victories as “overwhelming” and “convincing” (as in Georgia’s 1992 presidential elections) suggest that that fraud had not been a decisive factor. In such cases, fraud augments margins of victory without affecting the identity of the victor. It is still coded as fraud (as in Georgia’s 2000 presidential elections).
In their elections reports, observers usually conflate two issues one would ideally like to keep apart: (a) the extent of manipulation by ruling parties and (b) the impact of manipulation by ruling parties. If opposition parties are weak, large-scale fraud may do little to alter results; if they are strong, minor alterations may be sufficient for incumbents to steal an election. Estimating the impact of electoral manipulation on election outcomes commonly is a complex and contested enterprise, as it depends on counterfactual judgments (what would have happened in the absence of fraud).
We take electoral manipulation to bear a “decisive” impact on results under the following conditions: (a) in legislative elections, when opposition parties would have won a majority or blocking minority in the legislature, and (b) in presidential elections, when the winner would have failed to win either the first or the second round of the contest.
“Numerous” and “widespread” irregularities = fraud: Election observers often consciously employ ambiguous language which calls for difficult judgments. For instance, the “numerous instances of manipulation of the poll” in 1992 Albania are coded as irregularities, while the “widespread electoral malpractice” in 1996 Albania is counted as fraud. The semantic distance between “numerous” and “widespread” instances of manipulation seems small enough, though.
Conflicting observer judgments
We treat cases of diverging judgments among observers and parties as well as between them in a similar fashion as described above, by weighing and averaging judgments (in some rough, judgmental way).
Examples of such contradictions that require difficult 2nd-order judgments (judgments on judgments): In the 2001 presidential elections in Chad, observers deliver “positive reports,” while the opposition alleges “massive fraud.” In the 1993 presidential elections in Gabon, citizens take to rioting and violent attacks against international observers who had issued benevolent judgments on the election. These cases call out for second-order judgments (judgments on judgments). We group them, salomonically, in the intermediate category of “irregularities.”
Judicial remedies
If competent authorities order repeat elections due to allegations of fraud, without further complaints of fraud, not coded as fraud (or irregularity). To the extent that vote rigging is corrected by competent authorities (judicial recourse), it does not count as fraud. Example: In Egypt’s 1995 legislative election, courts invalidate the election of 200 deputies due to “widespread irregularities.” Thus, the election is not coded as fraudulent, but as affected by “irregularities” (assuming they extended
44

beyond the constituencies in which the courts ordered repeat elections). Here, as often, judicial remedies may be assumed to be partial.
Of course, judges may intervene in favour authoritarian rulers, rather than upholding democratic rights. For instance, in the 1994 legislative elections in Togo, alleging “opposition fraud” courts ordered repeat elections for three constituencies that were crucial for the opposition to achieve majority in the 81-member assembly. As a result of the repeat elections, the opposition lost its prospective majority. Since international observers were complacent, we coded the election as a case of “irregularities.”
N-round elections: one fraudulent round = fraud. An election is coded as fraudulent if fraud is present at any stage of the election. For instance, if ballot rigging seems decisive in the first round of presidential elections, but not in the second round (as in 2000 in Russia), the election is still coded as fraudulent.
45